1. Introduction
Climate warming, environmental pollution, and energy crises are challenges faced globally. Carbon Emission Trading Policy (CETP), as a market-oriented means of environmental regulation, has become one of the key strategies for governments to deal with global warming and achieve carbon peaking and neutrality goals [
1]. Since the end of the 20th century, CEPT has been established worldwide. By introducing the CETP, enterprises are encouraged to seek low-carbon development paths, thus promoting the sustainable development of the whole society [
1]. China, one of the world’s largest carbon-emitting countries, has made remarkable progress in constructing the CEPT in recent years. As an important domestic economic region, CEPT’s implementation effect and mechanism in the Pearl River–West River Economic Belt (PRWREB) are significant for understanding the national and even global carbon emission reduction process. CEPT is a market-based environmental policy tool encouraging companies to reduce their greenhouse gas emissions by establishing a market for carbon emission allowances [
1]. A market-based approach to pollution control incentivizes companies to reduce emissions by setting a cap on emissions for a certain period and allowing the buying and selling of emission rights within that cap [
2]. The CEPT participants may include governments, businesses, and non-governmental organizations, which can participate by buying or selling emission rights [
3]. With the rapid progress of industrialization and urbanization in China, the demand for energy continues to grow, and reducing pollution is arduous. Given the “common source of carbon and pollution” and the close association between the “Beautiful China” initiative and the “dual carbon” goals, it is urgent to advance pollution and carbon reduction in a coordinated manner. China’s 14th Five-year Plan and the “Implementation Plan for Synergistic Efficiency in Pollution and Carbon Reduction” emphasize the synergistic improvement of pollution and carbon reduction. However, between 2015 and 2019, only 31% of 335 prefecture-level and above cities in China achieved coordinated pollution and carbon reduction, prompting deep reflection on synergistic emission reductions. Regarding regional coordination, taking carbon reduction actions while improving environmental quality and strengthening regional cooperation can enhance overall emission reduction effects. In terms of goal coordination, it is projected that by 2060, the average concentration of PM
2.5 in China will reach 10 µg/m³, with 80% of this effort driven by “dual carbon” policies [
4,
5]. The “Opinions on Deepening the Battle Against Pollution” also indicates that advancing pollution and carbon reduction in a coordinated manner requires full use of market-based mechanisms. Among these, CEPT, which can control the total carbon emissions and is incentivizing, is an important means to achieve the “dual carbon” goals and is more suitable for China’s long-term development [
6].
CEPT is based on the theories of externality, Coase theorem, and Dales’ emission trading theory, internalizing external costs and directly or indirectly achieving carbon reduction. It has garnered significant attention due to its flexibility, low post-implementation reduction costs, and overall effectiveness in emission reduction. As the policy’s implementation progresses, research on the CEPT has evolved from qualitative theoretical analyses, such as mechanism design [
7], and policy comparison to quantitative studies [
8], including policy evaluation [
9] and mechanism analysis [
10]. Early research focused on the singular impact of CEPT on CO
2 or atmospheric pollutant reduction, reaching some consensus: CEPT can significantly reduce carbon emissions [
11] and carbon intensity [
12] in pilot areas. However, due to differences in economic development levels, industrial structure, and policy execution efficiency, there is heterogeneity in the carbon reduction effects of pilot programs [
13], offering a new perspective for formulating and evaluating climate change and environmental governance policies. The concept of synergistic effects was proposed by Ayres et al. and later introduced into the IPCC assessment reports, indicating that emission reduction measures often generate widespread positive impacts. Existing studies explore CEPT’s synergistic emission reduction effects on pollution and carbon reduction using methods like panel regression and Difference-in-Differences (DID), mainly reflected in the synergy between SO
2 and CO
2. However, there is regional heterogeneity [
14]. It also involves the synergistic reduction of PM
2.5 [
15], smoke and dust [
16], and solid waste [
17], but consistent conclusions have yet to be reached. As research deepens, scholars have gradually focused on pollution and carbon reduction mechanisms [
18], including energy structure, industrial structure, and technological innovation. On the path to achieving the “dual carbon” goals, the construction [
19], greenspace [
20], and electric vehicle industries [
21] have demonstrated highly cost-effective potential for emission reduction on the demand side. In the construction sector, reasonable planning for the scale of new construction and optimization of existing buildings’ use is vital for sustainable development. Research on the carbon intensity of building operations also lays a solid foundation for emission reduction strategies [
19]. In electric vehicles, charging demand and carbon emissions are evaluated through means such as bottom-up charging demand models, and the differences among regions and vehicle models are analyzed, thus pointing out the direction for reducing carbon emissions [
21,
22]. Given this, the number of electric vehicles should be considered during the CEPT’s implementation process, with particular attention paid to the diversity of collaborative goals and the heterogeneity among regions.
As a key instrument in achieving the global “dual carbon” goals, CEPT has gradually demonstrated its effectiveness in reducing pollution and carbon emissions in China. In economically developed regions such as the Yangtze River Delta [
23], Yellow River Basin [
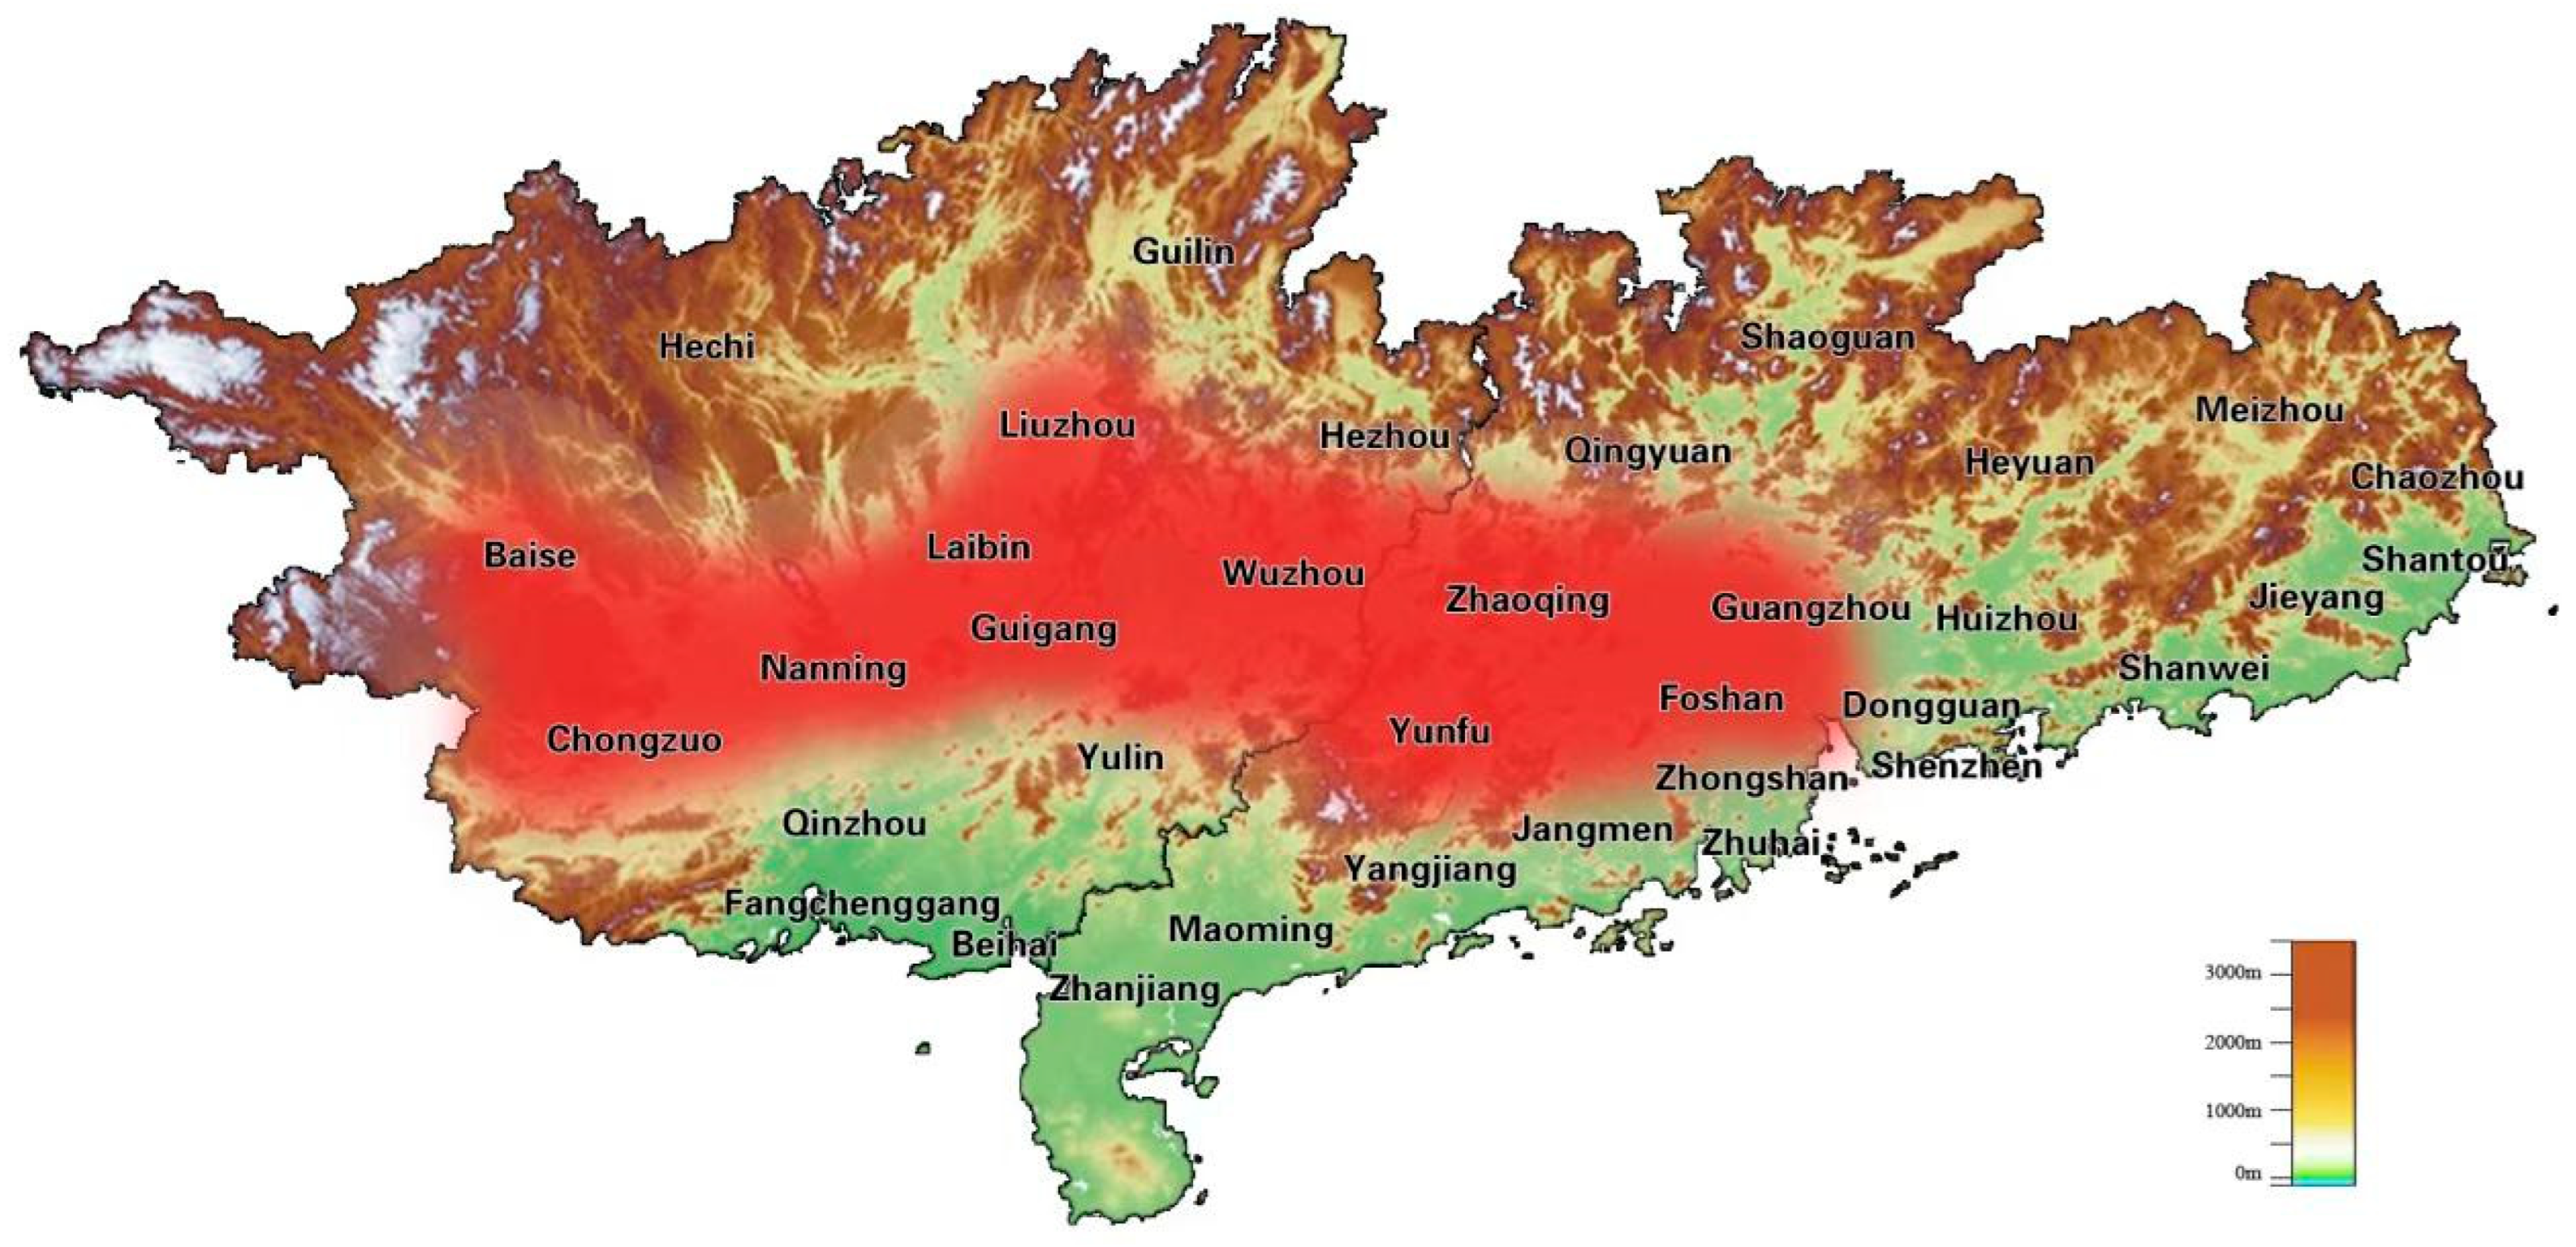
24], and the Pearl River Delta, the carbon trading system is relatively mature, and its policy is analyzed. In contrast, the Pearl River–West River Economic Belt (PRWREB) exhibits significant differences in policy frameworks, industrial structure, and resource endowment, with economically developed cities like Guangzhou and resource-scarce areas like the Guangxi West River Baise [
25]. These complex regional characteristics challenge the development and stability of clean energy supply while also exacerbating disparities in carbon and pollutant emissions, increasing the difficulty of coordinating regional emission reductions. The differences in economic development levels, energy structures, and policy responses among cities mean that CPT in the PRWREB requires an integrated approach to coordinate policy support, technological innovation, and regional synergies. First, this region is at a critical stage of industrial transformation and economic coordination, urgently needing CEPT to incentivize multi-level market mechanisms and policy levers to address the disconnect between clean energy supply and pollution and carbon reduction efforts. Second, due to its unique regional characteristics, the PRWREB is a key region for achieving national “dual carbon” goals and an ideal testing ground for studying the implementation effects of multi-level CEPT. Unlike market-driven regions such as the Yangtze River Delta and Beijing–Tianjin–Hebei, the carbon reduction pathway in the PRWREB should consider regional heterogeneity and explore how policy spillover effects can promote coordinated emission reductions in pilot and non-pilot regions. Finally, in 2020, Guangdong and Guangxi within the economic belt achieved moderate and high levels of synergy in pollution and carbon reduction, respectively, indicating that policy coordination effects in the region have begun to emerge [
26,
27]. However, research on the spillover effects of policies in non-pilot areas within this region remains insufficient, highlighting the need to explore further the emission reduction effects of CEPT inside and outside pilot areas [
28,
29].
In summary, regarding the pollution reduction and carbon emission reduction issues of the CEPT, in terms of goal coordination, more attention is paid to the relationship between individual pollutants and carbon emissions, and there is a large controversy over the conclusions of emission reduction coordination. The research on comprehensive coordination relationships needs to be more comprehensive, which restricts the precise implementation of the policy. Regarding regional coordination, more research needs to be carried out on spatial spillover effects. Regional differences are ignored, and it is difficult to formulate differential policies, thus affecting the effectiveness of regional coordinated emission reduction. Although the action mechanism pays attention to pollution reduction and carbon emission reduction, it lacks the heterogeneity analysis of the “pollution reduction” and “carbon emission reduction” mechanisms, making it difficult to grasp the optimization path of key nodes and hindering the improvement of policy effectiveness. Given this, this research has three aspects of marginal contributions. Firstly, this study analyzes the CETP’s impact from multiple perspectives. Starting from the dual perspectives of goal and regional coordination, it deeply explores its spatial spillover effects in the PRWREB pilot and non-pilot regions, stimulates multi-level market mechanisms and policy levers, and provides theoretical and practical guidance for regionally coordinated emission reduction. Secondly, this study deeply analyzes the heterogeneity of implementation effects. Starting from the regional and “pollution reduction” and “carbon emission reduction” dimensions, it improves the precision and effectiveness of the policy and promotes regional coordinated development and precise emission reduction. Thirdly, this paper systematically examines the action mechanism of the whole process. From “source prevention” to “end treatment”, it analyzes the policy’s direct and indirect action mechanisms for pollution and carbon emission reduction, helps grasp the policy’s differential emission reduction path comprehensively, and optimizes the policy design.
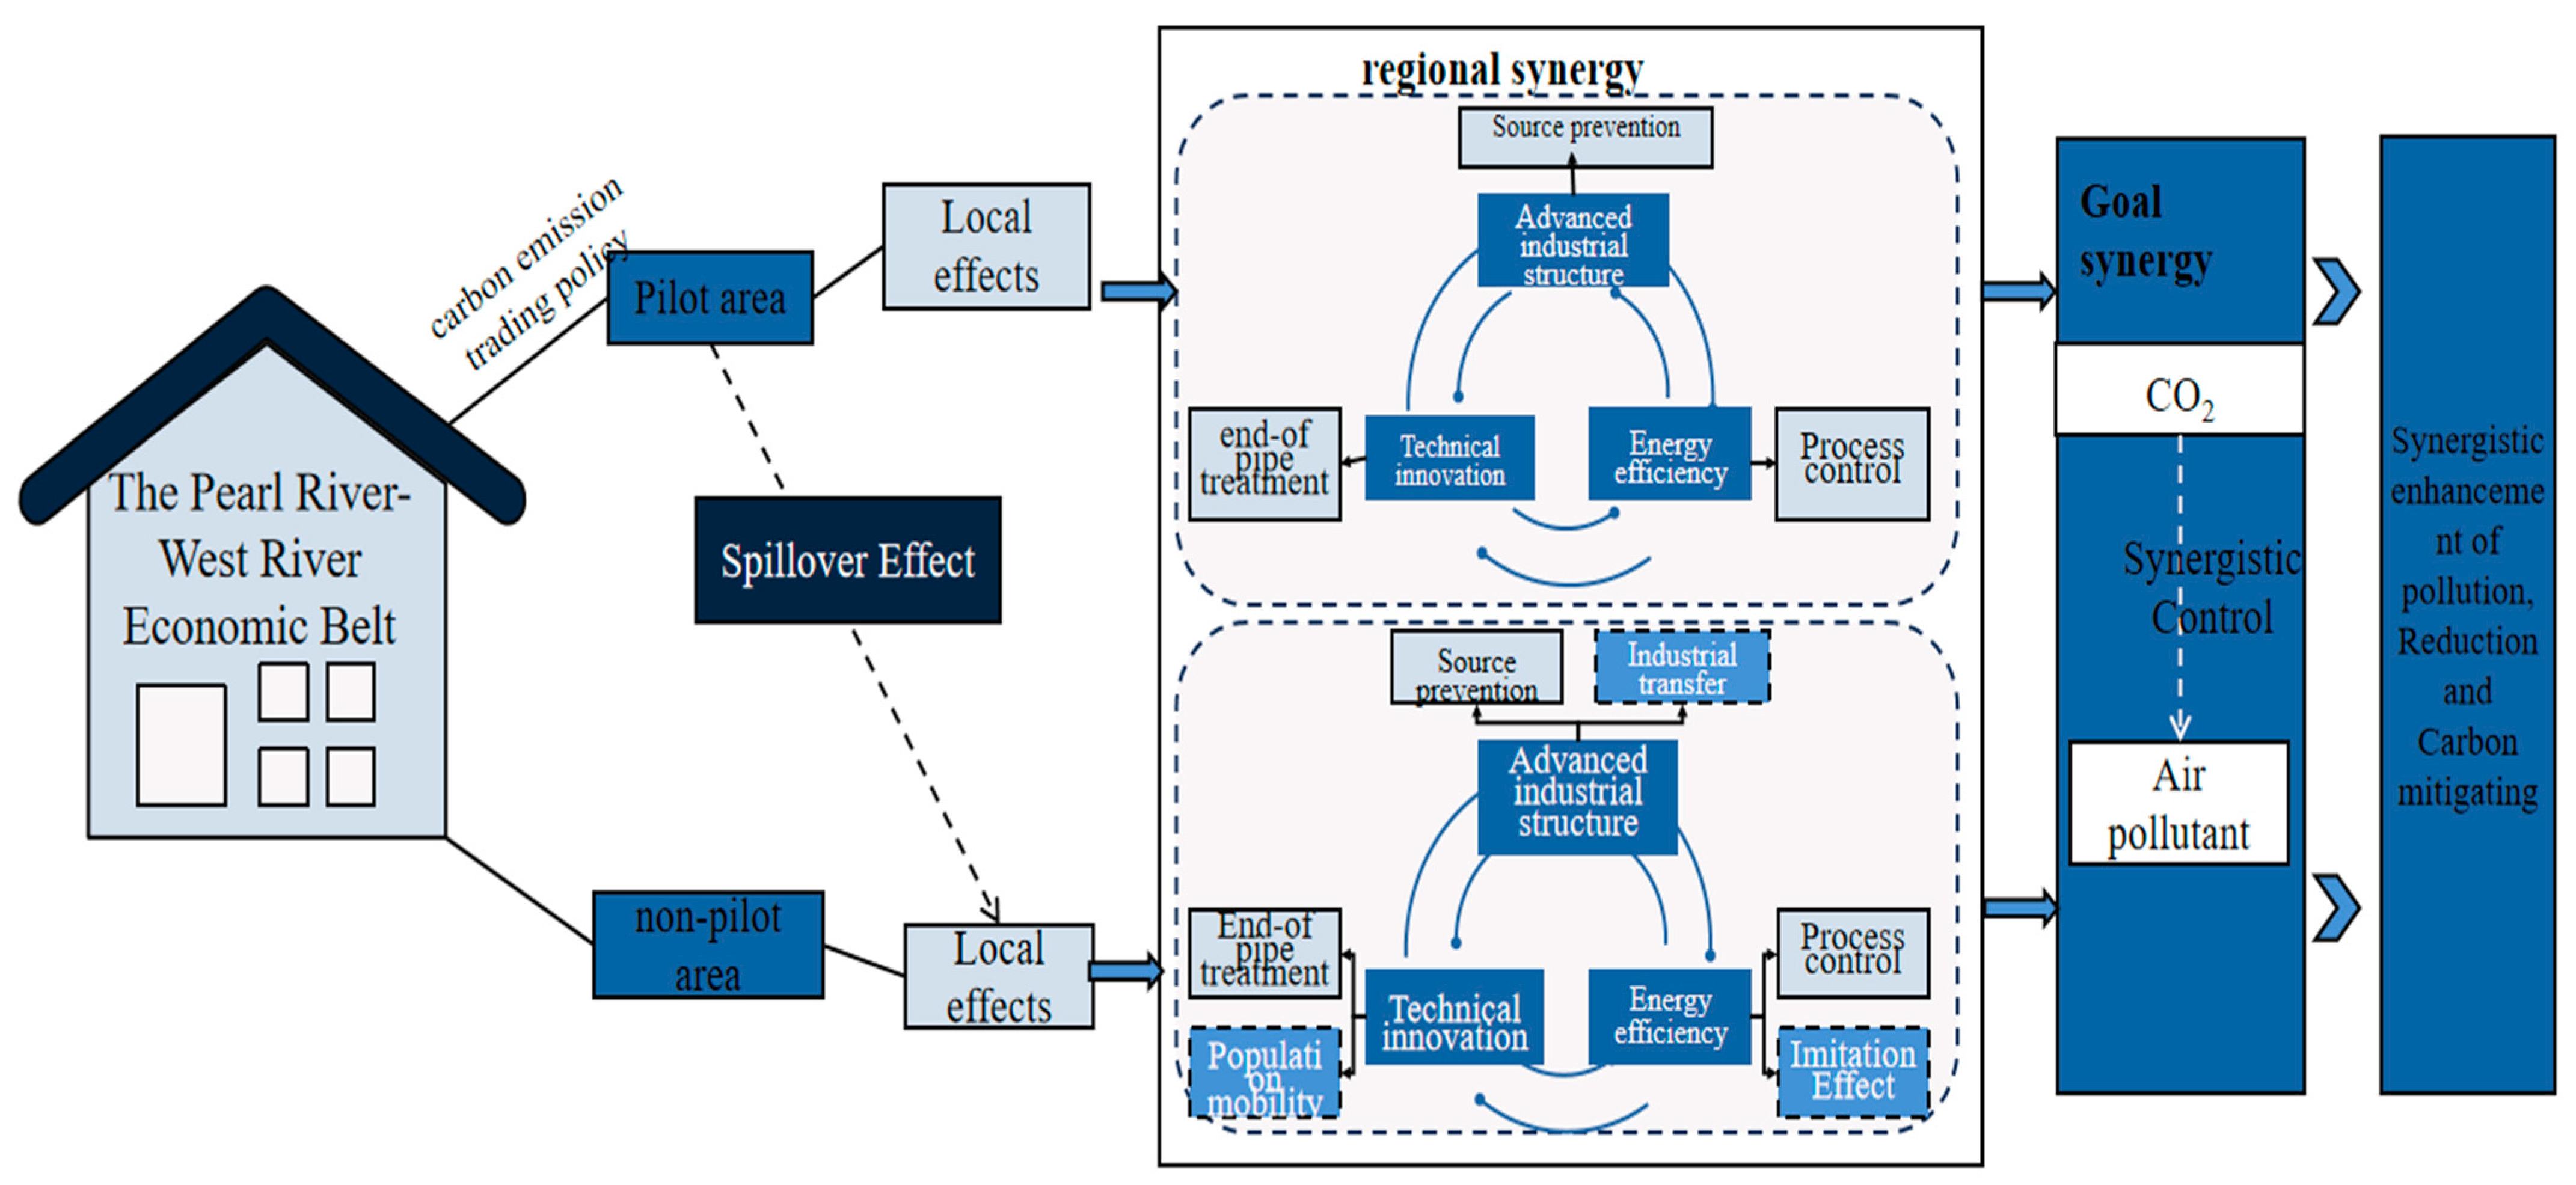
2. CEPT Policy Impact Mechanism
The CEPT originates from Coase’s property rights theory. If property rights can be clearly defined and the transaction cost is zero, the market can achieve the Pareto optimality of resource allocation through free transactions. Under the influence of the Coase theorem, the CEPT has been widely applied to solve the problem of environmental externalities. Multiple studies have already shown that the CEPT significantly affects carbon emission reduction [
1]. Given that carbon and pollution have the same origin, the research believes that the CEPT can not only “reduce carbon” but “reduce pollution”, that is, achieve the synergy of pollution reduction and carbon emission reduction in the pilot areas [
14,
15]. To further verify this, Hypothesis 1 is proposed. According to the polarization-trickle-down effect theory and the first law of geography, the role of resource elements will not be limited to the geographical area where they are originally located but will generate spillover effects on surrounding areas [
30,
31]. On the one hand, resource elements will play a scale effect due to agglomeration and appreciate and expand in the original area, forming a “polarization effect”, which enhances the radiation and driving force of the original area. On the other hand, resource elements will also permeate and diffuse into surrounding areas, forming a “trickle-down effect” so that the development dividends of the original area can benefit the surrounding areas [
32,
33]. The research uses the spatial spillover effect in econometrics to represent the “trickle-down effect”. Specifically, with the gradual progress of the CEPT, the pilot areas will accumulate mature carbon management technologies, carbon emission standards, carbon monitoring equipment, and rich carbon management experience. By establishing a carbon emission reduction cooperation mechanism, neighboring provinces can learn from the pilot areas’ CEPT and management models, thus forming a spatial development pattern of the CEPT of “driving the whole area from a single point”. In addition, as the CEPT in the pilot areas gradually matures, it may attract more investment funds to flow in, and these funds may flow to neighboring areas to support their implementation of emission reduction projects, thus further promoting the “pollution reduction” and “carbon emission reduction” in neighboring areas. Considering that the PRWREB has the support of regional development policies and features close economic development connections among cities and free flow of resource elements [
25], the research suggests that the CEPT promotes the "pollution reduction" and “carbon emission reduction” in the PRWREB through the spatial spillover effect. Based on the above analysis, we put forward Hypothesis 1 and Hypothesis 2:
Hypothesis 1 (H1). The CEPT has facilitated the reduction of pollution and carbon emissions levels in the pilot areas of the PRWREB.
Hypothesis 2 (H2). The CEPT has promoted the decline in pollution and carbon emissions levels in the PRWREB through the spatial spillover effect.
The Porter Hypothesis proposes the innovation offset effect and compliance cost effect to explain the mechanisms of environmental regulation policies. This has further led some scholars to use factors such as industrial structure, energy efficiency, and technological innovation as alternative indicators for measuring the Porter effect.
From the perspective of source prevention, the industrial structure’s tilt towards heavy industry has become a significant reason for the increase in carbon emissions in China. The market plays a decisive role in carbon emission trading. Based on the “compliance cost” theory and the “profit maximization” principle [
12], if the revenue from selling carbon emission allowances exceeds the innovation cost of green low-carbon technology, a large amount of capital will flow into the green low-carbon industry. This will lead to the gradual elimination of “high pollution, high emission, and high energy consumption” backward industries and the vigorous development of new industries with low pollution, low emission, and high technology [
32,
33]. Consequently, this promotes the transformation and upgrading of the industrial structure in pilot provinces and cities from low-end to high-end, effectively reducing carbon and pollution emissions.
From the perspective of “process control”, energy consumption is the root source of CO
2 and pollutant emissions. In this context, all sectors are driven to improve production processes, advance production technology, and enhance energy efficiency to meet future market demands and regulatory requirements, thereby reducing pollution and carbon emissions [
6,
28]. Additionally, to meet the emission targets set by the CEPT, companies will actively take measures such as substituting high-carbon energy like coal with clean energy, including wind, hydro, and solar power, to reduce coal energy consumption and further promote reductions in pollution and carbon levels.
The CEPT can stimulate pilot enterprises to engage in low-carbon technological innovation activities through the “signal-expectation” mechanism [
34,
35]. From the perspective of “end treatment”, the CEPT will, to some extent, increase pollution control costs for enterprises. To maintain operations, enterprises will increase investment in innovation and research, improving processes through technological innovation to reduce air pollution and carbon emissions [
35]. Due to population mobility, surrounding cities will imitate the emission reduction technologies of pilot cities, thereby driving pollution and carbon reduction efforts in surrounding cities [
15]. This imitation effect of technological innovation has resulted in a “1 + 1 > 2” carbon reduction effect. Based on the above analysis, the study constructs an analytical framework for the CEPT mechanism (
Figure 1) and proposes the following three hypotheses for its impact pathways:
Hypothesis 3 (H3). The CEPT has contributed to the reduction of pollution and carbon levels in the PRWREB by advanced industrial structure.
Hypothesis 4 (H4). The CEPT has facilitated the reduction of pollution and carbon levels in the PRWREB by enhancing energy efficiency.
Hypothesis 5 (H5). The CEPT has promoted the reduction of pollution and carbon levels in the Pearl PRWREB by fostering technological innovation.
4. Empirical Analysis
4.1. Characterizing Factual Descriptions
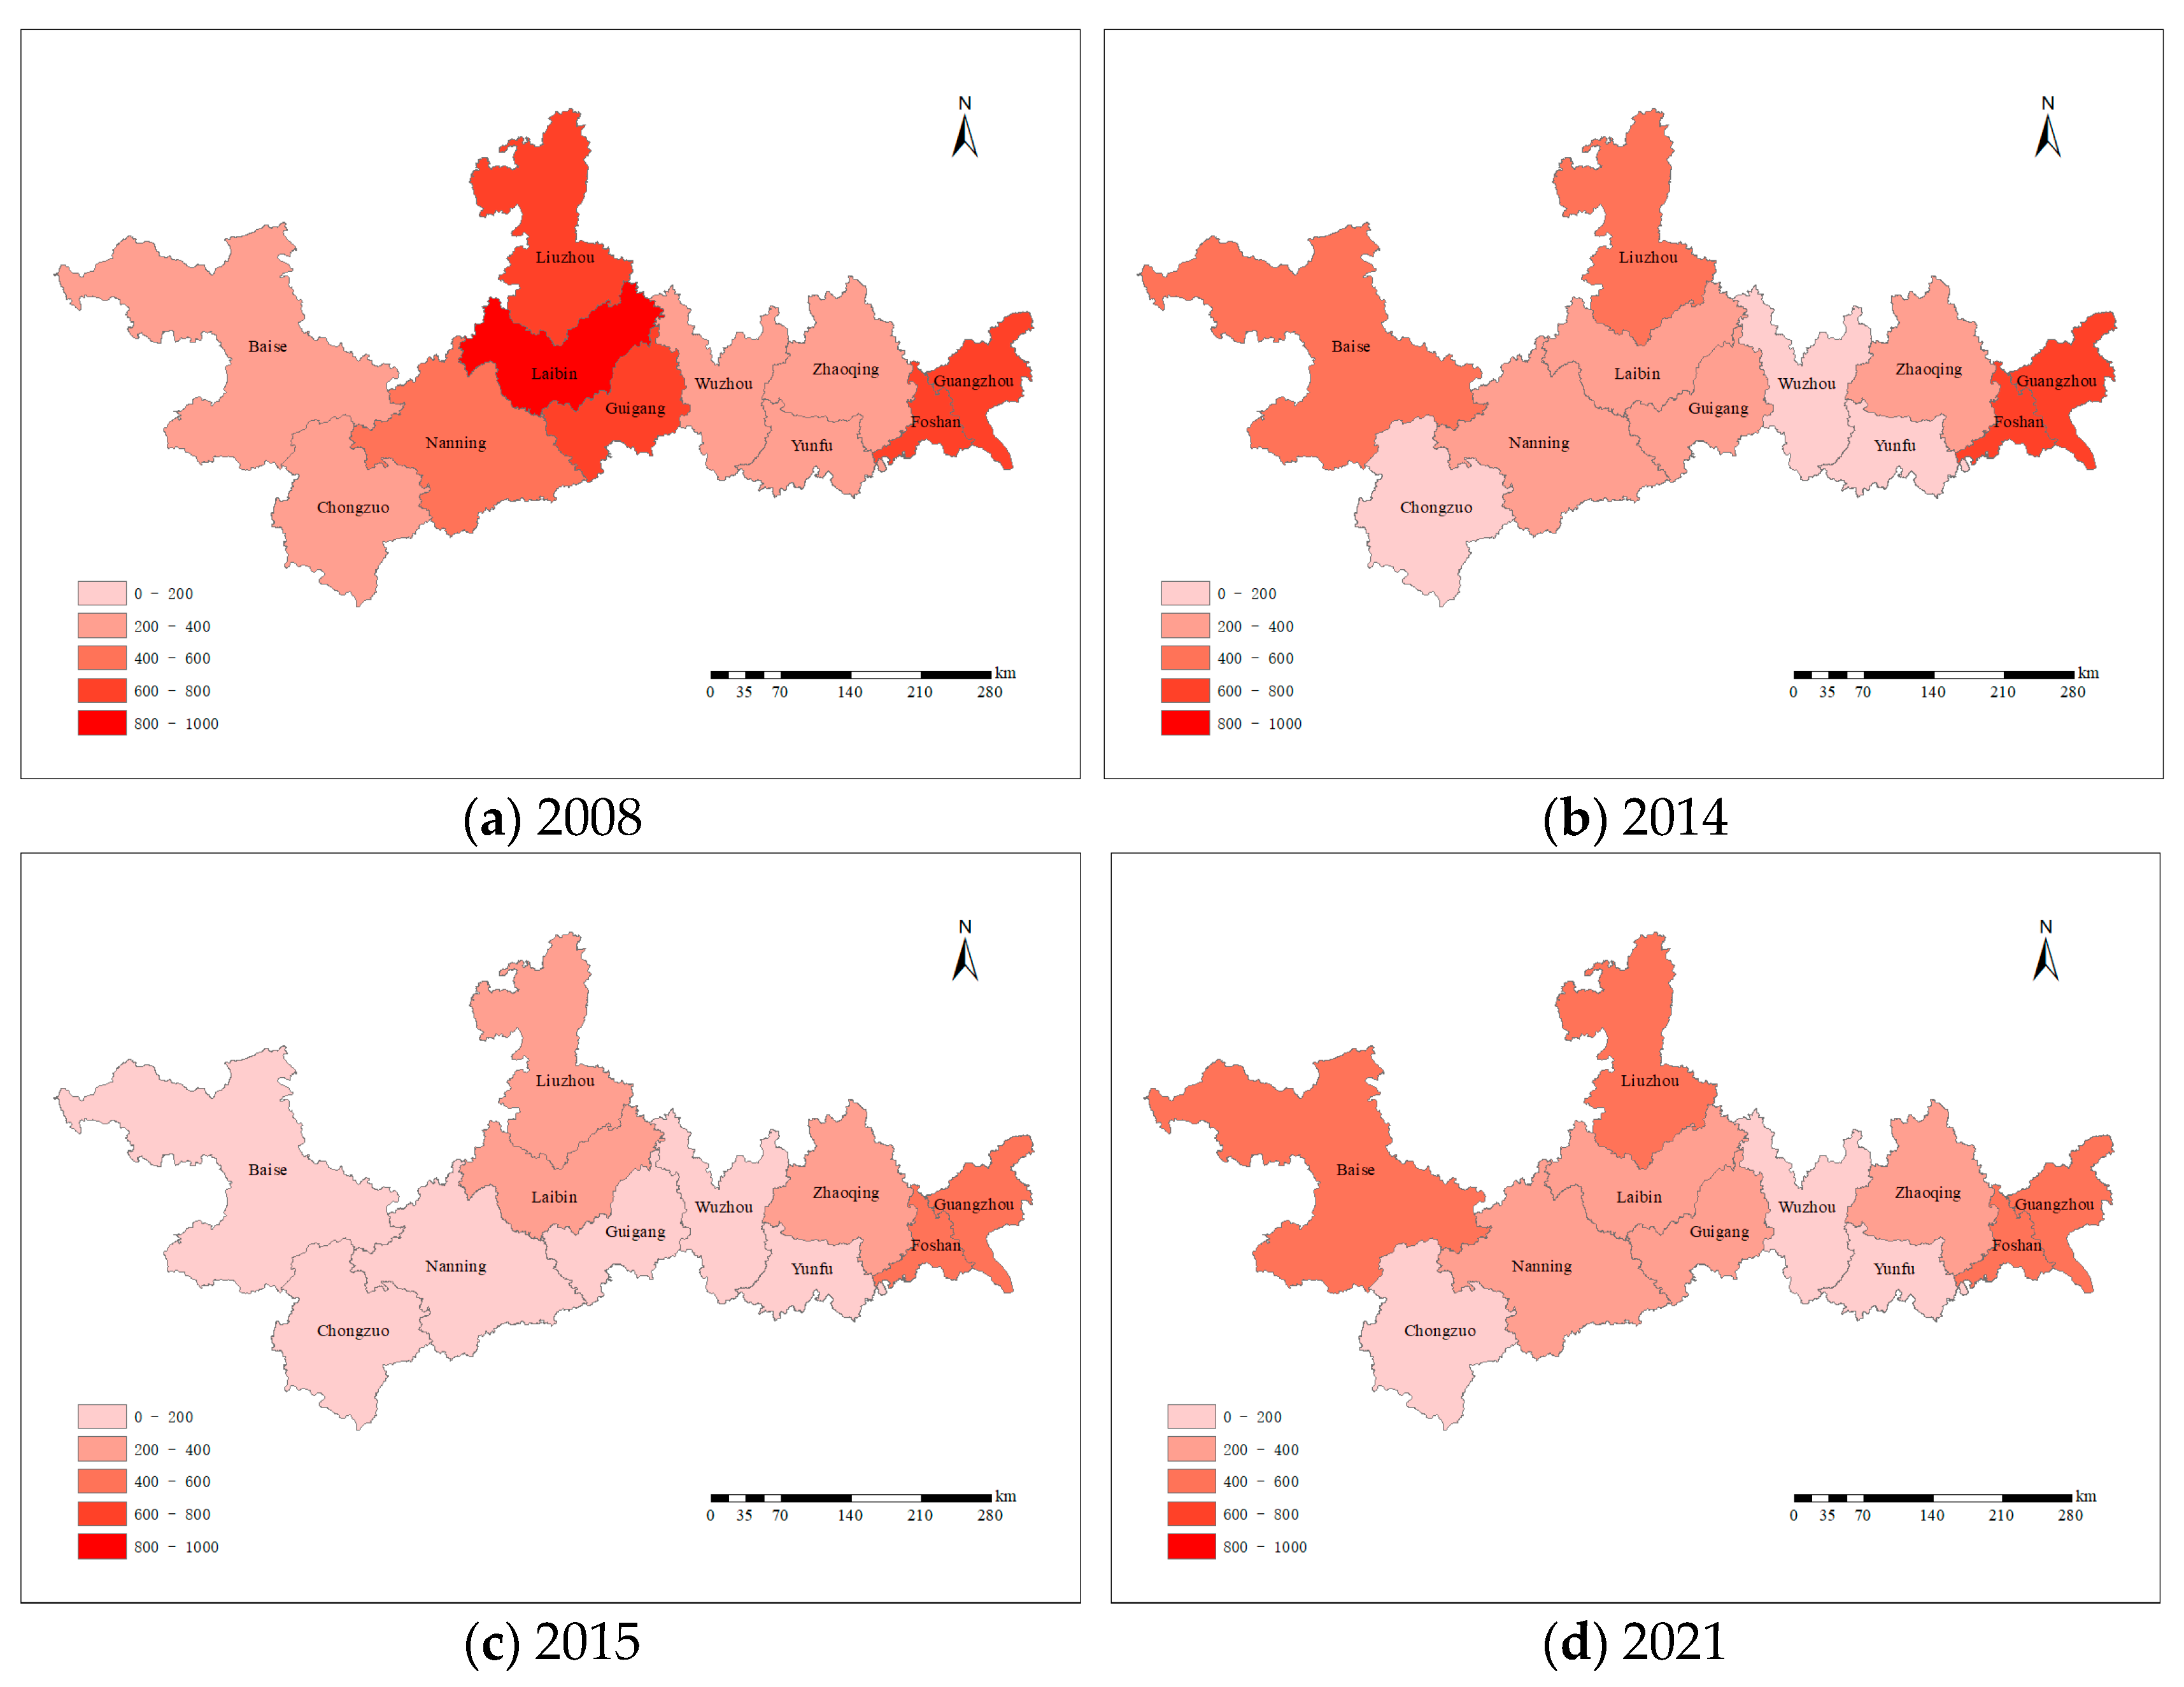
As the logical starting point of the empirical analysis in this study, first of all, using the research data mentioned earlier, the entropy weight method is employed to calculate the level of pollution reduction and carbon emission reduction in the PRWREB during the research period, and ArcGIS is used for visual analysis as shown in
Figure 3. From an individual perspective, the level of pollution reduction and carbon emission reduction shows a downward trend in all cities except Baise. Baise exchanges resources for industries and consolidates its core position in the industry. Moreover, due to its special geographical location, many industrial enterprises build factories in the upper reaches of the Xijiang River. This increases the difficulty of pollution control and leads to backward environmental infrastructure and the intertwining of various environmental problems. Overall, the pollution reduction and carbon emission reduction in the economic belt are on a downward trend. The lowest level during the research period occurred in 2015, the second year after the implementation of the policy. The degree of reduction in the level of pollution reduction and carbon emission reduction in the pilot cities is significantly lower than that in the non-pilot areas. Then, is the decline in pollution reduction and carbon emission reduction related to the CETP? Through which mechanisms is it promoted? Are “pollution reduction” and “carbon emission reduction” mechanisms the same? The following text will explore these questions through empirical analysis.
4.2. Policy Effect Assessment
Table 2 shows the results of the Difference-in-Differences (DID) analysis. Model 1 is the baseline model, which does not consider any control variables, while Models 2 to 7 progressively introduce control variables. The results indicate that, regardless of whether control variables are considered, the dummy variable for the CEPT is significantly negative at the 1% level. This implies that the CEPT promotes pollution and carbon reduction in the pilot areas, reducing levels by 34.1%. The reason is that, from the perspective of market supervision, studying the monitoring, reporting, and measurement, “Reporting and Verification” (MRV) rules can ensure that enterprises truthfully report their carbon emission data. Strict quota constraints and penalties for violations force enterprises to attach importance to emission reduction and, in coordination with other environmental policies, raise the standards, prompting enterprises to improve their production processes and optimize their energy structures. From the perspective of market response, fluctuations in carbon prices send signals. Cost pressures and investment trends encourage enterprises to adopt clean energy and develop low-carbon technologies. Market competition gives enterprises with outstanding performance in emission reduction an advantage, motivating them to improve energy efficiency and cut emissions. Financial innovation products provide financial support for emission reduction projects, guiding capital to flow into green industries and facilitating emission reduction with the help of the adjustment of industrial structures. Multiple mechanisms work together to eventually lead to a significant decline in pollution and carbon levels. Therefore, based on the results of the baseline regression, Hypothesis 1 (H1) is validated. However, further tests are needed to examine its endogeneity and robustness.
4.2.1. Parallel Trend Test
The DID model must meet the assumption of parallel trends, where the pilot and non-pilot areas follow similar trends before the policy implementation. This study uses the event study method to test the assumption of parallel trends (
Figure 4). The horizontal axis from −4 to −1 represents the dummy variables for the four years before policy implementation, 0 represents the dummy variable for 2014, and 1 to 5 represents the dummy variables for the five years after policy implementation. The vertical axis represents the coefficient estimates. The coefficients for pollution and carbon reduction levels are not significant in the four years before the implementation of the CEPT, indicating no significant systematic differences between the pilot and non-pilot areas before the policy was implemented, thus meeting the parallel trends assumption. Additionally, the estimated coefficients after policy implementation indicate that the CEPT has a sustained effect on promoting pollution and carbon reduction in the pilot areas.
4.2.2. Endogenous Test
To further test the robustness of the results and overcome the sample selection bias and endogenous issues caused by unobserved factors in the traditional DID model, this paper adopts the SCM [
38]. This study uses control variables from 2008 to 2021 as predictor variables and calculates the synthetic weights for each carbon trading pilot city using the “synth” command in Stata16. The specific results are shown in
Table 3. By summing the weights of each city, we can estimate each pilot city’s pollution and carbon reduction levels before the CEPT was implemented.
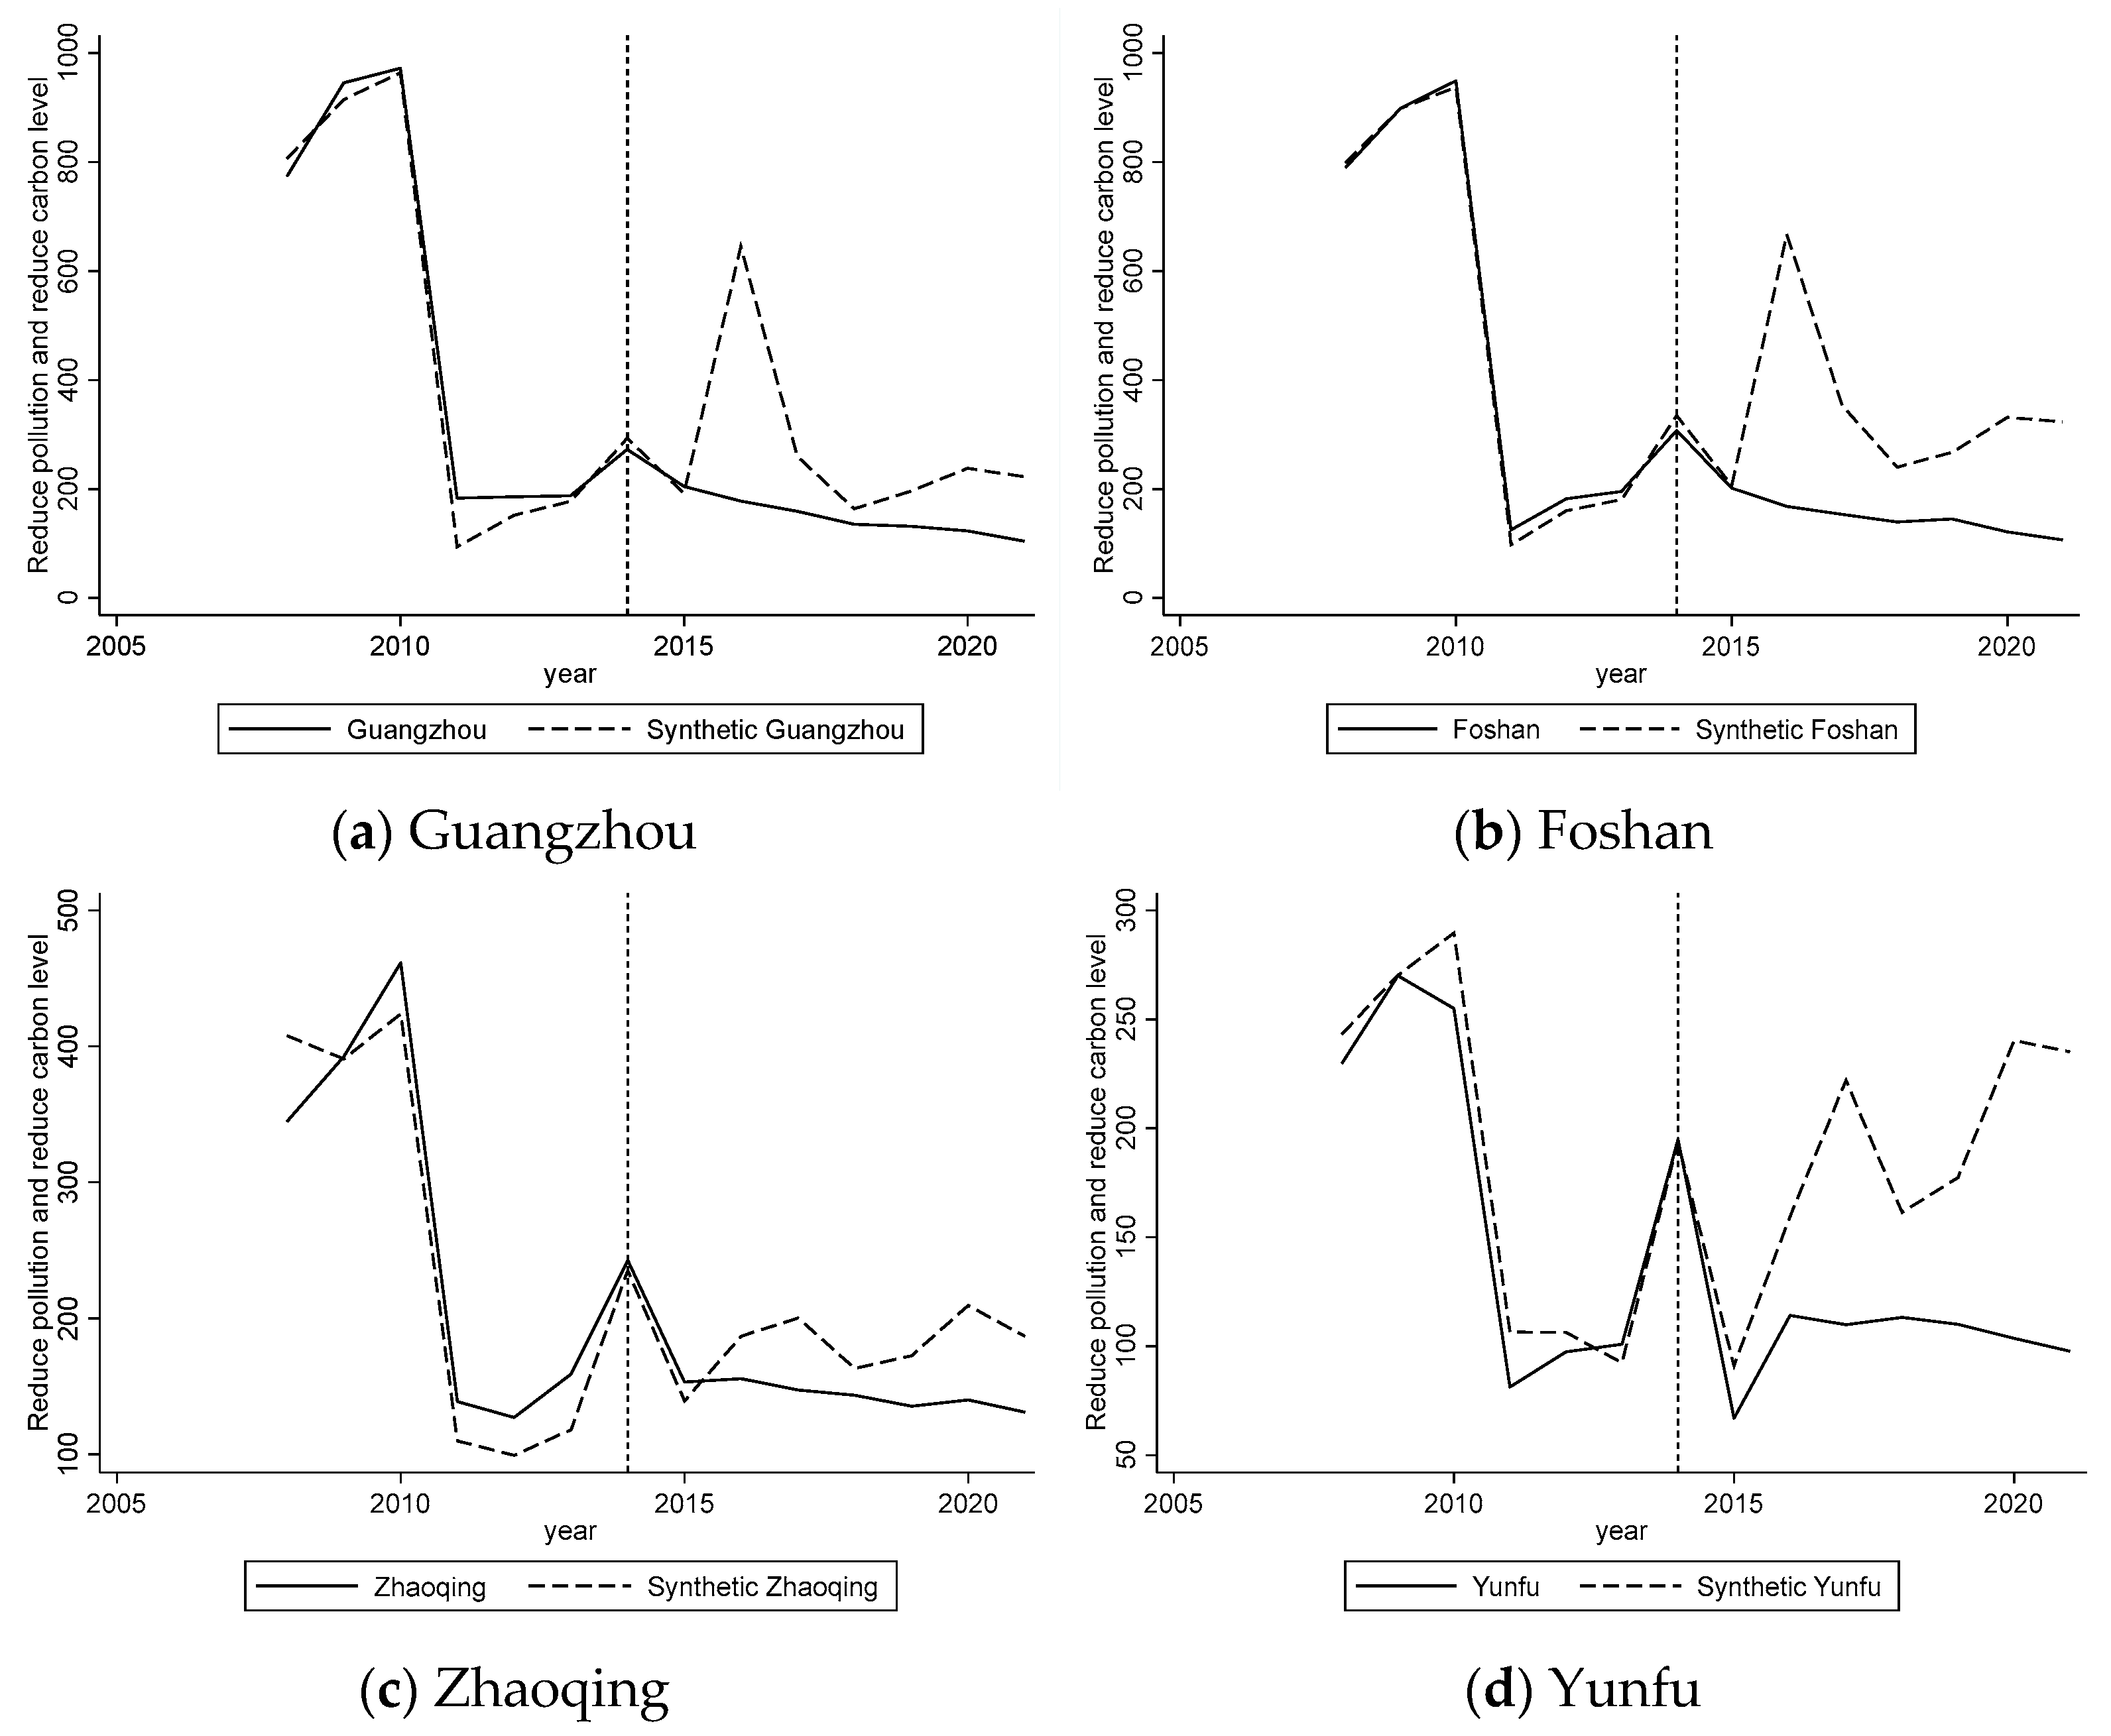
Figure 5 shows the fitting results of each pilot city’s pollution and carbon reduction levels before and after implementing the CEPT under the SCM model. The vertical dashed line represents the policy implementation time in the pilot cities. In contrast, the horizontal dashed and solid lines represent the synthetic and actual values of the pollution and carbon reduction levels in the pilot cities, respectively. By observing
Figure 5 and calculating the root mean squared prediction error (RMSPE) values for each pilot city (
Table 4), it can be seen that before the policy implementation, the actual and synthetic values of the pilot cities show roughly the same trend. After the policy implementation, the actual values are significantly lower than the synthetic values, further validating Hypothesis H1. Overall, the actual pollution and carbon reduction levels show a linear downward trend, while the synthetic values show a fluctuating upward trend. The two gradually diverge, and the difference between them gradually increases. Regarding individual policy effects in the pilot cities, Zhaoqing performs relatively well. At the same time, the pollution and carbon reduction levels in Guangzhou and Foshan have decreased but remain at relatively high levels. This individual difference may stem from varying responses to the CEPT in different cities, involving factors such as each city’s unique industrial structure, pollution source distribution, and specific details of policy implementation [
26].
4.2.3. Robustness Tests
To further test the robustness of conclusion H1, this study adopts the methods of a counterfactual test, eliminating the interference of other policies and shortening the time window for the test. The results are shown in
Table 5. First, the counterfactual test is carried out by investigating the impact of DID on carbon emission intensity when the CETP is not implemented to verify the research conclusion. Column (1) indicates that the estimated coefficient is no longer significant, which means there are no other systematic errors in the experimental and control groups, and the benchmark regression result is credible. During the research period, the pollution reduction and carbon reduction levels may be impacted by similar policies, such as the opening of the national carbon market in July 2021. To obtain the net effect of the carbon trading pilot policy, this study incorporates this policy into the regression analysis to eliminate the interference of other policies. Column (2) shows that after excluding the national carbon market’s opening policy, the policy’s net effect is consistent with the conclusion of the benchmark regression. This may be ascribed to the fact that during the incipient phase of the unified market’s formation, the market mechanism remains incomplete, and only the power industry is involved. Simultaneously, it is also subject to the macro-economy’s influence and the industry’s intrinsic attributes. Finally, considering that the selection window of sample time may influence the estimation of policy effects, this study narrows the sample time window to 2010–2019. As shown in Column (3), the coefficient before the DID is still significantly negative, from which it can be inferred that the main regression result is somewhat robust.
4.3. Analysis of the Spatial Effects
First, the spatial autocorrelation method is used to explore the spatial correlation between pollution reduction and carbon reduction in the region (see
Table A1 in
Appendix A for details). It is found that the PRWREB exhibits spatial spillover effects and a strong positive clustering trend in pollution and carbon reduction. Based on this, the S-DID method is attempted.
Table 6 presents the results of the S-DID, which indicate that the direct effect of the carbon trading pilot policy on carbon intensity is greater than the indirect effect, and both effects are significantly negative. Model 8 is a two-way fixed-effects spatial Durbin model without control variables; model 9 is a time-fixed-effects model with control variables; model 10 is an individual fixed-effects model with control variables; and model 11 is a two-way fixed-effects spatial Durbin model with control variables. In all models, the dummy variable is significantly negative at the 1% level, and the R-sq of each model indicates a good fit. Therefore, it can be concluded that the carbon trading pilot policy has a spatial spillover effect, achieving emission reductions not only in the pilot cities but also reducing the pollution reduction and carbon reduction levels of the economic belt by 29.9%, thus confirming Hypothesis H2. The reason is that for geographically adjacent areas, on the one hand, the Guangxi section of the economic belt implements the carbon trading pilot policy and begins to limit carbon pollution emissions strictly. Affected by factors such as atmospheric circulation and wind direction, it indirectly reduces the carbon pollution emissions flowing into the Guangxi section. On the other hand, the demonstration effect of the Guangxi section of Guangdong will drive the Guangxi section to improve its low-carbon policy system. Eventually, the “trickle-down effect” defeats the “polarization effect”, promoting efficient collaboration and positive interaction in carbon pollution reduction between economic belts. Secondly, the industrial structure, energy utilization structure, and economic growth model of economically adjacent areas are similar to those of the Guangdong section. Technical collaboration and communication between economic belts are also more frequent, meaning their pollution and carbon reduction paths are relatively similar. Regions with similar economic development characteristics can promote and learn the successful experience of pilot areas in low-carbon technology applications and industrial structure adjustment, thereby promoting pollution reduction and carbon reduction.
4.4. Heterogeneity Test
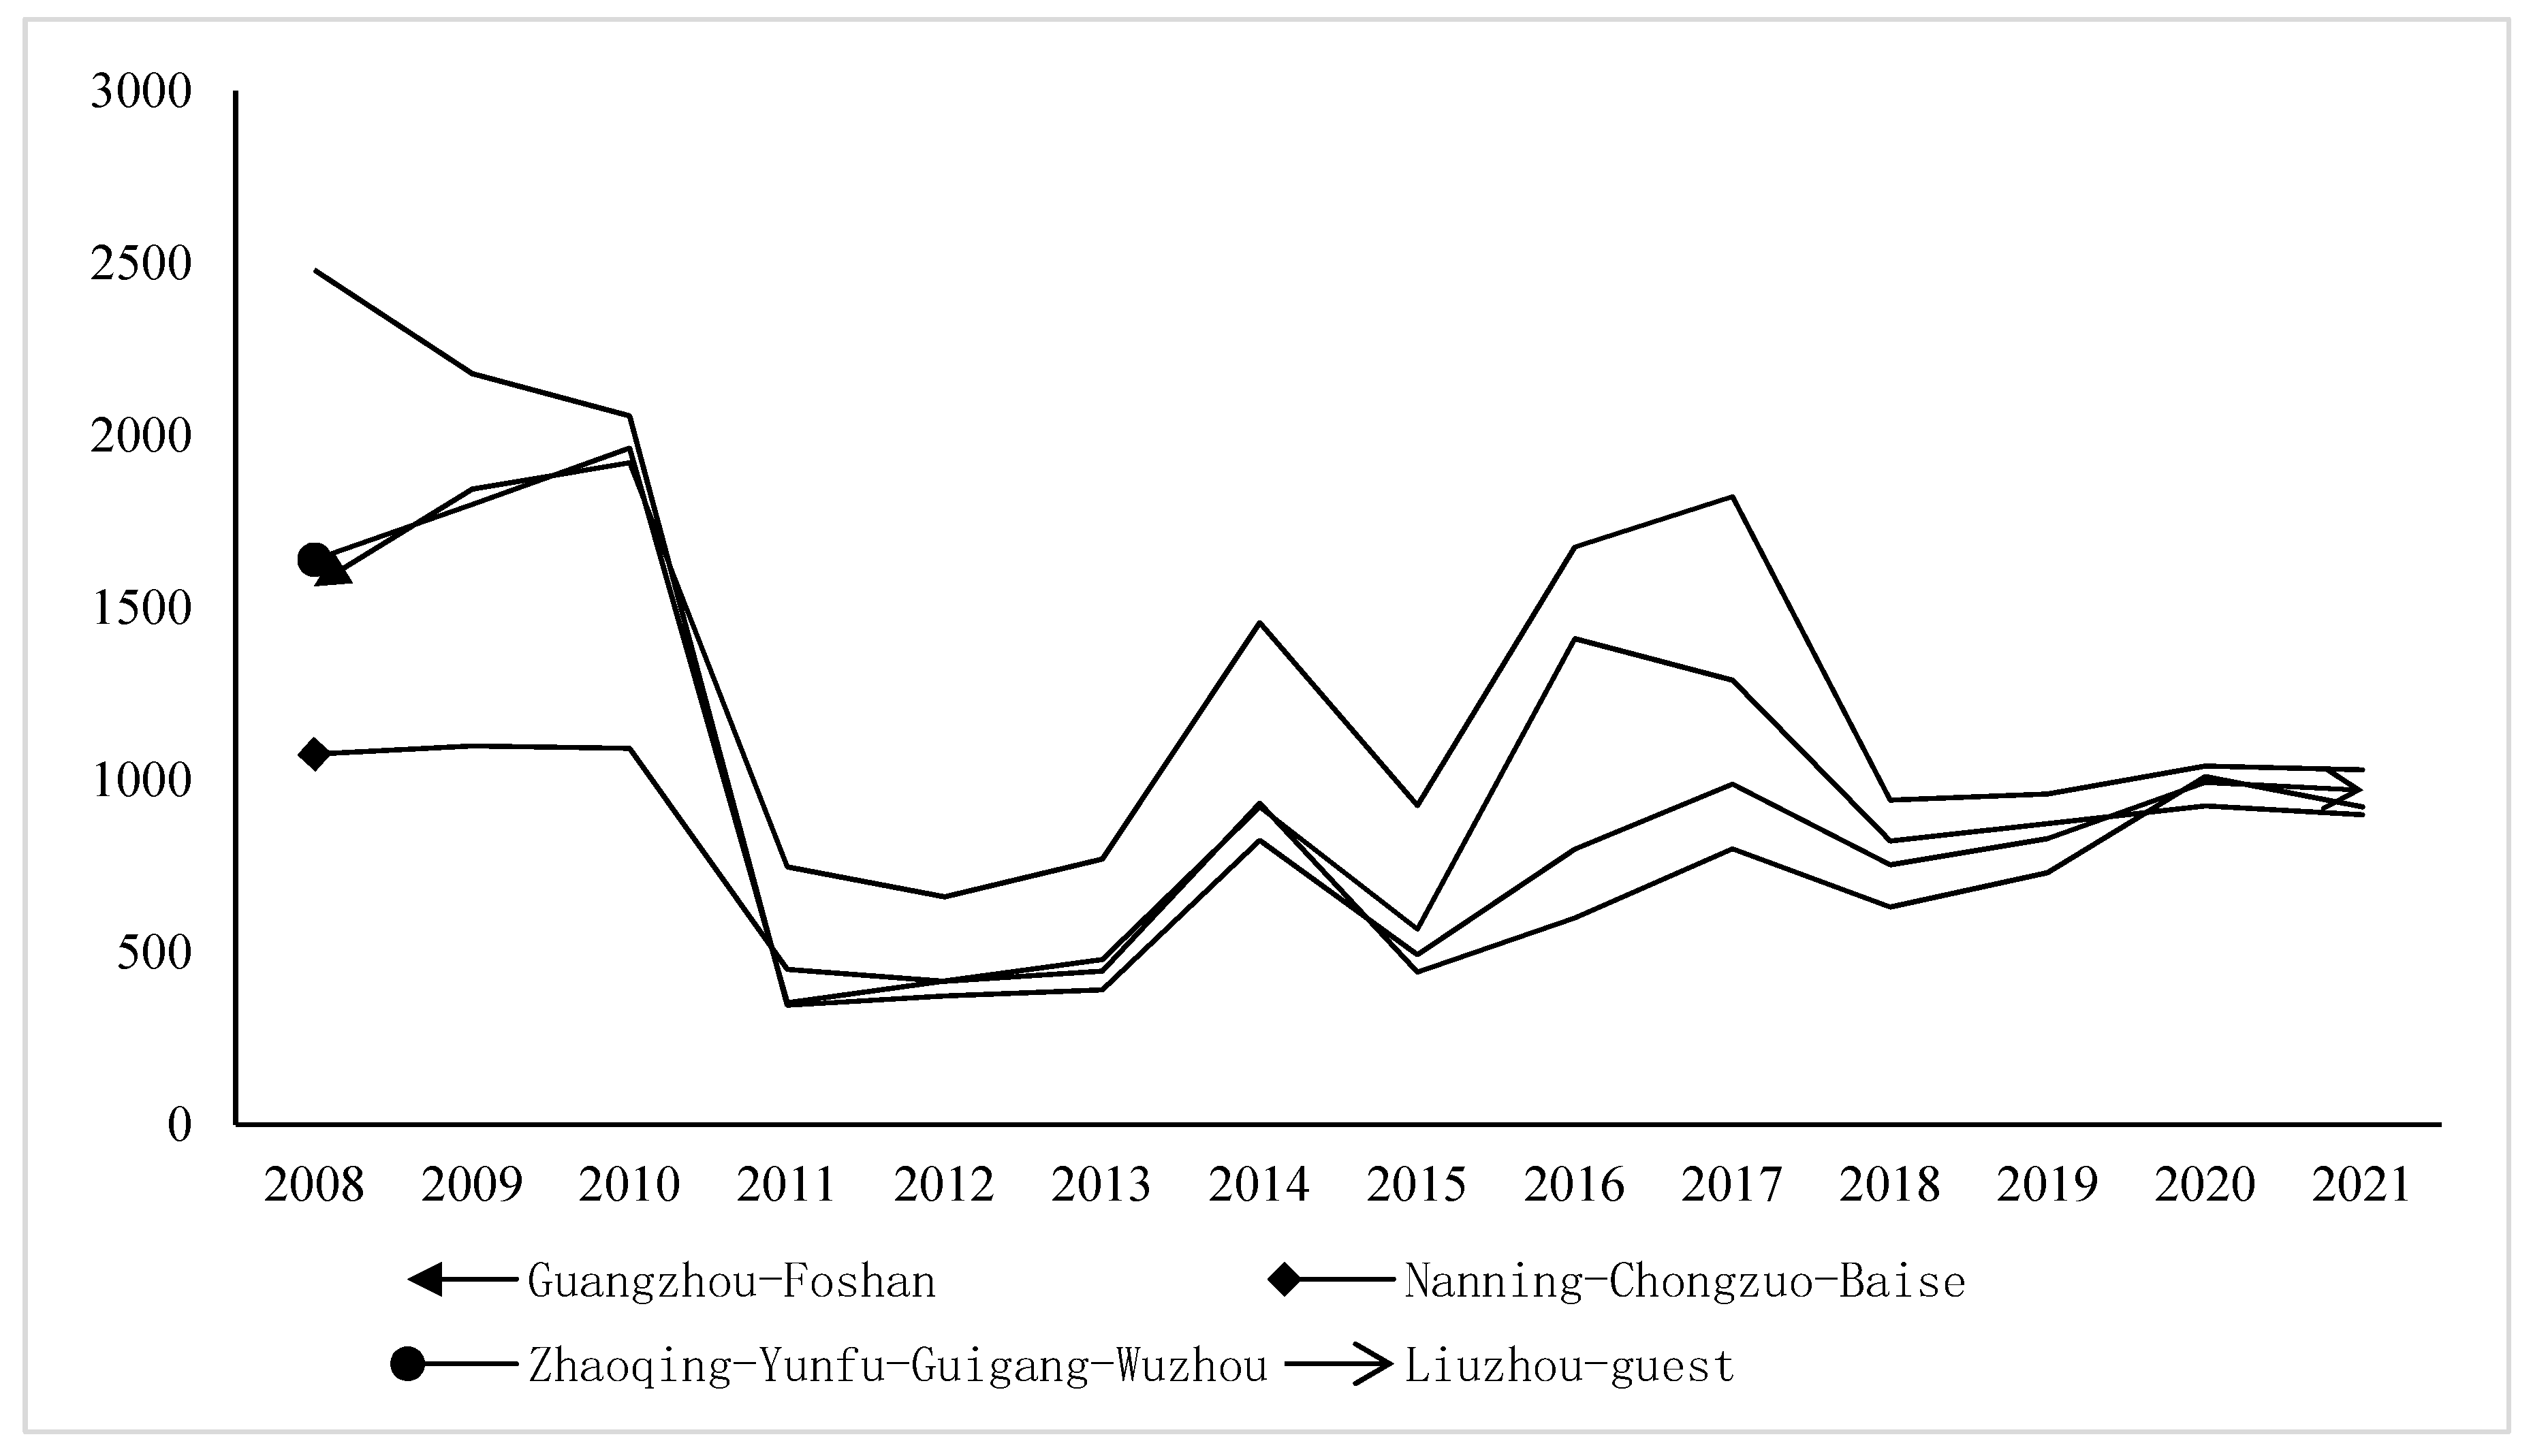
Significant differences exist among cities in the PRWREB regarding policy implementation, industrial structure, resource-carrying capacity, and economic development level. These differences may lead to heterogeneity in the pollution reduction and carbon reduction effects of the CEPT. According to the “Blue Book of the Pearl River-Xijiang River Economic Belt” and the “Development Plan of the Pearl River-Xijiang River Economic Belt” issued by the Central Committee of the Communist Party of China and the State Council in 2014, this economic belt is divided into four groups: Guangzhou–Foshan, Nanning–Chongzuo–Baise, Zhaoqin–Yunfu–Guigang–Wuzhou, and Liuzhou–Laibin.
Figure 6 shows the evolution diagram of the four groups’ pollution and carbon emission reduction levels. Overall, the levels of pollution reduction and carbon emission reduction fluctuated and declined. With the introduction of the “Master Plan for the Development of the Guangxi West River Economic Belt” in 2012, “ecological priority” became the focus, and the PM
2.5 in the economic belt dropped significantly. With the promulgation of the “Action Plan for the Prevention and Control of Air Pollution” in 2013, pollution and carbon emission reduction in the economic belt remained relatively low between 2011 and 2015. However, with the establishment of the Guangdong–Guangxi Cooperation Special Experimental Zone, the industrial development of the economic belt reached a climax in 2016, and the levels of pollution reduction and carbon emission reduction gradually increased. From an individual perspective, the variation range of the pollution reduction and carbon emission reduction levels in Guangzhou–Foshan is small, in line with the development characteristics of its mature industrialization stage. The pollution reduction and carbon emission reduction levels in other groups fluctuated greatly because they were still in the transitional stage from the initial to the middle stage of industrialization, where traditional industries occupied a dominant position, and there were contradictions between economic development and environmental protection.
Further parameter estimation for the above four sub-samples is shown in
Table 7.
Table 7 indicates significant regional heterogeneity in the pollution reduction and carbon reduction levels due to the CEPT in the PRWREB. The CEPT’s pollution and carbon reduction levels are significantly negative at the 1%, 5%, and 5% levels in Guangzhou–Foshan, Nanning–Chongzuo–Baise, and Zhaoqing–Yunfu–Guigang–Wuzhou, respectively. In Liuzhou–Laibin, the levels are negative but not significant. This result also indicates that regions with higher economic development and market activity levels provide suitable conditions for implementing CEPT. The CEPT in Nanning–Chongzuo–Baise significantly negatively affects pollution and carbon reduction at the 5% level, which can be attributed to Nanning’s pioneering carbon account initiatives and active participation in the “dual carbon” policy system. The CEPT’s pollution and carbon reduction levels in Liuzhou–Laibin are negative but not significant, as both cities have high energy consumption bases, economic development sensitive to energy demand, and limited potential for energy savings and carbon reduction in key industries.
To further verify the impact of the CEPT on “pollution reduction” and “carbon reduction”, this study employs S-DID to empirically test the emissions of CO
2, SO
2, dust and particulate matter, and PM
2.5. In this analysis, odd-numbered columns do not consider control variables, while even-numbered columns include them.
Table 8 shows that, regardless of whether control variables are added, implementing the policy significantly reduces CO
2 and the three air pollutants. The even-numbered columns of
Table 8 indicate that, after adding control variables, the explanatory power of the models significantly increased. The coefficients of the policy implementation variables are less than 0 at significance levels of 0.01 and 0.05, indicating that CEPT significantly reduces CO
2 and air pollutant emissions. Specifically, CO
2 emissions decreased by 28.7%, SO
2 emissions decreased by 30.9%, and dust emissions decreased by 23.2%.
The policy’s effect on reducing PM2.5 emissions is not obvious, with a decrease of 3.1%. The emission reduction effect could be better, and the reasons are multifaceted. From the perspective of industrial practice, most areas within the economic belt are still in the middle and late stages of industrialization. Cement, ceramics, and papermaking are typical representatives. These enterprises generate a lot of smoke and dust during the calcination process, which contains many PM2.5 particles. Under the CETP, enterprises maintain the status quo because the investment in renovation funds is large, and it is difficult to balance the costs with the emission reduction benefits in the short term, resulting in a poor effect on PM2.5 emission reduction. Moreover, some small chemical enterprises need more control over volatile organic compounds (VOCs) during production. VOCs will participate in photochemical reactions in the atmospheric environment and generate secondary PM2.5. There are a large number of small-scale enterprises in the economic belt that need help to upgrade their environmental protection equipment in carbon trading, which makes the problem of PM2.5 persist. Secondly, some areas of this economic belt are in valley areas with relatively closed terrain, where the air circulation is blocked and pollutants are prone to accumulate. For example, the frequency of calm winds is high in winter, making it impossible for the PM2.5 emitted by industries to spread effectively. In addition, the precipitation in this region is concentrated in summer, and the humidity is relatively high in non-precipitation seasons. Such climatic conditions are conducive to converting gaseous pollutants into PM2.5, aggravating pollution. It can be seen intuitively that the coordinated emission reduction effect of CO2 and SO2 is the best. They mainly come from large thermal power enterprises. These enterprises have relatively strong financial and technological strength. Under the incentive of the CETP, they can actively install high-efficiency desulfurization equipment and significantly reduce SO2 emissions.
4.5. Mechanism of Action Analysis
Summarizing the relevant literature, this study explores the mechanisms of CEPT. It systematically considers the entire carbon and pollutant emissions process, focusing on three pathways: industrial structure upgrading, energy efficiency, and technological innovation [
34]. This study decomposes the impact of each mechanism variable into direct effects and spillover effects. The direct effects indicate the impact on pollution and carbon reduction in the policy implementation area, while the spillover effects represent the spatial spillover effects on surrounding areas.
Table 9 presents the regression results of the impact mechanisms.
Column (1) shows that the direct effect of the CEPT on upgrading the industrial structure is significantly positive, while the spillover effect is significantly negative, resulting in an overall negative effect. This indicates that the CEPT in the current economic belt has not generally promoted upgrading the industrial structure; thus, Hypothesis 3 (H3) needs to be verified. The reasons for the analysis are as follows: Firstly, during the pilot stage, the CETP only covered a limited number of industries. Some traditional labor-intensive industries were excluded from the policy, making it difficult to form a joint force for comprehensive transformation. Secondly, in the Guangdong section, after the implementation of the policy, the “siphon effect” led to the convergence of resources from surrounding areas to the Guangdong section. As a result, the surrounding areas suffered from resource losses and limited development. The “polarization effect” caused the adjustment of the industrial structure in the Guangdong section to impact the surrounding traditional industries. Due to the lack of resources and adaptability, the surrounding areas were at a disadvantage in the competition, which affected the optimization of the industrial structure of the entire economic belt. Finally, restricted by funds and technology, most enterprises chose short-term and low-cost emission reduction measures instead of fundamentally changing the industrial layout. Traditional industries might resist policy changes out of concerns such as the interruption of production processes, financial losses during the transformation period, or insufficient understanding of the long-term benefits of the policy. Moreover, there might be loopholes in supervision and implementation. The implementation standards in the Guangdong and Guangxi sections needed to be more consistent, and some enterprises evaded structural adjustments, which aggravated the negative impact on the industrial structure.
Column (3) shows that the direct and spillover effects of the CEPT on energy efficiency are significantly positive. Column (4) indicates that after including energy efficiency in the model, the coefficient of policy implementation is significantly negative, decreasing by 0.048. Therefore, Hypothesis H4 is confirmed, indicating that the CEPT reduces the overall pollution and carbon reduction level of the economic belt by improving energy efficiency. The above results can be explained as follows. On the one hand, the new governance methods and economic leverage effects brought about by the carbon trading pilot policy have strengthened enterprises’ internal motivation to improve energy utilization efficiency actively. They pay attention to energy efficiency to obtain more carbon emission rights. On the other hand, the price signals in the carbon market have motivated enterprises to invest in the research and application of clean technologies, thus effectively promoting the improvement of energy utilization efficiency. Specifically, under the influence of the CETP, enterprises with low energy utilization efficiency have gradually lost their advantages in market competition due to having to bear more carbon trading costs and withdrawing from the market. Secondly, the CETP has changed the dilemma of being locked at the low end of the value chain. As production units with low energy utilization efficiency are eliminated, the industrial value chains within the economic belt have been reshaped. To survive and develop under the environment of the CETP, enterprises have scrambled to climb to the high end of the value chain. Improving energy utilization efficiency has become an important development path for them, thus reducing the overall level of pollution reduction and carbon emission reduction.
Column (5) shows that the direct and spillover effects of the CEPT on technological innovation are significantly positive, with the spillover effect being greater than the direct effect. The policy implementation coefficient is significantly negative after including technological innovation in the model, decreasing by 0.079, indicating that the CEPT reduces pollution and carbon levels through technological innovation, confirming Hypothesis H5. The above results indicate that the CEPT has distinct factor-biased characteristics, with technological innovation understood as the embedding and integration of factors into the existing production processes of the economic belt. Technological innovation requires investment, which can improve the local environment and, through spatial spillover effects, allow neighboring regions to benefit without additional input. Additionally, the neighboring regions experience a “copycat effect”, further promoting pollution and carbon reduction. Specifically, the CETP actively drives technological innovation. In the energy field, it promotes the optimization of hydropower technology. It improves conversion efficiency through intelligent dispatching and other means, reducing the proportion of thermal power used to reduce pollution and carbon emissions. In the industrial aspect, it prompts the chemical industry to research and develop green technologies, reducing energy consumption and pollution in the production of plastics and other products and driving the upgrading and transformation of the industry. In agriculture, it triggers the rise of ecological agricultural technologies, using precise means to reduce the amount of chemical fertilizers and related pollution and reshape the agricultural model. The construction industry popularizes green building technologies, reducing building energy consumption and carbon emissions and driving the upgrading of related industries. Overall, it profoundly and continuously impacts carbon emission and pollution reduction in multiple fields, helping regional sustainable development reach a new height.
A mediation effect model was used to identify the pathways through which CETP impacts carbon and pollutant emission reductions, with the explanatory variables set as CO
2, SO
2, particulate matter, and PM
2.5.
Table 10 shows that the CEPT has a significant and notable effect on reducing SO
2 emissions. Specifically, the pathways for reducing different pollutants vary. For CO
2 and PM
2.5, improving energy efficiency positively affects emission reduction. CO
2 and PM
2.5 mainly stem from energy consumption. In this economic belt, energy is widely used in many fields, such as industrial production and transportation. Improving energy efficiency can directly target the sources of emissions and reduce energy consumption and emissions in all links from energy production to consumption. Due to its excellent cost–benefit ratio, the effect is remarkable. Upgrading the industrial structure is the best for SO
2 emission reduction. Because SO
2 mostly comes from traditional heavy industries, such as steel and chemical production processes, promoting upgrading the industrial structure can fundamentally reduce the proportion of such high-emission industries and achieve source control, so the emission reduction effect is outstanding. For smoke and dust, technological innovation is more effective for emission reduction. Since their sources are scattered and they are generated in various processes of industrial enterprises, building construction and transportation, etc., it is necessary to rely on technological innovation according to different sources, such as upgrading industrial dust removal equipment, innovating building construction techniques, and researching and developing traffic dust control technologies to achieve effective emission reduction.
Meanwhile, the economic belt is dominated by industry and has different transformation needs. The energy structure is mainly based on fossil fuels, and their consumption is unevenly distributed. These industrial and energy characteristics further strengthen the differences in the emission reduction paths for different pollutants, prompting each emission reduction strategy to be formulated according to the specific pollutants.
5. Conclusions and Recommendations
Based on panel data from 2008 to 2021 for the PRWREB, SCM, and S-DID, models were used to explore the effects of CETP on pollution reduction and carbon reduction in the pilot areas of the PRWREB, as well as their spatial spillover effects on non-pilot areas. The regional and target heterogeneity of the policy’s spatial effects were considered. The mechanisms of CETP on pollution reduction and carbon reduction were systematically examined from the perspectives of “source prevention”, “process control”, and “end-of-pipe treatment”, considering both direct and indirect effects.
Three distinct conclusions can be drawn as follows: (1) CETP has promoted a 34.1% overall reduction in pollution and carbon levels in the pilot areas and has had a sustained effect. Additionally, through spatial spillover effects, they have reduced pollution and carbon levels in the economic belt by 29.9%. (2) The effect of CETP on pollution and carbon reduction is more pronounced in areas with better economic development and active CETP. They have reduced CO2 emissions by 28.7%, SO2 emissions by 30.9%, and particulate matter by 23.2%. The effect on PM2.5 reduction is not significant, with a decrease of 3.1%. (3) The spillover effect of CEPT on technological innovation is greater than the direct effect, resulting in the most noticeable pollution and carbon reduction. However, the overall effect on industrial structure is negative, indicating a failure to promote pollution and carbon reduction. The mechanisms for reducing different pollutants vary: CO2 and PM2.5 are linked to energy efficiency, SO2 to industrial structure upgrading, and particulate matter to technological innovation.
Coordinated control can reduce governance costs and avoid high-carbon lock-in [
39]. To better leverage the synergistic emission reduction effect of CEPT and help policymakers explore a complementary, coordinated, and win–win path for pollution reduction and carbon reduction, the following policy recommendations are proposed:
First, a regional carbon-pollution collaborative governance mechanism should be established to enhance pollution reduction and carbon mitigation effects. Government departments can learn from the Yangtze River Delta how to construct a “carbon-pollution coordination platform” to facilitate the smooth flow of information and data within the economic belt and the efficient promotion of joint projects, thereby expanding the scale of the carbon market. Guangzhou and Foshan can follow the example of Shenzhen by introducing products such as “carbon emission rights pledge loans” and “carbon bonds”. With the help of industrial transfer and technology sharing, they can promote the optimization of clean energy and high-efficiency pollution treatment technologies in the Guangxi section, thus reducing pollution and carbon emissions. Liuzhou, Baise, and Guigang, which are heavily polluted, can learn from Tangshan and Handan in the Beijing–Tianjin–Hebei region. Through the regional coordinated governance strategy, these two cities have successfully established cross-city pollution treatment industry alliances and jointly conducted the research, development, introduction, and promotion of advanced equipment and technologies, significantly reducing the governance costs.
Second, differentiated emission reduction strategies should be implemented, strengthening the ecological compensation mechanism. Firstly, construct a framework for evaluating the pollution reduction and carbon emission reduction capabilities of each city in the economic belt from three dimensions, namely the economy (GDP, upgrading of industrial structure, energy efficiency), environment (level of pollution reduction and carbon emission reduction, investment in environmental protection and governance), and technology and talent (level of technological innovation, number of high-tech enterprises, and the proportion of professional talents). Implement hierarchical emission reduction strategies according to the evaluation results; in areas with active carbon trading and relatively strong economies, such as Guangzhou and Foshan, stricter emission reduction standards are implemented, especially in the aspect of PM2.5 treatment, which carries out technological transformation in combination with the adjustment of the energy structure. In less developed areas such as Guangxi, it is recommended that an ecological compensation mechanism be established to avoid environmental problems caused by uneven resource allocation or pollution transfer. Tax incentives and financial subsidy policies encourage enterprises to participate in the carbon trading market and promote the application of green technologies.
Third, industrial upgrading and technological innovation should be promoted to support green and low-carbon transformation. Expand the coverage of the carbon market and capitalize on its leverage effect, thereby promoting the upgrading of the overall industrial structure. For traditional high-pollution industries within the PRWREB, it is recommended to establish a “Green Low-Carbon Industrial Transition Fund” to particularly support the low-carbon transformation of highly polluting industries in the Guangxi region, reducing SO2 and particulate matter emissions. CEPT should stimulate technological innovation, encouraging enterprises to increase research and development of energy-saving and emission-reduction technologies. Technological spillovers should drive industrial upgrading in other regional cities, especially manufacturing hubs like Foshan. The government should establish incentive mechanisms to promote green retrofitting of high-energy-consuming enterprises, enhance energy efficiency, and achieve effective reductions in CO2 and PM2.5 emissions, promoting a synergy between economic and environmental optimization.
Despite this study’s contributions, it has limitations that suggest further research is needed. The data for the pilot policy implementation period were used as the research object, which is reasonable and feasible but did not exclude the impact of the national carbon market in the second half of 2021. Subsequent research should be based on national data to re-verify the effectiveness of CEPT and spatial spillover effects and conduct an in-depth analysis. Additionally, the synergistic mechanism of pollution reduction and carbon reduction in CEPT was not clarified. Future research will introduce four policy tools as follows: carbon price, carbon market activity, carbon market size, and penalties. From the three approaches of industrial structure upgrading, energy efficiency, and technological innovation, the discussion will focus on how CEPT affects pollution reduction and carbon reduction through specific policy tools.


