

Evaluation of Road Safety Hazard Factors in Egypt Using Fuzzy Analytical Hierarchy Order of Preference by Similarity to Ideal Solution Process

 ,
,  , and
, and
Abstract
1. Introduction
2. Literature Review
3. Data and Methodology
3.1. Data Collection
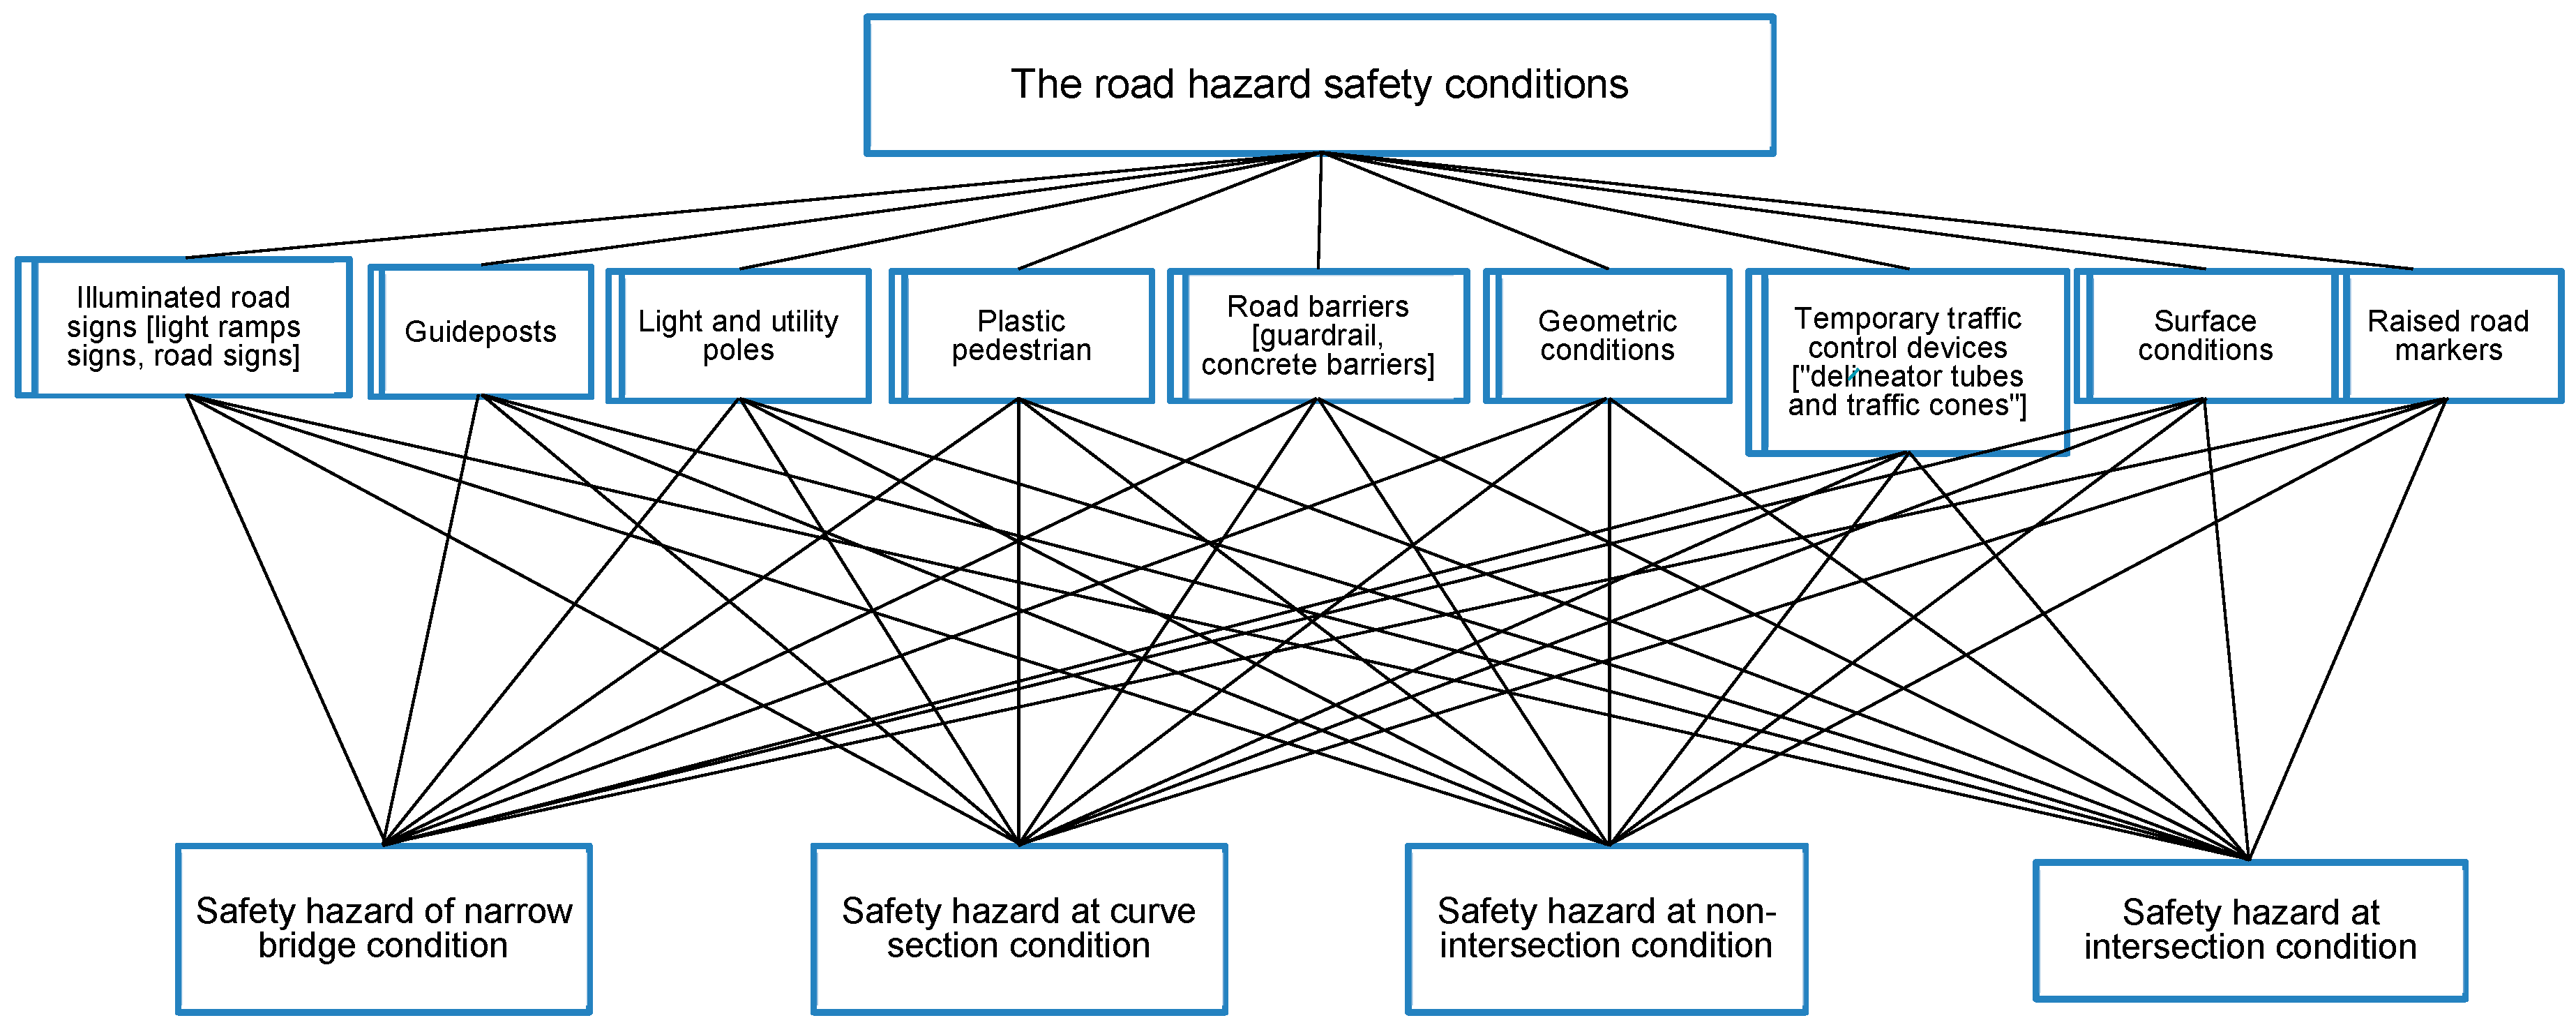
3.2. Safety Hazardous Factors in the Road
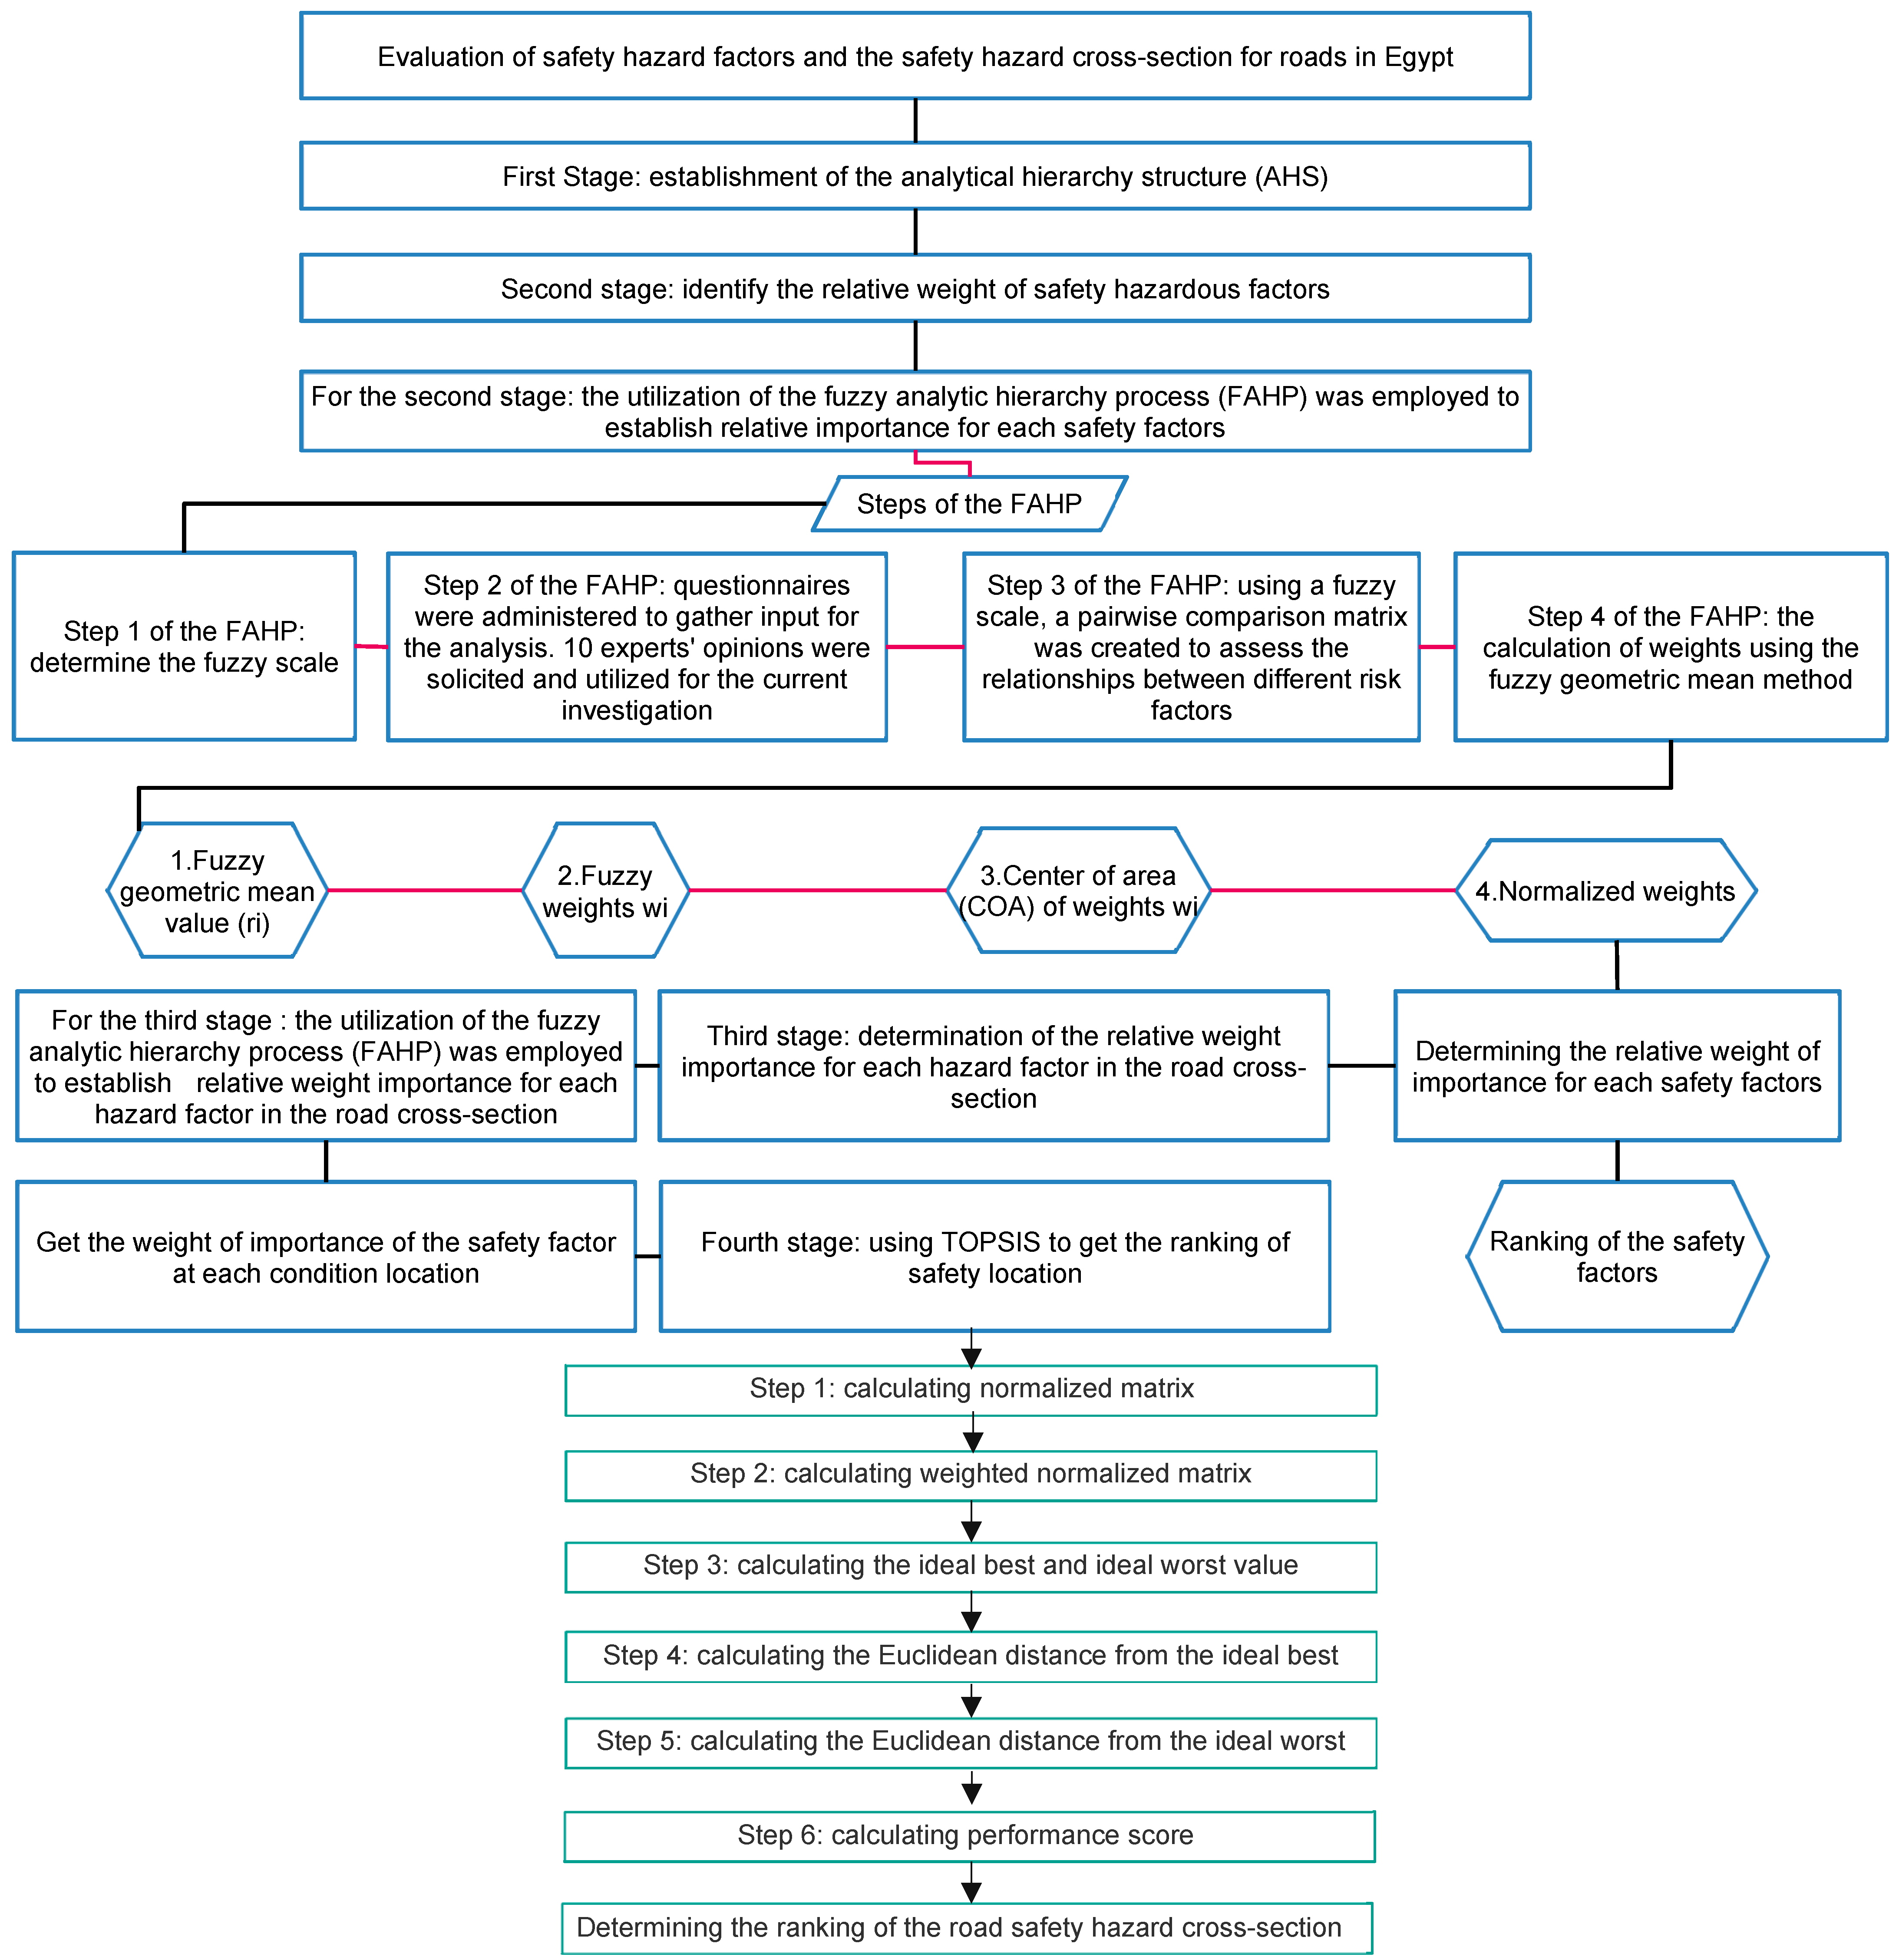
3.3. FAHP-TOPSIS
4. Results and Discussion
- -
- B is an n × n dimensional decision matrix.
- -
- [Bij], where I, J = 1, 2, …, n, Bij is the fuzzy number (l, m, u).
- -
- For reciprocal B−1 = (l, m, u)−1 = ( and Bij = 1 for i = j.
- -
- The steps to calculate weights using fuzzy geometric mean are as follows:
- -
- Fuzzy geometric mean value (ri): B1 Θ B2 Θ Bn
- -
- =(l1, m1, u1) Θ (l2, m2, u2) Θ (ln, mn, un) = (l1 × l2 × … × ln, m1 × m2 × … × mn, u1 × u2 × … × un)1/n. Where n is the number of criteria.
- -
- Fuzzy weights Wi = ri Θ (r1 Θ r2 Θ rn)−1.
- -
- The center of area (COA) of weights Wi = (l + m + u)/3.
- -
- Normalized weights =
- Curves: On curved sections of a road or highway, vehicles need to navigate a change in direction, which can be challenging, especially at higher speeds. Factors like insufficient super elevation, inadequate curve radius, poor sight distance, and a lack of proper signage or markings can increase the risk of vehicles leaving the intended path, leading to collisions or run-off-road accidents.
- Narrow Bridge present a compounded set of challenges by combining the inherent difficulties of navigating a curve with the additional constraint of a narrow cross-section width. These sections often have limited space for maneuvering, reduced shoulder widths and potential sight distance issues, further exacerbating the hazards typically associated with curves. With less room for error or recovery in case of deviation from the intended path, vehicles traversing narrow bridge curves face an increased likelihood of collisions with bridge rails or other vehicles, as the margin for corrective action is significantly diminished.
5. Conclusions
- A statistical model called the FAHP-TOPSIS was developed to determine the rankings of both safety factors and hazardous locations. This model serves as a tool to address ambiguity by incorporating fuzzy logic, allowing for the ranking of safety factors through the FAHP. Additionally, the combination of the FAHP and TOPSIS enables the ranking of safety hazard conditions. The integration of FAHP and TOPSIS methodologies is considered a decision-making framework.
- This study introduces a four-stage methodology for ranking road safety hazardous locations. It begins with the identification of safety factors and safety hazard conditions. Subsequently, the relative importance of these factors is determined using the FAHP. This step is followed by the creation of various stages with the TOPSIS method, aimed at identifying the ranking of hazard conditions.
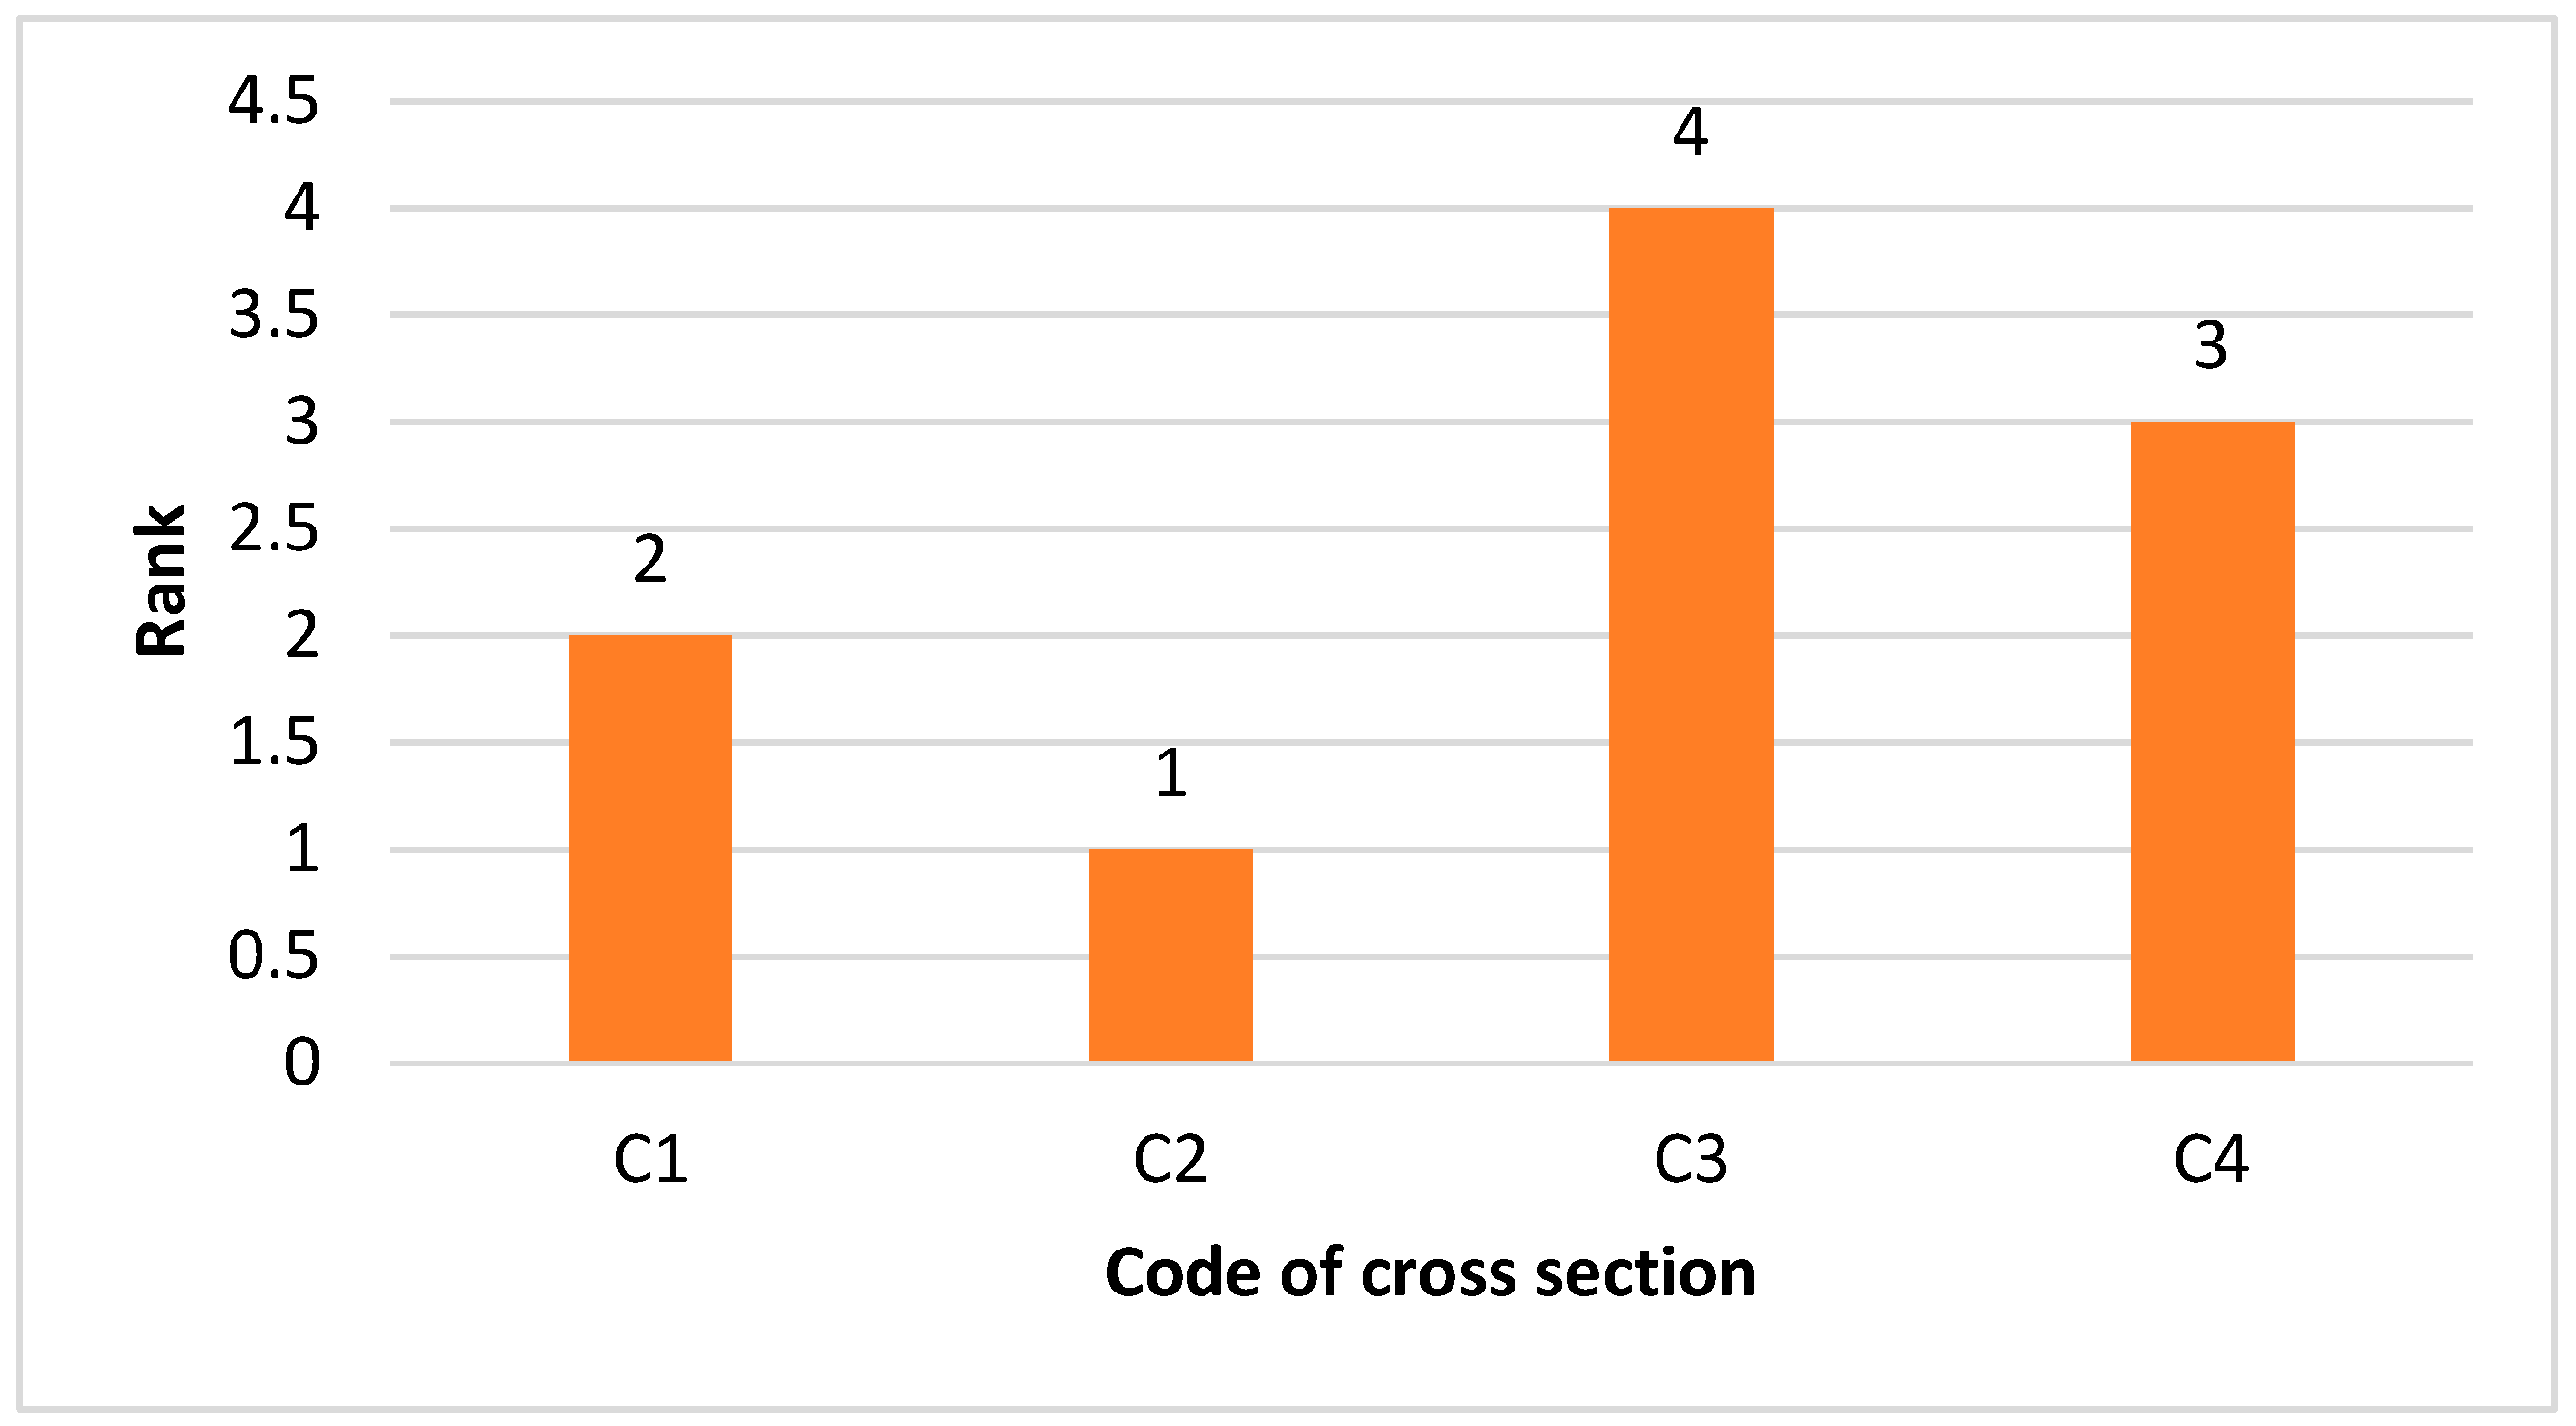
- The FAHP-TOPSIS methodology enables the ranking of safety hazard locations based on their proximity to an optimal and worst-case scenario. Curve hazards were found to be the top priority when considering safety factors. Narrow bridges posed the next greatest hazard according to the analysis. This study could assist in allocating limited budgets to locations in greatest need of road safety enhancements. The FAHP-TOPSIS approach put forth here quantifies road safety audit findings to categorize locations as high, medium, or low risk. Thus, this technique may prove valuable for targeting improvements to the most hazardous areas.
- Curves and narrow bridges warrant heightened safety considerations due to their inherent challenges and increased risk factors. On curved road sections, vehicles must navigate changes in direction, which becomes especially demanding at higher speeds. Insufficient super elevation, tight curve radii, poor sight distances, and inadequate signage can heighten the risk of vehicles departing the intended path, leading to collisions or run-off-road accidents. On the other hand, narrow bridge curves compound these risks by combining the difficulties of curved sections with the constraints of narrow cross-section widths, limited maneuvering space, reduced shoulders, and sight distance issues. This finding exacerbates hazards, leaving vehicles with less margin for error or recovery, increasing the likelihood of collisions with bridge rails or other vehicles.
- The ranking of safety factors for each cross-section was obtained using FAHP-TOPSIS, which can be determined by the calculation of the weighted normalized value Vij for each safety factor. The FAHP-TOPSIS analysis revealed the most critical safety factors for each cross-section type. And the findings revealed that the priority ranking of safety factors is not uniform across different cross-sections, exhibiting variations. The prioritization of these safety factors hinges upon the unique conditions and characteristics inherent to each specific road cross-section typology. In the context of narrow bridge sections [C1], the top-ranking priorities encompass road barriers, lighting and utility poles, and illuminated signage. When considering curved cross-sections [C2], the most critical safety factors are lighting and utility poles, road barriers, and guideposts. For non-intersection sections [C3], road barriers, lighting and utility poles, and surface conditions assume precedence. Ultimately, at intersection cross-sections [C4], lighting and utility poles, road barriers, and illuminated signs emerge as the highest-ranked priorities among the other safety factor categories under consideration.
Supplementary Materials
Author Contributions
Funding
Institutional Review Board Statement
Informed Consent Statement
Data Availability Statement
Acknowledgments
Conflicts of Interest
References
- Stoilova, S.; Munier, N. A novel fuzzy SIMUS multicriteria decision-making method. An application in railway passenger transport planning. Symmetry 2021, 13, 483. [Google Scholar] [CrossRef]
- Kizielewicz, B.; Więckowski, J.; Sałabun, W. SESP-SPOTIS: Advancing Stochastic Approach for Re-identifying MCDA Models. In Proceedings of the International Conference on Computational Science, Malaga, Spain, 2–4 July 2024; Springer: Berlin/Heidelberg, Germany, 2024; pp. 281–295. [Google Scholar]
- Shekhovtsov, A.; Salabun, W. Comparing Global and Local Weights in Multi-Criteria Decision-Making: A COMET-Based Approach. In Proceedings of the ICAART, Rome, Italy, 24–26 February 2024; pp. 470–477. [Google Scholar]
- Więckowski, J.; Kizielewicz, B.; Shekhovtsov, A.; Sałabun, W. RANCOM: A novel approach to identifying criteria relevance based on inaccuracy expert judgments. Eng. Appl. Artif. Intell. 2023, 122, 106114. [Google Scholar] [CrossRef]
- Aminbakhsh, S.; Gunduz, M.; Sonmez, R. Safety risk assessment using analytic hierarchy process (AHP) during planning and budgeting of construction projects. J. Saf. Res. 2013, 46, 99–105. [Google Scholar] [CrossRef] [PubMed]
- Dağdeviren, M.; Yüksel, İ. Developing a fuzzy analytic hierarchy process (AHP) model for behavior-based safety management. Inf. Sci. 2008, 178, 1717–1733. [Google Scholar] [CrossRef]
- Yu, R.; Ma, L. Risk evaluation of mega infrastructure construction supply chain in engineering-procurement-construction projects: An integrated fuzzy AHP and fuzzy DEMATEL approach. Eng. Constr. Archit. Manag. 2024, ahead of print. [Google Scholar] [CrossRef]
- Getawa Ayalew, G.; Admasu Alemneh, L.; Melkamu Ayalew, G. Exploring fuzzy AHP approaches for quality management control practices in public building construction projects. Cogent Eng. 2024, 11, 2326765. [Google Scholar] [CrossRef]
- Vahedi Nikbakht, M.; Gheibi, M.; Montazeri, H.; Yeganeh Khaksar, R.; Moezzi, R.; Vadiee, A. Identification and Ranking of Factors Affecting the Delay Risk of High-Rise Construction Projects Using AHP and VIKOR Methods. Infrastructures 2024, 9, 24. [Google Scholar] [CrossRef]
- Kong, H.-Q.; Zhang, N. Risk assessment of water inrush accident during tunnel construction based on FAHP-I-TOPSIS. J. Clean. Prod. 2024, 449, 141744. [Google Scholar] [CrossRef]
- Solanki, A.; Sarkar, D.; Shah, D. Evaluation of factors affecting the effective implementation of Internet of Things and cloud computing in the construction industry through WASPAS and TOPSIS methods. Int. J. Constr. Manag. 2024, 24, 226–239. [Google Scholar] [CrossRef]
- Zegeer, C.V. Identification of Hazardous Locations on City Streets. 1975. Available online: https://uknowledge.uky.edu/cgi/viewcontent.cgi?referer=&httpsredir=1&article=2105&context=ktc_researchreports (accessed on 25 March 2024).
- Montella, A. A comparative analysis of hotspot identification methods. Accid. Anal. Prev. 2010, 42, 571–581. [Google Scholar] [CrossRef]
- Geurts, K.; Wets, G. Black Spot Analysis Methods: Literature Review. 2003. Available online: http://hdl.handle.net/1942/5004 (accessed on 22 March 2024).
- Elvik, R. State-of-the-Art Approaches to Road Accident Black Spot Management and Safety Analysis of Road Networks; Transportøkonomisk Institutt: Oslo, Norway, 2007. [Google Scholar]
- Agarwal, P.K.; Patil, P.K.; Mehar, R. A methodology for ranking road safety hazardous locations using analytical hierarchy process. Procedia-Soc. Behav. Sci. 2013, 104, 1030–1037. [Google Scholar] [CrossRef]
- Habibian, M.; Mesbah, M.; Sobhani, A. Ranking of hazardous road locations in two-lane two-way rural roads with no crash record. In Proceedings of the Australasian Transport Research Forum, Adelaide, Australia, 28–30 September 2011. [Google Scholar]
- Wood, D.P.; Simms, C.K. Car size and injury risk: A model for injury risk in frontal collisions. Accid. Anal. Prev. 2002, 34, 93–99. [Google Scholar] [CrossRef] [PubMed]
- Jovanis, P.P.; Chang, H.-L. Disaggregate model of highway accident occurrence using survival theory. Accid. Anal. Prev. 1989, 21, 445–458. [Google Scholar] [CrossRef] [PubMed]
- Blower, D.; Campbell, K.L.; Green, P.E. Accident rates for heavy truck-tractors in Michigan. Accid. Anal. Prev. 1993, 25, 307–321. [Google Scholar] [CrossRef]
- Hewett, N.; Golightly, A.; Fawcett, L.; Thorpe, N. Bayesian inference for a spatio-temporal model of road traffic collision data. J. Comput. Sci. 2024, 80, 102326. [Google Scholar] [CrossRef]
- Parry, K.; Hazelton, M.L. Bayesian inference for day-to-day dynamic traffic models. Transp. Res. Part B Methodol. 2013, 50, 104–115. [Google Scholar] [CrossRef]
- Więckowski, J.; Sałabun, W.; Kizielewicz, B.; Bączkiewicz, A.; Shekhovtsov, A.; Paradowski, B.; Wątróbski, J. Recent advances in multi-criteria decision analysis: A comprehensive review of applications and trends. Int. J. Knowl.-Based Intell. Eng. Syst. 2023, 27, 367–393. [Google Scholar] [CrossRef]
- Ahmed, H.Y.; Othman, A.M.; Wahaballa, A. Traffic Accident Analysis & Modelling for Upper Egypt Rural Roads. MEJ. Mansoura Eng. J. 2021, 31, 1–10. [Google Scholar]
- Wahaballa, A.M.; Diab, A.; Gaber, M.; Othman, A.M. Sensitivity of traffic accidents mitigation policies based on fuzzy modeling: A case study. In Proceedings of the 2017 IEEE 20th International Conference on Intelligent Transportation Systems (ITSC), Yokohama, Japan, 16–19 October 2017; IEEE: Piscataway Township, NJ, USA, 2017; pp. 1–6. [Google Scholar]
- Shokry, S.; Rashwan, N.K.; Hemdan, S.; Alrashidi, A.; Wahaballa, A.M. Characterization of traffic accidents based on long-horizon aggregated and disaggregated data. Sustainability 2023, 15, 1483. [Google Scholar] [CrossRef]
- Gaber, M.; Diab, A.; Elbeltagi, E.E.; Wahaballa, A.M. Integrated Safety-Pavement Maintenance Management System (SPMS) for Local Authorities in Egypt. JES. J. Eng. Sci. 2023, 51, 125–147. [Google Scholar] [CrossRef]
- Saaty, T.L. The Analytic Hierarchy Process: Planning, Priority Setting. In Resource Allocation; Analytic Hierarchy Process Series, Multicriteria Decision Making; RWS Publications: Pittsburgh, PA, USA, 1990; Volume 1, p. 1. [Google Scholar]
- Kaur, B.; Bhatia, R. Prioritizing parameters for software project selection using analytical hierarchical process. Int. J. Comput. Appl. 2015, 118, 36–40. [Google Scholar] [CrossRef]
- Lee, M.-C.; Wang, H.-W.; Wang, H.-Y. A method of performance evaluation by using the analytic network process and balanced score car. In Proceedings of the 2007 International Conference on Convergence Information Technology (ICCIT 2007), Gyeongju, Republic of Korea, 21–23 November 2007; IEEE: Piscataway Township, NJ, USA, 2007; pp. 235–240. [Google Scholar]
- Τsolaki-Fiaka, S.; Bathrellos, G.D.; Skilodimou, H.D. Multi-criteria decision analysis for an abandoned quarry in the Evros Region (NE Greece). Land 2018, 7, 43. [Google Scholar] [CrossRef]
- McConnell, S. Software Estimation: Demystifying the Black Art; Microsoft Press: Unterschleissheim, Germany, 2006. [Google Scholar]
- Gamal, Y.A.; Saber, A.M. Analyzing the application of the analytical hierarchy process in developing a robust risk management framework for construction projects in Egypt. Asian J. Civ. Eng. 2024, 25, 3729–3745. [Google Scholar] [CrossRef]
- Ishizaka, A.; Labib, A. Review of the main developments in the analytic hierarchy process. Expert Syst. Appl. 2011, 38, 14336–14345. [Google Scholar] [CrossRef]
- Zadeh, L.A. A fuzzy-algorithmic approach to the definition of complex or imprecise concepts. Int. J. Man-Mach. Stud. 1976, 8, 249–291. [Google Scholar] [CrossRef]
- Zimmermann, H.-J. Fuzzy Set Theory—And Its Applications; Springer Science & Business Media: Berlin/Heidelberg, Germany, 2011. [Google Scholar]
- Sun, B.; Tang, J.; Yu, D.; Song, Z.; Wang, P. Ecosystem health assessment: A PSR analysis combining AHP and FCE methods for Jiaozhou Bay, China1. Ocean. Coast. Manag. 2019, 168, 41–50. [Google Scholar] [CrossRef]
- Hwang, C.-L.; Yoon, K.; Hwang, C.-L.; Yoon, K. Methods for multiple attribute decision making. In Multiple Attribute Decision Making: Methods and Applications a State-of-the-Art Survey; Springer: Berlin/Heidelberg, Germany, 1981; pp. 58–191. [Google Scholar]


| Serial | Hazard Location Code | Description of Hazard Location |
|---|---|---|
| 1 | C1 | Narrow bridges |
| 2 | C2 | Curve section |
| 3 | C3 | Non-interesection |
| 4 | C4 | interesection |
| Ser | Safey Factor Code | Safety Factor | Photo | Remark |
|---|---|---|---|---|
| 1 | HF1 | Illuminated Road Signs [Light Ramp Signs, Road Signs] |  | Light Ramp Signs |
 | Road Signs | |||
| 2 | HF2 | Guideposts |  | |
| 3 | HF3 | Light Utility Poles |  | |
| 4 | HF4 | Raised Road Marks |  | |
| 5 | HF5 | Road Barriers [Guardrail, Concrete Barriers] |  | Guardrail |
 | Concrete barriers | |||
| 6 | HF6 | Plastic Pedestrian |  | |
| 7 | HF7 | Temporary Traffic Control Devices [“Delineator Tubes” and “Traffic Cones”] |  | Delineator Tubes |
 | Traffic Cones | |||
| 8 | HF8 | Surface Conditions | 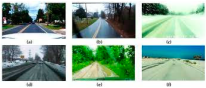 | |
| 9 | HF9 | Geometric Conditions |  |
| Linguistic Variable | Fuzzy Numbers |
|---|---|
| Equally important | (1, 1, 1) |
| Weakly important | (2, 3, 4) |
| Fairly important | (4, 5, 6) |
| Strongly important | (6, 7, 8) |
| Absolutely important | (9, 9, 9) |
| The intermittent values between two adjacent scales | (1, 2, 3) |
| (3, 4, 5) | |
| (5, 6, 7) | |
| (7, 8, 9) |
| HF 1 | HF 2 | HF 3 | HF 4 | HF 5 | HF 6 | HF 7 | HF 8 | HF 9 | |
|---|---|---|---|---|---|---|---|---|---|
| HF 1 | (1.0, 1.0, 1.0) | (5, 5.4, 5.8) | (2.4, 3, 3.6) | (4, 4.6, 5.2) | (3.2, 4.0, 4.8) | (5.3, 6.0, 6.7) | (4.3, 5.0, 5.7) | (3.6, 4.2, 4.8) | (3.1, 3.8, 4.5) |
| HF 2 | (2.1, 2.8, 3.5) | (1.0, 1.0, 1.0) | (2.9, 3.6, 4.3) | (2.5, 3.0, 3.5) | (4.4, 5.4, 6.4) | (4.3, 4.8, 5.3) | (4.3, 4.8, 5.3) | (3.8, 4.8, 5.8) | (3.0, 3.8, 4.6) |
| HF 3 | (3.8, 4.2, 4.6) | (3.6, 4.2, 5) | (1.0, 1.0, 1.0) | (6.0, 6.2, 6.4) | (4.1, 4.6, 5.1) | (6.0, 6.4, 6.8) | (5.1, 5.6, 6.1) | (4.0, 4.4, 4.8) | (4.5, 5.0, 5.5) |
| HF 4 | (2.5, 3.2, 3.9) | (2.8, 3.2, 3.6) | (2.1, 2.8, 3.5) | (1.0, 1.0, 1.0) | (2.7, 3.4, 4.1) | (4.3, 4.8, 5.3) | (4.2, 4.8, 5.4) | (3.6, 4.4, 5.2) | (2.6, 3.2, 3.8) |
| HF 5 | (3.6, 4.4, 5.2) | (4.2, 5, 5.8) | (1.8, 2.4, 3) | (3.3, 4.0, 4.7) | (1.0, 1.0, 1.0) | (7.8, 8.2, 8.6) | (6.1, 6.8, 7.5) | (5.2, 5.8, 6.4) | (4.4, 5.0, 5.6) |
| HF 6 | (3, 3.8, 4.6) | (2.5, 3.2, 3.9) | (1.7, 2.4, 3.1) | (2.5, 2.4, 3.1) | (2.0, 3.0, 4.0) | (1.0, 1.0, 1.0) | (3.4, 3.8, 4.2) | (3.3, 4.2, 5.1) | (3.0, 3.8, 4.6) |
| HF 7 | (2.8, 3.6, 4.4) | (3.1, 3.8, 4.5) | (1.7, 2.4, 3.1) | (2.3, 3.0, 3.7) | (1.9, 2.8, 3.7) | (1.9, 2.4, 2.9) | (1.0, 1.0, 1.0) | (3.8, 4.8, 5.8) | (4.4, 5.2, 6.0) |
| HF 8 | (3.4, 4, 4.6) | (4.5, 5.4, 6.3) | (2.2, 2.8, 3.4) | (3.2, 4.0, 4.8) | (2.2, 3.0, 3.8) | (4.1, 5.0, 2.9) | (4.2, 5.2, 6.2) | (1.0, 1.0, 1.0) | (5.4, 5.8, 6.2) |
| HF 9 | (3.9, 4.6, 5.3) | (4.1, 4.8, 5.5) | (2.4, 3.2, 4) | (3.0, 3.6, 4.2) | (2.1, 2.8, 3.5) | (3.8, 4.6, 5.4) | (3.3, 4.2, 5.1) | (1.7, 2.4, 3.1) | (1.0, 1.0, 1.0) |
| SUM | (26.1, 31.6, 37.1) | (30.8, 36,41.2) | (18.2,23.6, 29) | (27, 32.6, 37.4) | (23.6,30, 36.4) | (38.5,43.2,47.9) | (35.9,41.2,46.5) | (30, 36, 42) | (31.4,36.6,41.8) |
| Risk Factor Code | Fuzzy Geometric Mean Value (gi) | Fuzzy Weights Wi | Center of Area (COA) | Normalized Wj |
|---|---|---|---|---|
| HF 1 | (3.237, 3.739, 4.226) | (0.090, 0.119, 0.159) | 0.123 | 0.119 |
| HF 2 | (2.891, 3.447, 3.984) | (0.080, 0.110, 0.150) | 0.113 | 0.110 |
| HF 3 | (3.8489, 4.188, 4.521) | (0.107, 0.133, 0.170) | 0.137 | 0.133 |
| HF 4 | (2.662, 3.162, 3.646) | (0.074, 0.101, 0.137) | 0.104 | 0.101 |
| HF 5 | (3.585, 4.119, 4.633) | (0.099, 0.131, 0.175) | 0.135 | 0.131 |
| HF 6 | (2.345, 2.951, 3.529) | (0.065, 0.094, 0.133) | 0.097 | 0.094 |
| HF 7 | (2.333, 2.942, 3.529) | (0.065, 0.094, 0.133) | 0.097 | 0.094 |
| HF 8 | (3.038, 3.630, 4.201) | (0.084, 0.116, 0.158) | 0.119 | 0.116 |
| HF 9 | (2.585, 3.178, 3.749) | (0.072, 0.101, 0.141) | 0.105 | 0.102 |
| Total | (26.525, 31.356, 36.020) | 1.031 | 1 | |
| Inverse | (0.038, 0.032, 0.028) | |||
| Increasing Order | (0.028, 0.032, 0.038) |
| Code of Hazard Conditions | Fuzzy Geometric Mean Value (gi) | Fuzzy Weights Wi | Center of Area (COA) | Normalized Wi |
|---|---|---|---|---|
| C1 | (2.557, 2.797, 3.028) | (0.230, 0.279, 0.340) | 0.283 | 0.279 |
| C2 | (2.466, 2.634, 2.796) | (0.222, 0.263, 0.314) | 0.266 | 0.262 |
| C3 | (1.679, 2.121, 2.534) | (0.151, 0.211, 0.285) | 0.215 | 0.212 |
| C4 | (2.201, 2.80, 2.748) | (0.198, 0.247, 0.309) | 0.251 | 0.247 |
| Total | (8.902, 10.031, 11.106) | 1.016 | 1 | |
| Inverse | (0.112, 0.099, 0.090) | |||
| Increasing Order | (0.090, 0.0996, 0.1123) |
| Code of Hazard Conditions | Fuzzy Geometric Mean Value (gi) | Fuzzy Weights Wi | Center of Area (COA) | Normalized Wi |
|---|---|---|---|---|
| C1 | (2.144, 2.402, 2.648) | (0.197, 0.244, 0.303) | 0.248 | 0.244 |
| C2 | (2.860, 3.0489, 3.233) | (0.263, 0.31, 0.36709) | 0.314 | 0.309 |
| C3 | (1.651, 2.031, 2.385) | (0.152, 0.207, 0.271) | 0.210 | 0.207 |
| C4 | (2.095, 2.354, 2.601) | (0.193, 0.239, 0.297) | 0.243 | 0.239 |
| Total | (8.750, 9.835, 10.867) | 1.016 | 1 | |
| Inverse | (0.1142, 0.1016, 0.092) | |||
| Increasing Order | (0.092, 0.101, 0.114) |
| Code of Hazard Conditions | Fuzzy Geometric Mean Value (gi) | Fuzzy Weights Wi | Center of Area (COA) | Normalized Wi |
|---|---|---|---|---|
| C1 | (2.413, 2.683, 2.941) | (0.215, 0.262, 0.321) | 0.266 | 0.262 |
| C2 | (2.640, 2.811, 2.977) | (0.235, 0.274, 0.325) | 0.278 | 0.274 |
| C3 | (1.714, 2.149, 2.554) | (0.152, 0.21, 0.279) | 0.214 | 0.211 |
| C4 | (2.402, 2.592, 2.773) | (0.214, 0.253, 0.302) | 0.256 | 0.253 |
| Total | (9.170, 10.235, 11.24) | 1.014 | 1 | |
| Inverse | (0.109, 0.098, 0.088) | |||
| Increasing Order | (0.088, 0.098, 0.109) |
| Code of Hazard Conditions | Fuzzy Geometric Mean Value (gi) | Fuzzy Weights Wi | Center of Area (COA) | Normalized Wi |
|---|---|---|---|---|
| C1 | (2.343, 2.640, 2.923) | (0.201, 0.252, 0.3176) | 0.256 | 0.252 |
| C2 | (2.967, 3.179, 3.385) | (0.254, 0.303, 0.837) | 0.308 | 0.302 |
| C3 | (1.867, 2.302, 2.708) | (0.158, 0.219, 0.129) | 0.224 | 0.220 |
| C4 | (2.045, 2.367, 2.672) | (0.175, 0.226, 0.2897) | 0.230 | 0.226 |
| Total | (9.222, 10.487, 11.687) | 1.019 | 1 | |
| Inverse | (0.108, 0.095, 0.085) | |||
| Increasing Order | (0.086, 0.095, 0.108) |
| Code of Hazard Conditions | Fuzzy Geometric Mean Value (gi) | Fuzzy Weights Wi | Center of Area (COA) | Normalized Wi |
|---|---|---|---|---|
| C1 | (2.619, 2.847, 3.068) | (2.225, 0.269, 0.325) | 0.273 | 0.269 |
| C2 | (2.707, 2.876, 3.039) | (0.232, 0.272, 0.322) | 0.276 | 0.271 |
| C3 | (2.037, 2.459, 2.856) | (0.175, 0.233, 0.303) | 0.237 | 0.233 |
| C4 | (2.066, 2.387, 2.695) | (0.177, 0.226, 0.286) | 0.230 | 0.226 |
| Total | (9.429, 10.568, 11.658) | 1.015 | 1 | |
| Inverse | (0.106, 0.095, 0.086) | |||
| Increasing Order | (0.086, 0.0945, 0.1060) |
| Code of Hazard Conditions | Fuzzy Geometric Mean Value (gi) | Fuzzy Weights Wi | Center of Area (COA) | Normalized Wi |
|---|---|---|---|---|
| C1 | (2.330, 2.554, 2.771) | (0.216, 0.265, 0.327) | 0.269 | 0.264 |
| C2 | (2.221, 2.493, 2.753) | (0.206, 0.258, 0.325) | 0.263 | 0.258 |
| C3 | (1.749, 2.180, 2.582) | (0.162, 0.226, 0.304) | 0.231 | 0.227 |
| C4 | (2.182, 2.428, 2.664) | (0.203, 0.252, 0.314) | 0.256 | 0.251 |
| Total | (8.482, 9.655, 10.769) | 1.019 | 1 | |
| Inverse | (0.117, 0.104, 0.092) | |||
| Increasing Order | (0.092, 0.103, 0.117) |
| Code of Hazard Conditions | Fuzzy Geometric Mean Value (gi) | Fuzzy Weights Wi | Center of Area (COA) | Normalized Wi |
|---|---|---|---|---|
| C1 | (2.457, 2.688, 2.909) | (0.220, 0.268, 0.330) | 0.273 | 0.268 |
| C2 | (2.321, 2.551, 2.772) | (0.208, 0.255, 0.314) | 0.259 | 0.254 |
| C3 | (1.787, 2.219, 2.621) | (0.160, 0.222, 0.297) | 0.226 | 0.222 |
| C4 | (2.250, 2.556, 2.850) | (0.202, 0.255, 0.323) | 0.260 | 0.255 |
| Total | (8.816, 10.013, 11.151) | 1.018 | 1 | |
| Inverse | (0.1134, 0.099, 0.089) | |||
| Increasing Order | (0.089, 0.099, 0.113) |
| Code of Hazard Conditions | Fuzzy Geometric Mean Value (gi) | Fuzzy Weights Wi | Center of Area (COA) | Normalized Wi |
|---|---|---|---|---|
| C1 | (2.158, 2.370, 2.575) | (0.203, 0.247, 0.304) | 0.252 | 0.247 |
| C2 | (2.513, 2.773, 3.021) | (0.237, 0.290, 0.357) | 0.294 | 0.289 |
| C3 | (1.828, 2.220, 2.590) | (0.172, 0.231, 0.306) | 0.237 | 0.233 |
| C4 | (1.972, 2.207, 2.424) | (0.186, 0.231, 0.287) | 0.234 | 0.230 |
| Total | (8.471, 9.570, 10.613) | 1.017 | 1 | |
| Inverse | (0.118, 0.104, 0.094) | |||
| Increasing Order | (0.094, 0.104, 0.118) |
| Code of Hazard Conditions | Fuzzy Geometric Mean Value (gi) | Fuzzy Weights Wi | Center of Area (COA) | Normalized Wi |
|---|---|---|---|---|
| C1 | (2.2676, 2.423, 2.574) | (0.212, 0.250, 0.298) | 0.253 | 0.249 |
| C2 | (2.505, 2.769, 3.022) | (0.234, 0.286, 0.350) | 0.290 | 0.285 |
| C3 | (1.935, 2.316, 2.672) | (0.181, 0.239, 0.309) | 0.243 | 0.239 |
| C4 | (1.938, 2.190, 2.425) | (0.181, 0.2261, 0.281) | 0.229 | 0.225 |
| Total | (8.644, 9.696, 10.693) | 1.0151 | 1 | |
| Inverse | (0.115, 0.103, 0.093) | |||
| Increasing Order | (0.093, 0.104, 0.116) |
| HF 1 | HF 2 | HF 3 | HF 4 | HF 5 | HF 6 | HF 7 | HF 8 | HF 9 | Si+ | Si− | Pi | Rank | |
|---|---|---|---|---|---|---|---|---|---|---|---|---|---|
| C1 | 0.066 | 0.053 | 0.069 | 0.050 | 0.070 | 0.050 | 0.050 | 0.057 | 0.050 | 0.02 | 0.03 | 0.572 | 2 |
| C2 | 0.062 | 0.067 | 0.072 | 0.060 | 0.071 | 0.049 | 0.048 | 0.067 | 0.058 | 0.00 | 0.04 | 0.896 | 1 |
| C3 | 0.050 | 0.045 | 0.056 | 0.044 | 0.061 | 0.043 | 0.042 | 0.054 | 0.048 | 0.04 | 0.00 | 0.074 | 4 |
| C4 | 0.059 | 0.052 | 0.067 | 0.045 | 0.059 | 0.047 | 0.048 | 0.053 | 0.046 | 0.03 | 0.02 | 0.352 | 3 |
| V+ | 0.066 | 0.067 | 0.072 | 0.060 | 0.071 | 0.050 | 0.050 | 0.067 | 0.058 | ||||
| V− | 0.050 | 0.045 | 0.056 | 0.044 | 0.059 | 0.043 | 0.042 | 0.053 | 0.046 |
| C1 | C2 | C3 | C4 | |
|---|---|---|---|---|
| HF 1 | 3 | 5 | 4 | 3 |
| HF 2 | 5 | 3 | 6 | 5 |
| HF 3 | 2 | 1 | 2 | 1 |
| HF 4 | 8 | 6 | 7 | 9 |
| HF 5 | 1 | 2 | 1 | 2 |
| HF 6 | 9 | 8 | 8 | 7 |
| HF 7 | 7 | 9 | 9 | 6 |
| HF 8 | 4 | 4 | 3 | 4 |
| HF 9 | 6 | 7 | 5 | 8 |
Disclaimer/Publisher’s Note: The statements, opinions and data contained in all publications are solely those of the individual author(s) and contributor(s) and not of MDPI and/or the editor(s). MDPI and/or the editor(s) disclaim responsibility for any injury to people or property resulting from any ideas, methods, instructions or products referred to in the content. |
© 2024 by the authors. Licensee MDPI, Basel, Switzerland. This article is an open access article distributed under the terms and conditions of the Creative Commons Attribution (CC BY) license (https://creativecommons.org/licenses/by/4.0/).
Share and Cite
Gamal, Y.A.S.; Mamdouh, E.; Wahaballa, A.M.; Elshaer, R.; Hemdan, S. Evaluation of Road Safety Hazard Factors in Egypt Using Fuzzy Analytical Hierarchy Order of Preference by Similarity to Ideal Solution Process. Sustainability 2024, 16, 9993. https://doi.org/10.3390/su16229993
Gamal YAS, Mamdouh E, Wahaballa AM, Elshaer R, Hemdan S. Evaluation of Road Safety Hazard Factors in Egypt Using Fuzzy Analytical Hierarchy Order of Preference by Similarity to Ideal Solution Process. Sustainability. 2024; 16(22):9993. https://doi.org/10.3390/su16229993
Chicago/Turabian StyleGamal, Yasser A. S., ElHassan Mamdouh, Amr M. Wahaballa, Raafat Elshaer, and Seham Hemdan. 2024. "Evaluation of Road Safety Hazard Factors in Egypt Using Fuzzy Analytical Hierarchy Order of Preference by Similarity to Ideal Solution Process" Sustainability 16, no. 22: 9993. https://doi.org/10.3390/su16229993
APA StyleGamal, Y. A. S., Mamdouh, E., Wahaballa, A. M., Elshaer, R., & Hemdan, S. (2024). Evaluation of Road Safety Hazard Factors in Egypt Using Fuzzy Analytical Hierarchy Order of Preference by Similarity to Ideal Solution Process. Sustainability, 16(22), 9993. https://doi.org/10.3390/su16229993