Abstract
A solution to reduce the consumption of raw materials and the generation of greenhouse gases is the partial replacement of clinker (the main constituent of cement) with supplementary cementitious materials. This study aimed to compare the reactivity of ten supplementary cementitious materials—synthetic/commercial ones and those from industrial and agricultural waste (eco-pozzolans). The characterization of the raw materials was carried out using X-ray fluorescence, the loss on ignition, X-ray diffraction, and the determination of the amorphous silica content and particle size distribution. The pozzolanicity assessment was carried out using the Frattini test (direct method) and electrical conductivity and pH tests (indirect method), with the latter presenting greater sensitivity and precision, enabling us to classify the pozzolan reactivity. Although synthetic/commercial pozzolans have higher silica content, the eco-pozzolans showed excellent reactivity results, thus indicating their use as sustainable pozzolans, presenting characteristics that enhance the performance of cement matrices and reduce the environmental impacts of production. Nyasil and rice leaf ash were the pozzolans that presented the greatest reactivity among those studied. The obtained results suggest that using industrial/agricultural waste like reactive pozzolans can help to mitigate the adverse impacts of cement production, address natural resource shortages, and promote a circular economy.
1. Introduction
The construction sector is currently considered one of the main contributors to climate change and natural resource consumption, being responsible for 40–50% of the global greenhouse gas emissions and 40–60% of the natural resource depletion [1,2].
The worldwide production of Portland cement amounts to around 4 billion tons per year, which places it as the main construction material consumed by human activity [3]. The clinker manufacturing process, as the main component of Portland cement, presents high energy demands due to the high temperature, with the consequent emission of greenhouse gases such as CO2. It is estimated that, for each ton of clinker, approximately 900 kg of CO2 is generated. These emissions correspond to 5–8% of the anthropogenic carbon dioxide generated worldwide [4,5,6,7]. In addition to high energy consumption and the emission of polluting gases, cement production is responsible for the high consumption of raw materials, causing the depletion of natural resources [8].
Given this context, global concern and the challenges faced by the cement industries have increased significantly. A solution to these issues is to reduce the consumption of raw materials and to diminish the generation of greenhouse gases through the partial replacement of clinker with supplementary cementitious materials (SCMs).
SCMs, which have been extensively studied, are, in many cases, natural and artificial pozzolans [9]. Pozzolans are siliceous or silico-aluminous materials that have little or no hydraulic activity but, when finely ground and in the presence of water, react with calcium hydroxide (Ca(OH)2) at room temperature to form compounds with binding properties [10,11].
The reaction between pozzolan and the calcium hydroxide produced by cement hydration results in the formation of additional C-(A)-S-H, which provides an improvement in the mechanical properties and reduces the pore size distribution in the cement matrix [12].
For this purpose, the materials used contain active silica in their composition, i.e., in an amorphous state, because, when the structure appears in crystalline form, its reactivity is low or null [13].
In addition to the presence of amorphous silica in the ash, the particle sizes of these pozzolans contribute to the filling of voids, making the material more cohesive, providing greater hydration of the cement particles, and increasing the amount of hydrated products [14,15]. The increase in the surface area of pozzolans impacts the reaction kinetics, due to their greater dissolution [9].
The partial replacement of Portland cement with alternative materials that have pozzolanic reactivity is already being carried out around the world [16]. Various industrial and agricultural residues are being studied as pozzolans to be incorporated into cement, thus seeking to reduce the consumption of raw materials and energy and the emission of greenhouse gases, in addition to providing improvements to the properties of cement [17,18,19].
Associated with the issue of reducing the environmental impacts, the use of these waste materials can also contribute to the circular economy, promoting the valorization of biomass, such as sugarcane bagasse. Research aligned with the use of these residues to generate by-products can contribute to increasing the added value of this biomass, developing a more sustainable environment, and also improving human health [20,21].
Some studies demonstrate the technical feasibility of using these residues in cement matrices, such as sugarcane bagasse ash [19,22,23], rice husk and rice straw ash [19,24,25], bamboo leaf ash [18,26], and active silica [27,28], among others, due to the presence of high levels of reactive amorphous silica.
One way to evaluate the reactivity of these residues is to use direct and indirect reactivity tests, such as the Frattini test (direct test to assess the pozzolanicity of the cement) and electrical conductivity test (indirect test).
The Frattini test evaluates the pozzolanicity through the chemical titration of the solution obtained from the filtration of the water + cement + pozzolan suspension, and this determines the Ca2+ and OH− concentrations. It is said that the cement passes the test if the concentration of Ca2+ in the solution is less than the saturation concentration [29,30].
Tashima et al. (2014) [31] proposed an indirect method of identifying pozzolanic reactivity through pH and electrical conductivity measurements over 7 days. In this method, aqueous suspensions are saturated with excess calcium hydroxide in the solid state, and the reduction in the pH and electrical conductivity values during the test period indicates the unsaturation of the suspension in relation to calcium hydroxide, due to the progress of the pozzolanic reaction.
Given the above context, this work aimed to evaluate the reactivity of ten SCMs, namely commercial ones and some coming from industrial and agricultural waste, aiming to present an alternative use for these residues that can both mitigate the environmental impacts generated in the cement sector and benefit the circular economy. Within the context of reactivity, this article presents an analysis of two pozzolanicity methods applied for this purpose: the Frattini test (direct method) and the indirect method based on electrical conductivity and pH measurements in Ca(OH)2/pozzolan aqueous suspensions.
2. Materials and Methods
2.1. Raw Materials
For this study, ten different materials were used (Table 1): 2 commercial pozzolans, 1 inert material containing crystalline silica in its composition, and 7 agro-industrial pozzolans. Among the commercial pozzolans were Nyasil 5 (amorphous nanosilica from the company Nyacol Nano Technologies (Ashland, MA, USA)) and Microsilica 920U (supplied by Elkem ASA Materials (Oslo, Norway)). The inert material used was Sikron 100 (ground quartz supplied by Sibelco Specialty Minerals (Antwerp, Belgium)). The agro-industrial pozzolans were ash from the stalks and straw of sugarcane (RB 867515), collected in Pirassununga (Brazil) (furnace at 600 °C for 1 h, with heating rate of 4 °C/min; grinding for 30 min in a ball mill) and ash from the stalks and straw of energy cane, collected in Santo Antônio de Posse (Brazil) (furnace at 600 °C for 1 h, with heating rate of 4 °C/min; grinding for 30 min in a ball mill). Moreover, ash from rice husks (fluidized bed combustion at 1000 °C for less than 1 min; grinding of the ash for 4 h in an industrial mill) and ash from rice straw (autocombustion at temperature lower than 750 °C for 4–6 h; grinding of the ash for 30 min in a ball mill), both obtained in Valencia (Spain), were used. Additionally, ash from bamboo leaves, obtained through a self-combustion process in Ilha Solteira, São Paulo (Brazil) (autocombustion at temperature lower than 750 °C for 4–6 h; grinding for 30 min in a ball mill) was used.

Table 1.
Raw materials.
In this study, analyses were conducted for two types of sugarcane, as they exhibit physiological differences. Sugarcane is primarily cultivated to produce sugar and ethanol due to the high sucrose content in the stalks. Energy cane, on the other hand, is focused on biomass and bioenergy production, with higher fiber content and a greater energy yield [32].
The chemical compositions of the raw materials were determined by an X-ray fluorescence spectrometer (model MiniPal4, Malvern PANalytical, Malvern, United Kingdom). The loss on ignition test was carried out at 1100 °C for 1 h, with a heating rate of 10 °C/min, in accordance with ASTM C114:18 [33]. The chemical compositions of the commercial pozzolans were provided by the manufacturing companies. X-ray diffraction (XRD) analysis was conducted to identify the material’s mineralogy. A Shimadzu XRD 6000 X-ray diffractometer was used (Shimadzu, Kyoto, Japan), with diffractograms recorded in the 2θ angle range from 5° to 70°, using Cu-Kα radiation with a wavelength of 1.54056 Å. The quantification of the amorphous silica content in the materials was conducted according to the standard UNE 80225 (1993) [34], with refinements developed and proposed by Payá et al. (2001) [35]. Particle size analyses were carried out using a laser particle size analyzer (Mastersizer Hydro 2000MU, Malvern PANalytical, Malvern, United Kingdom), with the particles being dispersed in distilled water.
2.2. Pozzolanic Reactivity Tests
2.2.1. Electrical Conductivity and pH Measurements
The electrical conductivity and pH test was carried out according to the method proposed by Tashima et al. [31]. When the system becomes unsaturated due to the total dissolution of calcium hydroxide (CH) in the solid state, the pH and conductivity values decrease due to the pozzolanic reaction with the dissolved Ca2+ and OH− ions, which form stable and insoluble products with the reactive silica/alumina from the pozzolan. The suspensions were composed of 1 g of solid material and 50 mL of water. The solid materials were composed of different mass ratios of CH/pozzolan (0.15:0.85; 0.2:0.8; 0.25:0.75; 0.3:0.7; 0.35:0.65; 0.4:0.6). A total of 60 suspensions were monitored. The solutions were kept for 7 days in a JULABO-SW22 (Julabo, Seelbach, Germany) thermal bath with agitation at a temperature of 60 °C. The pH values (pHmeter micro PH2001, Crison Instruments, Barcelona, Spain) and electrical conductivity (Crison micro CM2201, Crison Instruments, Barcelona, Spain) were measured at the following reaction times: 0, 4, 8, 24, 48, 72, 96, 120, 144, and 168 h. The electrical conductivity results were represented in terms of the conductivity loss (Lc (%), [34]). After 7 days, unsaturation is established when the Lc has a value greater than 30% in relation to a saturated suspension of standard calcium hydroxide and when the decrease in pH is greater than 0.15 units. In the graphics related to pH monitorization, [OH−] values were calculated from the pH data and represented vs. the reaction time.
For the electrical conductivity and pH measurements, a temperature of 60 °C was chosen because this temperature enhances the kinetics of the pozzolanic reaction between the dissolved Ca(OH)2 and the amorphous silica present in the ash. Thus, if the tested material does not exhibit reactivity at this temperature, it is unlikely to show reactivity at lower temperatures.
2.2.2. Frattini Test
The Frattini test was carried out in accordance with EN 196-5 [29]. For this test, 100 mL of boiled water was added to plastic pots, and the pots were sealed and placed in a thermal bath at 40 °C. After reaching thermal equilibrium, which happened in approximately 1 h, 20 g of solid material was inserted into the pots, in the proportions of 85% CEM I and 15% pozzolan and 75% CEM I and 25% pozzolan. The solutions remained in the thermal bath at 40 °C for 8 and 15 days. After 8 and 15 days, the samples were vacuum-filtered and titrated with HCl (0.1 mol/L) with the aid of the methyl orange indicator to obtain the [OH−] values; then, after the pH of the solution was adjusted to approximately 12.5, the calcon indicator was used and the solution was titrated with a 0.03 mol/L EDTA solution to obtain the [Ca2+] values.
The two methods were evaluated comparatively regarding their sensitivity for the analysis of the reactivity of each SCM.
3. Results and Discussion
3.1. Raw Material Characterization
The chemical compositions of the pozzolans are presented in Table 2.

Table 2.
Raw materials’ chemical compositions obtained through XRF analysis (wt. %) and loss on ignition (LOI) test.
The commercial pozzolans are composed almost entirely of silicon dioxide, with NY classified as amorphous silica and MS as active silica. The inert material SK is classified as ground quartz (this material was selected for comparison because it is a 100% crystalline silica and its reactivity can be considered null). SCSA is composed of approximately 63% potassium (as K2O), but it was subjected to a washing process to remove the potassium; thus, the silicon dioxide value increased, becoming the main component. This silica is derived from the structural part of the sugarcane, which helps to keep it upright. Magnesium, the second-largest component, is extracted by sugarcane in the late stages, where the chlorophyll molecules are composed of magnesium. The third-largest component is calcium, essential in the structure of the cell wall and for membrane integrity, in addition to performing other functions. Normally, for sugarcane to be cultivated, the soil goes through the liming process, where limestone is applied to it, which influences the amount of Ca in the cellular tissue of the plant.
SCLA has a greater amount of silica than the stalk of the same plant; this occurs because the silica absorbed by the plant is mainly concentrated in the epidermal tissue, just below the cuticle—more precisely, in the outermost cell walls. Silicon is related to the structure of the plant and an increase in the photosynthesis process, keeping the leaves more erect and thus avoiding self-shading, which increases the height of the plant due to the greater length of the leaf blade. As with the stem, the leaf also has high levels of calcium.
Like SCSA, ECSA had high potassium levels (47% as K2O) before washing. Potassium is the nutrient that is most absorbed by sugarcane/energy cane during its development. It has high mobility in plants, being absorbed by different parts of the plant, but in greater quantities by the stalk than by the leaves. After washing, ECSA presented approximately the same silica content as the washed SCSA.
ECLA presented silica content of approximately 65%, as expected, due to the structure of the energy cane leaf being similar to that of sugarcane.
RHA has high silicon dioxide content, approximately 86%, and silica is present in the external and internal epidermis and in the sclerenchyma of the rice husk. In RLA, half of its composition consisted of silica, at 52.44%; as with sugarcane, silica is also present in rice leaves and helps with photosynthesis. However, this pozzolan presented a high LOI value, which can explain its inefficient burning in boilers.
BLA’s main component is silicon dioxide (74.23%), and bamboo has erect leaves, which is facilitated by the presence of silica, similarly to sugarcane and energy cane.
The mineralogical compositions of the materials are illustrated in Figure 1 and detailed in Table 3.
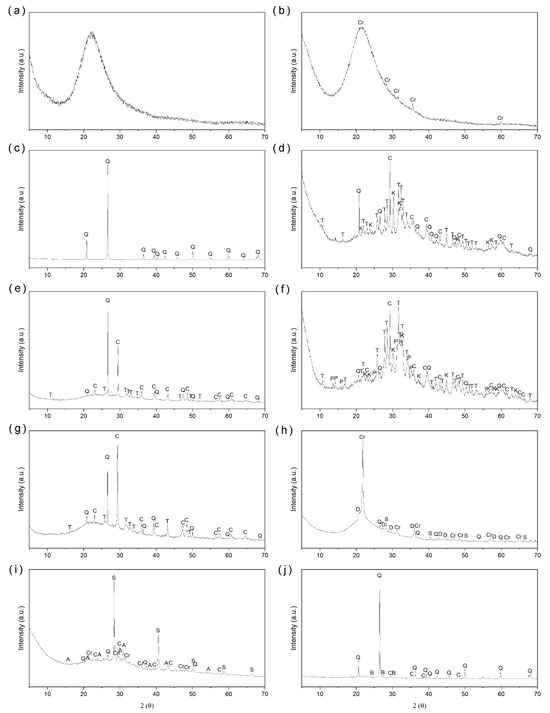
Figure 1.
X-ray diffractograms of the samples: (a) NY; (b) MS; (c) SK; (d) SCSA; (e) SCLA; (f) ECSA; (g) ECLA; (h) RHA; (i) RLA; and (j) BLA.

Table 3.
Mineralogical names of the minerals found in the studied materials.
The commercial pozzolan NY exhibits a significant baseline deviation, with no detectable degree of crystallinity, indicating that it is completely amorphous. Similarly, MS also shows a substantial baseline deviation, suggesting that it is almost entirely amorphous, except for cristobalite peaks that indicate the presence of crystalline silica. SK, an inert material in this study, is composed almost entirely of crystalline silica, observed in the mineralogical form of quartz.
The eco-pozzolans SCSA, SCLA, ECSA, and ECLA showed reduced soluble crystalline content after washing, although soil contamination left some crystalline impurities. Additionally, there was a significant increase in the baseline deviation, indicating the presence of amorphous material, particularly noticeable for SCSA and ECSA. Both SCSA and ECSA displayed potassium calcium phosphate along with calcite and quartz. SCLA and ECLA showed quartz and calcite, with no crystalline silicas from burning. This suggests that the temperature of 600 °C does not promote the crystallization of amorphous silica. Therefore, the silica present, except for quartz, is likely reactive amorphous silica.
RHA shows a significant amorphous halo between 15° and 30°, indicating the presence of amorphous material. However, crystalline peaks such as tridymite and cristobalite are also present, suggesting that the burning temperature may have been high enough to crystallize some of the amorphous silica, with quartz present due to soil contamination and sylvite.
In the analysis of RLA, the predominant phase was sylvite, identified by the prominent presence of chloride. Additionally, two crystalline compounds associated with silica were found: quartz and cristobalite. The baseline deviation, observed between 18° and 37°, was attributed to the presence of amorphous material.
BLA exhibited a baseline deviation, indicating that the material is amorphous and thus confirming the presence of amorphous silica. However, it also showed peaks corresponding to quartz, suggesting possible mineral contamination, as the samples were collected directly from the soil.
According to the procedures conducted in accordance with UNE 80225 (2012) [34] with the modification of Payá et al. (2001) [35], it was possible to determine the amounts of total silica and the fraction of this silica in the crystalline and amorphous states in the materials of this study. The treatment of 1 g of the pozzolan in 4M KOH boiling solution to dissolve the amorphous silica was carried out, and the remaining undissolved silica was determined by means of the Spanish standard [34]. Table 4 presents the obtained results.

Table 4.
Amounts of total silica and the fractions of crystalline and amorphous silica found in the selected raw materials (the sum of crystalline and amorphous silica is 100).
For all the analyzed materials, the percentage of total silica obtained is close to the values found by XRF. The pozzolanas NY, SK, ECSA, RLA, and BLA contain over 90% of the silica in their composition in an amorphous state, which is an excellent indicator of their pozzolanic reactivity.
Table 5 presents the cumulative particle diameters of 10% (D10), 50% (D50), and 90% (D90) and the mean particle size (Dm), and Figure S1 (Supplementary Materials) shows the particle size distributions of the pozzolans.

Table 5.
Particle diameters.
In relation to the NY sample, a Dm of 3.04 µm was obtained, with 100% of the volume being particles with a diameter of less than 10 µm. The MS sample presented a Dm of 36.63 µm, with approximately 17% of its volume being less than 10 µm and 34% less than 20 µm. Although MS is a commercial silica, it showed heterogeneity, presenting particles of a large size. SK had a Dm of 15.85 µm, with 85% of the volume having particles smaller than 10 µm and 95% smaller than 20 µm.
SCSA had a Dm of 15.31 µm, with 50% of the volume having particles smaller than 10 µm and 74% smaller than 20 µm. Although SCLA comes from the same plant, it had a higher Dm, being 19.14 µm, with 40% of the particles below 10 µm and 68% at 20 µm.
ECSA had a Dm of 13.52 µm, with 57% of the particles less than 10 µm and 83% less than 20 µm, while ECLA, as well as SCLA, had a Dm greater than that of ECSA, being 21.21 µm, with 32% of the particles less than 10 µm and 63% less than 20 µm.
RHA showed a Dm of 14.71 µm, with 56% less than 10 µm and 80% less than 20 µm. RLA, as with the other ashes from leaves (SCLA and ECLA), showed a Dm of 26.12 µm, greater than the ash from the husk of the same rice, with 29% of the particles exhibiting a volume of less than 10 µm and 53% less than 20 µm.
BLA presented a Dm of 27.33 µm, with 23% of the particles being less than 10 µm and 46% less than 20 µm.
NY was the pozzolan that had the smallest particle size, which was already expected since it is classified as a nanosilica. MS was the pozzolan with the largest particle size, probably because it exists in a densified state, which makes disaggregation difficult. The other pozzolans presented relatively similar sizes.
3.2. Pozzolanic Reactivity Tests
3.2.1. Electrical Conductivity and pH Studies
In the test proposed by Tashima et al. [31], during a period of 7 days, it is possible to observe a reduction in the pH and electrical conductivity values, which indicates that the system is becoming unsaturated due to the progress of the pozzolanic reaction.
Within this context, pozzolanic materials can be classified into three categories, with the first being characterized by those with low pozzolanic reactivity, which present a weak reaction of Ca+2 and OH− ions with pozzolans, thus not having considerable changes in their electric conductivity values, as the solution remains saturated. The second category corresponds to materials that remain saturated in the first few hours of the test, with small changes in electrical conductivity. However, the calcium hydroxide is consumed at more advanced reaction times, and the pH and conductivity values show significant reductions. The last category corresponds to highly reactive materials that present the rapid consumption of calcium hydroxide, with a reduction in the pH and electrical conductivity values in the first few hours of the test.
The electrical conductivity results are represented in terms of the conductivity loss (Lc (%)), being calculated according to Equations (1) and (2):
where
C0 = electrical conductivity of calcium hydroxide (CH) suspension without pozzolan addition;
Ct = electrical conductivity measured after t hours of reaction;
Ct,poz = electrical conductivity of pozzolan suspension (without CH) after t hours of reaction;
Ct,C = electrical conductivity corrected after t hours of reaction.
Figure 2a shows the conductivity loss for the CH/NY suspensions. All suspensions showed significant Lc values (%) during the 7 days of the test. The suspensions of 1.5:8.5, 2:8, 2.5:7.5, 3:7, and 3.5:6.5 showed values above 30% in the first hour of testing and the suspension of 4:6 after 8 h of reaction. Nyasil showed high pozzolanic reactivity, with high conductivity losses occurring in the first hour of testing. The pH results presented are only used to confirm the results obtained for the loss of conductivity.
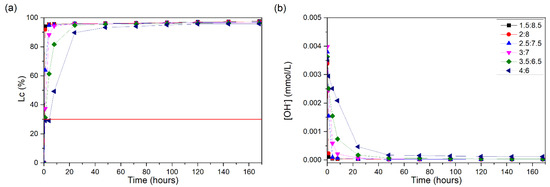
Figure 2.
CH/NY suspensions at 60 °C: (a) loss of electrical conductivity; (b) [OH−]. The red line indicates the minimum established value (Lc = 30%) for the suspension to be considered unsaturated.
Figure 3a presents the conductivity loss values for the CH/MS suspensions. Only the 1.5:8.5 and 2:8 suspensions showed conductivity losses greater than 30% in the first 8 h, reaching values, at the first day of testing, close to those presented after 7 days. For the 2.5:7.5 suspension, the unsaturation occurred in the period of 8–24 h. For the 3:7 suspension, the loss of conductivity reached 30% in approximately 24 h, whereas, for the 3.5:6.5 suspension, this occurred at approximately 80 h after the start of the test.
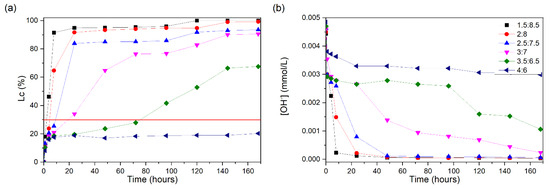
Figure 3.
CH/MS suspensions at 60 °C: (a) loss of electrical conductivity; (b) [OH−]. The red line indicates the minimum established value (Lc = 30%) for the suspension to be considered unsaturated.
The 4:6 suspension did not reach the 30% value, remaining between 16 and 20% from the beginning to the end of the test and, therefore, showing a saturated state of the suspension according to the described method. Although silica fume is considered a highly reactive pozzolan, in this test, it presents moderate reactivity. This is due to the particles being densified. Comparing the results of NY and MS, NY presents greater reactivity, although both present content of more than 95% of amorphous silica in their compositions. This occurs because NY has a smaller particle diameter, thus presenting a larger specific surface area for the pozzolanic reaction to occur. Observing the reductions in the values of OH− ions in Figure 3b, the electrical conductivity results are confirmed.
Figure 4a shows the obtained Lc (%) values for the different CH/SK ratios tested. As expected, Sikron did not show reactivity, regardless of the proportions studied, nor did it show significant changes in its conductivity loss values throughout the test. This occurs because SK is ground quartz, which is essentially composed of crystalline silica. As well as the loss of conductivity, it is not possible to observe significant reductions in the OH− values.
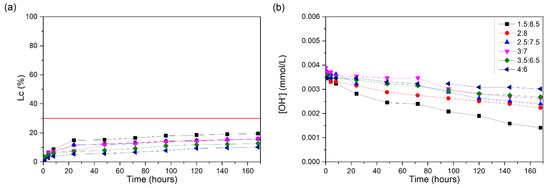
Figure 4.
CH/SK suspensions at 60 °C: (a) loss of electrical conductivity; (b) [OH−]. The red line indicates the minimum established value (Lc = 30%) for the suspension to be considered unsaturated.
The Lc values (%) for the different CH/SCSA ratios can be seen in Figure 5a. The only proportions that presented Lc (%) values greater than 30% were 1.5:8.5 and 2:8. The 1.5:8.5 suspension reached a value of 30% Lc (%) in the first hour of testing, reaching 47% at 4 h, and no major increases occurred until the end of the test (168 h), ending at 60%.
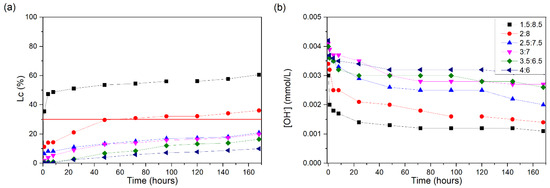
Figure 5.
CH/SCSA suspensions at 60 °C: (a) loss of electrical conductivity; (b) [OH−]. The red line indicates the minimum established value (Lc = 30%) for the suspension to be considered unsaturated.
The 2:8 suspension reached a value of 30% at approximately 60 h, while, at 168 h, it showed a 36% loss of conductivity. The proportions of 2.5:7.5, 3:7, 3.5:6.5, and 4:6 did not show significant increases, thus not reaching unsaturation.
SCSA does not contain a large proportion of SiO2, with 33.98% being total silica; of this silica, 86.05% is amorphous silica, which justifies the low reactivity of this material. Figure 5b presents the concentrations of OH in the solutions, and it is possible to see that only the concentrations for 1.5:8.5 and 2:8 are lower, close to 0.001 mmol/L, since only these two present unsaturation.
Figure 6a shows the Lc (%) values of the CH/SCLA suspensions. Among all the proportions presented, only 4:6 does not present results greater than 30%. The proportions of 1.5:8.5 and 2:8 present Lc (%) values above 30% at an early age (1 and 4 h, respectively), with the 1.5:8.5 suspension reaching a 94% Lc (%) at 24 h and the 2:8 suspension showing a 91% Lc (%) at 48 h.
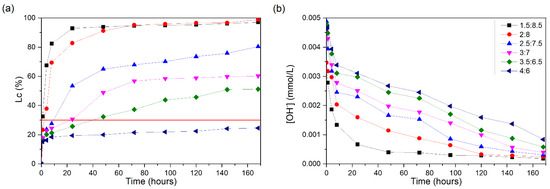
Figure 6.
CH/SCLA suspensions at 60 °C: (a) loss of electrical conductivity; (b) [OH−]. The red line indicates the minimum established value (Lc = 30%) for the suspension to be considered unsaturated.
The 2.5:7.5 suspension reached a value of 30% for the Lc (%) after approximately 10 h of testing; at 48 h, it presented a value of 65%, having, at the end of the test, Lc = 80%. The 3:7 suspension reached an Lc (%) of 30% at 24 h, reaching a 57% Lc (%) after 72 h and not showing a significant increase until the end of the test. The 3.5:6.5 suspension reached an Lc (%) of 30% after approximately 48 h of testing, reaching 51% at 168 h.
As expected, although they come from the same plant, SCLA presents greater reactivity than SCSA, as SCLA is composed of a greater amount of total silica, namely 59.49%, of which 81.45% is amorphous silica. The pH values (Figure 6b) decrease as the loss of conductivity increases.
The conductivity losses of the CH/ECSA suspensions are shown in Figure 7a. The 1.5:8.5 suspension shows a great increase in the first hour of the test, exceeding a 30% Lc (%). However, after the first hour, the increases are smaller, reaching a value of approximately 65% for the Lc (%) after 168 h. As with the 1.5:8.5 suspension, the 2:8 suspension presents a great loss of conductivity in the first hour of testing, reaching a value of 31% for the Lc (%); after this reaction time, the values gradually increase until they reach a 54% Lc (%) at the end of the test.
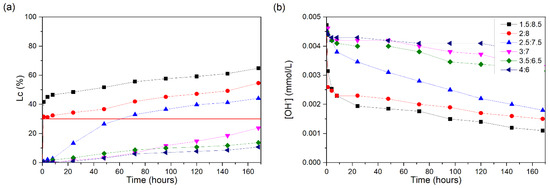
Figure 7.
CH/ECSA suspensions at 60 °C: (a) loss of electrical conductivity; (b) [OH−]. The red line indicates the minimum established value (Lc = 30%) for the suspension to be considered unsaturated.
The 2.5:7.5 suspension presents Lc (%) values of 30% at approximately 60 h after the start of the test, without a large increase after this period, thus reaching a final value of 44% Lc (%). The 3:7, 3.5:6.5, and 4:6 suspensions did not present Lc (%) values above 30%, meaning that the solution remained saturated after 168 h of testing. The OH− values (Figure 7b) obtained presented a similar trend, noting that 1.5:8.5 and 2:8 mixtures presented reductions of [OH−] close to 0.001 mmol/L at the end of the test.
Comparing SCSA and ECSA (both with similar SiO2 content), one can observe that ECSA showed slightly higher reactivity in terms of the pozzolanic reaction: the 2.5:7.5 suspension reached unsaturation for ECSA after 168 h, whereas SCSA presented Lc values lower than 20%. It is likely that the composition related to the other oxides (alkali and alkali-earth elements) contributed to this difference in behavior [36].
Figure 8a shows the conductivity losses of the CH/ECLA suspensions. It is possible to observe that only the 4:6 ratio does not reach an Lc of 30%, remaining constant throughout the test and reaching only a 21% loss of conductivity at the end of the test. The proportions of 1.5:8.5 and 2:8 showed a large increase in the Lc values in the first hour of testing, reaching 96 and 82%, respectively, in the first 24 h. The 1.5:8.5 suspension reached an Lc of 30% within 3 h of testing and the 2:8 suspension did so within 4 h.
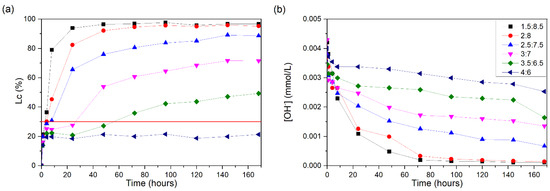
Figure 8.
CH/ECLA suspensions at 60 °C: (a) loss of electrical conductivity; (b) [OH−]. The red line indicates the minimum established value (Lc = 30%) for the suspension to be considered unsaturated.
The 2.5:7.5 suspension showed an Lc of 30% within 8 h of testing and an 88% loss of conductivity after 168 h. The 3:7 suspension showed a 30% Lc after 27 h of testing and 71% at the end. Although the 3.5:6.5 ratio showed a loss of more than 30%, it did not show significant increases, reaching the end of the test with a 49% Lc.
ECLA showed a greater loss of conductivity than ECSA; this is because straw ash contains 31% more silica. The pH values (Figure 8b) follow the electrical conductivity trends, so the greater the electrical conductivity loss, the lower the [OH−] values found.
When SCLA and ECLA were compared, it was noted that ECLA showed greater reactivity, although they presented similar amounts of amorphous silica, with a small increase for ECLA. The Lc values at the end of the test (168 h) for the ECLA sample were higher than for SCLA: approximately 90% vs. 80% for the 2:8 suspension and 70% vs. 60% for the 2.5:7.5 suspension.
For the CH/RHA suspensions tested, the conductivity loss curves are shown in Figure 9a. Unlike some pozzolans already presented, the 1.5:8.5 suspension for RHA required a somewhat longer amount of time to reach large increases in its conductivity loss values, reaching 30% in approximately 10 h and 80% in 48 h and presenting an Lc at the end of the test of 96%.
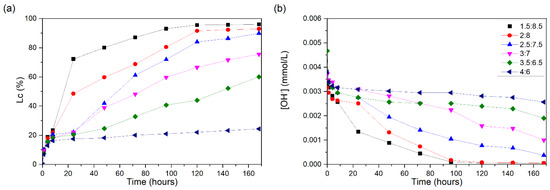
Figure 9.
CH/RHA suspensions at 60 °C: (a) loss of electrical conductivity; (b) [OH−]. The red line indicates the minimum established value (Lc = 30%) for the suspension to be considered unsaturated.
The 2:8 ratio reached an Lc of 30% after 13 h of testing, with a greater increase occurring at 24 h, reaching 48%; after this time, it reached 91% and remained stable because the solution presented low content of dissolved Ca(OH)2. The 2.5:7.5 suspension did not show considerable losses on the first day of testing, reaching 30% after approximately 33 h of testing, but, after more 24 h, there was a considerable increase in the Lc, reaching 89% after 168 h.
Like the previous suspension, the 3:7 one did not show significant increases in the first hour of testing, reaching a 75% Lc at the end of the test. The 3.5:6.5 suspension began to show more significant increases after 48 h, reaching a 30% Lc at 65 h and reaching 60% loss after 168 h. The 4:6 ratio did not show results equal to or greater than 30%, showing that the solution was saturated in Ca(OH)2.
The [OH−] values (Figure 9b) showed a similar trend to the conductivity results. Rice husk ash has 81.2% of its composition as silica; although it has a large amount, its reactivity at the beginning of the reaction time was significantly lower than that of active silica (Figure 3a). This may occur because of the total silica—only 38.79% is amorphous silica—in addition to the differences in the particle morphology: active silica particles are formed from the agglomeration of particles smaller than 1 µm in diameter [37], offering a greater surface area in contact with the solution. RHA presented a high LOI (6.99%), attributed to unburned carbon particles, which adhere to the surface of silica [38]. With the progress of the reaction, the reactive silica in RHA was available, and, at 168 h, the Lc values for the RHA suspensions were high, although they were lower than those for silica fume (e.g., the 3:7 suspension reached a 70% Lc for RHA, whereas that for silica fume was 90%).
The conductivity losses of the CH/RLA suspensions are shown in Figure 10a. The 1.5:2.8 suspension achieved a loss of 30% in 3 h and an 85% Lc after 24 h.
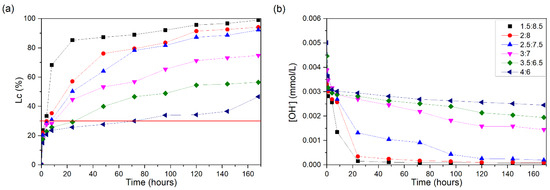
Figure 10.
CH/RLA suspensions at 60 °C: (a) loss of electrical conductivity; (b) [OH−]. The red line indicates the minimum established value (Lc = 30%) for the suspension to be considered unsaturated.
The 2:8 suspension showed a 30% Lc at approximately 5 h of testing and 83% at 96 h, while the 2.5:7.5 suspension reached a 30% Lc at 8 h and 81% at 96 h. The other suspensions showed more constant growth in the Lc, without abrupt increases. The 3:7 suspension reached 30% loss after 9 h, and, at the end of the test, it was 75%. Meanwhile, the 3.5:6.5 suspension reached a 30% Lc after 25 h of testing, reaching 56% after 168 h.
The last suspension analyzed, 4:6, remained almost stable during the test, having small increments and showing a loss of 30% at 72 h, but it showed a slightly greater increase between the penultimate and last day of testing, reaching a 46% Lc.
The [OH−] reduction values (Figure 10b) confirm the data presented. RLA presented 56.8% total silica in its composition, 24.4% lower than that of RHA (a different part of the same plant), but its reactivity appears to be higher. This may occur because, in RLA, although presenting a smaller amount of total silica, 81.20% is amorphous silica; thus, it must also contain a higher percentage of soluble components in its composition (e.g., K2O and chlorides), which induced differences in its behavior. The [OH−] monitoring results (Figure 9b) show that a reduction in this parameter for the 3:7 to 4:6 suspensions was not evident, which suggests that the presence of a high percentage of soluble salts in RLA strongly affected the measurement of the pozzolanic reactivity.
The conductivity losses of the CH/BLA suspensions are shown in Figure 11a. The 1.5:8.5 suspension showed rapid unsaturation, reaching a 30% Lc in 3 h of testing and an 86% Lc in 24 h. The 2:8 suspension also showed high Lc values, with 30% reached in the first 4 h of testing, 78% within 24 h and 88% at the end of the test. The 2.5:7.5 suspension had a large increase, but this occurred in 48 h, without presenting the rapid unsaturation of the system. In 9 h, it reached a 30% Lc; in 48 h, it reached 67%; and after 168 h, it reached a 78% Lc.
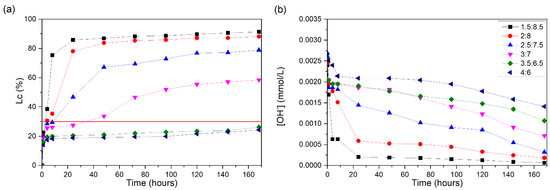
Figure 11.
CH/BLA suspensions at 60 °C: (a) loss of electrical conductivity; (b) [OH−]. The red line indicates the minimum established value (Lc = 30%) for the suspension to be considered unsaturated.
The loss of conductivity of the 3:7 suspension occurred slowly, reaching 30% at approximately 35 h after the start of the test and reaching a final loss of 58% after 168 h.
Among the suspensions presented, the 3.5:6.5 and 4:6 ones remained constant during the test, not presenting values greater than 26% for the Lc and thus remaining saturated. The pH values (Figure 11b) are in accordance with the loss of conductivity.
BLA is considered a highly reactive ash and is composed of 69.85% total silica, of which 92.33% is silica ash. Although RHA has a greater amount of total silica in its composition, BLA presented a rapid pozzolanic reaction, while RHA presented a higher level of unsaturation after 168 h. This is due to the amorphous nature of the silica present.
Although BLA has a larger amount of total silica and amorphous silica, RLA exhibits superior reactivity in proportions with lower ash content. This can be explained by the fact that, despite both having a similar average particle size, RLA contains a larger amount of smaller particles, which contributes to greater reactivity in the solution.
Analyzing the results obtained for all pozzolans in this study, classification is carried out according to the reactivity, in terms of the loss in electrical conductivity (Lc) and pH. A safety margin of 30% loss of conductivity or Lc (%) is used; therefore, suspensions that presented an Lc above this value are considered unsaturated in calcium hydroxide and those below 30% are saturated. This allows us to calculate the time required for the suspension to reach 30% and be considered unsaturated (tuns (h)).
We achieve this in a similar way with the pH values, where we identify the pH value of the suspension when it reaches an Lc of 30%, and we obtain the difference (∆pH) compared to the initial pH (when t = 0); in the case of differences ≥ 0.15 units, they were recorded as they represented the unsaturation of the CH/pozzolan suspensions.
Table 6 presents the results obtained for ∆pH and the unsaturation time (tuns) of the analyzed suspensions. We can observe that NY presented unsaturation for all proportions and this occurred earlier in time than for the other pozzolans analyzed. In addition to NY, the only material that presented reactivity above 30% for all proportions was RLA.

Table 6.
∆pH values and unsaturation times (tuns) for all tested suspensions.
In addition to the amount of silica fume present in pozzolans, the surface area is another factor that contributes positively to the consumption of calcium hydroxide. NY has the smallest diameter among the pozzolans studied, consequently presenting a larger surface area and high levels of amorphous silica. RLA pozzolans have a large diameter compared to other pozzolans; however, they present an excellent level of amorphous silica.
The pozzolans were classified according to a reported template [31]. For the 60 °C test, there are three zones for this classification: low reactivity (zone 1) for samples in which the 3:7 suspension did not reach unsaturation after 168 h; medium reactivity (zone 2) for samples in which the 4:6 suspension was not unsaturated and presented unsaturation for the 3:7 and/or 3.5:6.5 suspensions; and high reactivity (zone 3) for those cases in which the 4:6 suspension reached unsaturation. For a given pozzolan, when a mark has been placed in zone 3, this pozzolan should be considered a high-reactivity material.
In the tables, the symbol is shown in the last area where the suspension showed unsaturation. From the area in which this symbol appeared, the reactivity was determined. Table 7 and Table 8 present the symbols for each pozzolan and the final reactivity classification.

Table 7.
Zone classification model completed for all pozzolans analyzed.

Table 8.
Symbols assigned to each material and final classification according to Tashima’s method.
3.2.2. Frattini Test
Figure 12 presents the results obtained by the Frattini method [29]. The graph shows (test time of 8 and 15 days), for each percentage of replacement (15 and 25%) of CEM I with pozzolans (by mass), the remaining concentration of calcium ions, expressed as calcium oxide, versus the remaining concentration of hydroxyl ions in the sample solutions kept in a sealed container at 40 °C. These values are compared with a curve representing a saturated solution with the mentioned ions at the same temperature.
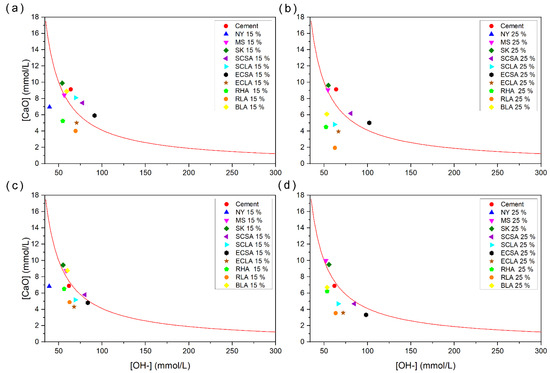
Figure 12.
Frattini tests: (a) at 8 days with 15% replacement; (b) at 8 days with 25% replacement; (c) at 15 days with 25% replacement; and (d) at 15 days with 25% replacement. The red line represents the saturation curve from the Frattini test.
At 8 days, the replacement percentages of 15% for NY, ECLA, RHA, and RLA and 25% for NY, SCLA ECLA, RHA, RLA, and BLA showed points below the curve, which indicated high pozzolanic reactivity for these pozzolans. In general, increasing the substitution percentage decreases the concentration of ions, which indicates the greater consumption of Ca+2 and OH− ions. After 15 days, almost all replacement percentages showed points below the saturated curve, except for 15% MS, SK, SCSA, and BLA and 25% MS and SK. MS may not have reached reactivity due to the densification state of the particles [37]. The material SK did not present pozzolanic reactivity as it does not have amorphous silica in its composition and is 100% crystalline. As for SCSA, it does not have high levels of silica, as it is an ash derived from sugarcane stalks. BLA has one of the four largest diameters presented, although it has high levels of silica in its composition. However, when both SCSA and BLA are present in greater quantities, they present reactivity, due to the greater availability of reactive materials.
When analyzing the reactivity, 8 of the 10 materials studied showed medium to high reactivity when using the electrical conductivity and pH method. Only the SCSA and ECSA ashes and the SK (ground quartz) showed low reactivity, which was already expected due to the low silica content present in the ash compositions and the crystallinity of the silica present in SK. As for the Frattini test at 15 days, only the prepared cements with 15% cement replacement with SCSA, BLA, and MS and with 25% MS did not show pozzolanicity. However, when increasing the replacement of cement using SCSA and BLA, both prepared cements were considered to exhibit pozzolanicity.
When comparing the analyzed reactivity methods, we observed that the Frattini method only supplied information about the pozzolanicity (positive or negative) of the prepared cement. Differently, the electrical conductivity and pH monitoring allowed us to identify more differences in the reactivity. This was due to variations in the concentrations of calcium ions in the tests, as well as differences between the saturated Ca(OH)2 solution and the solution in the cement pores [39]. Another divergent factor is the execution of the tests: while the Frattini direct method is carried out with the solutions at the final stage of the test, the indirect method (electrical conductivity and pH) keeps the suspensions in constant agitation, helping with solubilization/reaction. This probably influenced the pozzolanic reactivity observed for MS in the conductivity tests, but it did not occur in the same way in the Frattini test. Additionally, temperature differences can also strongly influence the results.
Identifying highly reactive pozzolans through a simple and time-efficient indirect method is crucial to reducing the costs and time required for decision-making. Electrical conductivity and pH monitoring is considered effective in terms of time.
4. Conclusions
The comparison of different pozzolanic materials, with different sources (synthetic/commercial, such as NY; commercial, such as MS; and eco-pozzolans from the combustion of biomass, such as RHA, RLA, SCSA, SCLA, ECSA, ECLA, and BLA), was performed by means of the indirect (electrical conductivity and pH of pozzolan/Ca(OH)2 suspensions) and direct (Frattini) methods. The indirect method presents greater sensitivity and precision as it is possible to classify the reactivity of the pozzolans. However, it is necessary to use different reactivity assessment methods, mainly direct and indirect, seeking to understand the reactions of these pozzolans as SCMs in cement matrices.
Nyasil (NY) was the pozzolan that showed the greatest reactivity among the pozzolans studied; this is due to its medium particle size and its almost complete composition of amorphous silica. The rice leaf ash (RLA) also showed high reactivity. In contrast, the sugarcane (SCSA) and energy cane (ECSA) stalk ashes presented low pozzolanic reactivity, because of the small percentages of amorphous silica in their compositions. The behavior of medium- and high-reactivity materials not only depends on the silica content but also on their particle diameters and the other chemical components in the samples that influence their reactivity.
Microsilica 920 (MS) presented medium reactivity according to the indirect method; however, the Frattini test (direct method) showed low reactivity, suggesting that particle agglomeration plays an important role in the cementing matrix. There is a limitation in portlandite fixation.
According to the reactivity analysis, the use of waste from agroindustry (ash from biomass combustion) is an interesting alternative for the production of reactive eco-pozzolans, seeking to reduce the negative impacts generated by cement production, address the scarcity of natural resources, and promote a circular economy. It would be interesting to assess the potential worldwide production and localization of these types of biomass to further reduce the carbon footprint of commercial cements and concrete containing these eco-pozzolans.
Supplementary Materials
The following supporting information can be downloaded at: https://www.mdpi.com/article/10.3390/su162210087/s1, Figure S1: Particle size distribution. (a) NY; (b) MS; (c) SK; (d) SCSA; (e) SCLA; (f) ECSA; (g) ECLA; (h) RHA; (i) RLA; and (j) BLA.
Author Contributions
Conceptualization, G.P.L. and A.J.F.P.D.; methodology, G.P.L.; software, G.P.L.; validation, G.P.L., A.J.F.P.D., M.M.T., M.V.B., L.S., J.P. and J.A.R.; formal analysis, G.P.L., A.J.F.P.D., M.V.B., L.S., J.P. and J.A.R.; investigation, G.P.L., A.J.F.P.D., M.M.T., M.V.B., L.S., J.P. and J.A.R.; resources, G.P.L., J.P. and J.A.R.; data curation, G.P.L., M.M.T., M.V.B., L.S., J.P. and J.A.R.; writing—original draft preparation, G.P.L., A.J.F.P.D., M.M.T., M.V.B., L.S., J.P. and J.A.R.; writing—review and editing, G.P.L., A.J.F.P.D., M.M.T., M.V.B., L.S., J.P. and J.A.R.; supervision, J.P. and J.A.R.; project administration, J.P. and J.A.R.; funding acquisition, G.P.L., J.P. and J.A.R. All authors have read and agreed to the published version of the manuscript.
Funding
This study was financed in part by the Coordenação de Aperfeiçoamento de Pessoal de Nível Superior—Brasil (CAPES)—Finance Code 001.
Data Availability Statement
The original contributions presented in the study are included in the article/Supplementary Materials; further inquiries can be directed to the corresponding author.
Acknowledgments
Tashima wishes to thank the Spanish Ministry of Universities and the Universitat Politècnica de València for the grant “María Zambrano for attraction of international talent”, funded by the European Union—Next Generation.
Conflicts of Interest
The authors declare no conflicts of interest.
References
- Kamali, M.; Hewage, K.; Sadiq, R. Conventional versus Modular Construction Methods: A Comparative Cradle-to-Gate LCA for Residential Buildings. Energy Build. 2019, 204, 109479. [Google Scholar] [CrossRef]
- Vieira, D.R.; Calmon, J.L.; Coelho, F.Z. Life Cycle Assessment (LCA) Applied to the Manufacturing of Common and Ecological Concrete: A Review. Constr. Build. Mater. 2016, 124, 656–666. [Google Scholar] [CrossRef]
- Imbabi, M.S.; Carrigan, C.; McKenna, S. Trends and Developments in Green Cement and Concrete Technology. Int. J. Sustain. Built Environ. 2012, 1, 194–216. [Google Scholar] [CrossRef]
- Rocha, J.H.A.; Toledo Filho, R.D.; Cayo-Chileno, N.G. Sustainable Alternatives to CO2 Reduction in the Cement Industry: A Short Review. Mater. Today Proc. 2022, 57, 436–439. [Google Scholar] [CrossRef]
- Supino, S.; Malandrino, O.; Testa, M.; Sica, D. Sustainability in the EU Cement Industry: The Italian and German Experiences. J. Clean. Prod. 2016, 112, 430–442. [Google Scholar] [CrossRef]
- Part, W.K.; Ramli, M.; Cheah, C.B. An Overview on the Influence of Various Factors on the Properties of Geopolymer Concrete Derived from Industrial By-Products. Constr. Build. Mater. 2015, 77, 370–395. [Google Scholar] [CrossRef]
- Cai, B.; Wang, J.; He, J.; Geng, Y. Evaluating CO2 Emission Performance in China’s Cement Industry: An Enterprise Perspective. Appl. Energy 2016, 166, 191–200. [Google Scholar] [CrossRef]
- Aranda Usón, A.; López-Sabirón, A.M.; Ferreira, G.; Llera Sastresa, E. Uses of Alternative Fuels and Raw Materials in the Cement Industry as Sustainable Waste Management Options. Renew. Sustain. Energy Rev. 2013, 23, 242–260. [Google Scholar] [CrossRef]
- Skibsted, J.; Snellings, R. Reactivity of Supplementary Cementitious Materials (SCMs) in Cement Blends. Cem. Concr. Res. 2019, 124, 105799. [Google Scholar] [CrossRef]
- Hewlett, P.C.; Liska, M. Lea’s Chemistry of Cement and Concrete, 5th ed.; Elsevier: Amsterdam, The Netherlands, 2019; ISBN 9780081007730. [Google Scholar]
- NBR 12653; Materiais Pozolânicos-Requisitos. Associação Brasileira de Normas Técnicas: São Paulo, Brazil, 2014; p. 6.
- Tironi, A.; Trezza, M.A.; Scian, A.N.; Irassar, E.F. Incorporation of Calcined Clays in Mortars: Porous Structure and Compressive Strength. Procedia Mater. Sci. 2012, 1, 366–373. [Google Scholar] [CrossRef]
- Neville, A.M. Propriedades Do Concreto, 5th ed.; Bookman: Orange, CA, USA, 2015. [Google Scholar]
- Choudhary, A.; Shah, V.; Bishnoi, S. Effect of Low Cost Fillers on Cement Hydration. Constr. Build. Mater. 2016, 124, 533–543. [Google Scholar] [CrossRef]
- Lawrence, P.; Cyr, M.; Ringot, E. Mineral Admixtures in Mortars: Effect of Inert Materials on Short-Term Hydration. Cem. Concr. Res. 2003, 33, 1939–1947. [Google Scholar] [CrossRef]
- Walker, R.; Pavía, S. Physical Properties and Reactivity of Pozzolans, and Their Influence on the Properties of Lime-Pozzolan Pastes. Mater. Struct. Constr. 2011, 44, 1139–1150. [Google Scholar] [CrossRef]
- Paul, S.C.; Mbewe, P.B.K.; Kong, S.Y.; Šavija, B. Agricultural Solid Waste as Source of Supplementary Cementitious Materials in Developing Countries. Materials 2019, 12, 1112. [Google Scholar] [CrossRef]
- Abebaw, G.; Bewket, B.; Getahun, S. Experimental Investigation on Effect of Partial Replacement of Cement with Bamboo Leaf Ash on Concrete Property. Adv. Civ. Eng. 2021, 2021, 6468444. [Google Scholar] [CrossRef]
- Jittin, V.; Minnu, S.N.; Bahurudeen, A. Potential of Sugarcane Bagasse Ash as Supplementary Cementitious Material and Comparison with Currently Used Rice Husk Ash. Constr. Build. Mater. 2021, 273, 121679. [Google Scholar] [CrossRef]
- Ungureanu, N.; Vlăduț, V.; Biriș, S. Ștefan Sustainable Valorization of Waste and By-Products from Sugarcane Processing. Sustainability 2022, 14, 11089. [Google Scholar] [CrossRef]
- Gopinath, A.; Bahurudeen, A.; Appari, S.; Nanthagopalan, P. A Circular Framework for the Valorisation of Sugar Industry Wastes: Review on the Industrial Symbiosis between Sugar, Construction and Energy Industries. J. Clean. Prod. 2018, 203, 89–108. [Google Scholar] [CrossRef]
- El-Said, A.; Awad, A.; Ahmad, M.; Sabri, M.M.S.; Deifalla, A.F.; Tawfik, M. The Mechanical Behavior of Sustainable Concrete Using Raw and Processed Sugarcane Bagasse Ash. Sustainability 2022, 14, 11181. [Google Scholar] [CrossRef]
- Cordeiro, G.C.; Tavares, L.M.; Toledo Filho, R.D. Improved Pozzolanic Activity of Sugar Cane Bagasse Ash by Selective Grinding and Classification. Cem. Concr. Res. 2016, 89, 269–275. [Google Scholar] [CrossRef]
- Umasabor, R.I.; Okovido, J.O. Fire Resistance Evaluation of Rice Husk Ash Concrete. Heliyon 2018, 4, e01035. [Google Scholar] [CrossRef] [PubMed]
- Huang, H.; Gao, X.; Wang, H.; Ye, H. Influence of Rice Husk Ash on Strength and Permeability of Ultra-High Performance Concrete. Constr. Build. Mater. 2017, 149, 621–628. [Google Scholar] [CrossRef]
- Moraes, M.J.B.; Moraes, J.C.B.; Tashima, M.M.; Akasaki, J.L.; Soriano, L.; Borrachero, M.V.; Payá, J. Production of Bamboo Leaf Ash by Auto-Combustion for Pozzolanic and Sustainable Use in Cementitious Matrices. Constr. Build. Mater. 2019, 208, 369–380. [Google Scholar] [CrossRef]
- Sanjuán, M.Á.; Argiz, C.; Gálvez, J.C.; Moragues, A. Effect of Silica Fume Fineness on the Improvement of Portland Cement Strength Performance. Constr. Build. Mater. 2015, 96, 55–64. [Google Scholar] [CrossRef]
- Monasterio, M.; Gaitero, J.J.; Erkizia, E.; Guerrero Bustos, A.M.; Miccio, L.A.; Dolado, J.S.; Cerveny, S. Effect of Addition of Silica- and Amine Functionalized Silica-Nanoparticles on the Microstructure of Calcium Silicate Hydrate (C-S-H) Gel. J. Colloid Interface Sci. 2015, 450, 109–118. [Google Scholar] [CrossRef]
- UNE-EN 196-5:2011; Methods of Testing cement—Part 5: Pozzolanicity Test for Pozzolanic Cement. (AENOR) Asociación Española de Normalización y Certificación: Madrid, Spain, 2011.
- Donatello, S.; Tyrer, M.; Cheeseman, C.R. Comparison of Test Methods to Assess Pozzolanic Activity. Cem. Concr. Compos. 2010, 32, 121–127. [Google Scholar] [CrossRef]
- Tashima, M.M.; Soriano, L.; Monzó, J.; Borrachero, M.V.; Akasaki, J.L.; Payá, J. New Method to Assess the Pozzolanic Reactivity of Mineral Admixtures by Means of pH and Electrical Conductivity Measurements in Lime: Pozzolan Suspensions. Mater. Constr. 2014, 64, 914. [Google Scholar] [CrossRef]
- Matsuoka, S.; Kennedy, A.J.; dos Santos, E.G.D.; Tomazela, A.L.; Rubio, L.C.S. Energy Cane: Its Concept, Development, Characteristics, and Prospects. Adv. Bot. 2014, 2014, 597275. [Google Scholar] [CrossRef]
- ASTM C114; Standard Test Methods for Chemical Analysis of Hydraulic Cement. American Society for Testing and Materials: West Conshohocken, PA, USA, 2018; 33.
- UNE 80225:2012; Methods of Testing Cement. Chemical Analysis. Determination of Reactive SiO2 Content in Cements, Pozzolanas and Fly Ash. Spanish Standards Institution: Madrid, Spain, 2012.
- Payá, J.; Monzó, J.; Borrachero, M.; Mellado, A.; Ordoñez, L. Determination of Amorphous Silica in Rice Husk Ash by a Rapid Analytical Method. Cem. Concr. Res. 2001, 31, 227–231. [Google Scholar] [CrossRef]
- Shearer, A.; Molinaro, M.; Montazerian, M.; Sly, J.J.; Miola, M.; Baino, F.; Mauro, J.C. The Unexplored Role of Alkali and Alkaline Earth Elements (ALAEs) on the Structure, Processing, and Biological Effects of Bioactive Glasses. Biomater. Sci. 2024, 12, 2521–2560. [Google Scholar] [CrossRef]
- Martínez-Velandia, D.; Payá, J.; Monzó, J.; Borrachero, M.V. Effect of Sonication on the Reactivity of Silica Fume in Portland Cement Mortars. Adv. Cem. Res. 2011, 23, 23–31. [Google Scholar] [CrossRef]
- Krishnarao, R.V.; Subrahmanyam, J.; Jagadish Kumar, T. Studies on the Formation of Black Particles in Rice Husk Silica Ash. J. Eur. Ceram. Soc. 2001, 21, 99–104. [Google Scholar] [CrossRef]
- Kamalakar Mali, A.; Nanthagopalan, P. Development of a Framework for the Selection of Best Sugarcane Bagasse Ash from Different Sources for Use in the Cement-Based System: A Rapid and Reliable Path. Constr. Build. Mater. 2021, 293, 123386. [Google Scholar] [CrossRef]
Disclaimer/Publisher’s Note: The statements, opinions and data contained in all publications are solely those of the individual author(s) and contributor(s) and not of MDPI and/or the editor(s). MDPI and/or the editor(s) disclaim responsibility for any injury to people or property resulting from any ideas, methods, instructions or products referred to in the content. |
© 2024 by the authors. Licensee MDPI, Basel, Switzerland. This article is an open access article distributed under the terms and conditions of the Creative Commons Attribution (CC BY) license (https://creativecommons.org/licenses/by/4.0/).