Abstract
This research investigates the influence of economic policy uncertainty (EPU) and its squared term (squared EPU) on the advancement of environmental technologies and the registration of environmental patents in the BRICS nations over the period from 2010 to 2022. Employing the cross-section autoregressive distributed lag (CS-ARDL) technique, the analysis reveals a significant negative relationship liaison between EPU and both environmental innovation and patent registrations, indicating that an increased uncertainty discourages investment in sustainable technologies. Conversely, a positive relationship was found with square EPU, suggesting that elevated levels of uncertainty may stimulate innovative responses as firms seek to differentiate themselves in a competitive market. These findings underscore the necessity for stable and transparent policy frameworks to foster long-term commitments to environmental innovation. This research enriches the literature by illustrating the dual nature of EPU and its differentiated effects on eco-innovation.
Keywords:
economic policy uncertainty; green innovation; environmental technology; environmental patent registration; BRICS economies JEL Codes:
O32; Q55; Q58
1. Introduction
In an era where sustainability is increasingly recognized as a global imperative, the dynamics of innovation are crucial for fostering a greener future. As nations strive to adopt environmentally friendly practices, understanding the factors that drive green innovation becomes essential. One significant variable in this context is economic policy uncertainty (EPU). This uncertainty, characterized by unpredictable shifts in government regulations and policies, can greatly influence the strategic decisions of businesses [1]. When firms encounter fluctuating policies, they may hesitate to invest in new technologies or sustainable practices, fearing that changing regulations could undermine their efforts. This unpredictability raises important questions about how varying levels of EPU affects the pursuit of innovative solutions aimed at promoting sustainability [2]. By examining this relationship, we can uncover valuable insights that enhance our understanding of innovation processes and provide practical guidance for policymakers. Such insights are essential for creating an environment conducive to green innovation, where businesses feel secure in their investments and are motivated to pursue sustainable practices. Thus, unraveling the non-linear repercussions of policy volatility on eco-friendly innovation is crucial for enriching academic discourse and shaping effective strategies. This exploration will contribute to a deeper comprehension of how uncertainty shapes innovation in the context of sustainable development, ultimately guiding efforts to create effective policies that support a more sustainable future.
As the global emphasis on sustainability continues to grow, it is essential to explore the nuanced mechanisms that connect policy volatility with eco-friendly innovation. Understanding this relationship not only clarifies the motivations behind firms’ actions but also underscores the broader implications for sustainable development. In this context, several key research questions arise, aimed at examining the dimensions of this dynamic. How does economic policy uncertainty influence the development of environmental technologies? In what ways does square economic policy uncertainty affect the rate of environmental patent registrations? Furthermore, how do factors such as FDI, FSD and GDP relate to the effects of these uncertainties on eco-friendly innovation? These questions not only aim to augment our understanding of the liaison between policy and innovation but also seek to provide practical insights for stakeholders. By addressing these inquiries, this study intends to contribute to a more comprehensive framework that can assist policymakers and businesses in their efforts to promote sustainable practices in an increasingly uncertain environment.
The relationship between economic policy and innovation has garnered significant attention in recent years, particularly regarding sustainability. As nations confront the urgent need to address environmental challenges, the role of policy frameworks in shaping eco-friendly innovation becomes increasingly critical [3]. Economic policy uncertainty, characterized by unpredictable changes in regulations, can hinder firms’ willingness to invest in sustainable technologies. This uncertainty creates a challenging environment for businesses as they navigate the complexities of compliance and strategic planning. The development of environmental technologies and the registration of environmental patents are crucial indicators of a nation’s commitment to sustainability [4]. However, these processes can be adversely affected by fluctuations in policy stability. Factors such as FDI and GDP also significantly influence innovation, further complicating the relationship between policy and eco-friendly initiatives [5]. Understanding these dynamics is essential for grasping how businesses adapt to regulatory changes and the implications for sustainable development. As firms seek to innovate in response to environmental challenges, the connections between policy certainty and their strategic decisions become increasingly relevant in today’s economic climate.
This study set out to explore the impact of EPU on eco-friendly innovation by analyzing a diverse range of economies using a data sample from 2010 to 2022. Utilizing the autoregressive distributed lag (ARDL) methodology, the results reveal a nuanced relationship with EPU. Similarly, they further show a negative correlation with the development of environmental technologies (DET) and an inverse link with environmental patent registration (EPR). In contrast, square EPU (SPU) reveals a positive association with DET and it further reveals a direct connection with EPR. The observed inverse relationship between EPU and the DET and EPR can be explained through several theoretical frameworks. Firstly, uncertainty in policy can lead to increased risk aversion among firms, causing them to postpone or reduce investments in innovation. When businesses face unpredictable regulatory environments, they may prioritize short-term stability over long-term investments in sustainable technologies, fearing that future regulations could undermine their efforts. Additionally, the lack of clarity in policy can disrupt long-term planning and resource allocation, essential for developing and commercializing new technologies. Firms may be hesitant to allocate significant resources to research and development (R&D) when the regulatory framework remains uncertain.
In contrast, the positive liaison between square EPU (SPU) and both DET and EPR suggests a more complex interaction. SPU may signal a structured form of uncertainty that, paradoxically, encourages firms to innovate. When firms recognize that while policy may be uncertain, the potential for regulatory shifts could lead to new opportunities, they might be motivated to invest in creative solutions to meet anticipated future demands or standards. This proactive approach can foster innovation, as firms seek to capitalize on emerging markets for sustainable technologies. Overall, these statistics heighten the importance of understanding the dual nature of policy uncertainty and its implications for innovation, suggesting that while EPU may deter investment, SPU can create incentives for firms to adapt and innovate in response to evolving regulatory requirements.
This study holds considerable theoretical significance as it enhances the understanding of the complex liaison between EPU and eco-friendly innovation. By integrating concepts from innovation theory and environmental economics, the research elucidates how different forms of policy uncertainty can either hinder or stimulate investment in sustainable technologies. This nuanced perspective contributes to the academic discourse on the role of regulatory environments in fostering innovation. Empirically, the statistics deliver valuable insights into the behavior of firms facing varying degrees of EPU. The analysis of data from 2010 to 2022 across multiple economies offers a robust framework for future research, enabling scholars to explore the implications of policy fluctuations on innovation in different contexts. The use of the autoregressive distributed lag (ARDL) methodology further strengthens the empirical foundation, allowing for a comprehensive assessment of both short-term and long-term effects. Practically, the study’s results have significant implications for policymakers and business leaders. By highlighting the detrimental effects of economic policy uncertainty on environmental technologies, the research underscores the necessity for stable and clear regulatory frameworks. Such frameworks can encourage firms to invest in sustainable innovations, contributing to broader environmental goals. Additionally, the positive association between square economic policy uncertainty and innovation suggests that policymakers can harness structured uncertainty to drive eco-friendly advancements, ultimately facilitating a transition toward a more sustainable economy.
The novelty of this study lies in its exploration of the non-linear impact of EPU on green innovation, an area that is relatively underexplored in the existing literature. While most studies focus on a linear relationship [6,7,8], examining how increasing EPU either negatively or positively influences green innovation in a straightforward manner, this research departs from the literature by investigating both the direct (linear) and squared (non-linear) effects of EPU.
This study is organized into following key sections. The second section, Theoretical Literature Review, examines existing theories and frameworks. The third section is the Empirical Literature Review, which analyzes prior studies on the impact of policy uncertainty on innovation outcomes. Moreover, the fourth section, and Computational Methodology, outlines data sources and techniques, focusing on the autoregressive distributed lag (ARDL) methodology. Following this, the Results Reporting section is the fifth section. Then, the Results Discussion appears in the sixth section. Finally, the Conclusion and Policy Recommendations summarizes insights and offers actionable recommendations.
2. Theoretical Literature Review
This section examines the theoretical underpinnings of the relationship between economic policy uncertainty (EPU) and eco-friendly innovation. We explore relevant theories, their definitions, and how they relate to our research. It further provides a framework for understanding the complex dynamics.
2.1. Real Option Theory
This theory, introduced by Myers [9], suggests that firms faced with uncertainty should maintain the flexibility to invest in projects only when the information surrounding their profitability becomes clearer. This is because investing in a project with an uncertain future can lead to significant losses. In our context, EPU creates a volatile environment, making firms hesitant to commit significant resources to developing and commercializing environmentally friendly technologies. This reluctance stems from the fear that future regulations might render their investments obsolete or unprofitable, highlighting the importance of flexibility in decision-making. E.g., a firm may choose to invest in a pilot project for a new renewable energy technology rather than building a full-scale manufacturing facility, allowing them to gather data and refine the technology before making a larger commitment.
2.2. Innovation Diffusion Theory
The theory proposed by Rogers [10] elucidates the mechanisms through which new ideas and technologies disseminate within a population. It suggests that the adoption of innovations is influenced by factors such as perceived risk, relative advantage, and compatibility with existing practices. Perceived risk refers to the uncertainty surrounding the potential benefits and drawbacks of adopting a new technology. Relative advantage involves the perceived gains from adopting a new technology relative to the alternatives currently available. Compatibility refers to how well the new technology fits with existing practices and beliefs. In our study, EPU increases the perceived risk associated with investing in eco-friendly technologies, potentially hindering their diffusion and adoption. For instance, a firm may be hesitant to invest in a new carbon capture technology if they are unsure about the future regulatory landscape and potential carbon pricing mechanisms.
2.3. Institutional Theory
This theory focuses on how institutions, comprising both formal aspects (laws and regulations) and informal aspects (norms and values), play a crucial role in shaping economic conduct. North [11] argues that institutional uncertainty can hinder economic growth by creating ambiguity and discouraging long-term investments. In our research, EPU, as a form of institutional uncertainty, can deter firms from investing in sustainable technologies due to the unpredictability of the regulatory environment. For example, if a government is constantly changing its regulations on renewable energy subsidies, it can create uncertainty for firms and make them hesitant to invest in this sector.
2.4. Environmental Kuznets Curve (EKC) Hypothesis
Grossman and Krueger [12] argue that environmental degradation initially worsens with economic growth, but as societies achieve greater wealth, they tend to invest more in environmental protection, leading to a decline in degradation. This is because as economies develop, they tend to shift from resource-intensive industries to more service-oriented industries, which generally have lower environmental impacts. Our study explores how EPU can affect the EKC trajectory. While economic growth is a crucial driver of environmental innovation, policy uncertainty can disrupt this dynamic, potentially delaying the transition to a more sustainable path. For instance, if a government is constantly changing its regulations on pollution control, it can create uncertainty for firms and make them hesitant to invest in pollution reduction technologies.
The Real Options Theory is the most relevant theory in the context of EPU and eco-friendly innovation. It emphasizes the importance of maintaining flexibility in investment decisions, which is crucial when firms are faced with unpredictable regulatory environments. This theory highlights that companies may prefer to delay significant investments until they have clearer information about future profitability, aligning perfectly with how businesses approach eco-friendly technologies. By allowing for smaller, incremental investments, such as pilot projects, Real Options Theory provides a framework for mitigating the risks associated with potential policy changes that could affect the viability of these innovations. Overall, it effectively captures the strategic decision-making process firms encounter, making it particularly pertinent for understanding the dynamics of eco-friendly innovation amidst economic uncertainty.
By combining these theoretical perspectives, our study provides a comprehensive understanding of how EPU affects the development and adoption of eco-friendly technologies, illustrating the complex relationships between risk aversion, innovation diffusion, institutional dynamics, and environmental sustainability in a changing economic environment.
3. Empirical Literature Review and Hypothesis Development
The study of Cui et al. [8] articulated that frequent adjustments in economic policy contribute to heightened EPU. Investigation of data from A-share listed companies in China, covering the years 2005 to 2019, indicates a significant inverse liaison between EPU and corporate green innovation. The findings reveal that financial constraints amplify this adverse effect, while government environmental subsidies effectively mitigate it, especially in privately owned firms, less competitive markets, and regions with weaker protections for intellectual property. Additionally, Li et al. [13] conducted an empirical study on the relationships among ecological deterioration, EPU, and eco-friendly technology innovation, utilizing fixed-effect panel analysis of provincial data from 2000 to 2017 across 30 administrative regions in China. Findings indicate that while ecological regulation positively influences green innovation, EPU negatively impacts it, with notable regional variations; specifically, regulation fosters innovation in eastern and central regions but has less effect in the west, and uncertainty moderates this relationship, inhibiting innovation particularly in the eastern and central areas.
The study of Xu and Yang [14] concluded that the existing literature reveals a significant gap regarding the effects of economic policy on green innovation. This study aims to address this gap by analyzing how EPU influences green innovation in 269 Chinese cities from 2005 to 2016, considering financial conditions and city characteristics, with resource endowment as a moderating factor. Empirical findings demonstrate that EPU fosters green innovation up to a certain threshold, after which it begins to inhibit progress, suggesting that both governments and enterprises should implement strategies to encourage innovation and mitigate uncertainty, while economic development models for resource-based cities should be updated to reduce dependency on resources and enhance collaboration among enterprises, universities, and research institutions. The work of Udeagha and Muchapondwa [15] investigated the interactions among EPU, fiscal decentralization, and green innovation on environmental sustainability using annual data from 1960 to 2020, employing methodologies such as dynamic ordinary least squares and canonical cointegration regression. The results validate the Environmental Kuznets Curve (EKC) hypothesis, revealing that early economic growth can detrimentally affect environmental quality. Long-term growth is associated with a 0.162% reduction in emissions, while a 1% increase in growth leads to a 0.791% rise in emissions. Moreover, economic globalization and policy uncertainty impede ecological sustainability, while fiscal decentralization and green innovation enhance it in the South African context.
The research of Sun et al. [16] concluded that climate policy uncertainty significantly affects green innovation among Chinese enterprises. Using data from officially listed companies in China between 2011 and 2020, this study empirically assesses the impact and mechanisms through which climate policy uncertainty influences green innovation. Findings indicate that heightened uncertainty negatively inhibits innovation by diminishing government green subsidies, limiting companies’ ability to meet environmental social responsibilities, and increasing financing constraints. Zhou et al.’s [17] study examines the effects of EPU on business development, particularly focusing on green technology innovation among 807 listed companies from 2007 to 2019 using a double fixed-effect model. Findings indicate that EPU significantly hinders firms’ green technology innovation by exacerbating financing constraints, which serve as a mediating factor in this relationship. Additionally, the negative impact of EPU on innovation is more pronounced in non-state-owned and low-tech enterprises compared to state-owned and high-tech firms, while increased market competition mitigates EPU’s inhibitory effects.
Findings from Geng et al. [18] indicate that digitization significantly boosts corporate green technology innovation, which in turn enhances overall performance. Robustness tests, including instrumental variable approaches, validate that digitization supports green innovation, with a pronounced effect in large, capital-intensive, and state-owned firms. Although frequent policy changes contribute to uncertainty and impede corporate green technology innovation, digitization serves as an essential mechanism to alleviate these negative effects, accelerating the development of green technologies. The analysis by Bai et al. [7] focuses on the liaison between climate policy uncertainty (CPU) and corporate green innovation (GI), drawing on data from A-share industrial companies listed on the Shanghai and Shenzhen exchanges from 2011 to 2020. The findings indicate a positive relationship between CPU and firms’ green innovation. There is also notable heterogeneity in this relationship, with a more significant effect observed in non-state-owned firms, the energy sector, and firms that are technology-intensive. Furthermore, CPU may lead to the establishment of stricter regional environmental regulations and increased R&D investments, resulting in enhanced levels of green innovation.
Huang et al. [19] demonstrate that EPU causes firms to diminish their applications for green invention patents, especially among non-state-owned enterprises (non-SOEs). This negative impact is particularly evident when new directors of the Ecology and Environmental Bureau are appointed through promotions or are under the age of 55. Interestingly, there is no significant variation in this effect based on whether these directors have prior experience in environmental protection agencies. Niu et al. [20] provide empirical evidence of a negative relationship between corporate green technology innovation and CPU, impacting firms’ R&D expenditures and risk appetite. The adverse effects of EPU on green technology innovation differ according to the ownership structure of the companies. While environmental regulations intensify this negative effect, government subsidies significantly mitigate it. The research by Du and Guo [21] examines the influence of the green credit policy (GCP) on enterprises’ green innovation behaviors, as well as the moderating role of climate policy uncertainty (CPU). The findings indicate that the GCP significantly enhances both strategic and substantive green innovation, with a stronger effect observed for strategic initiatives. However, an increase in CPU positively moderates the liaison between the GCP and green innovation, thus diminishing the GCP’s effectiveness in enhancing innovation outcomes.
Ren et al. [22] highlight essential factors that influence corporate green innovation. Their results indicate that the volatility of EPU significantly reduces green innovation (GI), with this volatility having a more substantial effect than EPU itself. An inverse impact of EPU on GI is particularly pronounced in non-state-owned firms, less polluting companies, those facing lower financing constraints, and in environments with weaker environmental regulations and lower marketization levels. Positive investor sentiment serves to mitigate the adverse effects of economic policy volatility on GI. In the study conducted by Li et al. [23], the researchers explore how institutional factors affecting uncertainty influence the relationship between environmental investments (EIs) and green innovation (GI). Their findings demonstrate that EIs have a positive effect on GI, including both green invention and green utility; however, this positive effect is weakened by political uncertainty (PU). Additionally, the relationship between EIs and GI varies with the intensity of environmental regulations (ERs), remaining consistent across different marketization levels, and is particularly strengthened in areas with more robust ERs.
Sohail et al. [24] concluded that environmental degradation has emerged as a critical concern for the international community, prompting policymakers to shift their focus from traditional economic growth to sustainable green growth. This research examines the asymmetric impacts of EPU on green growth in heavily polluted economies from 1994 to 2020, while accounting for cross-sectional dependence in the analysis. Findings from the CS-ARDL model indicate an inverse and significant linear liaison between EPU and green growth. Furthermore, the non-linear model demonstrates that positive shocks to EPU adversely affect growth, whereas negative shocks do not have a significant impact. The empirical investigation by Li et al. [25] examines panel data from Chinese A-share listed agribusiness companies from 2011 to 2021, demonstrating a direct liaison between CPU and green innovation in the sector, a conclusion that is robust against extensive testing. The research also concluded that government environmental subsidies and heightened environmental concerns significantly enhance the effect of CPU on green innovation, with state-owned enterprises exhibiting a stronger impact compared to private firms. Additionally, green innovation is particularly evident in agricultural enterprises based in eastern China.
Feng and Zheng [6] demonstrate that EPU has a positive influence on renewable energy innovation for at least three years. Moreover, OECD nations and countries with right-leaning political orientations experience greater advancements in renewable energy innovation compared to non-OECD and left-leaning nations. The significant positive impact of EPU on renewable energy innovation is confined to countries with high institutional quality, while it becomes insignificant in those with low institutional quality. Based on these findings, we can propose the following hypotheses:
H1:
A significant negative relationship exists between economic policy uncertainty and the advancement of environmental technology.
H2:
Economic policy uncertainty negatively impacts the progress of environmental patent registration in a significant manner.
H3:
The squared economic policy uncertainty exhibits a significant positive correlation with the development of environmental technology.
H4:
There is a significant positive association between squared economic policy uncertainty and the registration of environmental patents.
4. Data and Computational Methodology
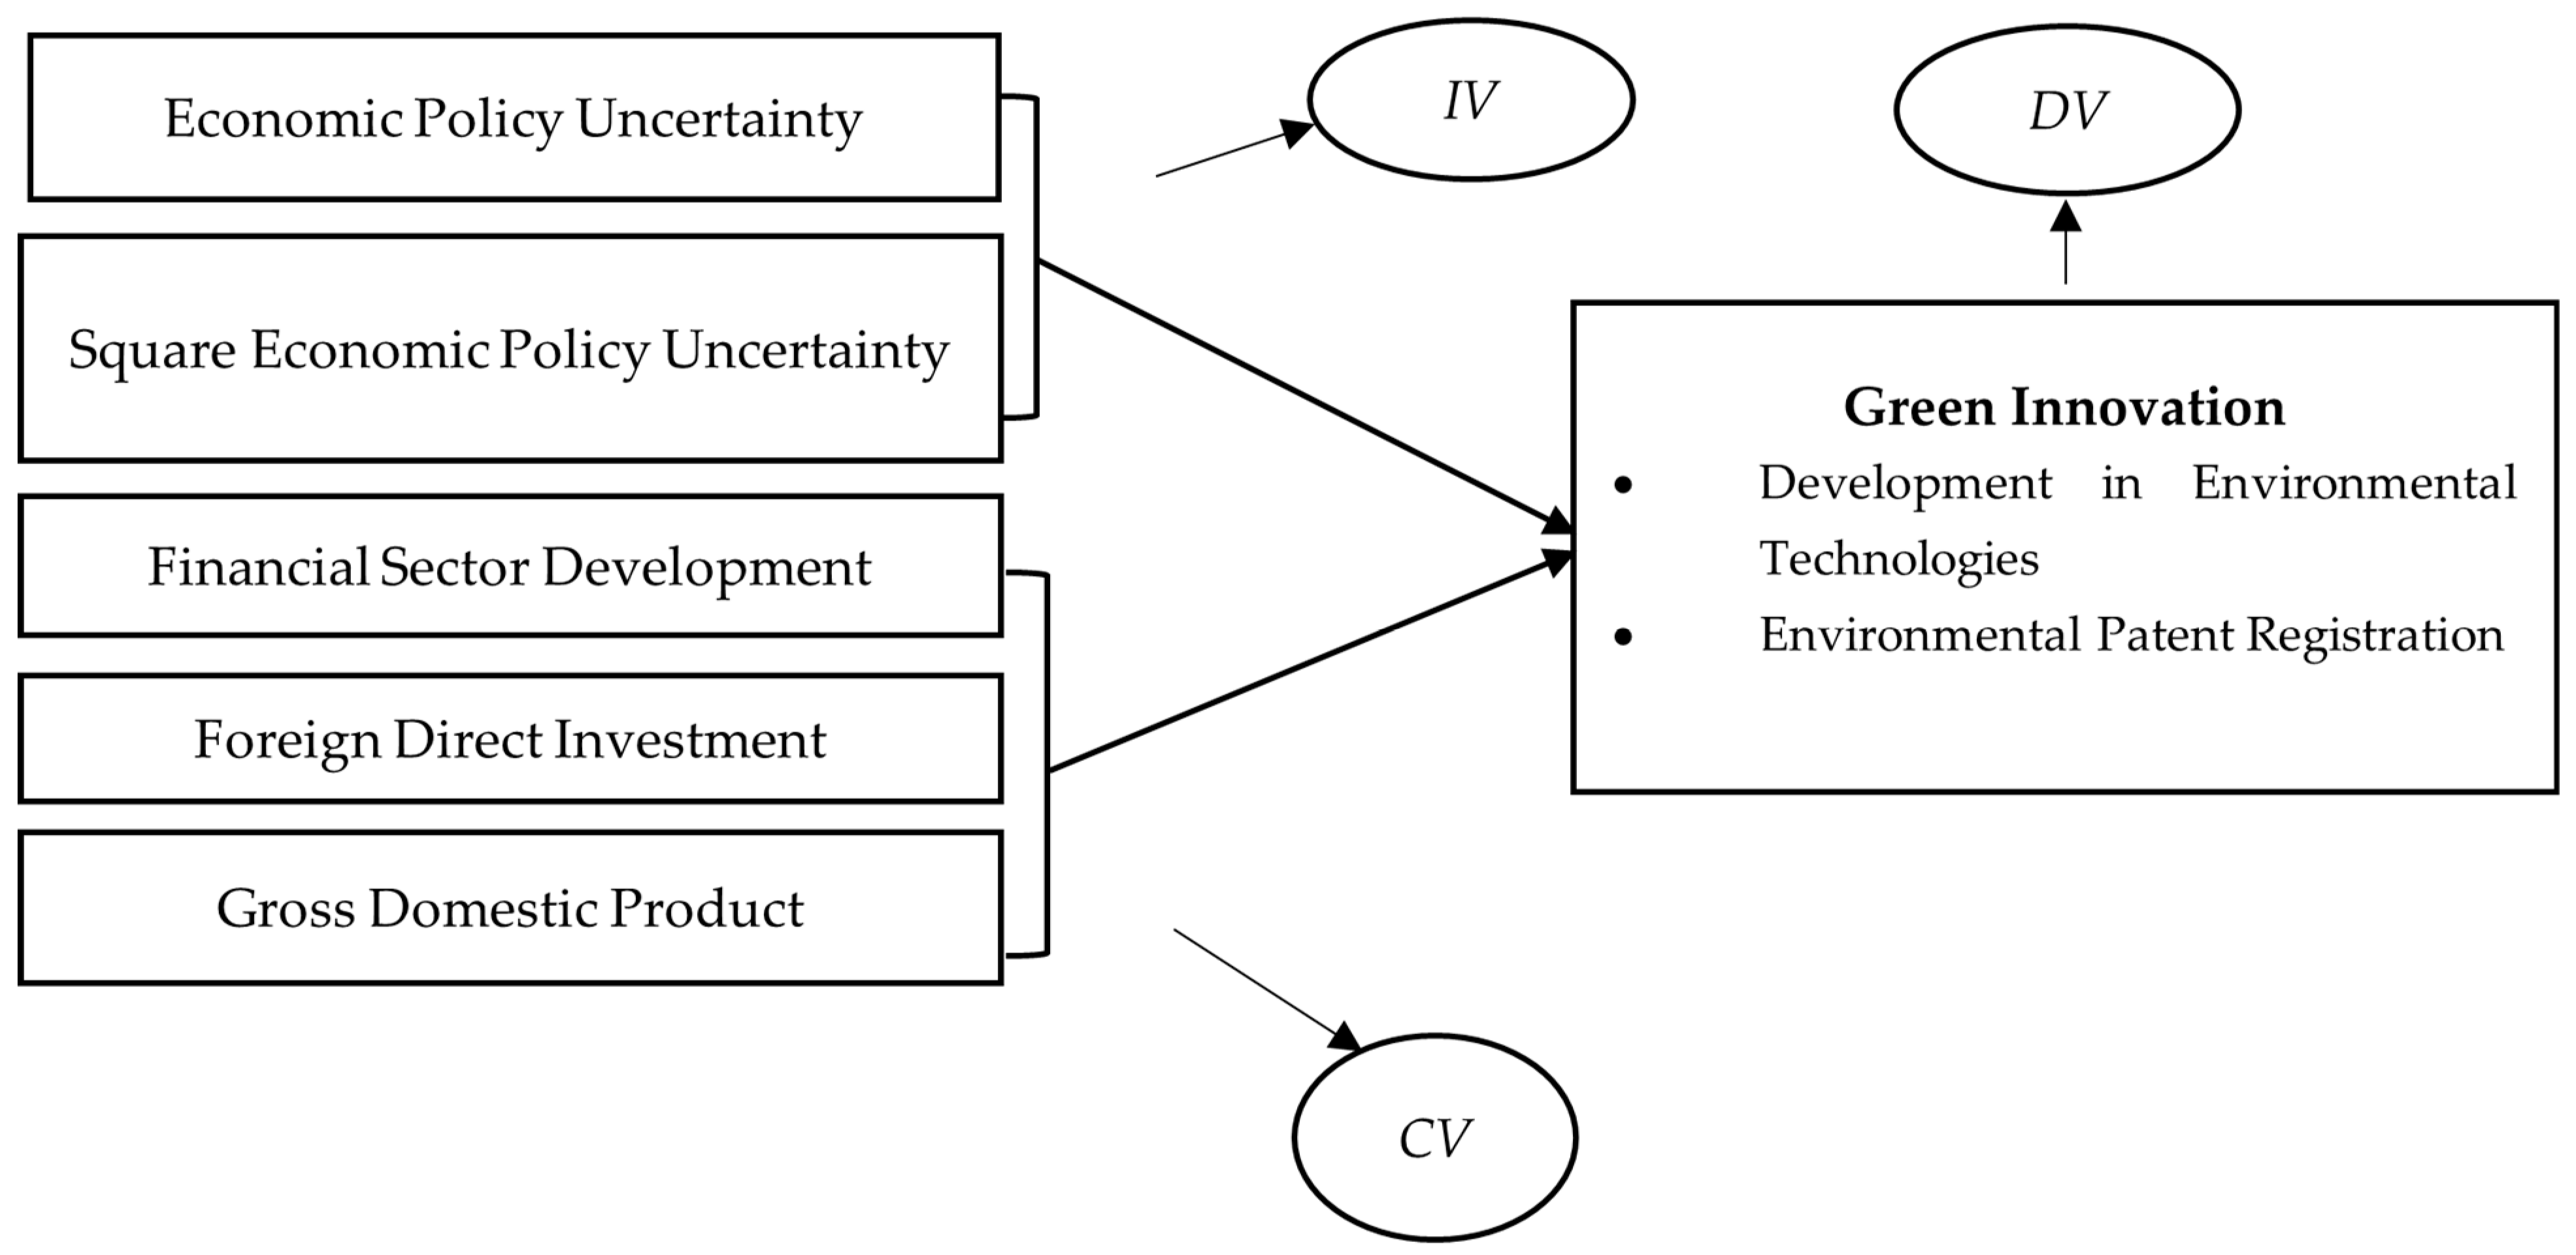
This study embarks on an exciting exploration of how EPU influences green innovation across the BRICS economies, e.g., Brazil, Russia, India, China, and South Africa, during the transformative years from 2010 to 2022. The choice of this specific period is particularly relevant as it captures a critical phase of economic recovery following the global financial crisis, marked by significant shifts in policy and a heightened focus on sustainability. Utilizing the cutting-edge autoregressive distributed lag (ARDL) model, we investigate how fluctuations in policy uncertainty can either ignite or suppress advancements in environmental technologies and the registration of green patents. The selection of BRICS is compelling; these nations not only represent a vibrant assortment of economic growth but also struggle with significant environmental challenges, making them critical to global sustainability efforts. Our analysis draws on accurately curated data from esteemed sources such as the policy uncertainty website (https://www.policyuncertainty.com/) (accessed on 1 September 2024) and the World Development Indicators, ensuring a robust foundation for our insights. By unpacking the ways in which EPU shapes green innovation, this research aims to empower policymakers and industry leaders with strategic knowledge to navigate increasingly uncertain economic regions. Ultimately, we seek to highlight how BRICS nations can turn economic challenges into opportunities for innovation, positioning themselves as leaders in the global green transition. This study not only enhances academic understanding but also serves as a vital roadmap for driving sustainable development, highlighting how emerging economies can pave the way for a greener, more resilient future. Figure 1 shows the theoretical framework of study.

Figure 1.
Conceptual framework.
4.1. Discussion on Variables
In this study, we investigate several critical variables that shed light on the liaison between EPU and green innovation within BRICS economies. Development in environmental technologies refers to advancements in technologies specifically designed to address environmental challenges. This variable is measured as the percentage of development in environment-related technologies relative to all technologies, highlighting the commitment of these nations to sustainable innovation [26]. Environmental patent registration quantifies the total number of patents granted for environmental technologies, serving as a direct indicator of innovation in this sector [27]. By analyzing the total patents registered, we can assess the level of technological progress and competitiveness in green innovation. EPU is captured through an EPU index developed by Baker et al. [28] that reflects the overall uncertainty in economic policies influencing these nations [29]. This variable is crucial as it significantly influences investment decisions and innovation trajectories. To investigate its effects more deeply, we also consider the square of this aggregate index (square EPU), enabling us to explore both linear and non-linear relationships with green innovation.
Furthermore, FSD is measured by the ratio of domestic credit to the private sector provided by banks as a percentage of GDP, indicating the financial system’s ability to support innovation and investment in environmental technologies [30]. Foreign investment is assessed through net inflows of foreign direct investment (FDI) as a percentage of GDP, emphasizing the role of international capital in enhancing green innovation and facilitating technology transfer [31]. Finally, economic growth is defined by annual GDP growth rates, providing essential context for understanding how overall economic performance correlates with advancements in environmental technologies. Together, these variables create a comprehensive framework for analyzing the influences on green innovation in BRICS nations, offering valuable insights for policymakers and stakeholders aiming to promote sustainable development.
4.2. Econometric Modeling
The equations presented form the foundation of our analysis regarding the impact of economic policy uncertainty (EPU) and other variables on the development of environmental technologies (DET) and environmental patent registration (EPR) within the BRICS economies. In Equation (1), the relationship between the DET and various influencing factors is articulated. The equation is structured as follows:
In Equation (1), DET represents the level of development in environmental technologies for country j at time t, while EPU denotes economic policy uncertainty. The coefficients α1 and α1 capture the effects of EPU and another variable, possibly the square of the economic policy uncertainty (SPU), respectively. The financial sector development (FSD), foreign direct investment (FSD), and economic growth (GDP) are similarly included, with their respective coefficients (r1, r2, r3) indicating their influence on DET. The error term accounts for unobserved factors.
In Equation (2), EPR measures the total patents granted for environmental technologies in country j at time t, analyzed through the same set of independent variables. This parallel structure allows for a comparative analysis of how these factors influence both the development of technologies and patent registrations.
In Equations (3) and (4), and represent the changes in development and registration of environmental technologies, respectively, from one period to the next. The terms , , , , and indicate the lagged changes in the independent variables, allowing for an analysis of how past fluctuations in these factors influence current changes in green innovation metrics. Overall, these equations establish a robust econometric framework to analyze the liaison between economic policy uncertainty and the various factors contributing to green innovation in BRICS nations, providing valuable insights into how these dynamics unfold over time. Table 1 demonstrates the measurement of variables.
4.3. Methodology
The methodology for this study is designed to rigorously analyze the liaison between EPU and green innovation within the BRICS economies. To achieve this, we adopt a systematic approach that begins with fundamental statistical techniques and culminates in the autoregressive distributed lag (ARDL) model, which is particularly well suited for examining both short-term and long-term relationships among variables. Initially, we employed descriptive statistics to provide an overview of the data characteristics. This step involved calculating means, medians, standard deviations, and ranges for each variable, which facilitated a better understanding of the distributions and potential outliers in the dataset. Descriptive analysis helps contextualize the findings and lays the groundwork for more complex modeling.
Following this, we conducted correlation analysis to assess the strength and direction of liaisons between the variables of interest. This preliminary examination enabled us to identify potential multicollinearity issues and guided the selection of variables for inclusion in the regression models. Similarly, we conducted cross-section dependence tests to assess whether the observations in our panel data were correlated across different countries. This is particularly important in the context of BRICS economies, as they often exhibit interconnected economic behaviors. Next, we performed unit root tests to determine the stationarity of the time series data. The presence of unit roots can lead to spurious regression results; therefore, we employed these techniques. Moreover, these tests helped establish whether the data needed to be differenced to achieve stationarity, ensuring the reliability of subsequent analyses. All variables are stationary at first difference [32,33]. These tests identify that our results are not spurious. The results of cross-section dependence and unit root tests can be viewed in Table 2 and Table 3.
With the data prepared, we transitioned to the application of the ARDL model, a robust econometric technique that allows for the exploration of both short-term dynamics and long-term relationships among variables. The ARDL approach is particularly advantageous because it can be applied regardless of whether the underlying variables are integrated at level or first difference, accommodating the mixed integration properties of our dataset.
The ARDL model is specified as follows:
In Equation (5), represents the dependent variable (either DET or EPR), denotes the independent variables (including EPU, SPU, FSD, FDI, and GDP), and is the error term. We estimated the optimal lag length using the Akaike Information Criterion (AIC) and Bayesian Information Criterion (BIC), ensuring the model’s efficiency and robustness. Subsequently, we conducted bound tests to assess the existence of long-term relationships among the variables. This step involved calculating the F-statistic and comparing it to critical values. If the F-statistic exceeded the upper critical value, we concluded that a long-term relationship existed. Following the establishment of long-term relationships, we estimated the long-term coefficients and short-term dynamics within the ARDL framework. We also performed diagnostic tests to check for issues such as autocorrelation, heteroscedasticity, and model stability, ensuring the validity of our findings.
In summary, this methodology, which incorporates cross-section dependence tests alongside unit root analysis and culminates in the ARDL model, provides a robust framework for examining the influences of EPU on green innovation in BRICS economies. This comprehensive approach enhances the reliability of our results and contributes valuable insights to the field of sustainable development. The study of Farooq et al. [34] employed ARDL.

Table 1.
Study’s variables.
Table 1.
Study’s variables.
| Acronym | Name | Role | Measurement | References | Expected Sign |
|---|---|---|---|---|---|
| DET | Development in environmental technologies | Dependent | % Development in environment-related technologies, % all technologies | [21] | - |
| EPR | Environmental patent registration | Dependent | Environmental technologies (total patents) | [7] | - |
| EPU | Economic policy uncertainty | Independent | An aggregate index | [8] | Negative |
| SPU | Square EPU | Independent | Square of (aggregate index) | [35] | Positive |
| FSD | Financial sector development | Control | Ratio of domestic credit to private sector by banks (% of GDP) | [36] | Positive |
| FDI | Foreign investment | Control | FDI, net inflows (% of GDP) | [37] | Positive |
| GDP | Economic growth | Control | GDP growth (annual %) | [38] | Positive |
Source: previous studies.
Table 2.
Cross-section dependence (CD) analysis.
Table 2.
Cross-section dependence (CD) analysis.
| Breusch–Pagan LM | Pesaran CD | |||
|---|---|---|---|---|
| Variables | Statistic | Probability | Statistic | Probability |
| DET | 26.357 | 0.000 | 4.139 | 0.000 |
| EPR | 57.953 | 0.000 | 7.506 | 0.000 |
| EPU | 22.896 | 0.000 | 2.929 | 0.003 |
| SPU | 22.896 | 0.000 | 2.929 | 0.003 |
| FD | 78.908 | 0.000 | 8.729 | 0.000 |
| FDI | 17.165 | 0.008 | 0.062 | 0.950 |
| GDP | 25.674 | 0.000 | 3.155 | 0.001 |
Source: self-estimation. Note: the acronyms can be seen in Table 1.
Table 3.
Analysis of stationarity through unit root testing.
Table 3.
Analysis of stationarity through unit root testing.
| CIPS | CADF | |||
|---|---|---|---|---|
| Variables | At Level (0) | At First Difference (1) | (0) | (1) |
| DET | (−0.587) 0.278 | (−7.422) 0.000 | (9.181) 0.327 | (55.434) 0.000 |
| EPR | (2.687) 0.996 | (−6.600) 0.000 | (7.129) 0.522 | (50.704) 0.000 |
| EPU | (2.753) 0.997 | (−4.532) 0.000 | (5.189) 0.737 | (37.138) 0.000 |
| SPU | (2.753) 0.997 | (−4.532) 0.000 | (5.189) 0.737 | (36.279) 0.000 |
| FD | (0.691) 0.755 | (−3.105) 0.000 | (6.363) 0.606 | (23.513) 0.002 |
| FDI | (−1.102) 0.135 | (−7.145) 0.000 | (12.530) 0.129 | (53.270) 0.000 |
| GDP | (−2.395) 0.008 | -- 0.000 | (20.276) 0.009 | -- |
Source: self-analysis. Note: the acronyms can be seen in Table 1.
5. Results
Table 4 shows descriptive statistics for the study’s variables, providing valuable insights into their distributions and characteristics.
Table 4.
Descriptive statistics.
In Table 4, the DET has a mean of 8.763, indicating a moderate level of development, with a median of 8.575 suggesting a slight right skew, as evidenced by a skewness value of 0.233. The kurtosis of 2.166 indicates a relatively moderate peak, with a maximum value of 15.430 and a minimum of 3.730, reflecting a reasonable range of development levels across the sample. In contrast, the EPR variable exhibits a much higher mean of 6593.332, with a median of 1387.285. The skewness of 3.038 reveals a significant rightward skew, indicating that while most observations fall at lower levels, there are a few extreme outliers, evidenced by a maximum of 67,684.33 and a minimum of 702.210. The high kurtosis of 11.662 suggests a heavy-tailed distribution, emphasizing the presence of these outliers. The EPU variable has a mean of 123.146 and a median of 108.384, with a skewness of 1.498, indicating a rightward skew similar to EPR. The kurtosis of 5.242 suggests more peak than a normal distribution, with values ranging from a minimum of 35.566 to a maximum of 363.358. The SPU shares similar characteristics with EPU, exhibiting a mean of 246.293, a median of 216.769, and a skewness of 1.498, reinforcing the notion of a rightward skew. The kurtosis of 5.242 indicates a distribution that is more peaked than normal.
The FD variable has a mean of 65.032 and a median of 51.265, with a skewness of 1.073, suggesting a slight rightward skew. The kurtosis of 2.916 indicates a distribution that is close to normal, with values ranging from a minimum of 13.647 to a maximum of 165.390. FDI shows a mean of 2.546 and a median of 2.564, with a low skewness of 0.082, indicating a nearly symmetric distribution. The kurtosis of 1.928 suggests a distribution slightly flatter than normal, with values ranging from a minimum of 0.502 to a maximum of 5.033. Finally, the GDP variable has a mean of 5.416 and a median of 6.009, with a negative skewness of −0.676, indicating a slight leftward skew. The kurtosis of 4.057 suggests a peaked distribution. The GDP values range from a minimum of −7.799 to a maximum of 14.230, indicating significant variation across the economies analyzed.
Overall, these descriptive statistics highlight the diverse nature of the variables in this study, emphasizing the varying levels of development, uncertainty, and economic performance across the BRICS nations. Table 5 shows the correlation matrix, which reveals important interdependencies among the variables.
Table 5.
Correlation statistics.
In Table 5, DET demonstrates a moderate negative correlation with EPR at −0.315, suggesting that as the development of environmental technologies increases, the registration of environmental patents may decrease, or vice versa. This relationship invites further investigation to uncover the underlying factors. EPU shows a positive correlation with both EPR and SPU, each at 0.340, indicating that higher levels of EPU are associated with increased environmental patent registrations. This could imply that uncertainty may drive firms to innovate more actively, seeking to secure patents in a rapidly changing regulatory environment. However, the correlation between EPU and DET is weak at 0.125, suggesting a minimal relationship. Moreover, FD exhibits a strong positive correlation with EPR (0.736), highlighting that greater financial development is linked to increased environmental patent registrations. This underscores the critical role that financial resources play in fostering innovation and development in environmental technologies. Interestingly, the correlation between FD and DET is negative at −0.393, implying that as financial development increases, there may be a corresponding decrease in DET, indicating potential inefficiencies in channeling financial resources towards technological advancements.
FDI shows a weak negative correlation with EPR (−0.179) and minimal correlations with other variables, suggesting that foreign investment does not significantly impact environmental patents or technologies in this context. In contrast, Gross Domestic Product (GDP) presents noteworthy negative correlations with both EPU (−0.492) and DET (−0.327), indicating that higher economic performance is associated with lower EPU and greater development in environmental technologies. This may suggest that stronger economies tend to exhibit greater stability and are less prone to uncertainty, thereby facilitating innovation. In summary, the correlation matrix highlights complex interrelationships among the variables, revealing notable positive and negative correlations that reflect the dynamics of EPU, financial development, and innovation in environmental technologies. These insights warrant further analysis to explore their implications for policy and practice.
Table 6 presents the results of a CS-ARDL model analyzing the impact of EPU on development in environmental technologies (DET). Table 6 is divided into two sections: the long-term equation and the short-term equation. In the long-term equation, EPU has a significant negative coefficient of −0.649, with a t-statistic of −4.115 and a p-value of 0.000. This indicates that higher levels of EPU are associated with a decrease in DET, suggesting that uncertainty in policy can hinder technological development. FD shows a positive coefficient of 0.378, indicating that as financial development increases, DET also increases. The t-statistic of 4.102 and a p-value of 0.000 confirm the significance of this relationship. FDI has a positive coefficient of 0.196, which is statistically significant (p-value of 0.021), implying that increased foreign investment positively influences DET. GDP presents a robust positive relationship with a coefficient of 0.968 and a t-statistic of 5.102, with a p-value of 0.000. This suggests that higher GDP levels are strongly associated with greater development in environmental technologies.
Table 6.
Impact of EPU on DET (Hypothesis 1).
In the short-term equation, the error correction term (COINTEQ01) has a negative coefficient of −0.200, indicating that any deviation from the long-term equilibrium will correct itself at a rate of approximately 20% per period. This suggests a significant adjustment process towards the long-term equilibrium. D(DET(-1)) shows a negative coefficient of −0.295, but the relationship is not statistically significant (p-value of 0.159). This indicates that the previous period’s change in DET does not significantly affect the current change. D(SPU) and its lagged term D(SPU(-1)) both show negative coefficients, but neither is statistically significant, indicating that changes in the square of EPU do not significantly impact DET in the short term. D(FD) and its lagged term D(FD(-1)) also present positive coefficients, but neither is statistically significant (p-values of 0.358 and 0.234, respectively), suggesting that changes in financial development do not have an immediate effect on DET.
In summary, the CS-ARDL model results indicate that while EPU has a significant negative impact on DET in the long term, the short-term dynamics show a more complex interplay among the variables, with certain lagged effects being significant. These findings highlight the importance of stable economic policies and financial development in fostering advancements in environmental technologies.
Table 7 presents the results of an ARDL model analyzing the impact of EPU on environmental patent registration (EPR). In the long-term equation, EPU has a significant negative coefficient of −0.776, with a t-statistic of −2.395 and a p-value of 0.021. This indicates that higher levels of EPU are associated with a decrease in EPR, suggesting that uncertainty in policy can discourage innovation and patenting activities. FD shows a strong positive coefficient of 0.773, with a t-statistic of 5.327 and a p-value of 0.000, indicating that increased financial development significantly boosts EPR. This highlights the importance of financial resources in facilitating environmental innovations. FDI also has a positive and statistically significant coefficient of 0.229 (p-value of 0.038), suggesting that higher levels of foreign investment positively influence environmental patent registrations. GDP shows a positive coefficient of 0.153 with a t-statistic of 1.903 and a p-value of 0.062. Although this relationship is not statistically significant at the conventional 0.05 level, it does indicate a potential positive trend worth further investigation.
Table 7.
Impact of EPU on EPR (Hypothesis 2).
In the short-term equation, the error correction term (COINTEQ01) has a negative coefficient of −0.091, indicating that any deviation from the long-term equilibrium corrects itself at a rate of approximately 9.15% per period. This shows a significant adjustment process towards equilibrium, with a p-value of 0.005 confirming its significance. D(EPR(-1)) has a negative coefficient of −0.077, but the relationship is not statistically significant (p-value of 0.774), suggesting that the previous period’s change in EPR does not significantly affect the current change. D(SPU) shows a negative coefficient of −1.366, yet it is not statistically significant (p-value of 0.206), indicating that changes in the square of EPU do not have a meaningful short-term impact on EPR.
In summary, the ARDL model results suggest that while EPU significantly negatively affects EPR in the long term, the short-term dynamics reveal a more complex interaction among the variables, with many coefficients not being statistically significant. The findings emphasize the importance of stable economic policies and financial development in promoting EPR.
Table 8 provides insights from an ARDL model examining the impact of squared EPU (SPU) on the development in environmental technologies (DET). In the long term, SPU shows a significant positive relationship, with a coefficient of 0.324 (p = 0.010), indicating that higher squared EPU is associated with increased development in environmental technologies. Financial development (FD) and foreign direct investment (FDI) also demonstrate significant positive effects, with coefficients of 0.378 (p = 0.001) and 0.197 (p = 0.011), respectively, highlighting the role of financial resources and investment in advancing this field. Additionally, GDP has a strong positive impact (coefficient of 0.968, p = 0.000), suggesting that economic growth is crucial for fostering developments in environmental technologies. In the short term, the cointegration term is significant and negative, indicating a correction towards long-term equilibrium. However, most short-term variables, including current and lagged changes in EPU, FD, FDI, and GDP, do not show statistically significant effects, except for the lagged FDI term, which has a significant negative impact (coefficient of −0.745, p = 0.006). Overall, while squared EPU has a notable long-term effect, the short-term dynamics reveal a more complex interaction with the development in environmental technologies.
Table 8.
Impact of SPU on DET (Hypothesis 3).
Table 9 illustrates the results from an ARDL model analyzing the impact of squared EPU (SPU) on environmental patent registration (EPR). In the long term, SPU exhibits a significant positive relationship with a coefficient of 0.888 (p = 0.000), indicating that higher squared EPU is associated with an increase in environmental patent registrations. FD and FDI also show significant positive effects, with coefficients of 0.197 (p = 0.024) and 0.229 (p = 0.038), respectively, suggesting that both financial resources and foreign investment play vital roles in enhancing environmental innovation. GDP presents a positive coefficient of 0.153 (p = 0.062), although it is only marginally significant, indicating a potential influence of economic growth on environmental patent registrations. In the short-term analysis, the cointegration term (COINTEQ01) is significant and negative, with a coefficient of −0.091 (p = 0.002), suggesting that deviations from long-term equilibrium are corrected over time. However, the other short-term variables, including lagged changes in EPR, changes in EPU, FD, FDI, and GDP, do not yield statistically significant effects, as indicated by their high p-values. Overall, while squared EPU has a pronounced long-term impact on environmental patent registrations, the short-term dynamics reveal limited immediate influences from the other variables in the model.
Table 9.
Impact of SPU on EPR (Hypothesis 4).
The analysis presented in Table 6 and Table 7 demonstrates a negative impact of EPU on both DET and EPR, supporting the acceptance of hypotheses H1 and H2. Conversely, the findings in Table 8 and Table 9 reveal a positive effect of SPU on DET and EPR, thus confirming the acceptance of hypotheses H3 and H4.
The robustness analysis in Table 10 and Table 11 presents the effect of EPU and SPU on green innovation using FMOLS estimation. Table 10 shows that EPU has a significant negative effect on both EPR and DET, with coefficients of −0.317 and −0.271, respectively. Financial development (FD), FDI, and GDP positively influence green innovation, with FD and FDI showing particularly strong significance.
Table 10.
Robustness analysis—effect of EPU on green innovation.
Table 11.
Robustness analysis—effect of SPU on green innovation.
In Table 11, SPU exhibits a significant positive effect on green innovation, with coefficients of 0.362 for DET and 0.139 for EPR. The adjusted R-squared values indicate a better model fit for EPU’s impact on EPR (0.708) and SPU’s impact on DET (0.521), while other variables like FD, FDI, and GDP consistently support green innovation across both analyses.
6. Discussion on Results
This research embarks on an insightful exploration of the relationship between EPU and the evolution of environmental technologies, alongside environmental patent registration, within the BRICS economies, e.g., Brazil, Russia, India, China, and South Africa, spanning the years 2010 to 2022. By employing the ARDL model, we illuminate both the immediate and enduring effects of policy uncertainty on green innovation, revealing a nuanced picture of opportunity and challenge.
The analysis reveals a significant inverse relationship between EPU and the advancement of environmental technologies. As EPU increases, the momentum for investment in environmental innovation diminishes. This decline can be attributed to several factors. Firstly, when economic policies are uncertain, firms face challenges in forecasting future market conditions, making it difficult to justify long-term investments in new technologies [38]. Secondly, unpredictable regulatory shifts can lead to higher compliance costs and operational risks, prompting businesses to prioritize short-term stability over innovative projects. This aversion to risk inhibits the commitment of resources necessary for developing and deploying sustainable technologies [39]. In addition, the study identifies a negative relationship between EPU and environmental patent registrations. Higher levels of EPU correlate with fewer patent applications in the environmental sector, indicating that uncertainty in policy environments discourages firms from pursuing intellectual property rights for innovative green solutions. Companies may hesitate to invest in patenting their technologies when they are uncertain about regulatory changes and potential returns on investment. This trend underscores the importance of stable policy frameworks in fostering both investment and innovation in environmental technologies. Without clear and consistent policies, businesses may lack the confidence needed to protect their innovations, ultimately stifling progress in the environmental sector.
In a compelling contrast, analysis further reveals a positive and significant relationship between square EPU (SPU) and the development of environmental technologies. This non-linear relationship suggests that while moderate levels of economic policy uncertainty (EPU) may inhibit innovation, elevated levels of uncertainty can actually stimulate creative responses from firms. The squared term indicates a threshold effect: as uncertainty increases, companies may shift their focus toward innovation, recognizing it as a crucial strategy for differentiation in a competitive market. This proactive approach allows firms to leverage uncertainty as a driving force, encouraging them to invest in advanced technologies that support environmental objectives. Similarly, the study identifies a positive relationship between square EPU (SPU) and environmental patent registrations. As SPU rises, there is an increase in patent applications within the environmental sector. This trend indicates that when faced with significant uncertainty, companies may prioritize securing intellectual property rights to safeguard their advancements in green technologies, utilizing innovation as a strategy to thrive amidst challenges.
The non-linearity observed in the study’s findings can be interpreted as reflective of the high real option value of green innovation, particularly during periods of elevated uncertainty. In situations where policy uncertainty reaches higher levels, firms may recognize that investments in environmental technologies and green patents offer real options; they can be adjusted or built upon as conditions evolve, providing flexibility and competitive advantage in uncertain environments. This explains why the positive coefficient for the quadratic term (EPU2) emerges: as uncertainty rises, firms may increase their investments in green innovation because they perceive it as a way to hedge against future uncertainty, capitalize on emerging opportunities, or gain a first-mover advantage in sustainability-driven markets. Thus, the non-linear relationship between EPU and green innovation can be understood through the lens of Real Options Theory, where the reversibility and strategic value of green innovation projects make them attractive under high uncertainty. This interpretation is consistent with Campello et al.’s [40] work and provides a solid justification for the observed non-linearity in the study’s findings.
The non-linear impact of SPU (the square of EPU) on DET and EPR reflects the complex relationship between escalating policy uncertainty and green innovation outcomes. The squared term indicates that the effect of EPU is not linear, suggesting that its impact intensifies or changes direction at higher levels. Initially, rising EPU negatively affects DET and EPR, as firms and ESG investors become more risk-averse due to unclear policy directions. This uncertainty can lead to reduced investments in green technologies, slowing down the innovation process. However, the squared term (SPU) implies that at very high levels of uncertainty, the relationship could change. This may be where the role of government guarantees becomes critical. Governments, recognizing the risks associated with heightened uncertainty, may step in with guarantees or support mechanisms to stabilize the investment environment. These guarantees reduce perceived risk for ESG investors, restoring their confidence and incentivizing them to continue investing in green innovations despite the uncertain policy landscape. Thus, the non-linear relationship indicates that while moderate levels of EPU can stifle innovation, extremely high levels—when supported by government intervention—can create an environment where DET and EPR may increase, as firms and investors adjust to the new norm of uncertainty with appropriate safeguards in place.
The findings of this study clearly demonstrate a non-linear relationship between EPU and green innovation in BRICS countries, as reflected in the title. However, it is important to acknowledge that providing interpretations based on specific levels of EPU, using ad hoc economic reasoning, may not fully capture the complexity of this relationship. Potential sources of non-linearities could include factors such as firm heterogeneity in terms of risk tolerance and innovation capabilities, the timing and intensity of government interventions, or the sector-specific responses to uncertainty. For instance, firms in different sectors may react to rising uncertainty in distinct ways; some may scale back investment in innovation due to risk aversion, while others may increase innovation to secure a competitive edge. Additionally, policy measures or regulatory changes could exacerbate or mitigate these effects, leading to non-linear innovation responses across firms and industries.
In conclusion, the findings of this study offer profound insights into how EPU shapes the trajectory of environmental technologies and patent registrations across the BRICS nations. The link between the negative impacts of EPU and the positive effects of square EPU underscores the importance of contextual factors influencing firms’ strategic responses. As BRICS countries deal with pressing environmental challenges, these insights provide a pivotal framework for designing policies that not only stimulate innovation but also promote sustainable development amid an ever-changing economic perspective.
7. Conclusions and Policy Recommendation
This study provides valuable insights into the effects of EPU and its squared term (square EPU) on the development of environmental technologies and environmental patent registration within the BRICS economies from 2010 to 2022. Our findings demonstrate a significant negative relationship between EPU and both environmental innovation and patent registrations, indicating that heightened uncertainty discourages investment in sustainable technologies. Conversely, the positive relationship established with square EPU suggests that elevated levels of uncertainty can motivate firms to pursue innovative solutions, viewing them as essential strategies for differentiation in a competitive market. These results highlight the dual nature of EPU, emphasizing the need for policymakers to create an environment that balances stability with the potential for innovation. As the world faces pressing environmental challenges, the role of effective policy frameworks becomes increasingly critical in fostering sustainable development.
To foster the development of environmental technologies and enhance patent registrations in the BRICS economies, policymakers should prioritize the establishment of stable regulatory frameworks that reduce EPU. Clear and consistent regulations will create a predictable environment, encouraging businesses to invest confidently in research and development for sustainable innovations. Additionally, targeted incentives such as grants and tax credits should be implemented to support R&D efforts in green technologies, helping to mitigate the financial risks associated with high upfront costs. Promoting collaboration between public institutions, private enterprises, and academic organizations will further enhance knowledge sharing and resource pooling, driving innovation and efficiency in environmental technology development. Finally, strengthening intellectual property protections is essential to encourage firms to patent their innovations, providing them with the confidence to invest in new technologies. By adopting these strategies, BRICS countries can effectively create a conducive environment for environmental innovation and contribute to sustainable economic growth.
Research Limitations and Future Direction
A key limitation of this study is its generalizability. The focus on the BRICS economies may restrict the applicability of the findings to other regions or countries with different economic, political, and cultural contexts. Factors influencing EPU and environmental innovation can vary significantly across different nations, making it challenging to extrapolate results beyond the BRICS group.
Expanding the analysis to include other emerging economies could also offer a broader perspective on the impacts of EPU. Moreover, exploring the role of emerging technologies, such as artificial intelligence and blockchain, in promoting environmental sustainability presents a promising avenue for further investigation.
Author Contributions
Conceptualization, U.F. and M.I.T.; Methodology, M.M.A.; Validation, B.H.S.; Formal analysis, Z.S. and M.M.A.; Resources, U.F. and B.H.S.; Writing—original draft, M.M.A. and M.I.T.; Writing—review & editing, M.M.A. All authors have read and agreed to the published version of the manuscript.
Funding
The authors extend their appreciation to the Deanship of Research and Graduate Studies at King Khalid University for funding this work through the Large Research Project under grant number RGP.2/539/45.
Institutional Review Board Statement
Not applicable.
Informed Consent Statement
The authors declare no conflicts of interest.
Data Availability Statement
Data that support the findings of study are available at WDI, and OECD Statistics.
Conflicts of Interest
The authors declare no conflict of interest.
References
- Myers, S.C. Determinants of corporate borrowing. J. Financ. Econ. 1977, 5, 147–175. [Google Scholar] [CrossRef]
- Rogers, E. Diffusion of Innovations; Free Press: New York, NY, USA, 1962. [Google Scholar]
- North, D.C. Institutions, Institutional Change and Economic Performance; Cambridge University Press: Cambridge, UK, 1990. [Google Scholar]
- Grossman, G.M.; Krueger, A.B. Environmental Impacts of a North American Free Trade Agreement; National Bureau of Economic Research: Cambridge, MA, USA, 1991. [Google Scholar]
- Cui, X.; Wang, C.; Sensoy, A.; Liao, J.; Xie, X. Economic policy uncertainty and green innovation: Evidence from China. Econ. Model. 2023, 118, 106104. [Google Scholar] [CrossRef]
- Li, X.; Hu, Z.; Zhang, Q. Environmental regulation, economic policy uncertainty, and green technology innovation. Clean Technol. Environ. Policy 2021, 23, 2975–2988. [Google Scholar] [CrossRef]
- Xu, Y.; Yang, Z. Economic policy uncertainty and green innovation based on the viewpoint of resource endowment. Technol. Anal. Strateg. Manag. 2023, 35, 785–798. [Google Scholar] [CrossRef]
- Udeagha, M.C.; Muchapondwa, E. Environmental sustainability in South Africa: Understanding the criticality of economic policy uncertainty, fiscal decentralization, and green innovation. Sustain. Dev. 2023, 31, 1638–1651. [Google Scholar] [CrossRef]
- Zhou, X.; Dai, M.; Ma, X.; Charles, V.; Shahzad, U.; Zhao, X. Economic policy uncertainty and the inhibitory effect of firms’ green technology innovation. Glob. Financ. J. 2024, 60, 100960. [Google Scholar] [CrossRef]
- Geng, Y.; Zheng, Z.; Ma, Y. Digitization, perception of policy uncertainty, and corporate green innovation: A study from China. Econ. Anal. Policy 2023, 80, 544–557. [Google Scholar] [CrossRef]
- Bai, D.; Du, L.; Xu, Y.; Abbas, S. Climate policy uncertainty and corporate green innovation: Evidence from Chinese A-share listed industrial corporations. Energy Econ. 2023, 127, 107020. [Google Scholar] [CrossRef]
- Huang, J.; Wang, Z.; Jiang, Z.; Zhong, Q. Environmental policy uncertainty and corporate green innovation: Evidence from China. Eur. J. Innov. Manag. 2023, 26, 1675–1696. [Google Scholar] [CrossRef]
- Niu, S.; Zhang, J.; Luo, R.; Feng, Y. How does climate policy uncertainty affect green technology innovation at the corporate level? New evidence from China. Environ. Res. 2023, 237, 117003. [Google Scholar] [CrossRef]
- Du, Y.; Guo, Q. Green credit policy and green innovation in green industries: Does climate policy uncertainty matter? Financ. Res. Lett. 2023, 58, 104512. [Google Scholar] [CrossRef]
- Ren, X.; Xia, X.; Hesary, F.T. Uncertainty of uncertainty and corporate green innovation—Evidence from China. Econ. Anal. Policy 2023, 78, 634–647. [Google Scholar] [CrossRef]
- Li, R.; Xu, G.; Ramanathan, R. The impact of environmental investments on green innovation: An integration of factors that increase or decrease uncertainty. Bus. Strategy Environ. 2022, 31, 3388–3405. [Google Scholar] [CrossRef]
- Sohail, M.T.; Ullah, S.; Majeed, M.T. Effect of policy uncertainty on green growth in high-polluting economies. J. Clean. Prod. 2022, 380, 135043. [Google Scholar] [CrossRef]
- Li, J.; Kong, T.; Gu, L. The impact of climate policy uncertainty on green innovation in Chinese agricultural enterprises. Financ. Res. Lett. 2024, 62, 105145. [Google Scholar] [CrossRef]
- Feng, G.F.; Zheng, M. Economic policy uncertainty and renewable energy innovation: International evidence. Innov. Green Dev. 2022, 1, 100010. [Google Scholar] [CrossRef]
- Wang, C.; Abbasi, K.R.; Irfan, M.; Salha, O.B.; Bandyopadhyay, A. Navigating sustainability in the US: A comprehensive analysis of green energy, eco-innovation, and economic policy uncertainty on sectoral CO2 emissions. Energy Rep. 2024, 11, 5286–5299. [Google Scholar] [CrossRef]
- Hnainia, H.; Mensi, S. The role of institutional factors in shaping the relationship between economic policy uncertainty and energy consumption in Gulf countries: An empirical analysis. J. Financ. Econ. Policy, 2024; ahead-of-print. [Google Scholar] [CrossRef]
- Fatima, N.; Xuhua, H.; Alnafisah, H.; Zeast, S.; Akhtar, M.R. Enhancing climate action in OECD countries: The role of environmental policy stringency for energy transitioning to a sustainable environment. Environ. Sci. Eur. 2024, 36, 157. [Google Scholar] [CrossRef]
- Anwar, A.; Barut, A.; Pala, F.; Ata, N.K.; Kaya, E.; Lien, D.T.Q. A different look at the environmental Kuznets curve from the perspective of environmental deterioration and economic policy uncertainty: Evidence from fragile countries. Environ. Sci. Pollut. Res. 2024, 31, 46235–46254. [Google Scholar] [CrossRef]
- Hurtado, S.R.B.; Martínez, K.T.; Diaz, V.T.; Quito, B.; Ojeda, C.; Morena, S.O. Assessing the influence of GDP, globalization, civil liberties, and foreign direct investment on researchers in R&D per country: Dynamic Panel Cointegration Analysis for Latin American countries. Soc. Sci. Humanit. Open 2024, 10, 100929. [Google Scholar]
- Zhu, S.; Zafar, M.W.; Usman, M.; Kalugina, O.A.; Khan, I. Reducing transport sector CO2 emissions patterns: Environmental technologies and renewable energy. J. Open Innov. Technol. Mark. Complex. 2024, 10, 100217. [Google Scholar]
- Xu, A.; Song, M.; Xu, S.; Wang, W. Accelerated green patent examination and innovation benefits: An analysis of private economic value and public environmental benefits. Technol. Forecast. Soc. Chang. 2024, 200, 123105. [Google Scholar] [CrossRef]
- Wang, L.; Wang, Q.; Jiang, F. Booster or stabilizer? Economic policy uncertainty: New firm-specific measurement and impacts on stock price crash risk. Financ. Res. Lett. 2023, 51, 103462. [Google Scholar] [CrossRef]
- Yu, W.; Gan, Y.; Zhou, B.; Dai, J. Revisiting the economic policy uncertainty and resource rents nexus: Moderating impact of financial sector development in BRICS. Int. Rev. Financ. Anal. 2024, 94, 103324. [Google Scholar] [CrossRef]
- Utouh, H.M.L.; Kitole, F.A. Forecasting effects of foreign direct investment on industrialization towards realization of the Tanzania development vision 2025. Cogent Econ. Financ. 2024, 12, 2376947. [Google Scholar] [CrossRef]
- Im, K.S.; Pesaran, M.H.; Shin, Y. Testing for unit roots in heterogeneous panels. J. Econom. 2003, 115, 53–74. [Google Scholar] [CrossRef]
- Dickey, D.A.; Fuller, W.A. Distribution of the estimators for autoregressive time series with a unit root. J. Am. Stat. Assoc. 1979, 74, 427–431. [Google Scholar]
- Farooq, U.; Tabash, M.I.; Al-Faryan, M.A.S.; Daniel, L.N.; Aburezeq, I.M. Effect of financial sector development and FDI inflow on employment rate in South Asia: New empirical evidence from ARDL approach. J. Public Aff. 2024, 24, e2911. [Google Scholar] [CrossRef]
- Tabash, M.I.; Farooq, U.; Al-Absy, M.S.M.; Albzour, O.F.; Mahmoud, O.A. How does economic policy uncertainty influence the innovation activities: Empirical evidence from BRICS. J. Open Innov. Technol. Mark. Complex. 2023, 9, 100164. [Google Scholar] [CrossRef]
- Razak, S.E.A.; Mustapha, M.; Shah, S.M.; Kasim, N.A.A. Sustainability risk management: Are Malaysian companies ready? Heliyon 2024, 10, e24681. [Google Scholar] [CrossRef]
- Shabir, M.; Jiang, P.; Hashmi, S.H.; Bakhsh, S. Non-linear nexus between economic policy uncertainty and bank lending. Int. Rev. Econ. Financ. 2022, 79, 657–679. [Google Scholar] [CrossRef]
- Abid, N.; Ceci, F.; Ahmad, F.; Aftab, J. Financial development and green innovation, the ultimate solutions to an environmentally sustainable society: Evidence from leading economies. J. Clean. Prod. 2022, 369, 133223. [Google Scholar] [CrossRef]
- Shao, H.; Huang, X.; Wen, H. Foreign direct investment, development strategy, and green innovation. Energy Environ. 2024, 35, 3116–3143. [Google Scholar] [CrossRef]
- Campello, M.; Cortes, G.S.; d’Almeida, F.; Kankanhalli, G. Exporting Uncertainty: The Impact of Brexit on Corporate America. J. Financ. Quant. Anal. 2022, 57, 3178–3222. [Google Scholar] [CrossRef]
- Baker, S.R.; Bloom, N.; Davis, S.J. Measuring economic policy uncertainty. Q. J. Econ. 2016, 131, 1593–1636. [Google Scholar] [CrossRef]
- Sun, G.; Fang, J.; Li, T.; Ai, Y. Effects of climate policy uncertainty on green innovation in Chinese enterprises. Int. Rev. Financ. Anal. 2024, 91, 102960. [Google Scholar] [CrossRef]
Disclaimer/Publisher’s Note: The statements, opinions and data contained in all publications are solely those of the individual author(s) and contributor(s) and not of MDPI and/or the editor(s). MDPI and/or the editor(s) disclaim responsibility for any injury to people or property resulting from any ideas, methods, instructions or products referred to in the content. |
© 2024 by the authors. Licensee MDPI, Basel, Switzerland. This article is an open access article distributed under the terms and conditions of the Creative Commons Attribution (CC BY) license (https://creativecommons.org/licenses/by/4.0/).