Article

Using HF183 to Estimate Watershed-Wide Annual Loadings of Human Fecal Pollution from Onsite Wastewater Treatment Systems

by
Kenneth Schiff
1,*,
Amity Zimmer-Faust
1,2,
Duy Nguyen
1,
John Griffith
1,
Joshua Steele
1,
Darcy Ebentier McCargar
3,4 and
Sierra Wallace
3,4
1
Southern California Coastal Water Research Project, Costa Mesa, CA 92626, USA
2
The Nature Conservancy, Seattle, WA 22203-1606, USA
3
WSP, San Diego, CA 92123, USA
4
Rick Engineering, San Diego, CA 92110, USA
*
Author to whom correspondence should be addressed.
Sustainability 2024, 16(21), 9503; https://doi.org/10.3390/su16219503
Submission received: 29 June 2024 / Revised: 20 September 2024 / Accepted: 21 October 2024 / Published: 31 October 2024
(This article belongs to the Section Pollution Prevention, Mitigation and Sustainability)

Abstract

:
Onsite wastewater treatment systems (OWTSs or septic systems), when properly sited, designed, operated, and maintained, treat domestic wastewater to reduce impacts on and maintain sustainability of aquatic resources. However, when OWTSs are not performing as expected, they can be a potential source of human fecal pollution to recreational waters, resulting in an increased risk of illness to swimmers. Quantifying the contribution of poor-performing OWTSs relative to other sources of fecal pollution is particularly challenging in wet weather when various sources commingle as they flow downstream. This study aimed to estimate the total load of human fecal pollution from OWTSs in an arid watershed with municipal separate storm sewer systems (MS4). The novel study design sampled HF183, a DNA-based human marker, from six small catchments containing only OWTSs and no other known human fecal sources, such as sanitary sewer collection systems or people experiencing homelessness. Then, the human fecal loading from the representative catchments was extrapolated to the portions of the watershed that were not sampled but contained OWTSs. Flow-weighted mean HF183 concentrations ranged from 104 to 107 gene copies/100 mL across 29 site-events. HF183 mass loading estimates were normalized to the number of parcels per catchment and inches of rainfall per storm event. Assuming the normalized loading estimate was representative, extrapolation to all of the OWTS parcels in the watershed and average annual rainfall quantity illustrated that HF183 loading from OWTSs was a small but measurable fraction of the total HF183 mass loading emanating at the bottom of the watershed. Clearly, other human fecal sources contributed HF183 during storm events in this watershed. The loading estimate approach used in this study could be applied to other watersheds facing similar challenges in prioritizing resources for monitoring and mitigation among co-located human fecal sources.

1. Introduction

Fecal indicator bacteria (FIB) are a major concern for stormwater managers across the United States. For example, in California, with over 200 million beachgoers annually [1,2], more than 650 waterbody–pollutant combinations are listed as impaired by FIB [3]. The cost of bacterial contamination remediation in a single coastal county is estimated to be up to USD eight billion [4].
Relying on FIB such as Enterococcus, E. coli, and fecal or total coliforms as metrics of clean water poses many challenges because concentrations of these FIB nearly always exceed water quality objectives following rain events across the USA and elsewhere [5,6,7]. This applies to catchments comprised of virtually any urban land use [8,9,10,11], including open spaces comprised of natural lands with little to no population and no human infrastructure [12]. In California, wet weather bacterial pollution is so pervasive that public health officers issue pre-emptive warnings to beachgoers about the risk of swimming for up to three days following rainfall.
Some stormwater managers have started using the Bacteroides (HF183) human-associated DNA marker as an alternative indicator to traditional FIB [13,14,15]. HF183 is an attractive indicator because it is both sensitive and specific for human sources of fecal contamination [16], whereas coliforms and enterococci can be shed by any warm-blooded organism [17,18]. The sensitivity and specificity of HF183 for human-specific fecal pollution allows stormwater managers to focus on the human fecal sources, which are most likely to cause illness [19,20,21,22].
Urban watersheds have many potential human fecal sources, including public or private sanitary sewer collection systems, onsite wastewater treatment systems (OWTSs or “septic systems”), and people experiencing homelessness. HF183 cannot distinguish between these different human fecal sources, necessitating novel study designs to estimate concentrations and loads of human fecal contamination from each of these individual sources. This task becomes exponentially more difficult during wet weather when these human fecal sources dynamically mix as they flow downstream to the beach.
When properly sited, designed, operated, and maintained, OWTSs can be an effective strategy for treating domestic wastewater, reducing impacts on aquatic environments and protecting public health [23,24]. OWTSs are particularly effective for treating domestic wastewater where no centralized collection and treatment system exists. However, some OWTSs may not function properly due to various factors, including: (a) improper siting without sufficient setbacks to surface or ground water; (b) improper design without sufficient capacity or infiltrative area; (c) improper operation and maintenance, including failure to remove accumulated solids, increasing volumes beyond design capacity, or use of prohibited chemicals; and (d) failing or broken components, such as a deteriorating septic tank (i.e., no longer watertight), impacts from tree roots, broken or clogged dispersal piping, broken or offset leach line distribution box or cross-over piping, broken or clogged laterals, and improper settings and operation of pump systems [23,24,25,26].
The goals of this study are twofold: (1) estimating the annual mass loading of human fecal pollution during wet weather from OWTSs in an arid urban watershed using a novel study design and (2) comparing the OWTS annual load estimate to the watershed-wide annual load estimates of human fecal pollution from all human sources. Stormwater managers—both regulated and regulatory agencies—can use this information on relative human fecal pollutant loading for sustainability planning, such as discussing the need and potential options for additional OWTS management actions [27].

2. Materials and Methods
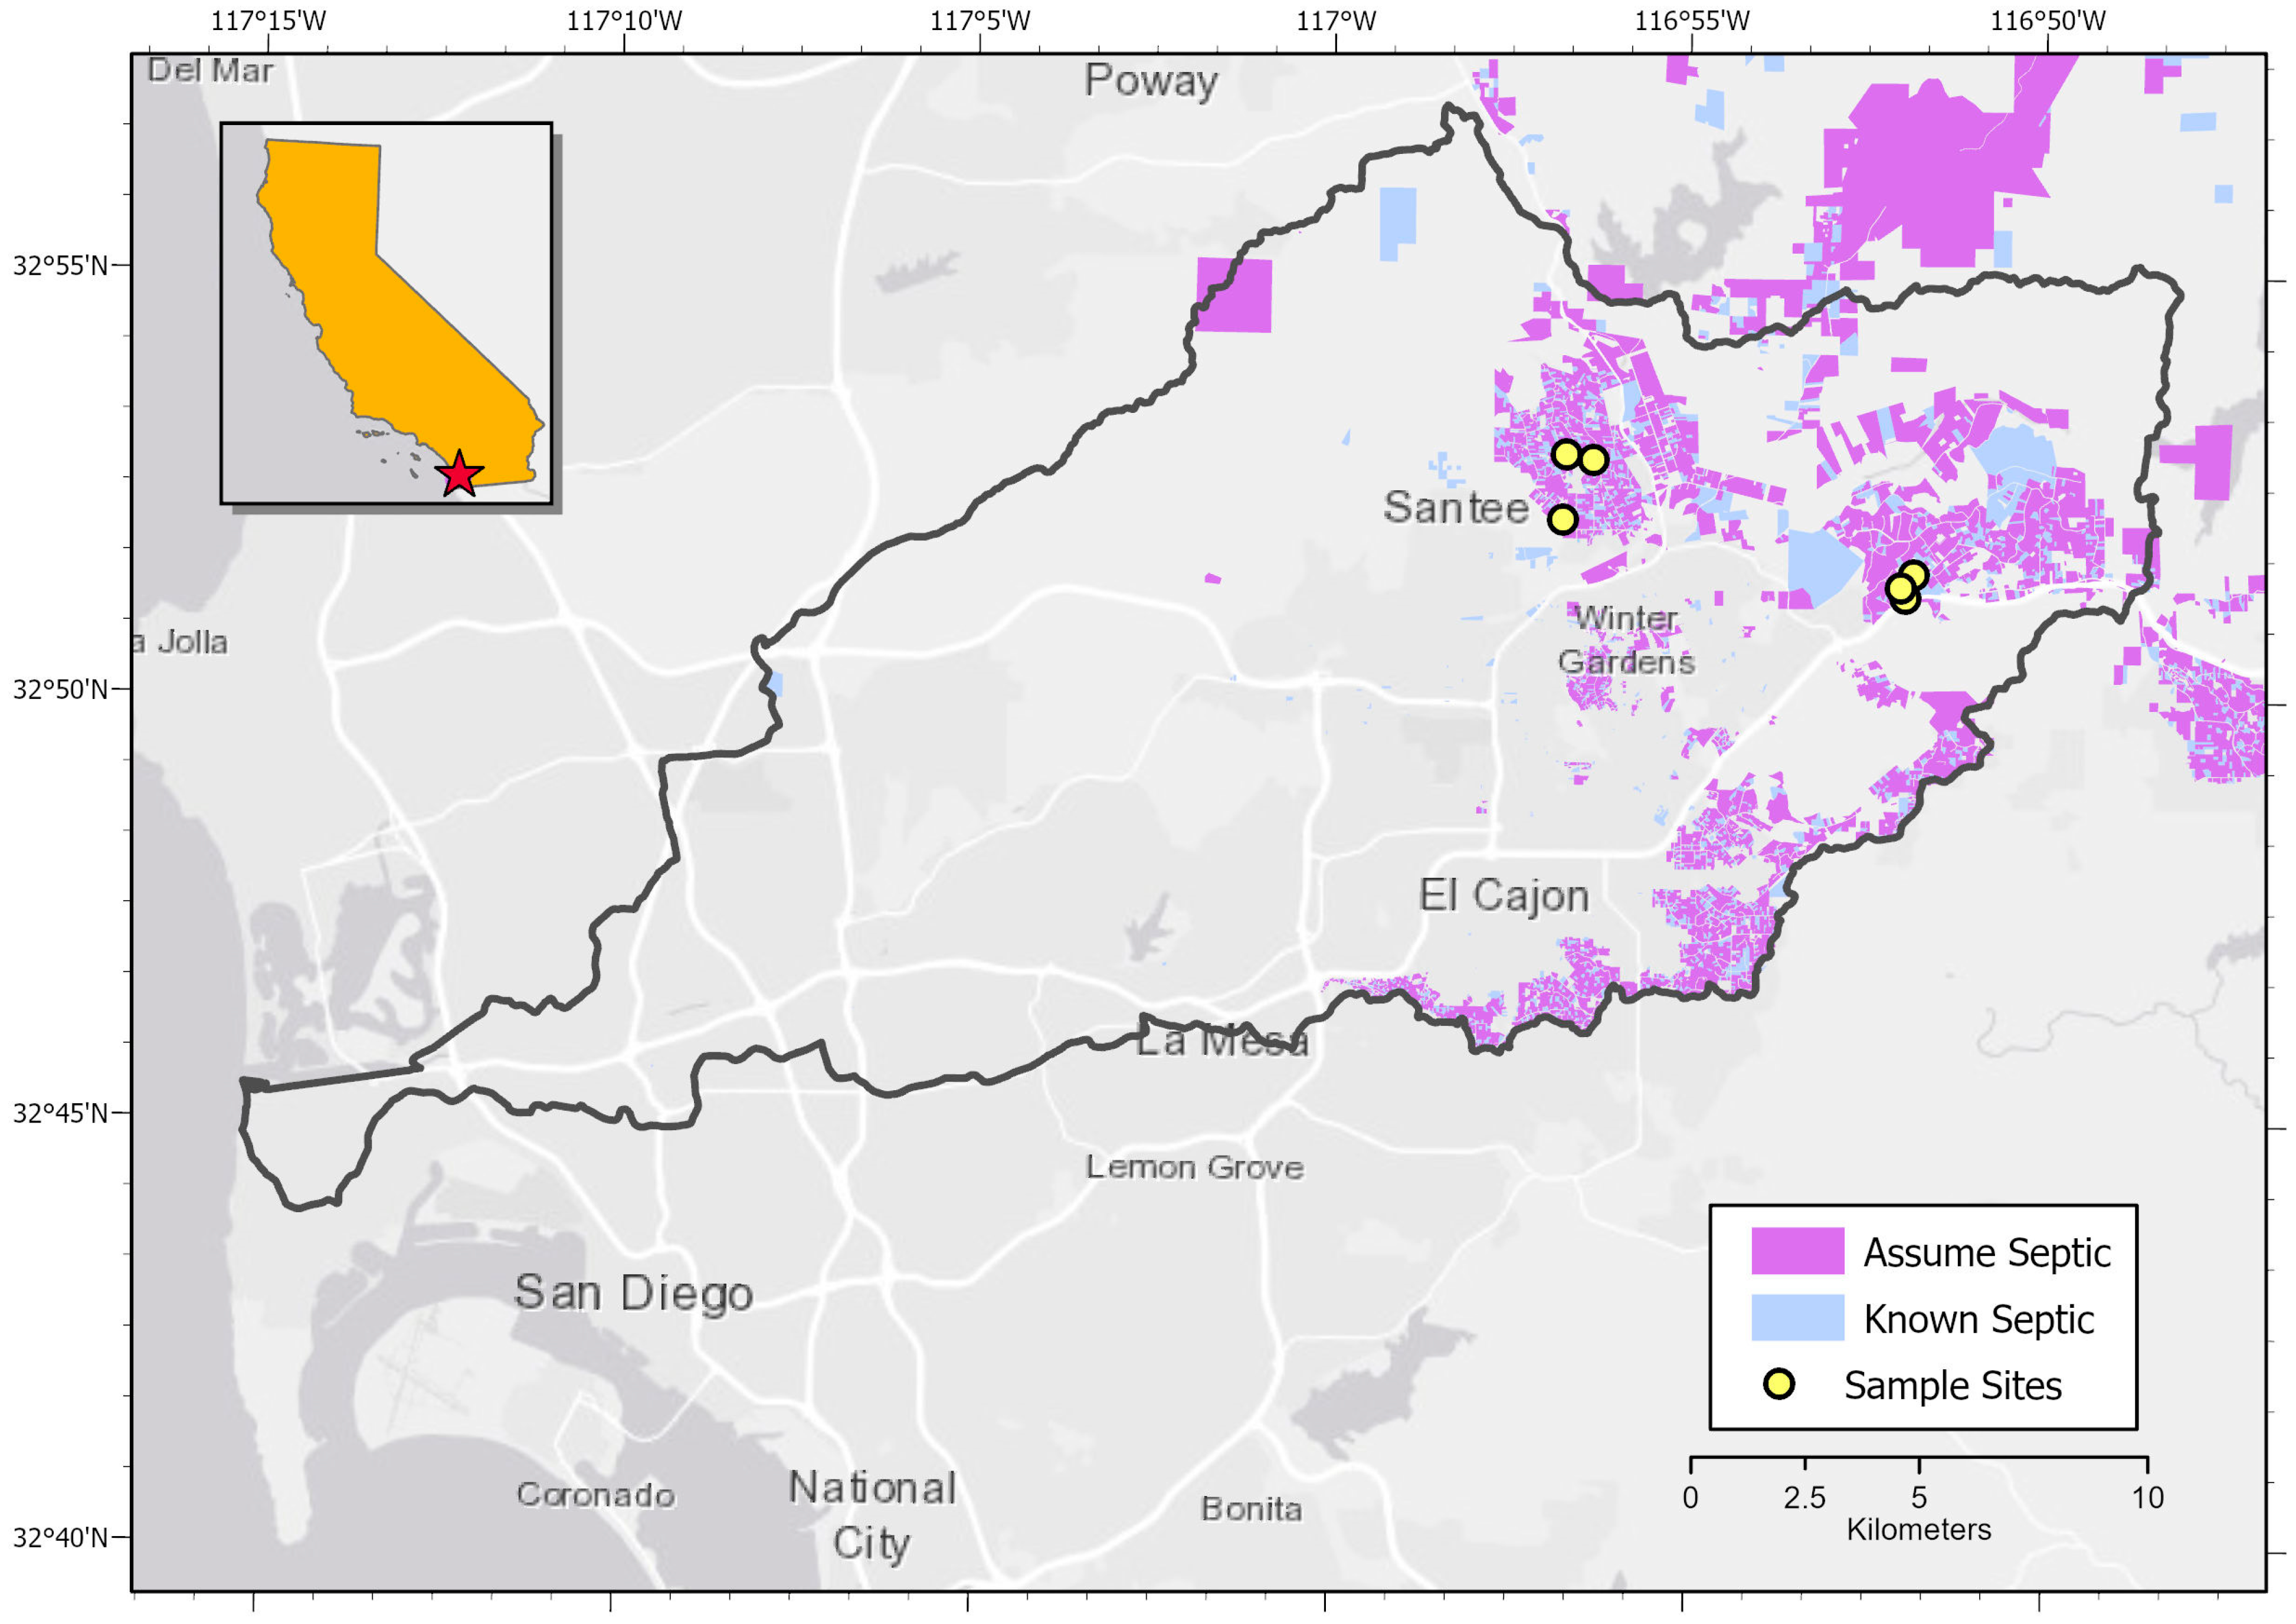
2.1. Setting

The lower San Diego River (SDR), located in San Diego, CA, USA, is an urban arid watershed covering 419.1 km2 with 55% development. The wet season lasts from October to April, with the majority of rainfall in January through March; historically, rainfall between April and October is rare. This arid landscape averages 10 storms per year, with a cumulative 26 cm of rainfall annually. Average monthly low temperatures during the wet season range from 8.9 to 15.6 °C, while average monthly high temperatures during the wet season range from 18.3 to 22.8 °C. This Mediterranean climate supports chaparral and coastal sage scrub plant communities.
An estimated 6760 land parcels with OWTSs are located in the SDR watershed [28], based on both documented OWTS locations and parcels with structures and no sewer available for connections (assumed OWTS) (Figure 1). OWTSs in this watershed typically consist of a septic tank to separate solids connected to leach lines that disperse the sewage into a leach field, where natural soils filter and degrade harmful bacteria and other pollutants [26]. Of these parcels, the exact number of OWTSs that are non- or under-performing is unknown. The lower watershed is hydrologically disconnected from the upper watershed by multiple dams, and none of the dams produced bypass or overflow during the study period.

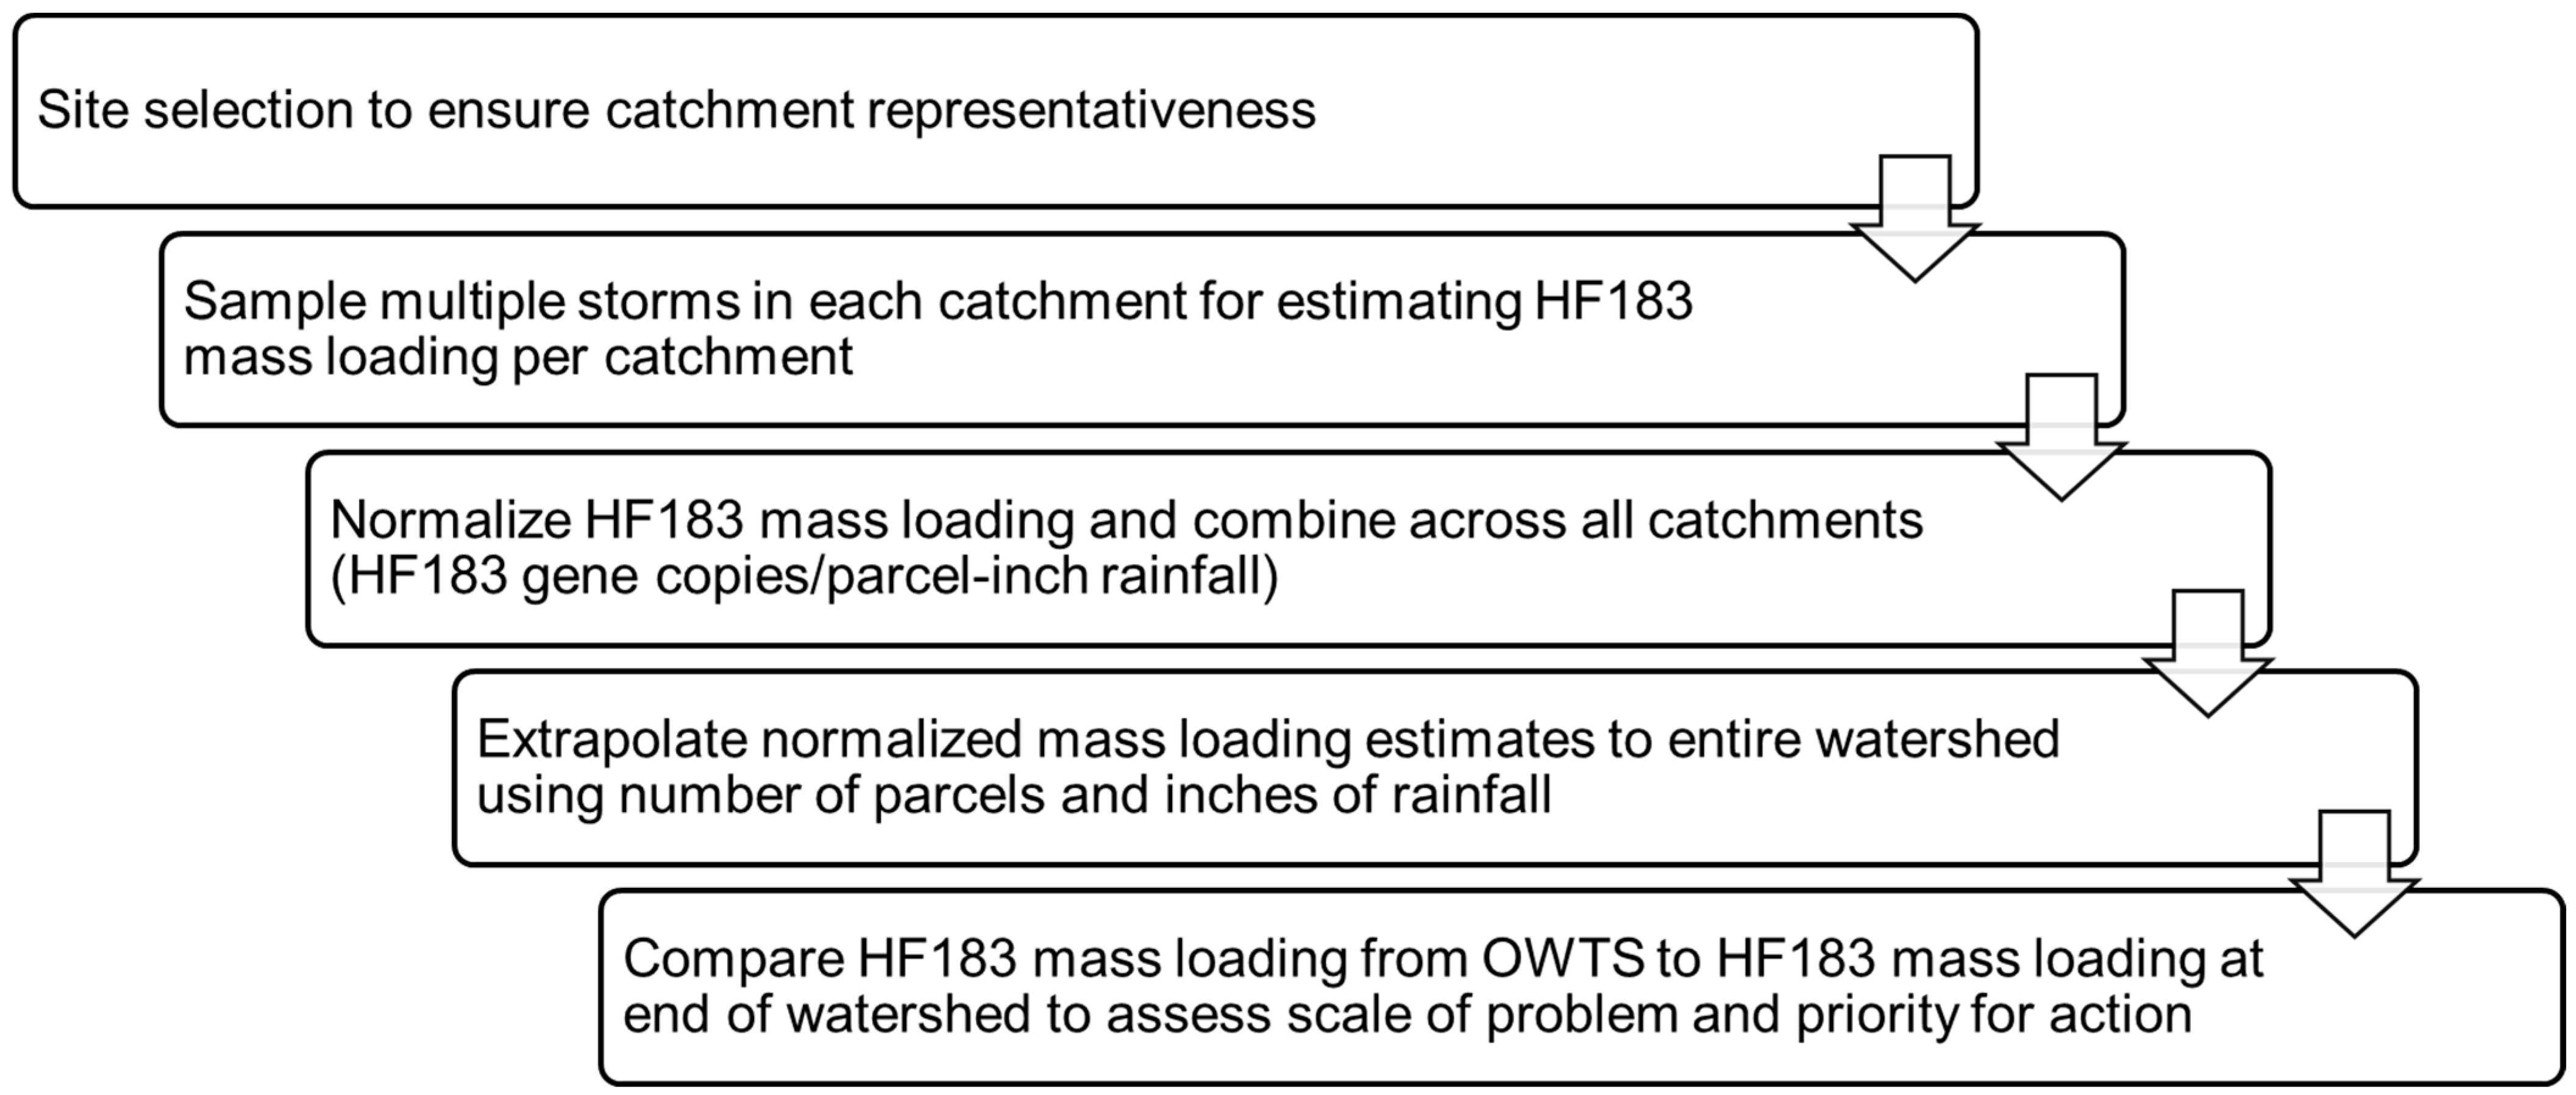
2.2. General Approach

The study was designed (Figure 2) to sample a variety of small catchments with only OWTSs (no sewer), representing the range of land use, soil types, rainfall characteristics, and ratio of under- or non-performing OWTSs relative to all OWTS-only catchments in the SDR watershed. These catchments were sampled across multiple storm events for volume and composite HF183 concentrations. Then, these catchment-wide HF183 mass emission estimates were normalized by the number of parcels in the catchment and inches of rainfall per storm event. Using the HF183 mass per parcel per inch rainfall, total HF183 annual mass loading from all OWTSs was calculated based on the number of parcels with OWTSs and the average number of inches of rainfall per year over the last 10 years.

2.3. Site Selection

A total of six catchments were selected for sampling in two tributaries—Los Coches Creek and Eucalyptus Hills—in the SDR watershed. All six sites exclusively had OWTSs with no other identified human fecal sources, including sanitary sewer or homelessness. Consistent with an arid watershed, these six sites had little to no flow when it was not raining. It was assumed that there was one OWTS per property. No information exists for this watershed on the age, working condition, or time since the last maintenance for individual OWTSs.
Sampling sites consisted of locations where flow could be rated and measured using a combination of weirs, flumes, pressure transducers, and/or area-velocity meters. Manually derived rating curves using a Marsh-McBurney handheld velocity meter and stadia rod (EST Environmental Technologies Ltd., Vancouver, BC, Canada) during storm events helped validate flow estimates. Field sampling consisted of 10 L of flow-weighted samples or 10 L of time-weighted samples. Flow-weighted samples collected subsamples based on the amount of flow, and time-weighted samples were collected from 15 min subsamples for six hours or until flow ceased. Previous research showed that flow-weighted and time-weighted composite samples produce comparable results, as long as a minimum number of subsamples are collected [29]. Six-hour composite samples were selected to conform with the holding time criteria for FIB analysis. If storm flows lasted longer than six hours, then a second six-hour composite sample was collected. Data quality objectives required that a minimum of 90% of the storm flow was representatively sampled. Cumulatively across all storms and sites, sampling achieved 99% representative storm flow capture. Samples were collected using Teflon tubing connected to a peristaltic pump. All parts that touched samples were pre-cleaned and sterilized prior to field deployment. Equipment blanks were collected prior to each storm season, and field blanks were collected every storm. Additionally, precipitation data were collected at 1 min intervals at each site for each monitored storm event. Precipitation data were also collected from a nearby County Flood Control District tipping bucket gauge at Flinn Springs County Park (#27025). All rain gauges were located within 1420 m of sampling locations.

2.4. Laboratory Analysis

Once delivered to the laboratory, 100 mL portions of the well-mixed water samples were filtered through 0.4-micron polycarbonate or 0.45-micron mixed cellulose ester membranes to collect bacteria and then flash frozen in liquid nitrogen and stored at −80 °C prior to DNA extraction.
Frozen filters were processed in batches using commercially available DNA extraction kits (GeneRite RW-01 kit, GeneRite, Rocky Hill, NJ, USA). DNA extraction followed the methods developed by Cao et al. [30] and Steele et al. [31]. Briefly, frozen filters were placed into sterile 2 mL plastic tubes preloaded with glass beads. A lysis buffer was added, and the tubes were placed on a BioSpec Mini-Beadbeater-16 (BioSpec Products Inc., Bartlesville, OK, USA) at maximum speed for 2 min. The extraction then proceeded according to the manufacturer’s instructions. DNA was eluted from the spin column in 100 μL of an elution buffer. Aliquots of eluted sample DNA were stored at −80 °C until they were analyzed by droplet digital PCR.
Negative extraction controls (NECs) containing only a lysis buffer in addition to a lysis buffer and control DNA (e.g., halophile or salmon testes DNA) were processed for every extraction in the same manner as the samples.
Human-associated Bacteroidales (HF183) were measured via the use of a droplet digital PCR (ddPCR) assay following previously published protocols [30,31]. Samples were measured in duplicate, using at least 20,000 droplets for an absolute quantification of HF183.
Field and equipment blanks were 100% nondetectable for HF183. Filtration controls were also 100% nondetectable.

2.5. Data Analysis

Data analysis consisted of three goals (Figure 2): (1) examining the representativeness of the sampling sites and storms captured; (2) summarizing HF183 concentration and mass loading results from the sampled site-events; and (3) calculating the average annual HF183 mass loading estimates from OWTSs watershed-wide and comparing watershed-wide HF183 average annual mass loading estimates from OWTSs to the average annual HF183 mass loading estimates from all human sources in the watershed combined.

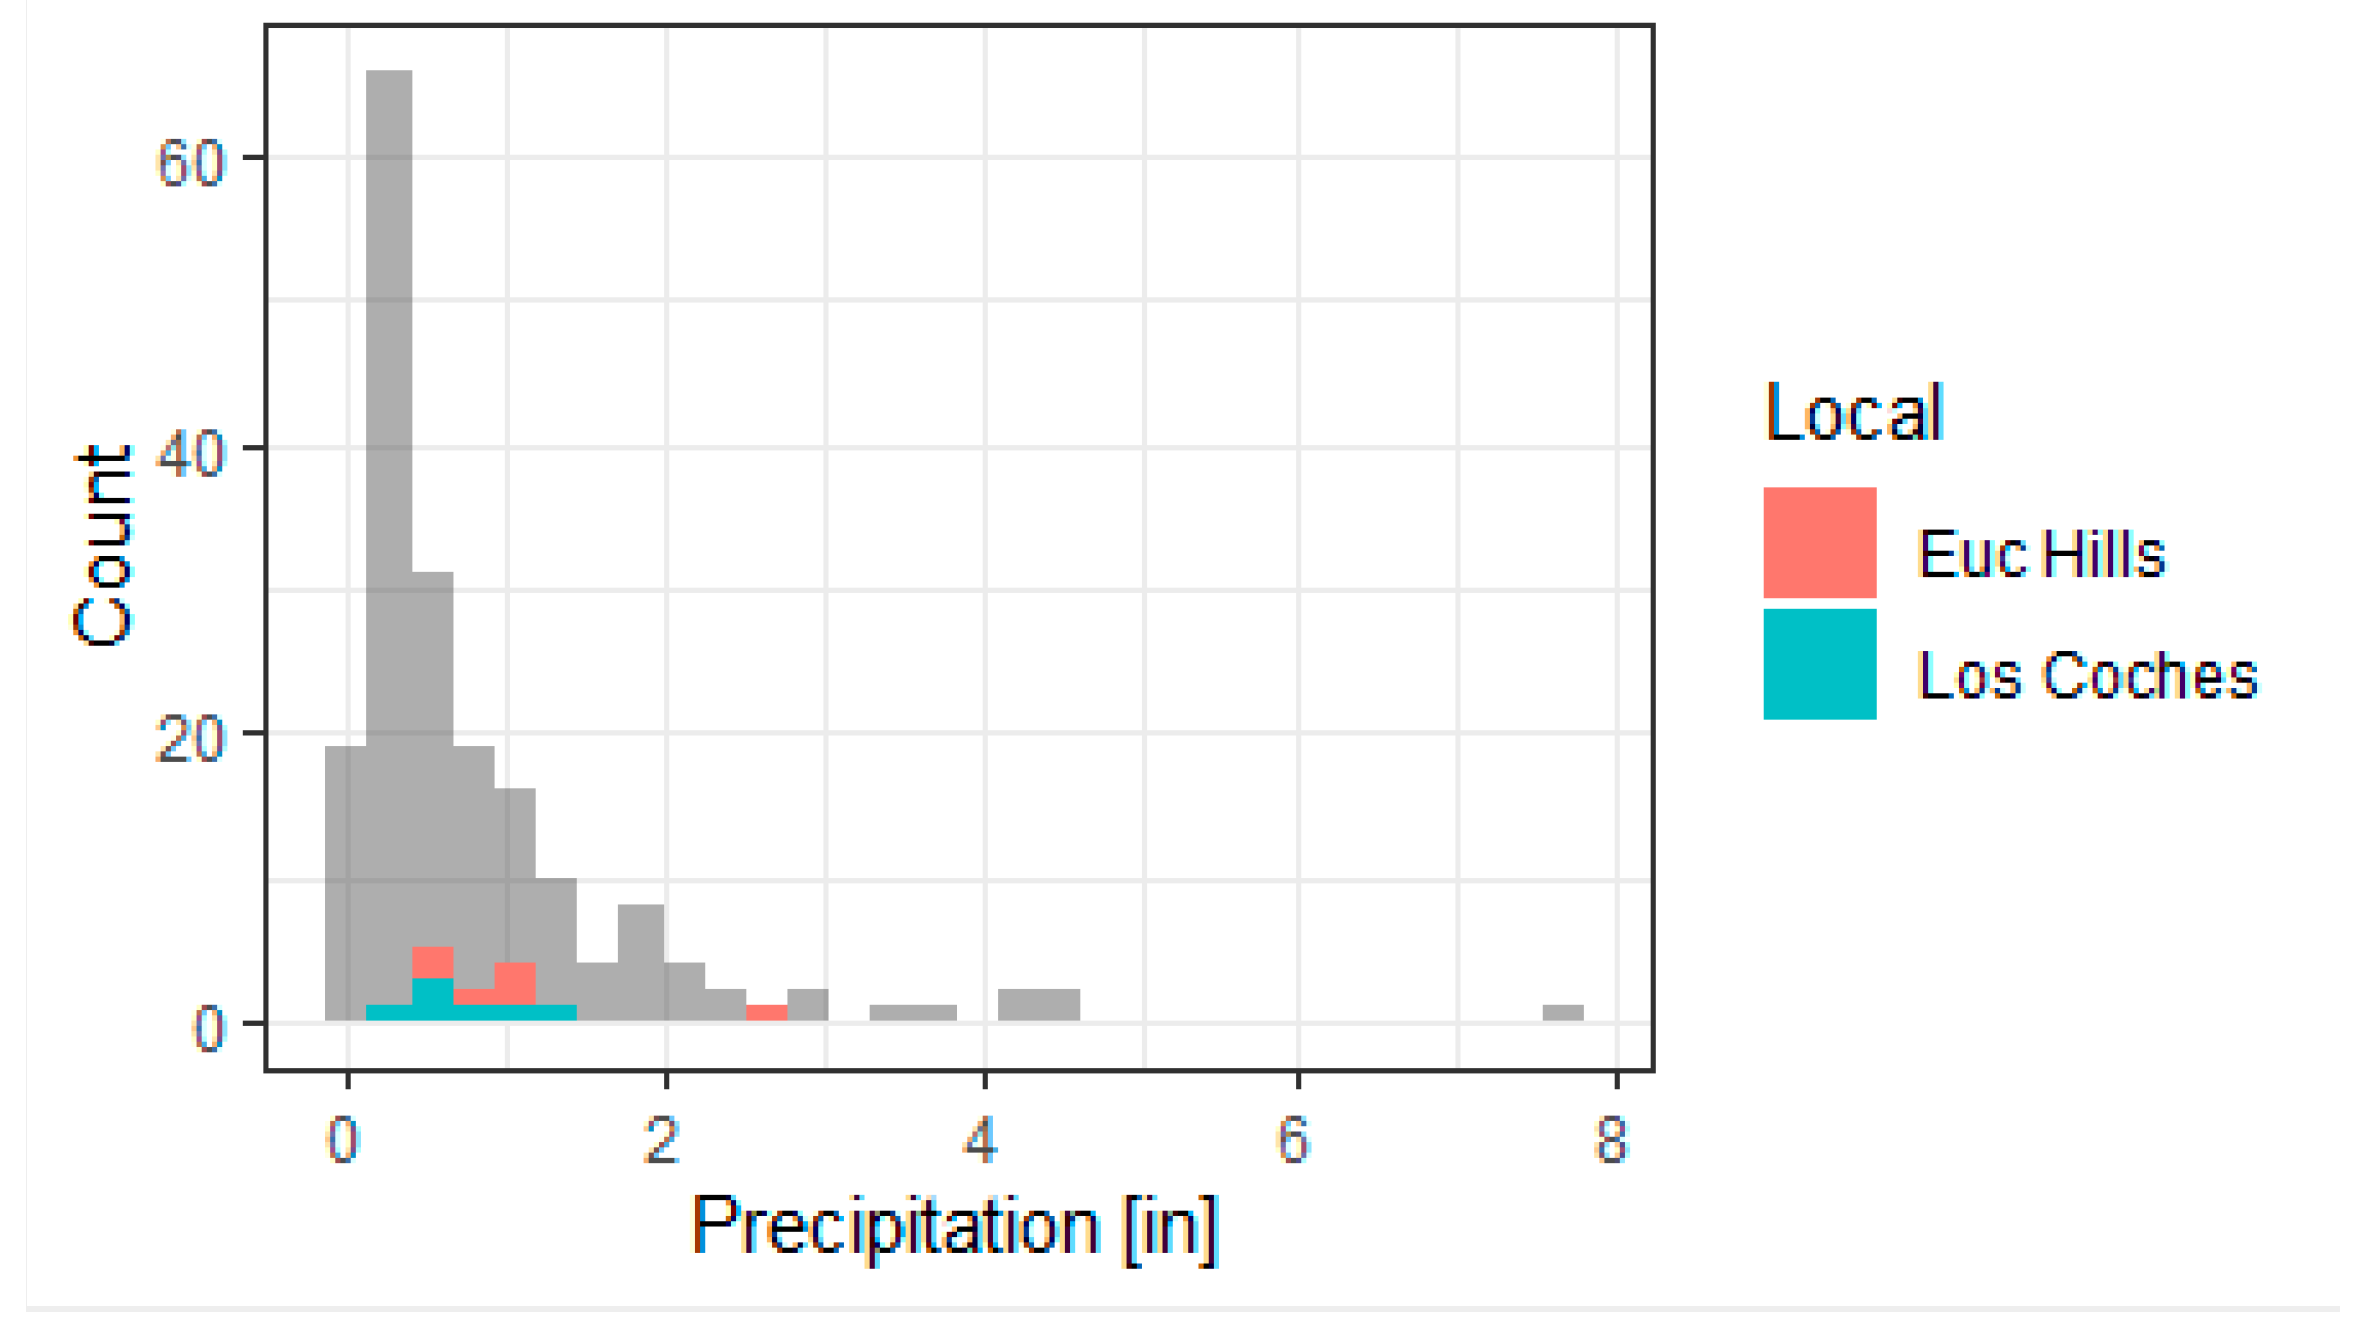
2.5.1. Representativeness of Sampling Sites

Ensuring representativeness of sampling sites involved comparing Unified Soil Classification System soil classifications and land use from the sampled catchments to the same parameters in all OWTS-only catchments from this watershed. Soil classifications ranged from coarse-grained to fine-grained unconsolidated sediments [32]. In addition, the storm characteristics during the study period were compared to the 13-year period of 2008–09 to 2020–21 water years (WY, defined as October 1 to September 30), including number of storms, rainfall quantity per storm, and total cumulative rainfall for the year.

2.5.2. Summary HF183 Results

Summary statistics of sampled events focused on distributions of storm volumes and HF183 event mean concentrations (EMCs) at the six sampled sites. HF183 EMCs were calculated by volume-weighting up to two composite samples per storm event. Mass estimates were calculated by utilizing median HF183 results normalized by the number of parcels in a catchment and inch rainfall (HF183 gene copies/parcel–inches of rainfall). The range of results and 95% confidence intervals were calculated using a bootstrap technique (R- Version 4.0.4) based on the geomean and standard deviation of site-events, then generating randomly selected datasets for 1000 iterations. The sensitivity analysis of the parcel- and rainfall-normalized loading estimate recalculated the median and confidence intervals five times, leaving out a single sampling site each time, then assessed whether the median of the left-out site fell within the confidence interval derived from the subset of data.

2.5.3. SDR Watershed-Wide HF183 Mass Loading Estimates

The estimated OWTS annual loading extrapolated the normalized HF183 loading rate by the total number of OWTS parcels in the SDR watershed and by the average annual rainfall. This total annual load estimate was compared to the average annual HF183 load estimate measured at Fashion Valley, the most downstream sampling location on the SDR collected by Steele et al. [31]. This site represents the cumulative loading of all human fecal sources in the watershed. If similar, then OWTSs would be assumed to be the primary human fecal source in the watershed.

3. Results

3.1. Representativeness

The six OWTS sampling catchments in the SDR ranged in size from 5.7 to 431.8 hectares (Table 1, Figure S1). The total amount of area in the SDR with OWTS parcels was estimated to be 5155 hectares or roughly 13.9% of the total watershed area. The number of parcels in each sampled catchment ranged from 9 to 339; the total number of OWTS parcels in the SDR watershed was estimated to be 6760.
The six OWTS sample catchments spanned the range of soil classification types in the OWTS-only portion of the SDR watershed (Table 2). For example, the OWTS portion of the SDR was largely soil classification D (36% of the area). The areal extent of soil classification D in the sampled OWTS catchments ranged from 0% to 100% of the catchment area. Soil classification D is a clay-type soil that typically does not promote infiltration. In contrast, the soil type with the least extent in the OWTS portion of the SDR was soil classification A (11%), which is more sandy and most likely to infiltrate. The OWTS-sampled catchments ranged from 0% to 60% for soil classification A.
The six OWTS-sample catchments spanned the range of land-use types in the OWTS-only portions of the SDR watershed (Table 3). For example, the OWTS portion of the SDR was largely residential zoned land use (74% of the area). The areal extent of residential land use in the sampled OWTS catchments ranged from 47% to 95% of the area. In contrast, the land use with the least extent in the OWTS portion of the SDR was “other” land uses, comprised largely of commercial and industrial zoned land uses (4%). The OWTS-sampled catchments ranged from 0% to 14% for “other” land use. The extent of open land use in the OWTS portion of the SDR, where no OWTSs are expected, was 24%. Once again, the sampled OWTS catchments bracketed this extent, ranging from 0% to 52% for open land use.
Annual rainfall between 2008/09 to 2020/21 ranged from 10.3–45.2 cm per WY (4.1–17.8 inches per WY) (Table 4). The average annual rainfall over these 13 years was 27.6 cm per WY (10.9 inches per WY). Sampling for this project occurred during water years 2018/19, 2019/2020, and 2020/21, when annual rainfalls were 40.1, 45.2, and 17.0 cm per WY (15.8, 17.8, and 6.7 inches per WY), respectively. Thus, the annual rainfall during sampling seasons was indicative of the range of annual rainfall observed in this portion of the watershed.
There were 29 total site-events sampled across the six sites (Table 5). The number of events per site ranged from three to six. Rainfall volume per site-event ranged from 0.6–7.4 cm (0.22–2.92 in). This coincided well (Figure 3) with the frequency distribution of storm events between WYs 2008/09 to 2020/21 and bracketed the average storm event rainfall depth during the 13-year period of 2.28 cm (0.91 in). For a review of daily rainfall for the entire three-year sampling period, including which storms were sampled, please see Supplementary Materials (Figure S2).

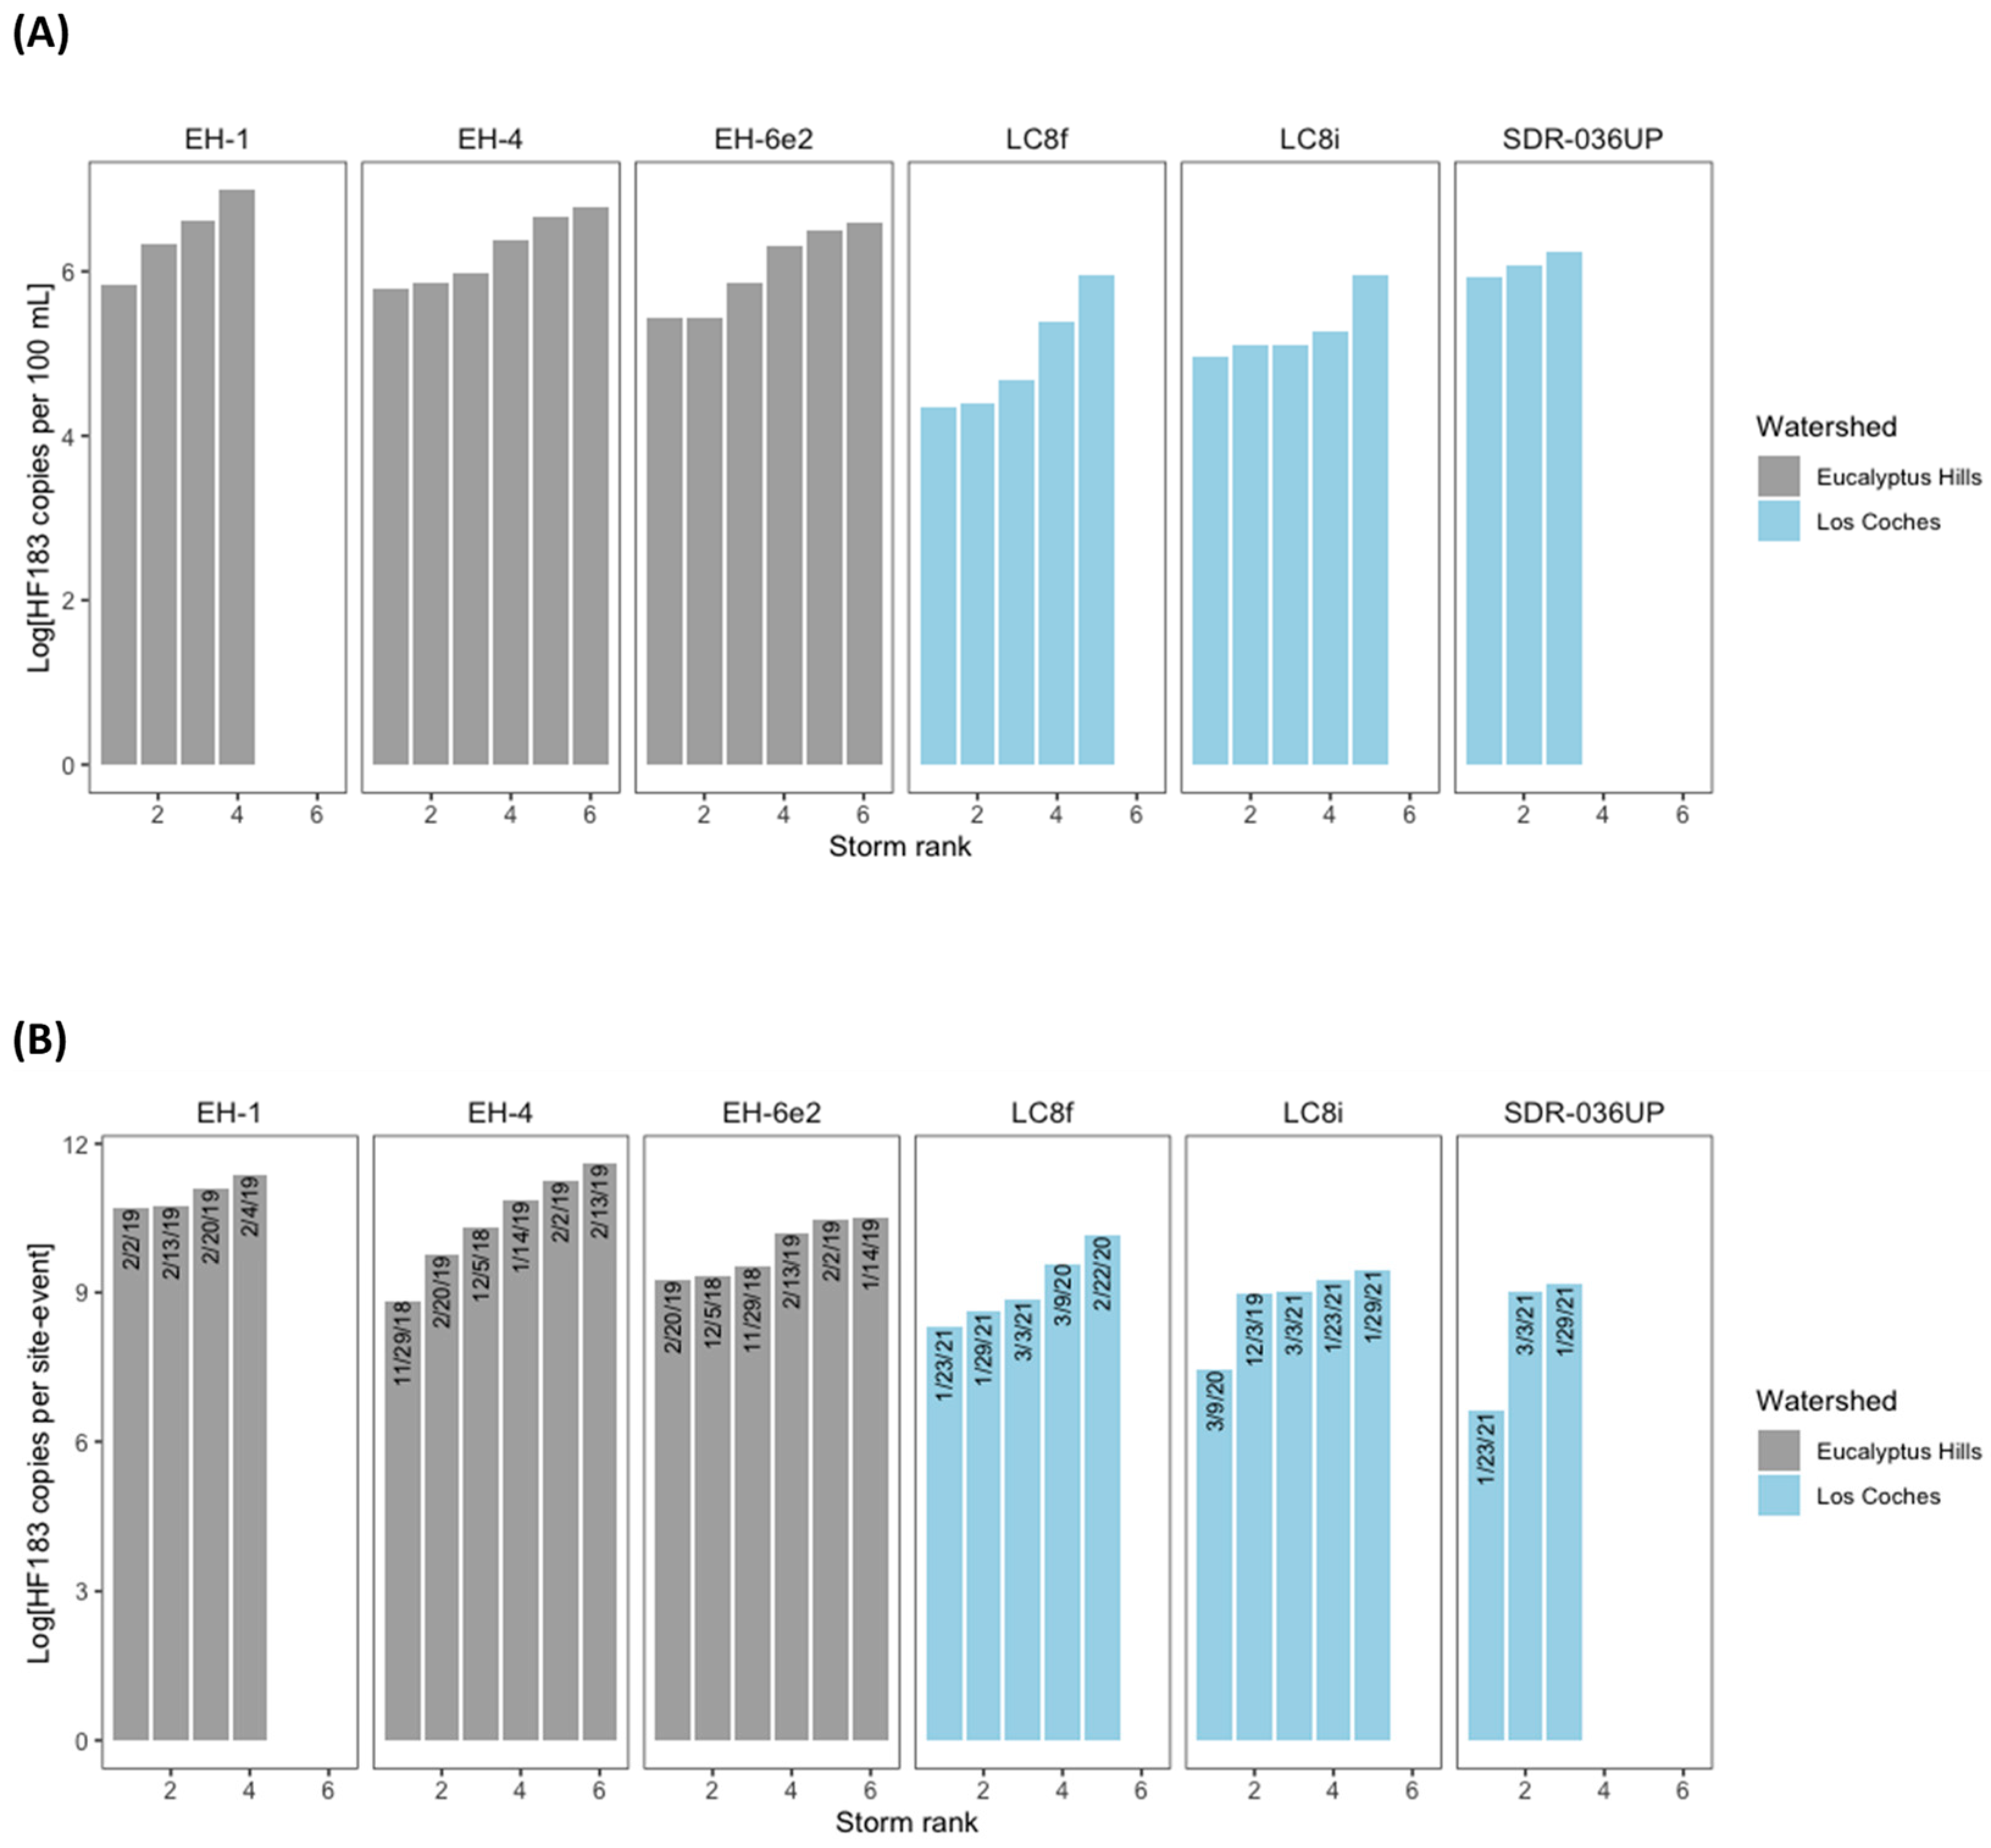
3.2. HF183 Concentrations and Loading

Event mean concentrations (EMCs) ranged three orders of magnitude, from 104 to 107 HF183 gene copies/100 mL, across all 29 site-events (Figure 4A). The median EMC across the six sites ranged from 104 to 106 HF183 gene copies/100 mL, with the greatest EMC at site EH-1 and the lowest EMC at site LC8f. Although all sites were not sampled every storm, many sites were sampled during the same event; however, no individual site generated the maximum EMC of all sites during multiple storm events.
HF183 mass loading ranged four orders of magnitude, from 107 to 1011 HF183 gene copies/site-event, across all 29 site-events (Figure 4B). The median mass loading across the six sites ranged from 109 to 1011 HF183 gene copies/site-event, with the greatest median mass loading at site EH-4 and the lowest median mass loading at site SDR-036.
After normalizing the loading by the number of parcels in each catchment and the rainfall per storm event, the HF183 load was 4.08 × 10⁸ gene copies/parcel-inch rainfall (95% CI: 1.1 × 10⁸ to 6.7 × 10⁸ gene copies/parcel-inch rainfall).

3.3. Validating Loading Estimates for Watershed Extrapolation

The mean of all six mass loading estimates from the leave-one-out bootstrapped analysis fell within the 95th percentiles of the bootstrapped values using all sites, indicating reasonable site mass loading representativeness (Figure 5). Of the six leave-one-out bootstrap simulations, four incorporated the mean of the missing site (Figure 5). One site (LC8i) had a mean below the 95th percentile of the remaining bootstrapped sites, and one (LC8f) had a mean above the 95th percentile of the remaining bootstrapped sites, consistent with the measured high and low values at these sites, suggesting that the cumulative site-loading estimates were not biased.

3.4. Extrapolating OWTS HF183 Loading to the Entire Watershed

Mass loading of HF183 from OWTSs was estimated to be 2.7 × 10¹³ gene copies per wet season (95% CI: 7.3 × 10¹² gene copies per wet season to 4.5 × 10¹³ gene copies per wet season) after extrapolating the normalized mass estimates to average seasonal rainfall and total number of parcels in the watershed. This compares to an estimated 1013 to 1016 gene copies per wet season at the Fashion Valley site located at the bottom of the watershed [24].

4. Discussion

This study calculated the average unit contribution of HF183 per storm event from OWTSs, providing a useful approach for other watershed managers tasked with quantifying HF183 inputs or prioritizing between human sources. Prioritization of sources is a critical knowledge gap for managers planning for watershed sustainability. In the SDR watershed, the estimated total HF183 loading from OWTSs during storm events was 4.08 × 10⁸ gene copies/parcel-inch rainfall (95% CI: 1.1 × 10⁸ to 6.7 × 10⁸ gene copies/parcel-inch rainfall). Based on site comparisons and bootstrapped estimates, this value does not appear biased for the SDR watershed. The authors attribute the lack of bias to the representativeness of the catchments sampled, which reflected the range of soil types, rainfall characteristics, and land use in the remaining unsampled portions of the SDR watershed where OWTSs are found.
One important unresolved aspect of representativeness is the frequency of under- or non-performing OWTSs in each of the sampled catchments and how that frequency relates to the unsampled portions of the watershed. Currently, no data exist to determine the frequency of under- or non-performing OWTSs in the SDR, a challenge faced by many other watersheds [24,33]. In San Diego, OWTSs have requirements for permitted installation and repair, with specific requirements for setbacks to flowing streams or ponds, distance to groundwater, and wastewater application rates based on parcel-specific percolation rates and wastewater volume, all of which are consistent with state regulations [26]. Approximately 8% of the OWTSs submitted permitted repairs or modifications watershed-wide between fiscal years 2013–14 and 2022–23.
While the concept of unit loading contributions of HF183 during wet weather in arid, urban environments is relatively new, the impact from under- or non-performing OWTSs has been well-documented in several other watershed studies. For example, researchers have identified OWTSs as sources of fecal indicator bacteria, including Enterococcus, E. coli, and/or total coliforms, to bathing waters, shellfishing areas, or drinking water wells [34,35,36,37,38,39,40]. Other studies have utilized HF183 as a source marker to pinpoint under- or non-performing OWTSs as the primary source of fecal pollution in bathing waters [41,42] or linked them to disease outbreaks in drinking water [43,44]. In some cases, OWTSs have been associated with effective treatment for bacterial targets [45], while other studies have measured bacterial contamination in shallow groundwater downgradient of OWTSs leach fields [39,46,47].
The study design for this project utilized multiple storms sampled across multiple small catchments with OWTSs only (no sewer, no open defecation from people experiencing homelessness) to generate representative unit loading contributions of HF183 from OWTSs. While not all sites were sampled during every storm—a challenging scenario for sampling in arid climates—the cumulative data across all catchments and storms enabled unit load contributions to be extrapolated to unsampled OWTS portions of the watershed and unsampled storm events. This study design could be adapted for other regions where soil type, rainfall characteristics, land use, and building specifications differ. However, based upon this study design, contributions from individual sites with an extreme OWTS failure or other stochastic, non-representative OWTS contributions could be missed, which would bias OWTS unit loading contributions towards being low. Alternatively, selecting catchments with excessive failure(s) may bias the OWTS unit loading contributions towards being high. In the SDR watershed, it was not possible to assess this source of bias, since maintenance records for individual OWTSs were not available.
Ultimately, the goal of this study was to ascertain if OWTSs could be a significant source of HF183 to the SDR watershed on an annual basis. Our estimate of 1013 HF183 gene copies from OWTSs per wet season was not an insignificant portion of the total HF183 loading from the entire watershed. Independent sampling conducted at the bottom of the watershed estimated an average of 1014 HF183 gene copies per wet season [31]. Other sources of HF183 are known to exist in the SDR watershed during wet weather, including sanitary sewers and people experiencing homelessness, which can contribute to the overall HF183 load [48,49].
Regardless of the fecal pollution source, epidemiology studies have demonstrated that surfers entering the ocean in San Diego County, CA during wet weather had an increased risk of highly credible gastrointestinal illness relative to surfers entering the ocean when it was not raining [50]. In addition, researchers have measured human pathogens in wet weather discharges from this watershed [31], reiterating the importance of robust identification and prioritization of human fecal pollution sources.
Our study did not focus on dry weather, but data from other research indicate that dry weather is much less of a problem compared to wet weather. HF183 measurements in receiving waters of the SDR infrequently detected HF183 during dry weather at dozens of sites across multiple seasons, and the few samples with detectable levels were not attributable to OWTSs [51]. Moreover, San Diego County beaches consistently meet water quality standards for fecal indicator bacteria during dry weather.

5. Conclusions

Arid, urban watersheds are particularly challenging for tracking human fecal sources of contamination, especially in wet weather, when multiple sources of human fecal contamination can dynamically mix and flow downstream to the beach. This study utilized a unique study design that calculated the contribution of HF183 per parcel and inch rainfall from OWTSs, providing a useful approach for other watershed managers tasked with quantifying HF183 inputs or prioritizing between human sources to ensure sustainable recreational bathing waters. For the watershed from southern California, USA in the current study, the estimated HF183 loading from OWTSs during storm events was 4.08 × 10⁸ gene copies/parcel-inch rainfall (95% CI: 1.1 × 10⁸ to 6.7 × 10⁸ gene copies/parcel-inch rainfall). Key to using this study design and applying this novel approach was the sampled catchment representativeness. To ensure representativeness, we ensured that the rainfall characteristics, soil types, and land uses of the sampled catchments were comparable to the remaining portions of the unsampled watershed.

Supplementary Materials

The following supporting information can be downloaded at: https://www.mdpi.com/article/10.3390/su16219503/s1. Figure S1. Maps of each sampling catchment (Panels A–F) including photos of the sampling site. Figure S2. Daily rainfall at the Los Coches (A) and Eucalyptus Hills (B) catchments, including which sites were sampled during each storm event.

Author Contributions

Conceptualization, K.S., A.Z.-F., J.G. and J.S.; methodology, K.S., J.G., J.S., A.Z.-F., D.E.M. and S.W.; formal analysis, J.G., J.S., A.Z.-F. and D.E.M.; data curation, analysis, and visualization, D.N., A.Z.-F. and S.W.; writing—original draft preparation, K.S.; writing—review and editing, J.G., J.S., A.Z.-F., D.E.M. and S.W.; supervision, K.S.; project administration, K.S.; funding acquisition, K.S. All authors have read and agreed to the published version of the manuscript.

Funding

This research was funded by the County of San Diego Contract 563356.

Institutional Review Board Statement

Not applicable.

Informed Consent Statement

Not applicable.

Data Availability Statement

The data present in this study are available on request from the corresponding author.

Acknowledgments

The authors are indebted to the regulated, regulatory, and non-governmental agency members of the San Diego River Investigative Order Steering Committee. Valuable insights and assistance were provided by Linda Turkatte and Colleen Hines from the County of San Diego. The authors greatly appreciate the imparted knowledge and review from the Project Technical Review Committee members.

Conflicts of Interest

Authors Kenneth Schiff, Amity Zimmer-Faust, Duy Nguyen, John Griffith and Joshua Steele were employed by the public agency Southern California Coastal Water Research Project. Author Amity Zimmer-Faust was employed by the company The Nature Conservancy. Authors Darcy Ebentier McCargar and Sierra Wallace were employed by the company WSP. The authors declare no conflict of interest. The funding sponsors had no decision making role in the design of the study; in the collection, analyses, or interpretation of data; in the writing of the manuscript, and in the decision to publish the results.

References

  1. Schiff, K.C.; Morton, J.; Weisberg, S.B. Retrospective evaluation of shoreline water quality along Santa Monica Bay beaches. Mar. Environ. Res. 2003, 56, 245–253. [Google Scholar] [CrossRef] [PubMed]
  2. Dwight, R.H.; Brinks, M.V.; SharavanaKumar, G.; Semenza, J.C. Beach Attendance and Bathing Rates for Southern California Beaches. Ocean Coast. Manag. 2007, 50, 847–858. [Google Scholar] [CrossRef]
  3. SWRCB. 2020–2022 Integrated Report for Clean Water Act Sections 303(d) and 305(b); Final Staff Report; State Water Resources Control Board: Sacramento, CA, USA, 2022; 99p. Available online: https://www.waterboards.ca.gov/water_issues/programs/water_quality_assessment/2020_2022_integrated_report.html (accessed on 28 June 2024).
  4. San Diego Region Bacteria TMDL Cost Benefit Analysis Steering Committee. Cost Benefit Analysis Bacteria Total Maximum Daily Loads. 2017. Available online: https://www.google.com/url?sa=t&rct=j&q=&esrc=s&source=web&cd=&ved=2ahUKEwiRnKjG7Mb-AhUmE1kFHabmAd8QFnoECA4QAQ&url=https%3A%2F%2Fwww.waterboards.ca.gov%2Fsandiego%2Fwater_issues%2Fprograms%2Fbasin_plan%2Fdocs%2Fissue3%2FFinal_CBA.pdf&usg=AOvVaw3dBfW53P_EjA-3dZLSJNtw (accessed on 28 June 2024).
  5. Noble, R.T.; Weisberg, S.B.; Leecaster, M.K.; McGee, C.D.; Dorsey, J.H.; Vainik, P.; Orozco-Borbon, V. Storm effects on regional beach water quality along the southern California shoreline. J. Water Health 2003, 1, 23–31. [Google Scholar] [CrossRef] [PubMed]
  6. Parker, J.K.; McIntyre, D.; Noble, R.T. Characterizing fecal contamination in stormwater runoff in coastal North Carolina, USA. Water Res. 2010, 44, 4186–4194. [Google Scholar] [CrossRef]
  7. Sauer, E.P.; VandeWalle, J.L.; Bootsma, M.J.; McLellan, S.L. Detection of the human specific Bacteroides genetic marker provides evidence of widespread sewage contamination of stormwater in the urban environment. Water Res. 2011, 45, 4081–4091. [Google Scholar] [CrossRef]
  8. Selvakumar, A.; Borst, M. Variation of microorganism concentrations in urban stormwater runoff with land use and seasons. J. Water Health 2006, 4, 109–124. [Google Scholar] [CrossRef]
  9. Chow, M.F.; Yusop, Z.; Toriman, M.E. Level and transport pattern of faecal coliform bacteria from tropical urban catchments. Water Sci. Technol. 2013, 67, 1822–1831. [Google Scholar] [CrossRef]
  10. Pitt, R.; Maestre, A.; Clary, J. The National Stormwater Quality Database (NSQD), Version 4.02; Department of Civil and Environmental Engineering, University of Alabama: Tuscaloosa, AL, USA, 2018; Available online: https://bmpdatabase.org/national-stormwater-quality-database (accessed on 28 June 2024).
  11. Tiefenthaler, L.L.; Stein, E.D.; Schiff, K.C. Levels and patterns of fecal indicator bacteria in stormwater runoff from homogenous land use sites and urban watersheds. J. Water Health 2011, 9, 279–290. [Google Scholar] [CrossRef] [PubMed]
  12. Griffith, J.F.; Schiff, K.C.; Lyon, G.S.; Fuhrman, J.A. Microbiological water quality at nonhuman influenced reference beaches in southern California during wet weather. Mar. Pollut. Bull. 2010, 60, 500–508. [Google Scholar] [CrossRef]
  13. Bernhard, A.E.; Field, K.G. A PCR assay to discriminate human and ruminant feces on the basis of host differences in Bacteroides-Prevotella genes encoding 16S rRNA. Appl. Environ. Microbiol. 2000, 66, 4571–4574. [Google Scholar] [CrossRef]
  14. Haugland, R.A.; Varma, M.; Sivaganesan, M.; Kelty, C.; Peed, L.; Shanks, O.C. Evaluation of genetic markers from the 16S rRNA gene V2 region for use in quantitative detection of selected Bacteroidales species and human fecal waste by qPCR. Syst. Appl. Microbiol. 2010, 33, 348–357. [Google Scholar] [CrossRef] [PubMed]
  15. Layton, B.A.; Cao, Y.; Ebentier, D.L.; Hanley, K.; Balleste, E.; Brandao, J.; Byappanahalli, M.; Converse, R.; Farnleitner, A.; Gentry-Shields, J.; et al. Griffith. Performance of human fecal anaerobe-associated PCR-based assays in a multi-laboratory method evaluation study. Water Res. 2013, 47, 6897–6908. [Google Scholar] [CrossRef] [PubMed]
  16. Boehm, A.B.; Van De Werfhorst, L.C.; Griffith, J.F.; Holden, P.A.; Jay, J.A.; Shanks, O.C.; Wang, D.; Weisberg, S.B. Performance of forty-one microbial source tracking methods: A twenty-seven lab evaluation study. Water Res. 2013, 47, 6812–6828. [Google Scholar] [CrossRef] [PubMed]
  17. Nguyen, K.H.; Senay, C.; Young, S.; Nayak, B.; Lobos, A.; Conrad, J.; Harwood, V.J. Determination of wild animal sources of fecal indicator bacteria by microbial source tracking (MST) influences regulatory decisions. Water Res. 2018, 144, 424–434. [Google Scholar] [CrossRef] [PubMed]
  18. Yost, C.K.; Diarra, M.S.; Topp, E. Chapter 4, Animals and humans as sources of fecal indicator bacteria. In The Fecal Bacteria; Sadowsky, M.J., Whitman, R.L., Eds.; Wiley: Hoboken, NJ, USA, 2010; pp. 67–91. [Google Scholar] [CrossRef]
  19. Boehm, A.B.; Soller, J.A. Risks Associated with Recreational Waters: Pathogens and Fecal Indicators. In Encyclopedia of Sustainability Science and Technology; Laws, E.A., Ed.; Springer: Berlin/Heidelberg, Germany, 2011. [Google Scholar]
  20. Harwood, V.J.; Staley, C.; Badgley, B.D.; Borges, K.; Korajkic, A. Microbial source tracking markers for detection of fecal contamination in environmental waters: Relationships between pathogens and human health outcomes. FEMS Microbiol. Rev. 2014, 38, 1–40. [Google Scholar] [CrossRef]
  21. Soller, J.A.; Schoen, M.E.; Varghese, A.; Ichida, A.M.; Boehm, A.B.; Eftim, S.; Ashbolt, N.J.; Ravenscroft, J.E. Human health risk implications of multiple sources of faecal indicator bacteria in a recreational waterbody. Water Res. 2014, 66, 254–264. [Google Scholar] [CrossRef]
  22. Soller, J.; Bartrand, T.; Ravenscroft, J.; Molina, M.; Whelan, G.; Schoen, M.; Ashbolt, N. Estimated human health risks from recreational exposures to stormwater runoff containing animal faecal material. Environ. Model. Softw. 2015, 72, 21–32. [Google Scholar] [CrossRef]
  23. Bounds, T.R. Design and performance of septic tanks. In Site Characterization and Design of On-Site Septic Systems, ASTM STP 1324; Bedinger, M.S., Fleming, J.S., Johnson, I., Eds.; American Society of Testing and Materials: Philadelphia, PA, USA, 1997; pp. 217–244. [Google Scholar]
  24. Butler, D.; Payne, J. Septic tanks: Problems and practice. Build. Environ. 1995, 30, 419–425. [Google Scholar] [CrossRef]
  25. Alhajjar, B.J.; Chesters, G.; Harkin, J.M. Indicators of chemical pollution from septic systems. Groundwater 1990, 28, 559–568. [Google Scholar] [CrossRef]
  26. County of San Diego. Onsite Wastewater Systems Permitting Process and Design Criteria; County of San Diego, Department of Environmental Health, Land and Water Quality Division: San Diego, CA, USA, 2010; 15p. Available online: https://www.google.com/url?sa=t&rct=j&q=&esrc=s&source=web&cd=&ved=2ahUKEwiZk7LyhKyEAxU4DkQIHT1-AHIQFnoECBEQAQ&url=https%3A%2F%2Fwww.sandiegocounty.gov%2Fcontent%2Fdam%2Fsdc%2Fdeh%2Flwqd%2FSeptic_System_Design_Criteria_3-22-10.pdf&usg=AOvVaw3DksVFEfaBvUvGrJ8AIT17&opi=89978449 (accessed on 28 June 2024).
  27. SD RWQCB. Investigative Order R9-2019-0014 to Identify and Quantify the Sources and Transport Pathways of Human Fecal Material to the Lower San Diego River Watershed; San Diego Regional Water Quality Control Board: San Diego, CA, USA, 2019; 36p. Available online: https://www.waterboards.ca.gov/sandiego/board_decisions/adopted_orders/2019/R9–2019-0014.pdf (accessed on 28 June 2024).
  28. Weston Solutions. Identification of Parcels with Onsite Wastewater Treatment Systems; Contract Number 551492 TO82; County of San Diego, Watershed Protection Division: San Diego, CA, USA, 2020; 14p.
  29. Leecaster, M.K.; Schiff, K.C.; Tiefenthaler, L.L. Assessment of efficient sampling designs for urban stormwater monitoring. Water Res. 2002, 36, 1556–1564. [Google Scholar] [CrossRef]
  30. Cao, Y.; Raith, M.R.; Griffith, J.F. Droplet digital PCR for simultaneous quantification of general and human-associated fecal indicators for water quality assessment. Water Res. 2015, 70, 337–349. [Google Scholar] [CrossRef] [PubMed]
  31. Steele, J.A.; Blackwood, A.D.; Griffith, J.F.; Noble, R.T.; Schiff, K.C. Quantification of pathogens and markers of fecal contamination during storm events along popular surfing beaches in San Diego, California. Water Res. 2018, 136, 137–149. [Google Scholar] [CrossRef]
  32. ASTM-D2487; Standard Practice for Classification of Soils for Engineering Purposes (Unified Soil Classification System), Standard D2487. Association of Standard Testing and Materials International: West Conshohocken, PA, USA, 2000. [CrossRef]
  33. Withers, P.; Jordan, P.; May, L.; Jarvie, H.P.; Deal, N.E. Do septic tank systems pose a hidden threat to water quality? Front. Ecol. Environ. 2013, 12, 123–130. [Google Scholar] [CrossRef]
  34. Humphrey, C.; Finley, A.; O’Driscoll, M.; Manda, A. Groundwater and stream E. coli concentrations in coastal plain watersheds served by onsite wastewater and a municipal sewer treatment system. Water Sci. Technol. 2015, 72, 1851–1860. [Google Scholar] [CrossRef] [PubMed]
  35. Iverson, G.; Humphrey, C.P.; Postma, M.H.; O’Driscoll, M.A.; Manda, A.K.; Finley, A. Influence of Sewered Versus Septic Systems on Watershed Exports of E. coli. Water Air Soil. Pollut. 2017, 228, 237. [Google Scholar] [CrossRef]
  36. Jordan, M.A.; Ojeda, A.S.; Larson, E.A.; Rogers, S.R. Investigating the Relationship between Surface Water Pollution and Onsite Wastewater Treatment Systems. Environ. Sci. Technol. 2023, 57, 17042–17050. [Google Scholar] [CrossRef] [PubMed]
  37. Conn, K.E.; Habteselassie, M.Y.; Blackwood, D.; Noble, R.T. Microbial water quality before and after the repair of a failing onsite wastewater treatment system adjacent to coastal waters. J. Appl. Microbiol. 2012, 112, 214–224. [Google Scholar] [CrossRef]
  38. Lusk, M.G.; Toor, G.S.; Yang, Y.Y.; Mechtensimer, S.; De, M.; Obreza, T.A. A review of the fate and transport of nitrogen, phosphorus, pathogens, and trace organic chemicals in septic systems. Crit. Rev. Environ. Sci. Technol. 2017, 47, 455–541. [Google Scholar] [CrossRef]
  39. Goehring, D.R.; Carr, F.R. Septic system problems on an urban fringe. J. Water Resour. Plan. Manag. Div. 1980, 106, 89–102. [Google Scholar] [CrossRef]
  40. Sowah, R.A.; Habteselassie, M.Y.; Radcliffe, D.E.; Bauske, E.; Risse, M. Isolating the impact of septic systems on fecal pollution in streams of suburban watersheds in Georgia, United States. Water Res. 2017, 108, 330–338. [Google Scholar] [CrossRef]
  41. Hagedorn, C.; McCoy, E.L.; Rahe, T.M. The potential for ground water contamination from septic effluents. J. Environ. Qual. 1981, 10, 1–8. [Google Scholar] [CrossRef]
  42. Ahmed, W.; Powell, D.; Goonetilleke, A.; Gardner, T. Detection and source identification of faecal pollution in non-sewered catchment by means of host-specific molecular markers. Water Sci. Technol. 2008, 58, 579–586. [Google Scholar] [CrossRef] [PubMed]
  43. Mattioli, M.C.; Benedict, K.M.; Murphy, J.; Kahler, A.; Kline, K.E.; Longenberger, A.; Mitchell, P.K.; Watkins, S.; Berger, P.; Shanks, O.C.; et al. Identifying septic pollution exposure routes during a waterborne norovirus outbreak—A new application for human-associated microbial source tracking qPCR. J. Microbiol. Methods 2021, 180, 106091. [Google Scholar] [CrossRef] [PubMed]
  44. Murphy, H.M.; McGinnis, S.; Blunt, R.; Stokdyk, J.; Wu, J.; Cagle, A.; Denno, D.M.; Spencer, S.; Firnstahl, A.; Borchardt, M.A. Septic systems and rainfall influence human fecal marker and indicator organism occurrence in private wells in southeastern Pennsylvania. Environ. Sci. Technol. 2020, 54, 3159–3168. [Google Scholar] [CrossRef]
  45. Hayward, J.L.; Huang, Y.; Yost, C.K.; Hansen, L.T.; Lake, C.; Tong, A.; Jamieson, R.C. Lateral flow sand filters are effective for removal of antibiotic resistance genes from domestic wastewater. Water Res. 2019, 162, 482–491. [Google Scholar] [CrossRef] [PubMed]
  46. Schneeberger, C.L.; O’Driscoll, M.; Humphrey, C.; Henry, K.; Deal, N.; Seiber, K.; Hill, V.R.; Zarate-Bermudez, M. Fate and transport of enteric microbes from septic systems in a coastal watershed. J. Environ. Health 2015, 77, 22–31. [Google Scholar]
  47. Billian, H.; Krometis, L.A.; Thompson, T.; Hagedorn, C. Movement of traditional fecal indicator bacteria and source-tracking targets through septic drainfields. Sci. Total Environ. 2018, 610, 1467–1475. [Google Scholar] [CrossRef]
  48. Mladenov, N.; Verbyla, M.E.; Kinoshita, A.M.; Gersberg, R.; Calderon, J.; Pinongcos, F.; Garcia, M.; Gil, M. Final Report: San Diego River Contamination Study: Increasing Preparedness in the San Diego River Watershed for Potential Contamination; San Diego State University: San Diego, CA, USA, 2020; 88p, Available online: https://mladenov.weebly.com/river-studies.html (accessed on 28 June 2024).
  49. Hinds, J.B.; Garg, T.; Hutmacher, S.; Nguyen, A.; Zheng, Z.; Griffith, J.F.; Steele, J.A.; Fernandez, A.G.; Schiff, K.C. Assessing the defecation practices of unsheltered individuals and their contributions to microbial water quality in an arid, urban watershed. Sci. Total Environ. 2024, 920, 170708. [Google Scholar] [CrossRef]
  50. Arnold, B.F.; Schiff, K.C.; Ercumen, A.; Benjamin-Chung, J.; Steele, J.A.; Griffith, J.F.; Steinberg, S.J.; Smith, P.; McGee, C.D.; Wilson, R.; et al. Acute Illness Among Surfers After Exposure to Seawater in Dry-and Wet-Weather Conditions. Am. J. Epidemiol. 2017, 186, 866–875. [Google Scholar] [CrossRef]
  51. Schiff, K.C.; Griffith, J.F.; Steele, J.A.; Zimmer-Faust, A.G. Dry and Wet Weather Survey for Human Fecal Sources in the San Diego River Watershed. Water 2023, 15, 2239. [Google Scholar] [CrossRef]
Figure 1. Map of the lower San Diego River watershed showing areas where onsite wastewater treatment systems (OWTSs or septic systems) are either known or assumed to occur. Inset: star indicates location of San Diego River watershed. Catchment sampling sites are indicated by yellow symbols. Detailed maps of sampling sites can be found in Supplementary Materials, Figure S1. OWTS location data from [28].
Sustainability 16 09503 g001
Figure 2. Study design for estimating annual HF183 mass loading in a watershed with multiple human sources and assessing the onsite wastewater treatment systems’ (OWTSs) relative contribution as a basis for prioritization for water quality sustainability.
Sustainability 16 09503 g002
Figure 3. Frequency distribution of rainfall depth (inches) per storm event from 2008–09 to 2020–21 water years in the lower San Diego River watershed (data from County of San Diego, Flinn Springs County Park, Gauge #27025). Frequency distributions of sampled storm events by tributary are indicated in color. Frequency distributions of unsampled storm events are shown in gray.
Sustainability 16 09503 g003
Figure 4. Rank order of (A) event mean concentrations and (B) HF183 mass for HF183 by storm within each site. Date annotated for each storm.
Sustainability 16 09503 g004
Figure 5. Bootstrap analysis of unit contribution estimates (HF183 mass/parcel -inch rainfall) for all sites and the leave-one-out analysis to assess potential bias among sites.
Sustainability 16 09503 g005
Table 1. The OWTS-sampled catchment metadata, including sampling site, location, size, and parcel counts. Catchment data are compared to size and parcel count in the entire lower San Diego River watershed with OWTSs.
TributaryCatchment Site IDLatLongSize (Hectares)Number of Parcels
Los CochesLC8f32.85682−116.8626618.219
LC8i32.85391−116.865975.79
SDR-036UP32.85245−116.8695053.839
Eucalyptus HillsEH-132.86905−116.94610431.8339
EH-432.88181−116.9454189.4161
EH6-e232.88076−116.939039.745
Total of Sampled Catchments--608.6612
Entire Watershed with OWTS--51556760
Table 2. Percent area with different hydrologic soil classification groups in the OWTS-sampled catchments and in the entire OWTS portion of the lower San Diego River watershed (data from USGS).
TributaryCatchment Site IDHydrologic Soil Group (% of Catchment)
% A% B% C% D
Los CochesLC8f2933380
LC8i602380
SDR-036UP26132833
Eucalyptus HillsEH-1362170
EH-4006535
EH-6e2001000
Entire SDR Watershed with OWTS11272736
Table 3. Proportion of land use in the OWTS-sampled catchments and in the entire OWTS portion of the lower San Diego River watershed.
TributaryCatchment Site IDLand Use (% of Catchment)
ResidentialOpen Space/
Undeveloped
Other
Los CochesLC8f9118
LC8i86014
SDR-036UP9505
Eucalyptus HillsEH-147521
EH-466259
EH-6e255450
Entire Watershed with OWTS 74244
Table 4. Total rainfall volume per year at the rain gauge nearest the sample sites (data from County of San Diego, Flinn Springs County Park, Gauge #27025).
Water YearAnnual Precipitation Volume (cm)Annual Precipitation Volume (inch)
2008–200926.8010.6
2009–201037.6414.8
2010–201144.1717.4
2011–201224.519.6
2012–201317.687.0
2013–201410.294.1
2014–201517.156.8
2015–201624.619.7
2016–201741.5316.4
2017–201811.764.6
2018–201940.11 *15.8 *
2019–202045.16 *17.8 *
2020–202117.04 *6.7 *
Average (SD)27.57 (12.66)10.9 (5.0)
* Year with sampling.
Table 5. Inventory of sampled storms by OWTS site during study.
TributaryCatchment
Site ID
Water Year SampledTotal Number of Events
2018–20192019–20202020–2021
Los CochesLC8f 235
LC8i 235
SDR-036UP 33
Eucalyptus HillsEH-14 4
EH-46 6
EH-6e26 6
Total 164929
Disclaimer/Publisher’s Note: The statements, opinions and data contained in all publications are solely those of the individual author(s) and contributor(s) and not of MDPI and/or the editor(s). MDPI and/or the editor(s) disclaim responsibility for any injury to people or property resulting from any ideas, methods, instructions or products referred to in the content.

