Article

Effects of Aquatic Plant Diversity and Cipangopaludinas chinensis on Nitrogen Removal and Its Stability in Constructed Wetlands

1
College of Life and Environmental Science, Wenzhou University, Wenzhou 325035, China
2
National & Local Joint Engineering Research Center for Ecological Treatment Technology of Urban Water Pollution, Wenzhou University, Wenzhou 325035, China
3
Institute for Eco-Environmental Research of Sanyang Wetland, Wenzhou University, Wenzhou 325035, China
*
Author to whom correspondence should be addressed.
Sustainability 2024, 16(21), 9492; https://doi.org/10.3390/su16219492
Submission received: 26 September 2024 / Revised: 18 October 2024 / Accepted: 28 October 2024 / Published: 31 October 2024
(This article belongs to the Section Sustainability, Biodiversity and Conservation)

Abstract

In constructed wetlands (CWs), aquatic plant diversity can enhance system nitrogen (N) removal. However, the impact of aquatic plant diversity with different life forms and benthic animals on the N (NO3-N, NH4+-N, TIN) removal and its stability has been neglected. This study established 42 simulated CWs, selecting three aquatic plant species with different life forms to establish plant species diversity, with benthic animals (Cipangopaludinas chinensis) added or not added at each diversity level. The results indicated that (1) the presence of the aquatic plant Pistia stratiotes increased the effluent nitrate nitrogen (NO3-N) concentration. (2) In systems with or without C. chinensis, the plant species richness increased the temporal stability of the effluent NO3-N concentration; the presence of the aquatic plant Vallisneria natans increased the temporal stability of the effluent total inorganic nitrogen (TIN) concentration in systems without C. chinensis and the temporal stability of the effluent NO3-N concentration in systems with C. chinensis. (3) Adding C. chinensis significantly reduced the temporal stability of the effluent TIN concentration in the monoculture of V. natans. The rational establishment of aquatic plant diversity with benthic animals can improve the effluent’s water quality while ensuring the water quality’s temporal stability.

1. Introduction

Along with human development and climate change, the sustainable management of water resources has encountered significant challenges [1]. According to the United Nations World Water Development Report in 2017, as the global average, more than 80% of sewage is discharged while untreated; in China, the ammonium nitrogen (NH4+-N) discharges amount to 984,000 tons, and the total nitrogen (TN) discharges amount to 3.223 million tons [2,3]. Constructed wetlands (CWs) are nature-enhanced wastewater treatment systems that remove nitrogen (N) through plant uptake, microbial nitrification and denitrification, and substrate adsorption [4]. Due to their high N removal efficiency, ease of maintenance, low operational costs, and minimal energy consumption, CWs have rapidly expanded worldwide in recent decades [4,5]. However, the stability of CWs in N removal still faces challenges. Efficiently and stably removing N pollutants in CWs remains a critical issue.
Aquatic plants are a vital component of the ecological structure of CWs, and aquatic plants with different life forms have different growth patterns and N absorption abilities [6,7]. For example, emergent macrophytes primarily rely on their root systems to absorb nutrients from the water and sediment, while submerged macrophytes absorb nutrients through all their nutritional parts [8,9]. The activity and relative abundance of the rhizospheric microbial community also depend on the type of plant species [10,11]. These differences among plant species may affect the N removal efficiency in CWs, and the rational configuration of diverse aquatic plant species with different life forms could enhance pollutant removal in CWs. Studies have shown that the removal efficiency of TN from wastewater by the emergent macrophyte Pontederia cordata and the submerged macrophyte Hydra verticillata is higher than that of the free-floating macrophyte Pistia stratotes [6]. Compositions of aquatic plants with different life forms can promote N cycling within CWs, with compositions of emergent macrophytes and macroalgae showing the highest N removal efficiency [12]. However, the current research mainly focuses on the effect of the diversity of aquatic plants within single life forms on the removal of water pollutants in CWs, neglecting the potential benefits of combining plants of different life forms [13,14,15]. Therefore, the impact of the diversity of aquatic plants with different life forms on N removal in CWs needs further study.
Ecosystem stability refers to an ecosystem’s ability to maintain or recover its original state after a disturbance, with temporal stability being a key indicator [16]. Temporal stability reflects the fluctuations in ecosystem variables over time and space; the less variability, the higher the stability [16]. According to the insurance hypothesis, biodiversity can enhance ecosystem stability, meaning that asynchrony among different species can improve ecosystem stability. Therefore, understanding the factors that affect temporal stability is crucial in protecting and managing ecosystems. Spatial heterogeneity in communities may increase the temporal stability of local communities [17]; similarly, species evenness and spatial distribution can also affect the temporal stability of ecosystems [18]. Experimental studies in artificial grasslands have shown that species diversity can enhance the temporal stability of total ecosystem productivity and aboveground biomass [19,20]. In CW systems, research has demonstrated that high species richness or the presence of specific species strengthens the stability (resistance) of effluents’ water quality [21]. However, the impact of the diversity of aquatic plants with different life forms on the temporal stability of N removal in CWs remains unclear. In addition, the effect of benthic animals on ecosystem stability has been neglected.
Benthic animals, as another crucial component of CWs’ ecological structures, play a key role in maintaining ecosystem balance and water purification. They could directly remove N through feeding and also could indirectly affect N removal by altering the external environment [22]. Studies have shown that introducing the benthic animal Cipangopaludinas chinensis into systems planted with the aquatic plant Nymphaea L. enhanced the removal rate of NH4+-N by 17% [23]. In systems planted with the aquatic plant Typha orientalis, the addition of benthic animals such as Limnodrilus hoffmeisteri has been shown to increase the total nitrogen (TN) removal rate in CWs by 22%, while the introduction of C. chinensis could enhance the removal efficiency of NH4+-N [24]. The effect of introducing benthic animals such as Corbicula fluminea on N removal varies under different plant species diversity configurations; moreover, it can alter the relationship between the emergent macrophyte diversity and N removal in CWs [25]. Existing research has also found that introducing C. chinensis changed the relationship between the submerged macrophyte diversity and water quality [15]. However, these studies have mostly introduced benthic animals into systems with plants of a single life form system. Therefore, it is necessary to further explore the impact of aquatic plant species diversity with different life forms and benthic animals on the N removal and temporal stability in CWs.
This study constructed 42 CWs and supplied them with simulated wastewater. Three plant species with different life forms were selected, and the richness levels were set at 1, 2, and 3, creating seven plant compositions; C. chinensis was added or not added at each plant species diversity level. This study aimed to explore (1) the impact of C. chinensis on N removal and its temporal stability in CWs with different aquatic plant diversity configurations; (2) the effect of aquatic plant diversity on N removal and stability in CWs with or without C. chinensis; and (3) identify a reasonable combination of aquatic plants and C. chinensis to efficiently and stably remove N from water and ensure the water’s quality.

2. Materials and Methods

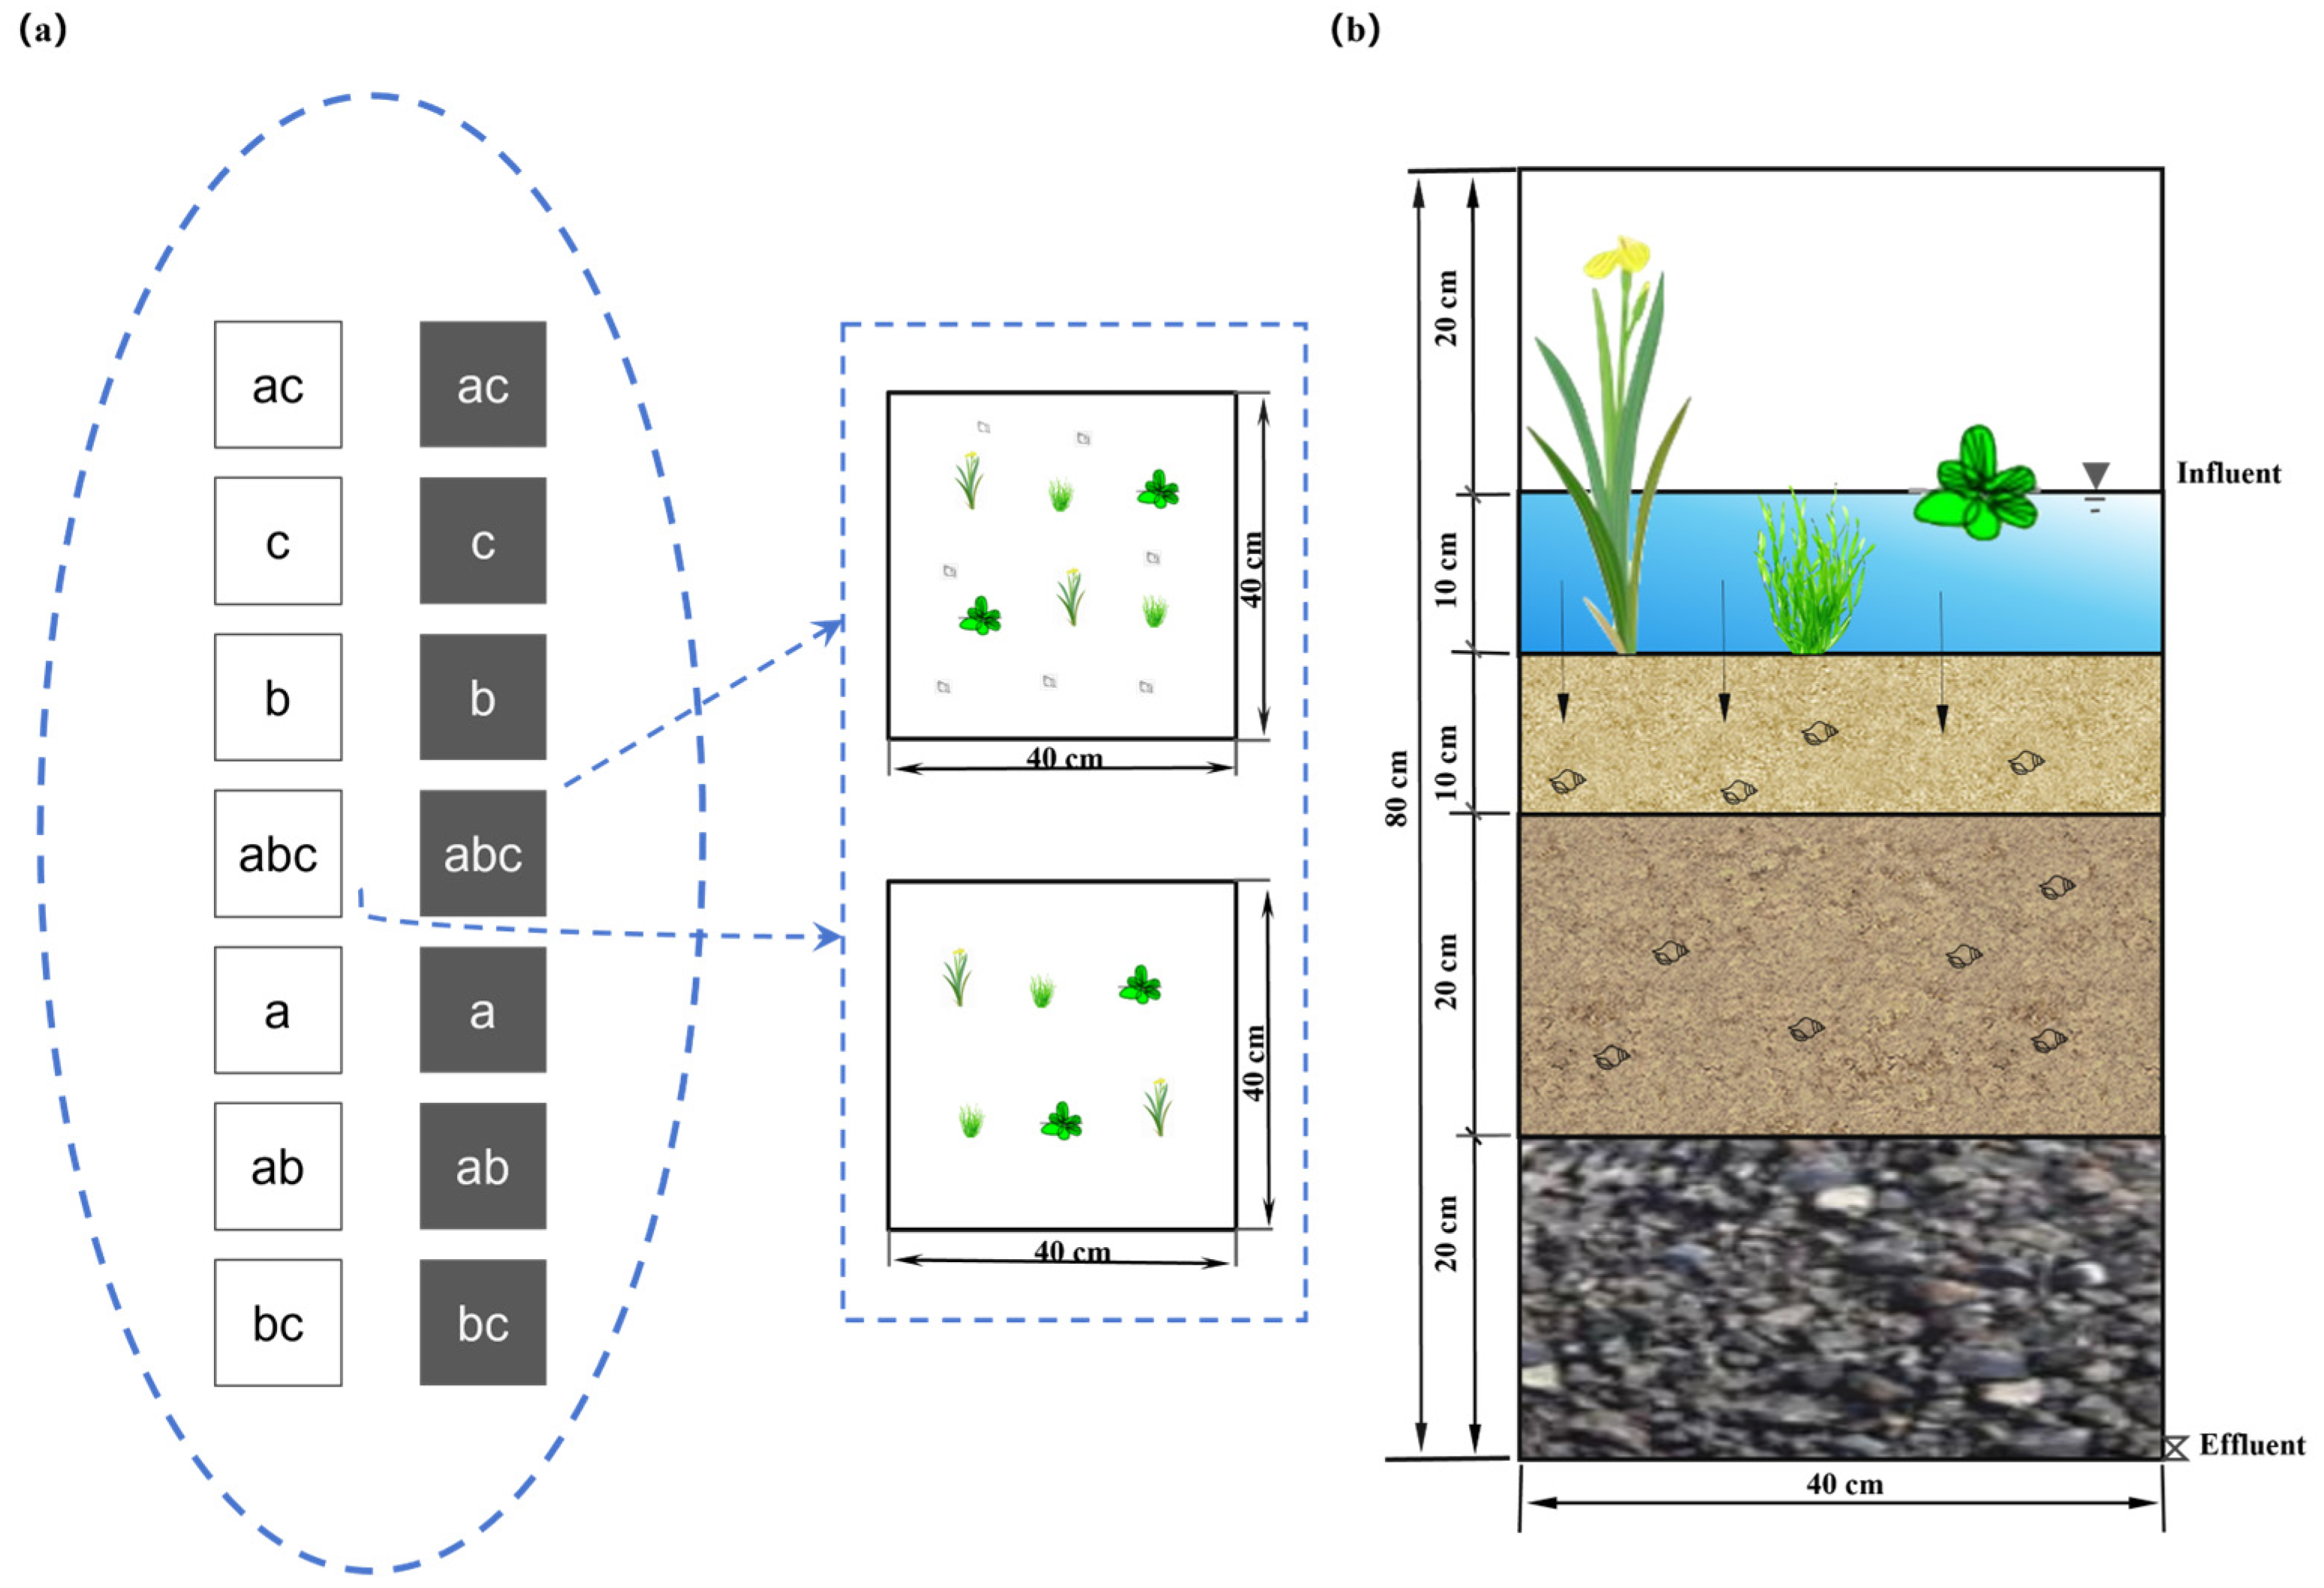
2.1. Experimental Design

The experiment was conducted at Wenzhou University (27.92 °N, 120.70 °E) in Wenzhou, Zhejiang Province, China. CW microcosms were constructed using polypropylene PP boards (length × width × height = 40 cm × 40 cm × 80 cm), with a total of 42 simulated CWs. Each wetland unit was filled in layers from bottom to top: a gravel layer (200 mm, diameter 6–12 mm), a coarse sand layer (200 mm, diameter 3–6 mm), and a fine sand layer (50 mm, diameter 0.5–1 mm) (Figure 1).
Based on the different life habits of plants and their N removal efficiency, three common wetland plants were selected in October 2021: the submerged macrophyte Vallisneria natans, the emergent macrophyte Acorus calamus, and the floating-leaved macrophyte Pistia stratiotes. The aquatic plant species diversity configuration included three levels of plant species richness (1, 2, and 3 species) with seven plant compositions: three monocultures, three two-species mixtures, and one three-species mixture. The planting density was six plants per pot, distributed evenly. Weeds were regularly removed during the experimental period to avoid interference with the experiment. C. chinensis was added or not added at each diversity level with 10 individuals per microcosm.
The simulated wastewater was formulated based on the Grade B standard of pollutant discharge from urban sewage treatment plants, with the N concentration adjusted with a 20% Hoagland’s nutrient solution (Table S1) [26]. The total inorganic nitrogen concentration (TIN) was 22.4 mg∙L−1, with NH4+-N at 11.2 mg∙L−1 and nitrate nitrogen (NO3-N) at 11.2 mg∙L−1. The operation mode was intermittent inflow and outflow, with each microcosm being fed 50 L of simulated wastewater every 7 days for a total of 9 times. Before each wastewater addition, the simulated wastewater in the system was completely drained.

2.2. Sample Collection and Measurements

Starting on 14 November 2021, water samples were collected weekly (the last day before the system recharge) for a total of 9 times; samples were taken from each system and stored in polyethylene bottles. The water samples were filtered through microporous membranes (Ø 0.45 µm) before analysis; then, the NH4+-N concentration was determined using Nessler’s reagent colorimetry, and the NO3-N concentration was determined using ultraviolet spectrophotometry. The sum of the NH4+-N and NO3-N concentrations was considered as the total inorganic nitrogen (TIN) concentration. NO2-N is an intermediate product in the processes of nitrification and denitrification, which can be quickly transformed into NH4+-N or NO3-N; thus, NO2-N was not included in the TIN calculation.
After the last water sample collection, the whole-plant harvesting method was used to harvest all plants in each system. The harvested plants were washed to clear away soil and classified according to their types. Then, the plants were dried at 105 °C for 30 min and at 65 °C for 72 h until a constant weight was reached, and then weighed to obtain the total biomass.
After harvesting the plants, 500 g of substrate was taken from each system using the five-point sampling method. The substrate N concentrations was determined by leaching 100 mL of 2 mol L−1 KCl solution and shaking the sample on a shaker at 200 r min−1 for 1 h. The extraction solution was filtered through a microporous membrane (Ø 0.45 µm), and the substrate N concentrations were measured after filtration through the microporous membrane. The detection method was the same as that for the water samples.

2.3. Parameter Calculation

Stability is widely applicable in ecology, and the relationship between species diversity and ecosystem stability varies under different definitions. This experiment primarily focused on temporal variability to reflect the ecosystem stability. The calculation formula is as follows [27]:
C V = σ / μ
where σ represents the standard deviation of the effluent N concentration, μ represents the mean value of the effluent N concentration, and CV represents the coefficient of variation. A larger CV indicates lower stability.

2.4. Statistical Analysis

A two-way ANOVA was used to analyze the effects and interactions of the aquatic plant diversity and C. chinensis on the effluent N concentration (the average effluent TIN, NH4+-N, and NO3–Nconcentrations across 9 times), plant biomass, substrate N concentration (TIN, NH4+-N, and NO3-N) content, and coefficient of variation of the effluent N concentrations. A linear regression analysis examined the relationship between species richness and various parameters. A one-way ANOVA was conducted to test whether different species compositions caused any significant differences in the effluent N concentration and its coefficient of variation, the plant biomass, and the substrate N concentration in systems with or without C. chinensis. If significant differences were found, Fisher’s least significant difference (LSD) test was applied for further multiple comparisons. Additionally, an independent-sample t-test was used to analyze the impact of the presence or absence of species on various parameters in systems with or without C. chinensis. Before analysis, the data were tested for normality, and, if they did not conform to a normal distribution, the data were transformed to achieve normality. If the data still did not meet the normality assumption, non-parametric tests (multiple-group non-parametric tests) were used for analysis. All analyses were performed in R (version 4.3.1) with a significance level set at 0.05.

3. Results

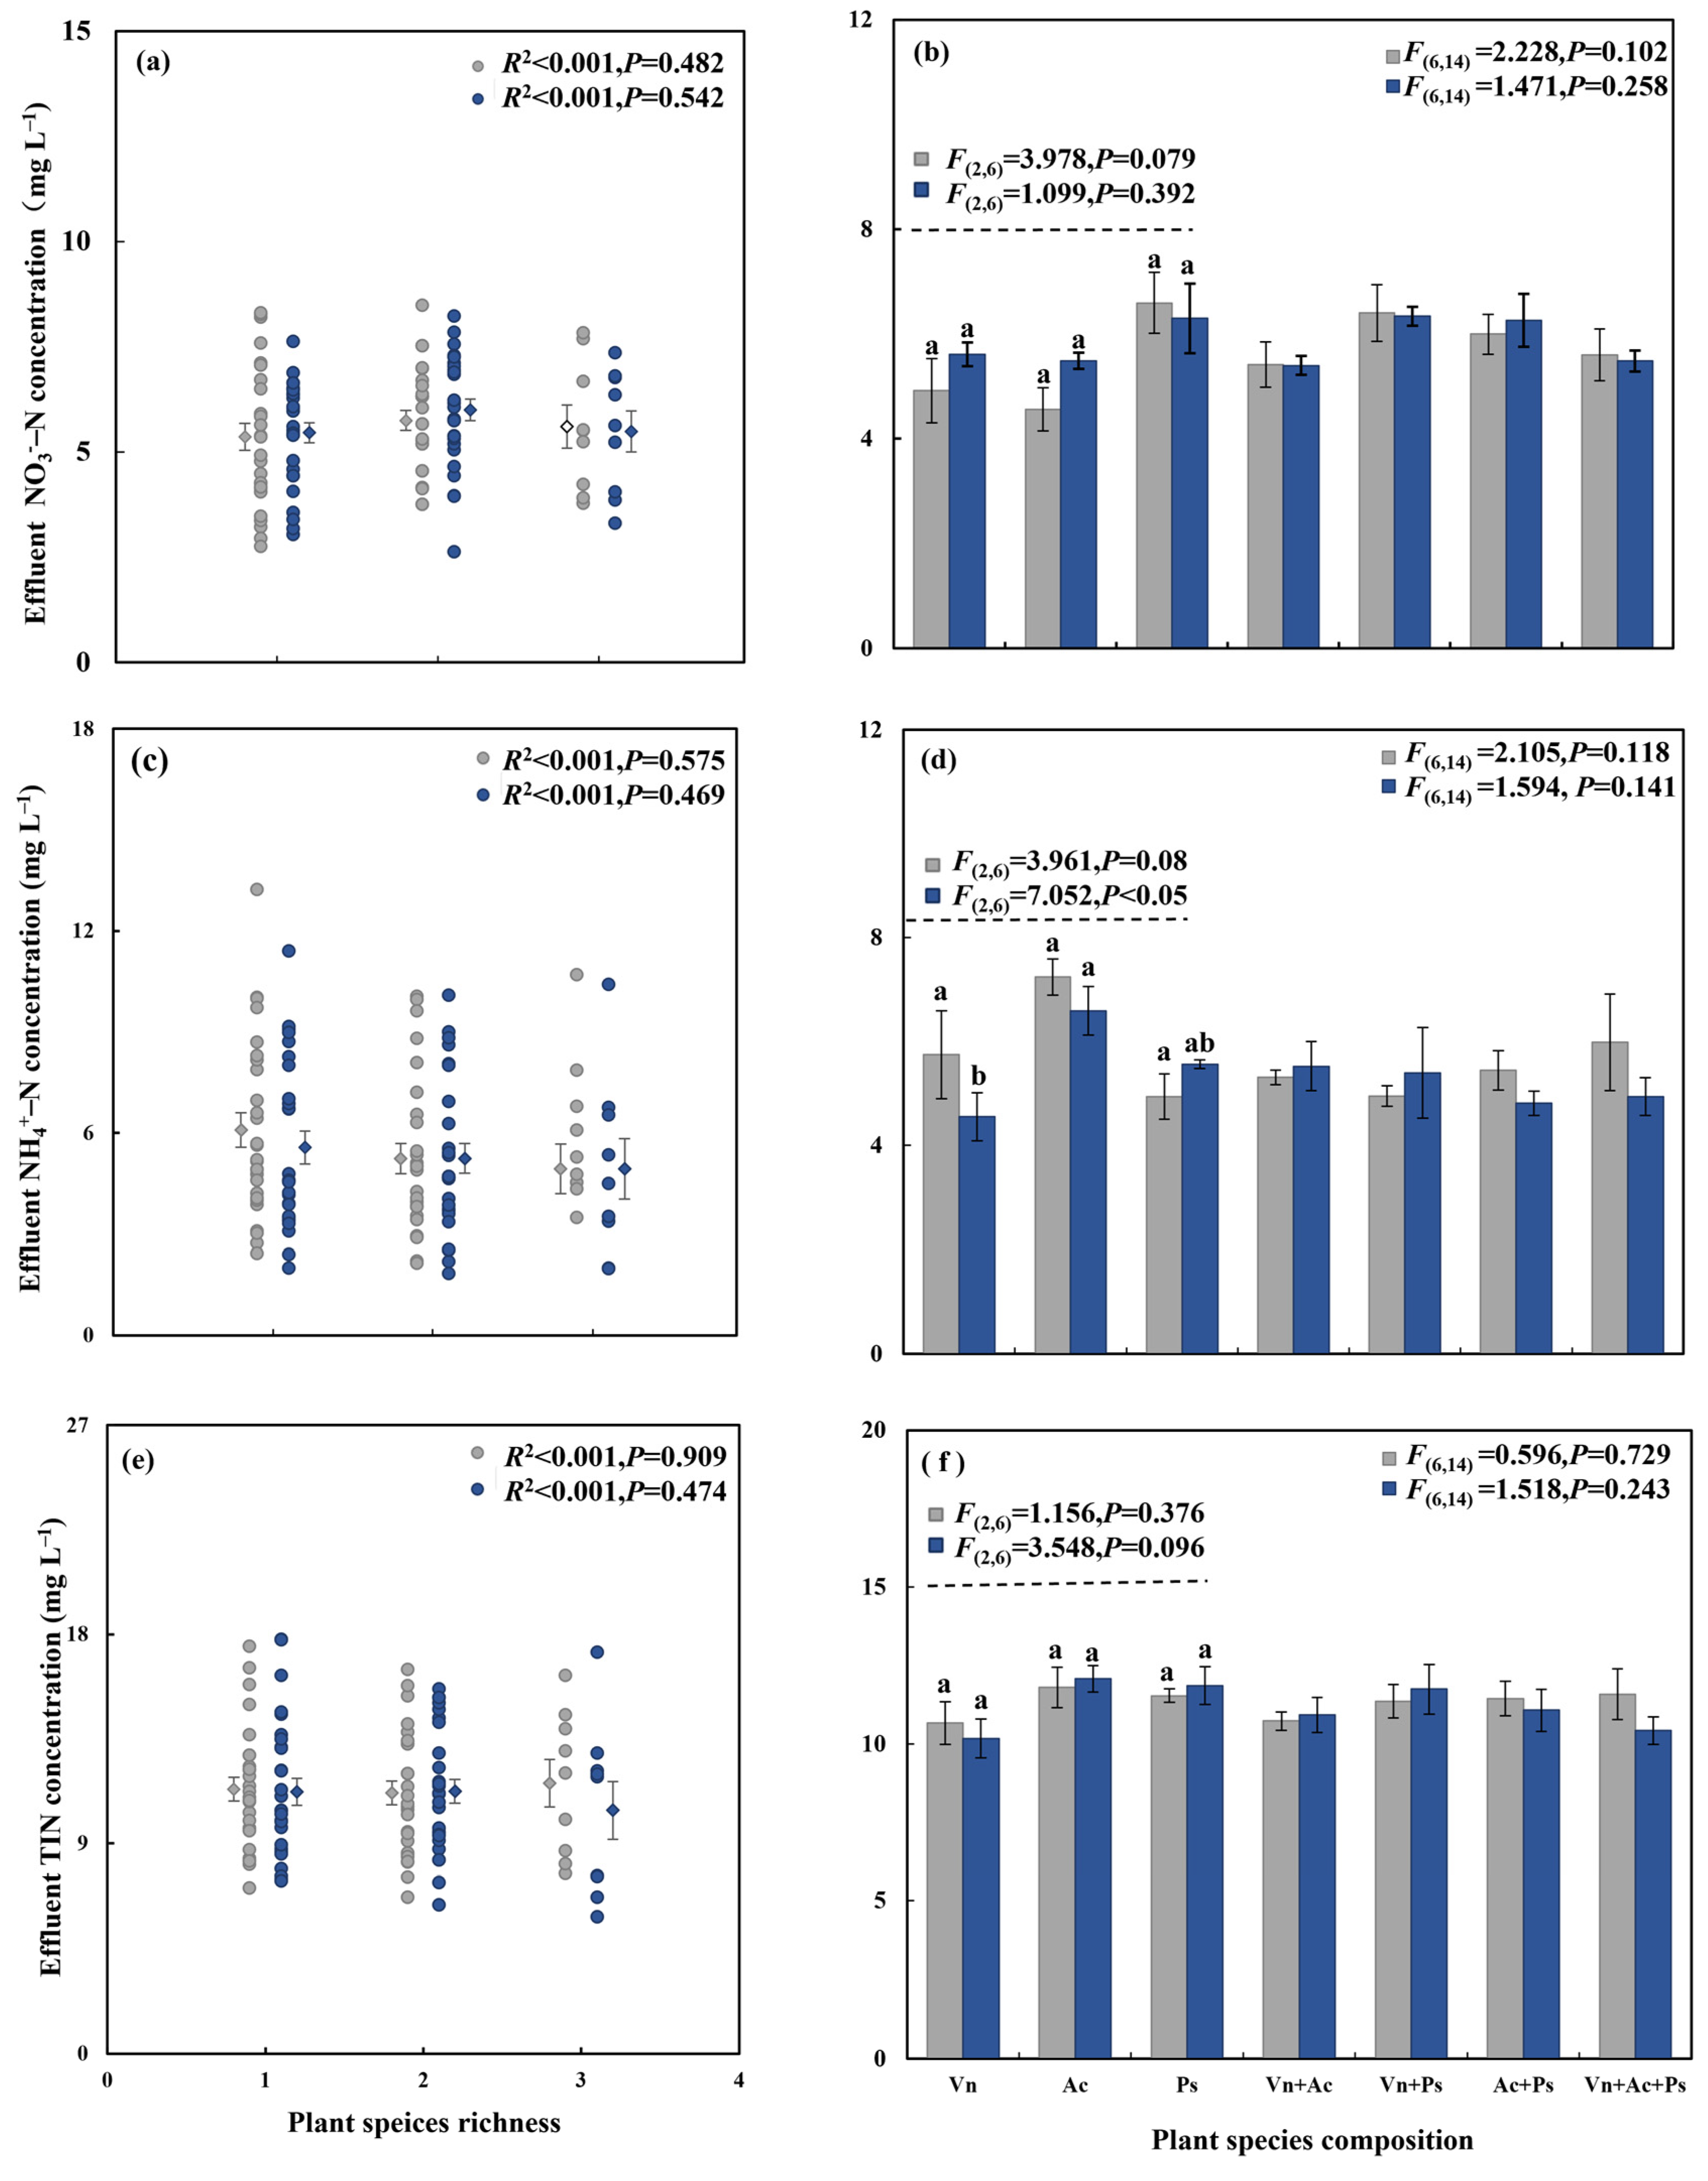
3.1. Effect of Aquatic Plant Species Diversity with Different Life Forms and C. chinensis on N Removal

The plant species richness did not significantly affect the effluent N concentration (Table S2, Figure 2a,c,e). However, there were significant differences in the effluent NH4+-N concentrations among the plant species compositions (Figure 2d). In systems without C. chinensis, no significant differences in the effluent N concentration were observed among the three monocultures (Figure 2b,d,f). In systems with C. chinensis, the NH4+-N concentration was the lowest in the monoculture of V. natans (Figure 2d). The presence of P. stratiotes significantly increased the effluent NO3-N concentration by 23.8% and 10.8% in systems with or without C. chinensis, respectively (Table 1), while other species did not significantly affect the effluent N concentration (Table 1). The addition of C. chinensis did not affect the effluent N concentration (Figure 2).

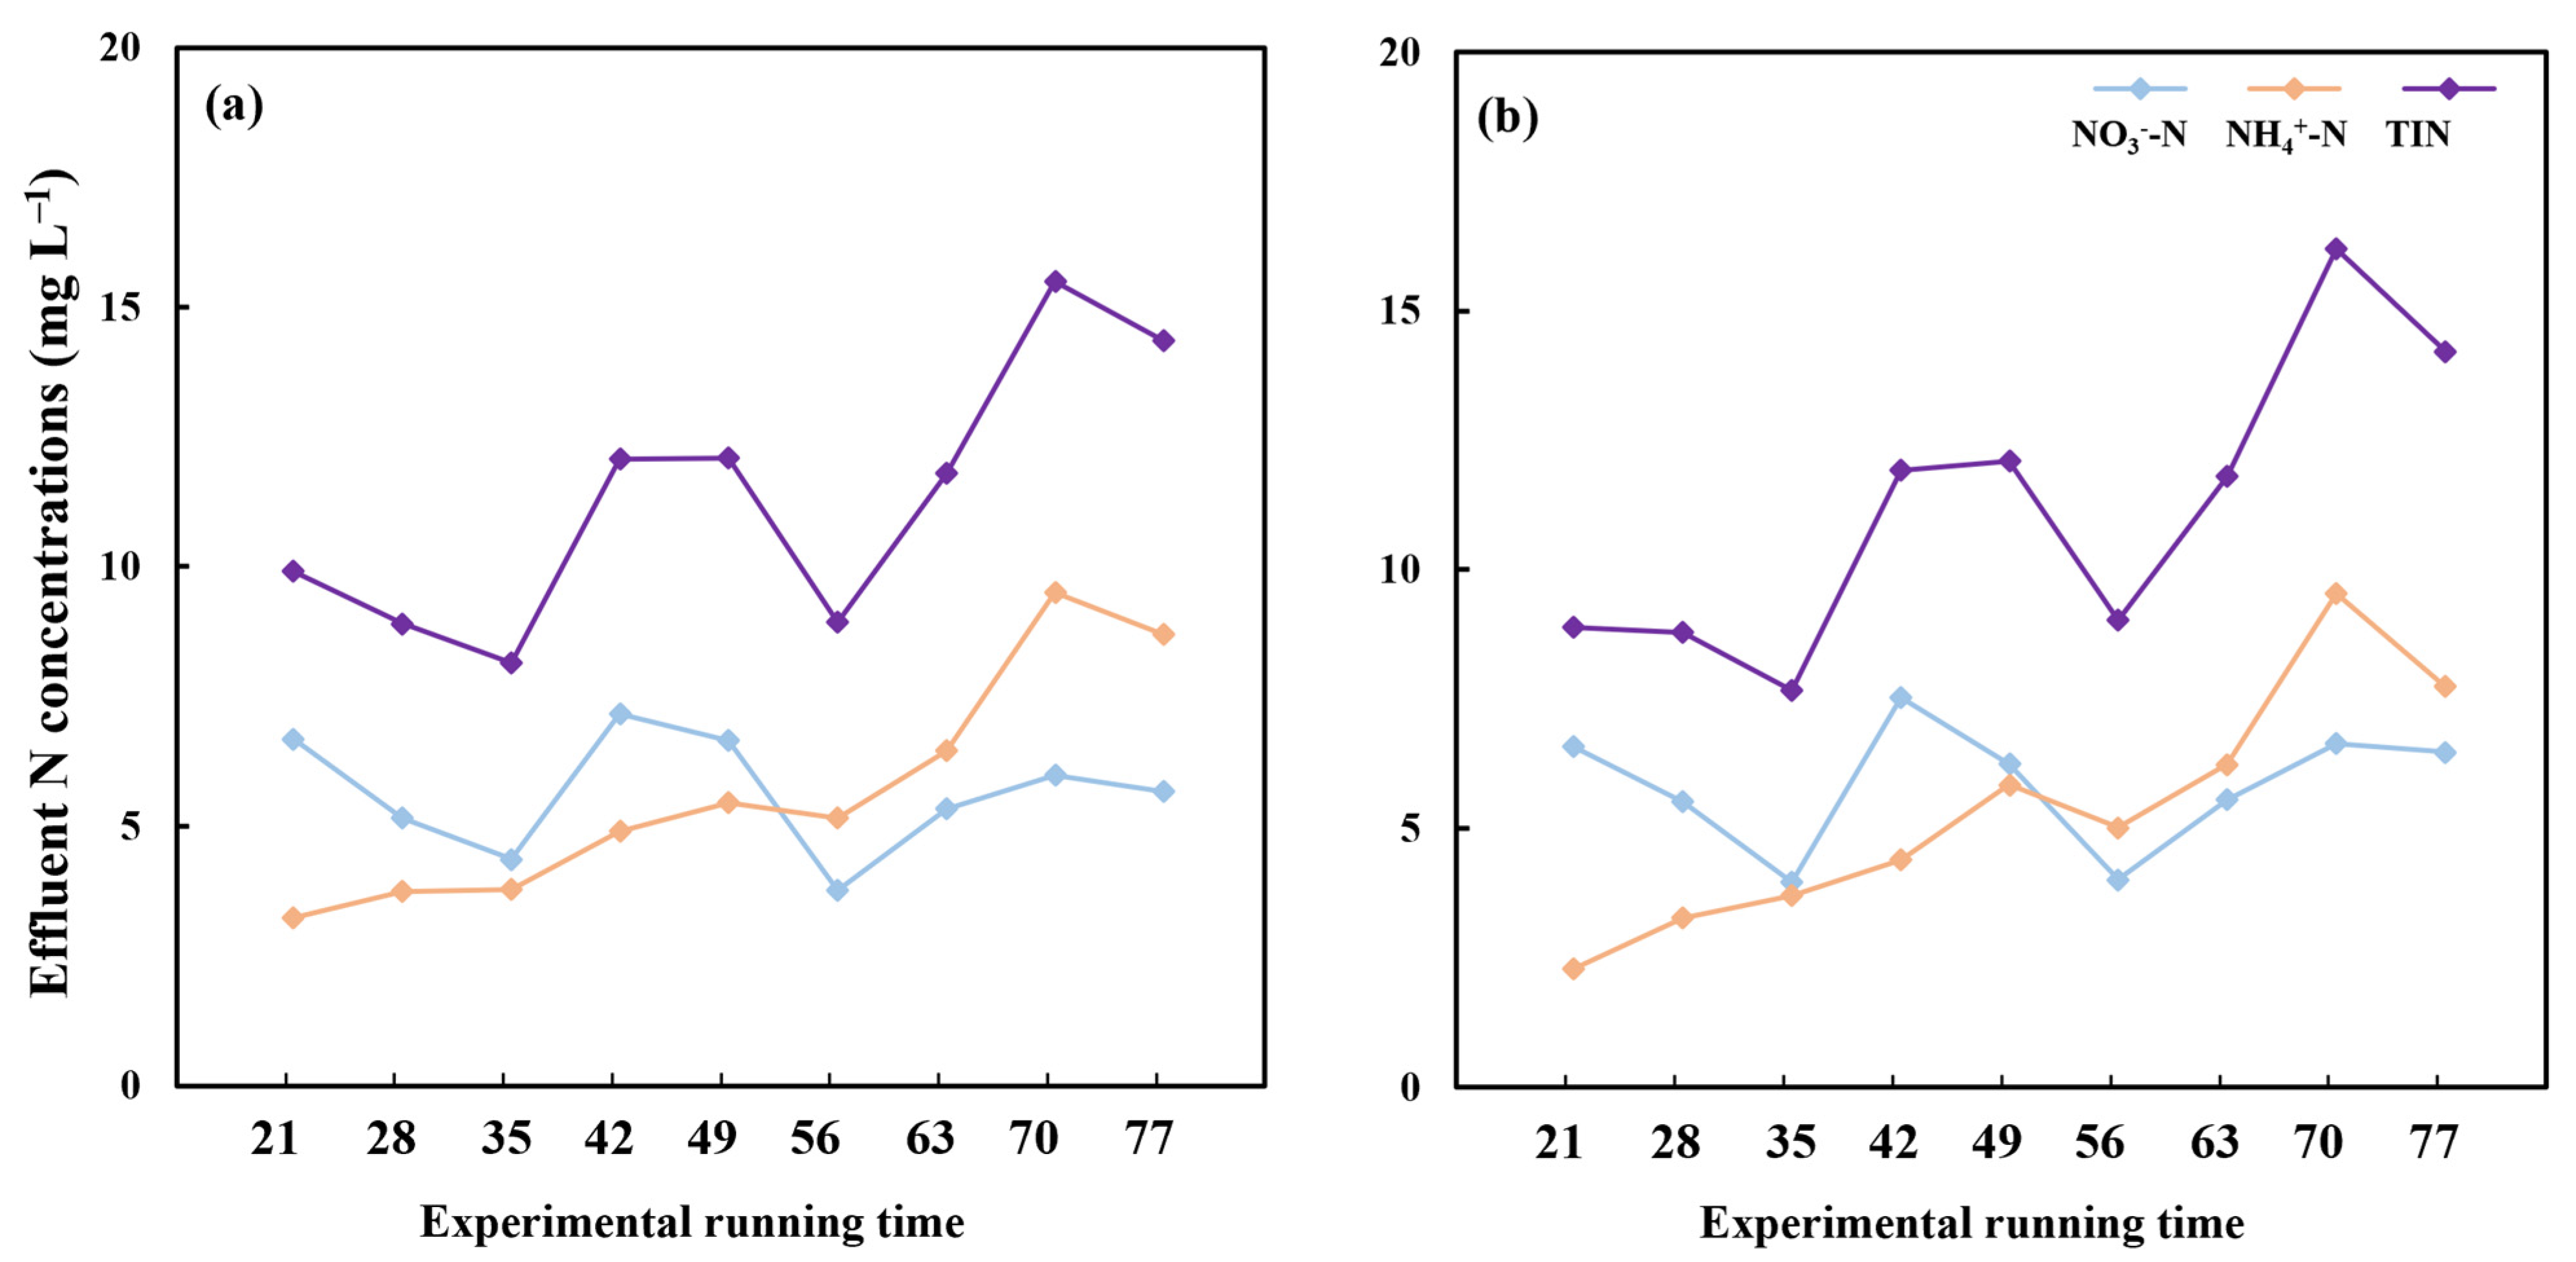
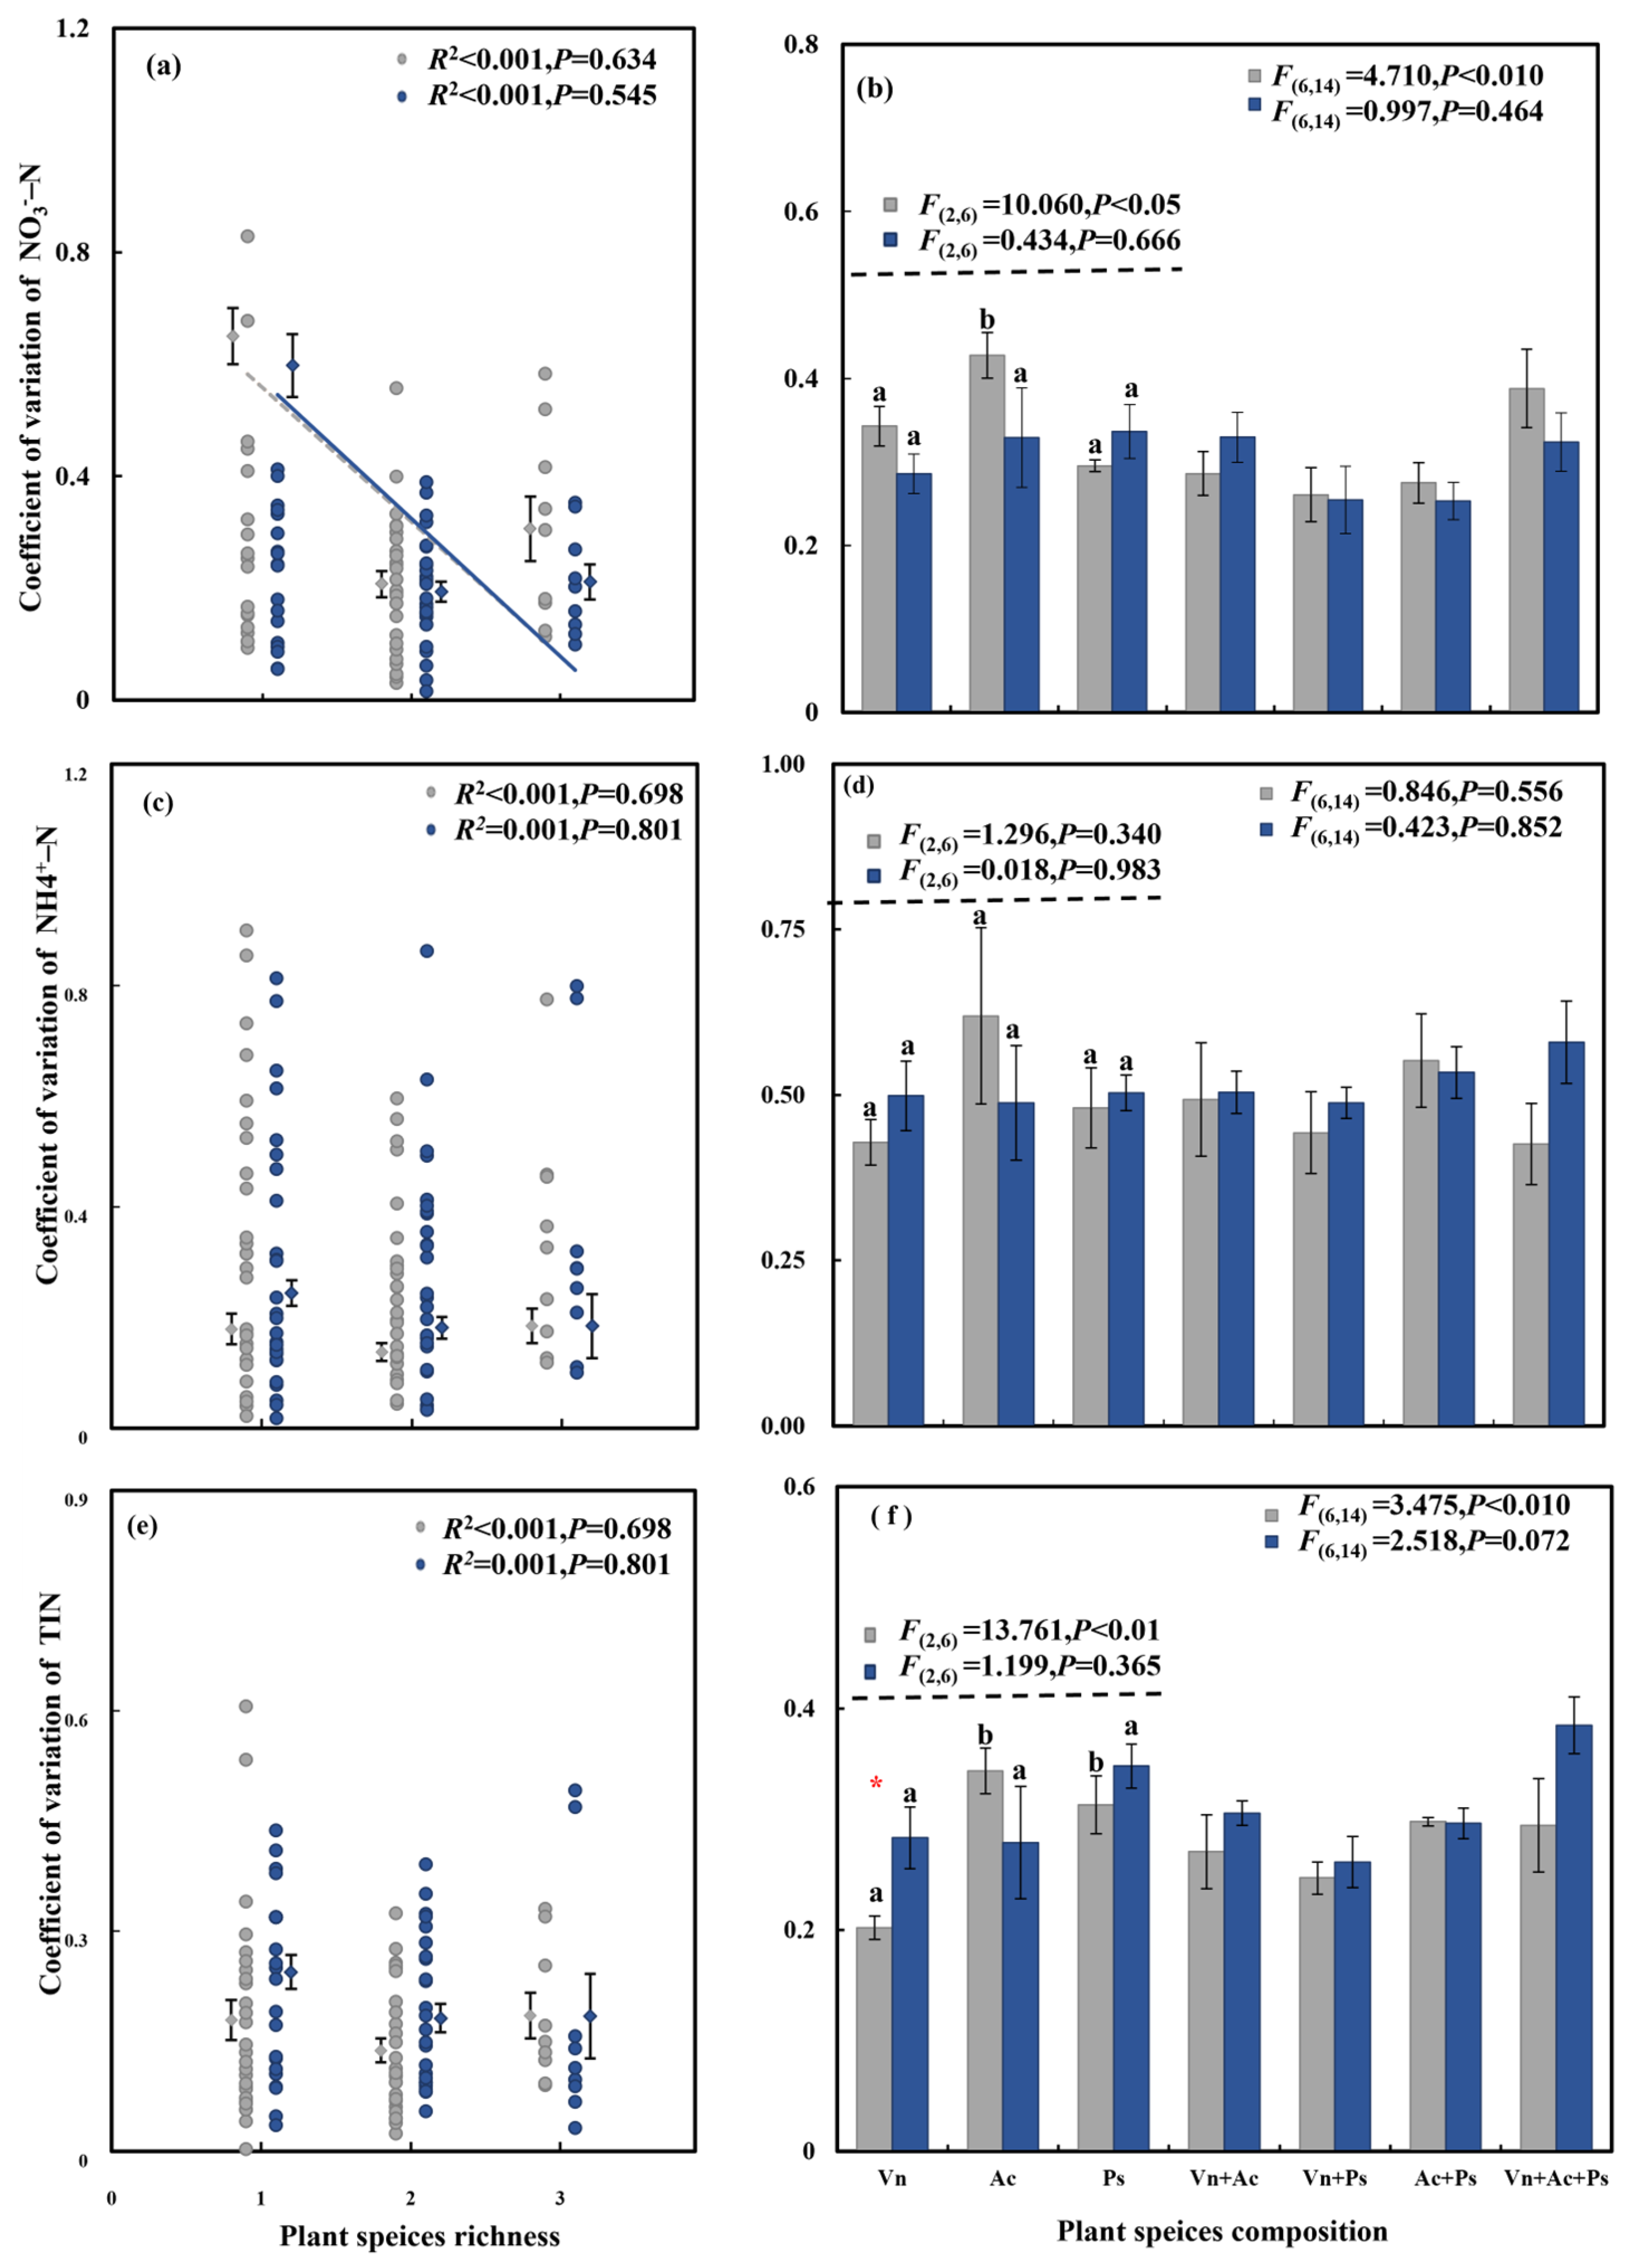
3.2. Effect of Aquatic Plant Species Diversity with Different Life Forms and C. chinensis on Temporal Stability of Effluent N Concentration

Temporal stability is a crucial metric in evaluating the ecosystem’s operational efficiency. Regardless of the presence or absence of C. chinensis, during the experimentation period, there were considerable fluctuations in the effluent N concentration, with the trend in TIN corresponding with that of NO3-N (Figure 3).
The plant species richness and composition significantly affected the temporal stability of the effluent N concentration (Table S2). In systems without or with C. chinensis, the temporal stability of the effluent NO3-N concentration significantly increased with the increase in plant species richness (Figure 4a). In the monoculture systems without C. chinensis, significant differences were observed in the temporal stability of the effluent TIN and NO3-N concentrations among the different species compositions (Figure 4b,f), but not for NH4+-N (Figure 4d). Among the three monocultures, V. natans exhibited the highest temporal stability of the effluent NO3-N and TIN concentrations, while A. calamus showed the lowest (Figure 4b,f). The presence of V. natans significantly increased the temporal stability of the effluent TIN concentration by 20.4% (Table 2a). The presence of V. natans reduced the temporal stability of the effluent TIN concentration by 44.6% (Table 2b); however, in the monoculture systems with C. chinensis, the species composition and identity did not significantly affect the temporal stability of the effluent N concentration (Figure 4b,d,f, Table 2). The presence of C. chinensis significantly reduced the temporal stability of the TIN concentration in the monoculture system of V. natans (Figure 4f).

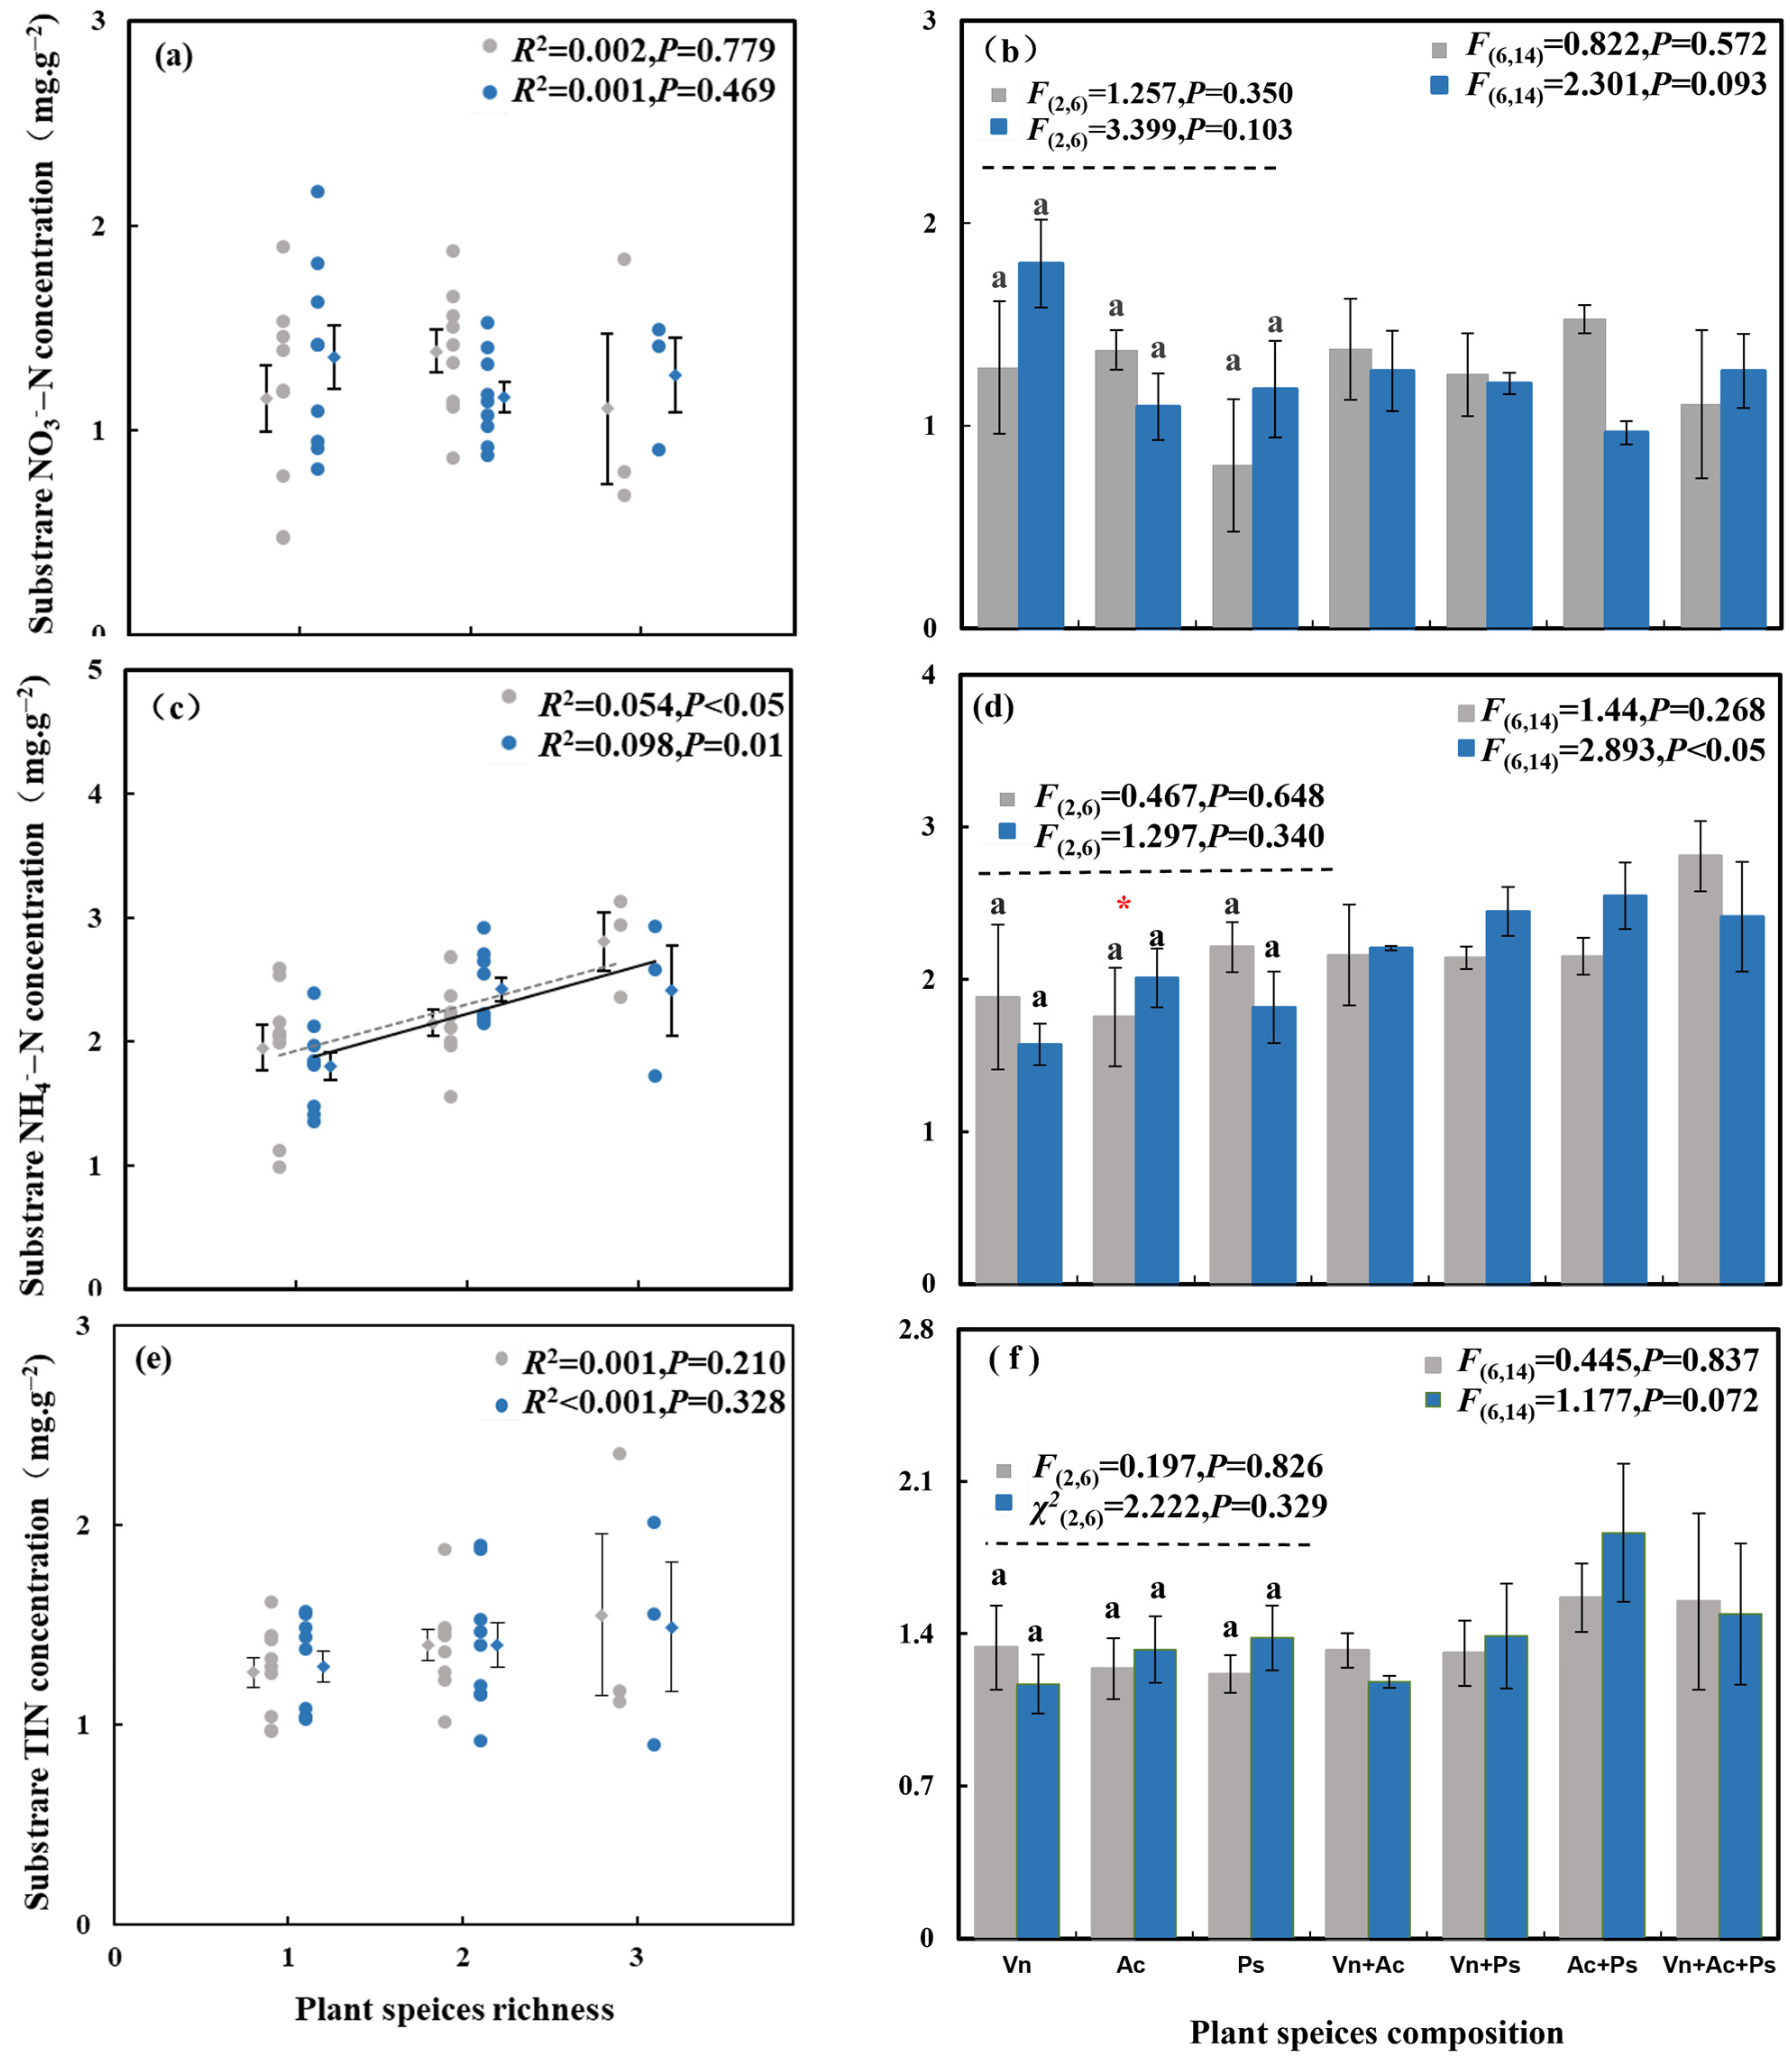
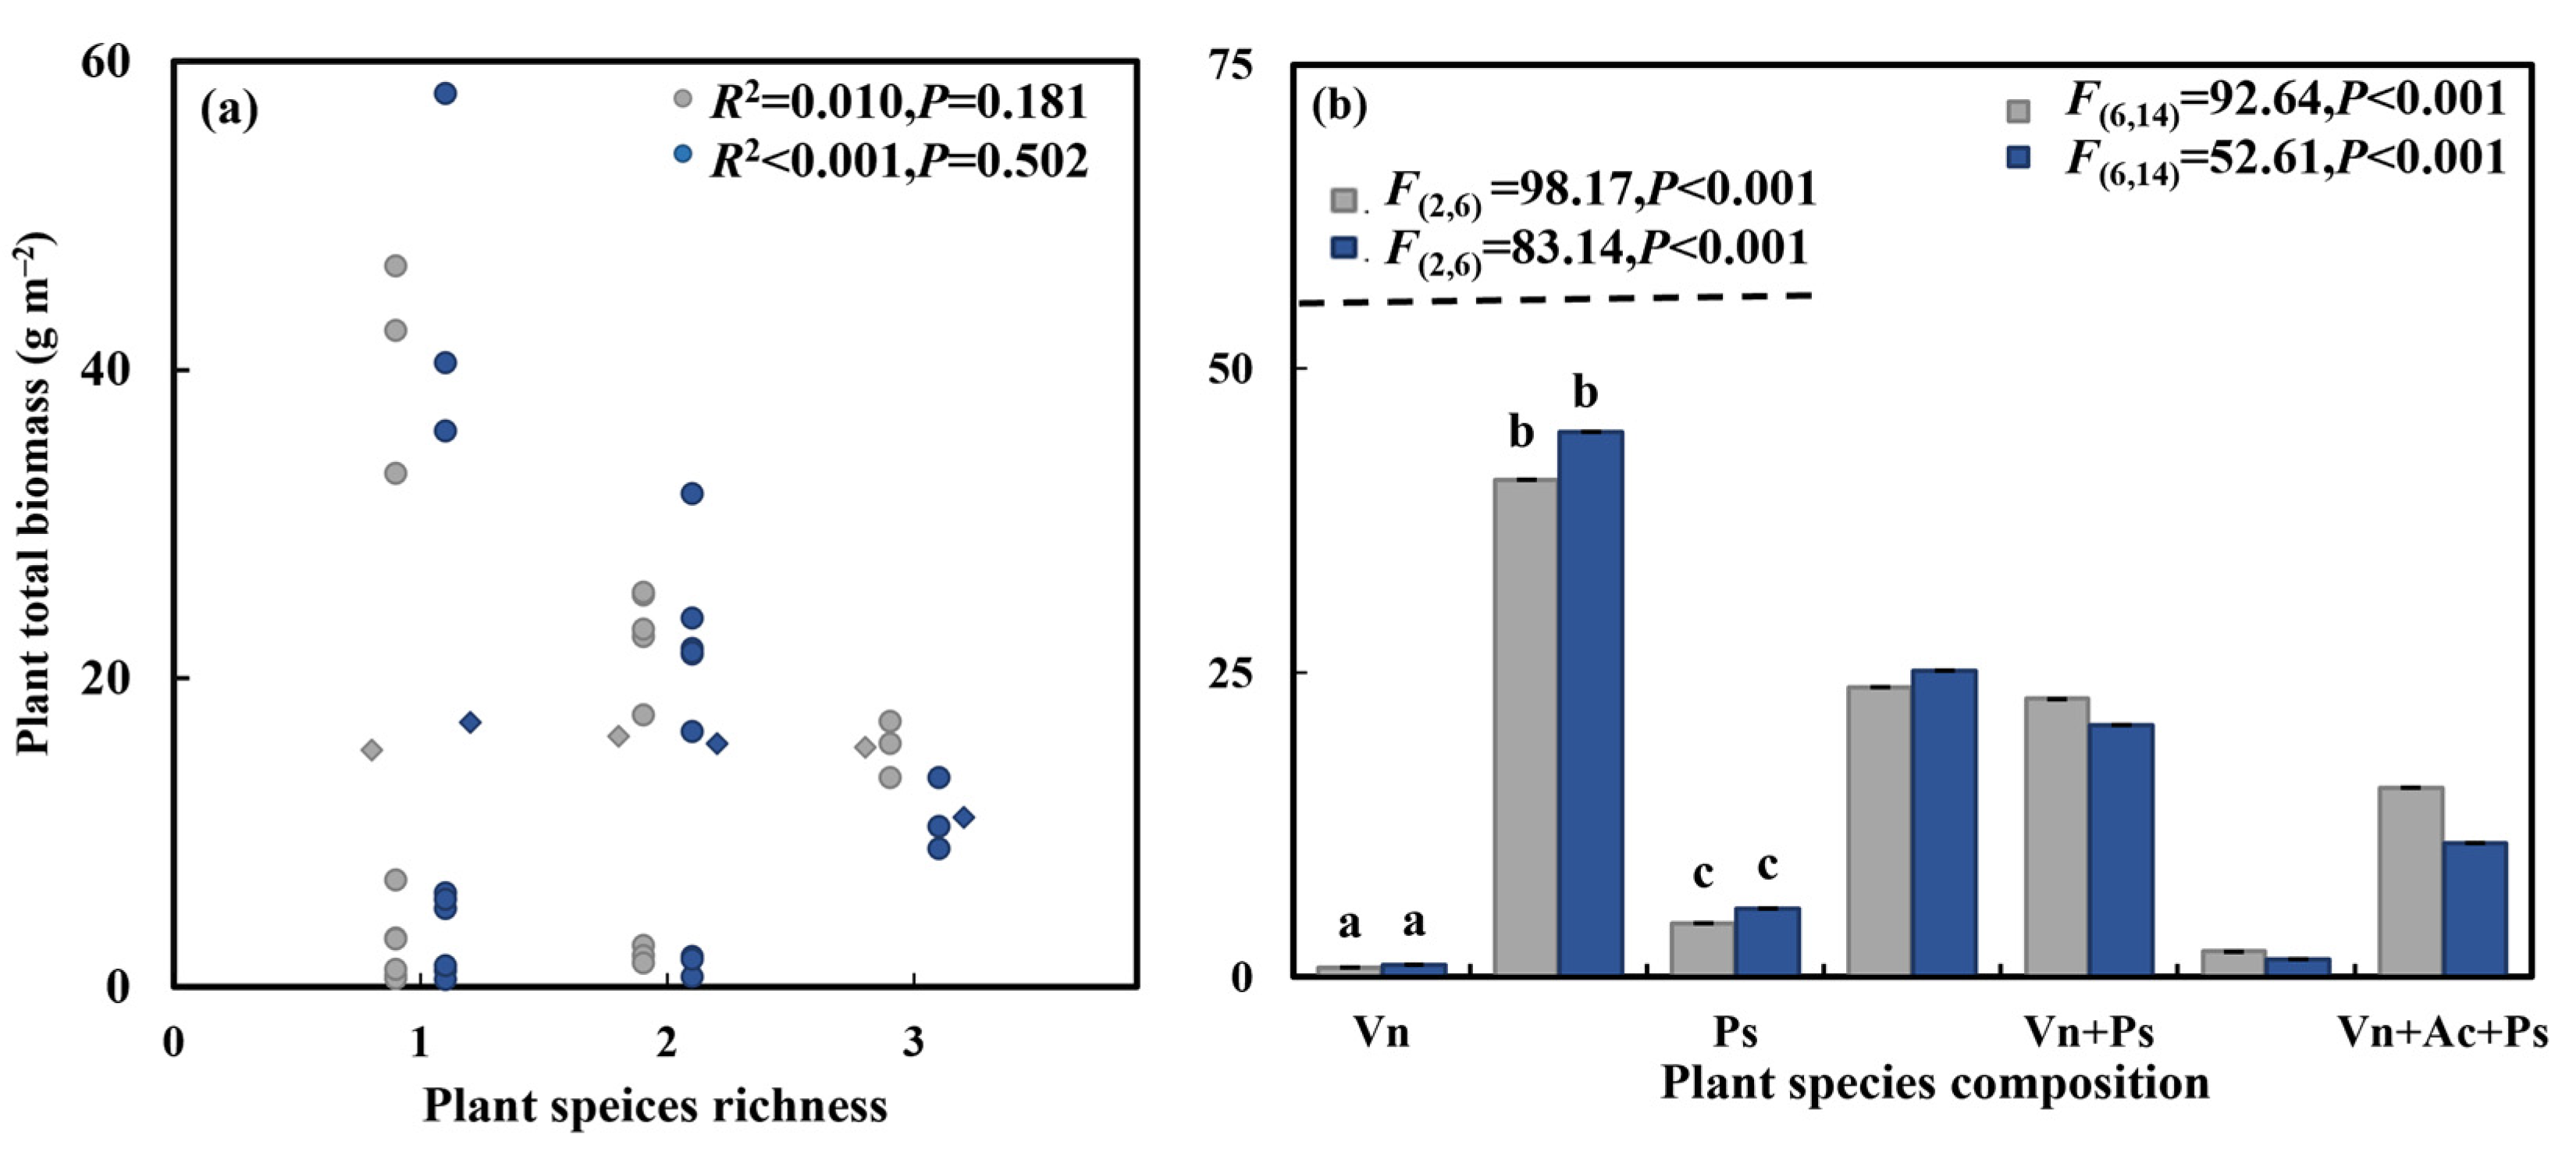
3.3. Effect of Aquatic Plant Species Diversity with Different Life Forms and C. chinensis on Substrate N Concentration and Total Plant Biomass

Regardless of the presence of C. chinensis, the substrate NH4+-N concentration significantly increased with the increase in plant species richness (Figure 5c). In systems without C. chinensis, the plant species composition and identity did not significantly affect the substrate N concentration (Figure 5, Table 3a). In systems with C. chinensis, the mixed culture of P. stratiotes and A. calamus showed the highest substrate NH4+-N concentration, while the monoculture of V. natans exhibited the lowest (Figure 5d). The presence of V. natans significantly increased the substrate NO3-N concentration, whereas the presence of P. stratiotes significantly increased the substrate NH4+-N concentration (Table 3b). Adding C. chinensis significantly increased the substrate NH4+-N concentration in the systems with monocultured A. calamus (Figure 5d).
In systems with or without C. chinensis, the plant species richness and identity did not significantly affect the total plant biomass (Figure 6a, Table 3). However, the plant species composition significantly affected the total plant biomass (Figure 6b). Among the seven compositions, the total biomass of the A. calamus monoculture was the highest among the systems with or without C. chinensis (Figure 6b).

4. Discussion

4.1. Impact of Aquatic Plant Diversity and C. chinensis on Effluent N Concentration

Previous studies have indicated that plant species richness can enhance the N removal efficiency in CWs [12]. However, this study found no significant effect of plant species richness on the effluent N concentration (Figure 2). This discrepancy may arise from existing studies primarily focusing on the effect of the species richness of emergent macrophytes on N removal [28]. This study included three plant species with different life forms: emergent, submerged, and floating-leaved macrophytes. The rapid growth of emergent macrophytes likely inhibited the submerged macrophytes’ light absorption, thus restraining their photosynthesis and lowering their N uptake capacity in the simulated wastewater [29,30]. Additionally, the differing microbial community structures on the biofilms of submerged and floating-leaved macrophytes, particularly in the relative abundances of nitrifying and denitrifying bacteria, could have contributed to the insignificant diversity effect observed [31]. Furthermore, previous studies often used simulated wastewater containing either pure ammonia or pure nitrate, whereas our study used wastewater with equal concentrations of ammonium and nitrate. This may have diminished the effect of the species diversity, as different species absorb different forms of N at varying rates. Han et al. (2019) also reported that equal ammonium and nitrate concentrations in wastewater nullified the impact of species richness on the effluent N concentration [32]. Similarly, our study found no significant effect of species richness on the total plant biomass and the concentrations of TIN and NO3-N in the substrate (Figure 5 and Figure 6). Climatic constraints limiting plant growth and the potential for nitrification and denitrification might explain the lack of a relationship between plant richness and the concentrations of total biomass and TIN and NO3-N in the substrate, resulting in an insignificant impact on N removal. The limited number of species (three) used in our experiment may also have restricted the observed species richness effect.
Species identity is another crucial factor affecting water quality. The larger biomass of plant species usually means that more plant tissue types are involved in the water purification process. Different combinations of plant species often lead to changes in the total biomass of the system due to competition for resources, such as the biomass of a monoculture system being greater than that of a mixed system [33]. Previous studies have shown that the presence of specific species can alter the effluent N concentration [21,25]. For example, the presence of the aquatic plant Phragmites australis decreased the effluent N concentration [21], while the presence of the aquatic plant Iris tectorum Maxim increased the concentrations of NO3-N and TIN in the effluent [25]. Similarly, in this experiment, the presence of the aquatic plant P. stratiotes significantly increased the effluent NO3-N concentration (Table 1). As a floating-leaved macrophyte, P. stratiotes reproduces rapidly and can quickly cover the water surface, reducing the system’s dissolved oxygen (DO) content [34], which inhibits nitrification and the efficiency of N removal. While C. chinensis has been reported to enhance the N removal efficiency [24], our experiment found that the addition of C. chinensis did not affect the effluent N concentration (Figure 2). The presence of C. chinensis may promote plant N uptake but also contribute N through excretion [25,35]. Moreover, adding C. chinensis might reduce the DO in the water through cellular respiration, inhibiting denitrification and increasing the N content in the water [36]. These conflicting effects result in an insignificant impact of C. chinensis on the effluent N concentration (Table S2, Figure 2). Additionally, the hibernation of C. chinensis might also limit the role of benthic animals in N removal [37]. Increasing the plant species richness or configuring optimal wetland plants (such as V. perennial) and adding benthic animals could improve the water quality.

4.2. Impact of Aquatic Plant Diversity and C. chinensis on Temporal Stability of N Concentration in Effluent

This study found a significant positive correlation between species richness and the temporal stability of the effluent NO3-N concentration (Figure 4a). According to the MacArthur (1955) diversity–stability hypothesis, higher species diversity leads to greater ecosystem resistance to external disturbances, enhancing its stability [38]. Similarly, Richardson and Elton (1958) suggested that less diverse ecosystems are less stable, whereas communities with a more significant number of species exhibit relatively higher stability [39]. Studies have also shown that high species diversity enhances the portfolio effect, asynchrony effect, and average population temporal stability of species, thereby improving the community’s temporal stability [40]. These findings, along with our study, support the insurance effect, which posits that high species richness buffers ecosystem stability [41].
Species identity is critical in affecting the temporal stability of a system. Previous studies have shown that the presence of P. australis significantly enhanced the stability of the effluent water quality in mixed-species systems [21], and the presence of the plant Poa annua increased the stability of the ecosystem biomass under disturbances [21,42]. Similarly, in this experiment, in the systems without C. chinensis, the presence of V. natans increased the temporal stability of the TIN and NO3-N concentrations in the system (Figure 4b,d,f; Table 2). As a submerged macrophyte, V. natans has evolved ventilation tissue to adapt to low-oxygen environments and significantly contributes to water oxygenation through photosynthesis, enhancing the water quality and promoting nitrification [43,44]. However, in the systems with C. chinensis, V. natans had no significant effect on the temporal stability of the effluent N concentration, likely due to grazing by C. chinensis, which limits the plant’s role in water purification [45]. The disturbance caused by C. chinensis affects the microenvironment of the plants and substrate, impacting the temporal stability of the TIN concentration (Figure 4f). High species richness is essential to improve the stability of the effluent water quality when treating wastewater with plants of different life forms.

5. Conclusions

This study investigated the effect of aquatic plant species diversity with different life forms and C. chinensis on the N concentration and its temporal stability in CWs. The results showed that the presence of P. stratiotes significantly increased the concentration of NO3-N in the effluent; plant species richness enhanced the temporal stability of the effluentNO3-N concentration. The presence of V. natans increased the temporal stability of the effluent TIN concentration in systems without C. chinensis. The presence of V. natans increased the temporal stability of the effluent NO3-N concentration in systems with C. chinensis. Additionally, adding C. chinensis reduced the temporal stability of the effluent TIN concentration in the V. natans monoculture. However, this study did not investigate the impact of high plant species richness and benthic animals on other ecosystem functions. Future research should aim to increase the species richness of plants and benthic animals to further investigate the combined effects of aquatic plant diversity and benthic animals on ecosystem functions.

Supplementary Materials

The following supporting information can be downloaded at: https://www.mdpi.com/article/10.3390/su16219492/s1, Table S1. Composition of simulated wastewater; Table S2. Effect of aquatic plant diversity and C. chinensis on effluent N concentration; Table S3. Effects of aquatic plant diversity and C. chinensis on the coefficient of variation of effluent N concentration; Table S4. Effect of plant diversity and C. chinensis on substrate N concentration.

Author Contributions

Conceptualization, W.H.; formal analysis, G.K.; investigation, G.K., J.T., L.Y., K.S. and X.X.; writing—original draft preparation, G.K., L.Y., K.S., X.X. and W.H.; writing—review and editing, W.H., D.X., M.Z. and X.Z.; funding acquisition, X.Z. and W.H. All authors have read and agreed to the published version of the manuscript.

Funding

This research was funded by the National Key R&D Program of China (grant number 2022YFE0106200) and the Natural Science Foundation of Zhejiang Province (grant number LY22C030003).

Data Availability Statement

The original contributions presented in the study are included in the article, further inquiries can be directed to the corresponding author.

Conflicts of Interest

The authors declare no conflicts of interest.

References

  1. Pointet, T. The United Nations World Water Development Report 2022 on groundwater, a synthesis. Lhb-Hydrosci. J. 2022, 108. [Google Scholar] [CrossRef]
  2. Francis, J. The United Nations World Water Development Reports: A comparison and contrasts of 2016 and 2017 reports. J. Scientometr. Res. 2017, 6, 209–211. [Google Scholar] [CrossRef]
  3. Weerasekara, P. The United Nations World Water Development Report 2017 Wastewater: The Untapped Resource. Future Food-J. Food Agric. Soc. 2017, 5, 80–81. [Google Scholar] [CrossRef]
  4. Kataki, S.; Chatterjee, S.; Vairale, M.; Dwivedi, S.; Gupta, D. Constructed wetland, an eco-technology for wastewater treat ment: A review on types of wastewater treated and components of the technology (macrophyte, biolfilm and substrate). J. Environ. Manag. 2021, 283. [Google Scholar] [CrossRef]
  5. Wu, H.; Wang, R.; Yan, P.; Wu, S.; Chen, Z.; Zhao, Y.; Cheng, C.; Hu, Z.; Zhuang, L.; Guo, Z.; et al. Constructed wetlands for pollution control. Nat. Rev. Earth Environ. 2023, 4, 218–234. [Google Scholar] [CrossRef]
  6. Wang, W.; Yan, W.; Wen, Y.; Ling, S.; Xiao, Z.; Qi, J.; Xin, C.; Ping, Q.; Ying, X. Improving the efficacy of different life-form macrophytes in phytoremediation of artificial eutrophic water by combined planting. Environ. Sci. Pollut. Res. 2023, 30, 67621–67633. [Google Scholar] [CrossRef]
  7. Ma, Y.; Gu, X.; Zhang, Y.; Yan, P.; Zhang, M.; Sun, S.; Ren, Y.; Tang, L.; He, S. Unveiling the microplastic perturbation on surface flow constructed wetlands with macrophytes of different life forms: Responses of nitrogen removal and sensory quality. J. Hazard. Mater. 2024, 477, 135283. [Google Scholar] [CrossRef] [PubMed]
  8. van Gerven, L.; de Klein, J.; Gerla, D.; Kooi, B.; Kuiper, J.; Mooij, W. Competition for light and nutrients in layered communities of aquatic plants. Am. Nat. 2015, 186, 72–83. [Google Scholar] [CrossRef]
  9. Olesen, A.; Jensen, S.; Alnoee, A.; Baattrup-Pedersen, A.; Lauridsen, T.; Sorrell, B.; Riis, T. Nutrient kinetics in submerged plant beds: A mesocosm study simulating constructed drainage wetlands. Ecol. Eng. 2018, 122, 263–270. [Google Scholar] [CrossRef]
  10. Knops, J.; Bradley, K.; Wedin, D. Mechanisms of plant species impacts on ecosystem nitrogen cycling. Ecol. Lett. 2002, 5, 454–466. [Google Scholar] [CrossRef]
  11. Hartmann, A.; Schmid, M.; van Tuinen, D.; Berg, G. Plant-driven selection of microbes. Plant Soil 2009, 321, 235–257. [Google Scholar] [CrossRef]
  12. Choudhury, I.; McKie, G.; Hallin, S.; Ecke, F. Mixtures of macrophyte growth forms promote nitrogen cycling in wetlands. Sci. Total Environ. 2018, 635, 1436–1443. [Google Scholar] [CrossRef]
  13. Li, Q.; Deng, H.; He, R.; Hu, S.; Sun, L.; Li, M.; Wu, Q.L.; Zeng, J. Effects of different emergent macrophytes on methane flux and rhizosphere microbial communities in wetlands. Sci. Total Environ. 2024, 932. [Google Scholar] [CrossRef]
  14. Puche, E.; Cruz, D.; Delgado, P.; Rosinska, J.; Rodrigo, M. Changes in submerged macrophyte diversity, coverage and biomass in a biosphere reserve site after 20 years: A plea for conservation efforts. Biol. Conserv. 2024, 294, 110607. [Google Scholar] [CrossRef]
  15. Shen, K.; Cao, H.; Tao, J.; Zheng, X.; Han, W. Adding Cipangopaludina chinensis altered the effects of submerged macrophyte diversity on water turbidity and nitrogen concentration. Water Air Soil Pollut. 2024, 235. [Google Scholar] [CrossRef]
  16. Grimm, V.; Wissel, C. Babel, or the ecological stability discussions: An inventory and analysis of terminology and a guide for avoiding confusion. Oecologia 1997, 109, 323–334. [Google Scholar] [CrossRef]
  17. Wang, S.; Lamy, T.; Hallett, L.; Loreau, M. Stability and synchrony across ecological hierarchies in heterogeneous meta communities: Linking theory to data. Ecography 2019, 42, 1200–1211. [Google Scholar] [CrossRef]
  18. Hillebrand, H.; Bennett, D.; Cadotte, M. Consequences of dominance: A review of evenness effects on local and regional ecosystem processes. Ecology 2008, 89, 1510–1520. [Google Scholar] [CrossRef] [PubMed]
  19. Tilman, D.; Wedin, D.; Knops, J. Productivity and sustainability influenced by biodiversity in grassland ecosystems. Nature 1996, 379, 718–720. [Google Scholar] [CrossRef]
  20. Tilman, D.; Reich, P.B.; Knops, J.M. Biodiversity and ecosystem stability in a decade-long grassland experiment. Nature 2006, 441, 629–632. [Google Scholar] [CrossRef]
  21. Wang, X.; Luo, B.; Wang, L.; Zhao, Y.; Wang, Q.; Li, D.; Gu, B.; Min, Y.; Chang, S.; Ge, Y.; et al. Plant diversity improves the effluent quality and stability of floating constructed wetlands under increased ammonium/nitrate ratio in influent. J. Environ. Manag. 2020, 266. [Google Scholar] [CrossRef] [PubMed]
  22. Li, Q.; Long, Z.; Wang, H.; Zhang, G. Functions of constructed wetland animals in water environment protection—A critical review. Sci. Total Environ. 2021, 760. [Google Scholar] [CrossRef] [PubMed]
  23. Li, P.; Zhang, J.; Xie, H.; Hu, Z.; He, H.; Wang, W. Effects of Misgurnus anguillicaudatus and Cipangopaludina cathayensis on pollutant removal and microbial community in constructed wetlands. Water 2015, 7, 2422–2434. [Google Scholar] [CrossRef]
  24. Kang, Y.; Zhang, J.; Xie, H.; Guo, Z.; Ngo, H.; Guo, W.; Liang, S. Enhanced nutrient removal and mechanisms study in benthic fauna added surface-flow constructed wetlands: The role of Tubifex tubifex. Bioresour. Technol. 2017, 224, 157–165. [Google Scholar] [CrossRef]
  25. Yang, L.; Shen, K.; Xu, X.; Xiao, D.; Cao, H.; Lin, Y.; Zheng, X.; Zhao, M.; Han, W. Adding Corbicula fluminea altered the effect of plant species diversity on greenhouse gas emissions and nitrogen removal from constructed wetlands in the low-temperature season. Sci. Total Environ. 2024, 907. [Google Scholar] [CrossRef]
  26. Hu, H.; Ao, S.; Yang, E.; Li, Q. Treating eutrophic water for nutrient reduction using an aquatic macrophyte (Ipomoea aquatica Forsskal) in a deep flow technique system. Agric. Water Manag. 2008, 95, 607–615. [Google Scholar] [CrossRef]
  27. Venail, P.; Gross, K.; Oakley, T.; Narwani, A.; Allan, E.; Flombaum, P.; Isbell, F.; Joshi, J.; Reich, P.; Tilman, D.; et al. Species richness, but not phylogenetic diversity, influences community biomass production and temporal stability in a re-examination of 16 grassland biodiversity studies. Funct. Ecol. 2015, 29, 615–626. [Google Scholar] [CrossRef]
  28. Yu, Q.; Duan, X.; Gu, Y.; Li, J.; Zhang, X.; Chen, C.; Zhao, D. Increasing chemical oxygen demand and nitrogen removal efficiencies of surface-flow constructed wetlands in macrophyte-dominant seasons by adding artificial macrophytes. Bioresour. Technol. 2022, 348, 126755. [Google Scholar] [CrossRef]
  29. Hong, G.; Son, Y.; Kim, G. Effects of interspecific competition on the growth and competitiveness of five emergent macrophytes in a constructed lentic wetland. Paddy Water Environ. 2014, 12, S193–S202. [Google Scholar] [CrossRef]
  30. Johns, C.; Ramsey, M.; Bell, D.; Vaughton, G. Does increased salinity reduce functional depth tolerance of four non-halophytic wetland macrophyte species? Aquat. Bot. 2014, 116, 13–18. [Google Scholar] [CrossRef]
  31. Han, W.; Ge, Y.; Ren, Y.; Luo, B.; Du, Y.; Chang, J.; Wu, J. Removal of metals and their pools in plant in response to plant diversity in microcosms of floating constructed wetlands. Ecol. Eng. 2018, 113, 65–73. [Google Scholar] [CrossRef]
  32. Han, W.; Luo, G.; Luo, B.; Yu, C.; Wang, H.; Chang, J.; Ge, Y. Effects of plant diversity on greenhouse gas emissions in microcosms simulating vertical constructed wetlands with high ammonium loading. J. Environ. Sci. 2019, 77, 229–237. [Google Scholar] [CrossRef] [PubMed]
  33. Culicov, O.A.; Yurukova, L. Comparison of element accumulation of different moss-and lichen-bags, exposed in the city of Sofia (Bulgaria). J. Atmos. Chem. 2006, 55, 1–12. [Google Scholar] [CrossRef]
  34. Cristina, R.; Sara, B.; Rossano, B.; Romane, D.; Marco, B. Macrophyte growth forms and hydrological connectivity affect greenhouse gas concentration in small eutrophic wetlands. Aquat. Bot. 2023, 188, ttps. [Google Scholar]
  35. Karatayev, A.; Burlakova, L.; Karatayev, V.; Padilla, D. Introduction, distribution, spread, and impacts of exotic freshwater gastropods in Texas. Hydrobiologia 2009, 619, 181–194. [Google Scholar] [CrossRef]
  36. Shang, J.; Zhang, L.; Shi, C.; Fan, C. Influence of Chironomid Larvae on oxygen and nitrogen fluxes across the sediment-water interface (Lake Taihu, China). J. Environ. Sci. 2013, 25, 978–985. [Google Scholar] [CrossRef]
  37. Balushkina, E. Assessment of the Neva Estuary ecosystem state on the basis of structural characteristics of benthic animal communities in 1994–2005. Inland Water Biol. 2009, 2, 355–363. [Google Scholar] [CrossRef]
  38. MacArthur, R. Fluctuations of animal populations and a measure of community stability. Ecology 1955, 36, 533–536. [Google Scholar] [CrossRef]
  39. Richardson, D.; Elton, C.S. 1958: The ecology of invasions by animals and plants. London: Methuen. Prog. Phys. Geogr. 2007, 31, 659–666. [Google Scholar] [CrossRef]
  40. Tilman, D. The ecological consequences of changes in biodiversity: A search for general principles. Ecology 1999, 80, 1455–1474. [Google Scholar] [CrossRef]
  41. Yachi, S.; Loreau, M. Biodiversity and ecosystem productivity in a fluctuating environment: The insurance hypothesis. Proc. Natl. Acad. Sci. USA 1999, 96, 1463–1468. [Google Scholar] [CrossRef] [PubMed]
  42. Schippers, P.; Joenje, W. Modelling the effect of fertiliser, mowing, disturbance and width on the biodiversity of plant communities of field boundaries. Agric. Ecosyst. Environ. 2002, 93, 351–365. [Google Scholar] [CrossRef]
  43. Dong, B.; Wang, G.; Yu, H. Oxygen, pH, and Eh microprofiles around submerged macrophyte Vallisneria natans response to growing stages. IOP Conf. Ser. Earth Environ. Sci. 2017, 82, 012026. [Google Scholar] [CrossRef]
  44. Li, W.; Xufa, M.; Jun, C. Do submerged macrophyte species influence crustacean zooplankton functional group richness and their resource use efficiency in the low-light environment? Front. Plant Sci. 2023, 14, 1185947. [Google Scholar]
  45. Guo, Y.; Xie, H.; Zhang, J.; Wang, W.; Ngo, H.; Guo, W.; Kang, Y.; Zhang, B. Improving nutrient removal performance of surface flow constructed wetlands in winter using hardy submerged plant-benthic fauna systems. RSC Adv. 2018, 42179–42188. [Google Scholar] [CrossRef]
Figure 1. Schematic diagram of the microcosm. (a) The top view represents 3 plant species richness and 7 species compositions with the C. chinensis system, white squares represent microcosms without C. chinensis, black squares represent microcosms with C. chinensis, and different letters represent different plants—a, Vallisneria natans; b, Acorus calamus; c, Pistia stratiotes. (b) Cross-sectional schematic diagram of the system, with plants from left to right being Acorus calamus, Vallisneria natans, and Pistia stratiotes; the substrate from bottom to top is gravel, coarse sand, and fine sand.
Sustainability 16 09492 g001
Figure 2. The effect of the species richness and species composition on the effluent N concentration. (a,b) NO3-N; (c,d) NH4+-N; (e,f) TIN. Grey represents systems without C. chinensis, blue represents systems with C. chinensis; all values are means, and error bars represent standard errors. Vn, V. natans; Ac, A. calamus; Ps, P. stratiotes; Vn + AC, V. natans + A. calamus; Vn + Ps, V. natans + P. stratiotes; Ps + AC, P. stratiotes + A. calamus; Vn + AC + Ps, V. natans + A. calamus + P. stratiotes. The different letters at the top of the bar chart indicate significant differences among monocultures (p < 0.05). The P in the top-right corner of (af) represents the significance of the differences between the richness levels or compositions, and the P in the top-left corner of (b,d,f) represents the significance of the differences among the monocultures.
Sustainability 16 09492 g002
Figure 3. The change in the effluent N concentration across the experimental running time. (a) Systems without C. chinensis; (b) systems with C. chinensis.
Sustainability 16 09492 g003
Figure 4. The effect of the species richness and composition on the coefficient of variation of the effluent N concentration. (a,b) NO3-N; (c,d) NH4+-N; (e,f) TIN. Grey represents systems without C. chinensis, blue represents systems with C. chinensis; all values are means, and error bars represent standard errors. Vn, V. natans; Ac, A. calamus; Ps, P. stratiotes; Vn + AC, V. natans + A. calamus; Vn + Ps, V. natans + P. stratiotes; Ps + AC, P. stratiotes + A. calamus; Vn + AC + Ps, V. natans + A. calamus + P. stratiotes. The different letters at the top of the bar chart indicate significant differences among the monocultures (p < 0.05). The P in the top-right corner of (af) represents the significance of the differences between the richness levels or compositions, and the P in the top-left corner of (b,d,f) represents the significance of the differences among the monocultures. The dashed and solid line represents the regression line between the plant species richness and the coefficient of variation of NO3-N in systems without or with C. chinensis. The asterisk represents a significant difference between the systems with and without C. chinensis (p < 0.05).
Sustainability 16 09492 g004
Figure 5. The effect of the species richness and composition on the substrate N concentrations. (a,b) NO3-N; (c,d) NH4+-N; (e,f) TIN. Grey represents systems without C. chinensis, blue represents systems with C. chinensi; all values are means, and error bars represent standard errors. Vn, V. natans; Ac, A. calamus; Ps, P. stratiotes; Vn + AC, V. natans + A. calamus; Vn + Ps, V. natans + P. stratiotes; Ps + AC, P. stratiotes + A. calamus; Vn + AC + Ps, V. natans + A. calamus + P. stratiotes. The different letters at the top of the bar chart indicate significant differences among the monocultures (p < 0.05). The P in the top-right corner of (af) represents the significance of the differences between the richness levels or compositions. The P in the top-left corner of (b,d,f) represents the significance of the differences among the monocultures. The dashed and solid line represents the regression line between the plant species richness and the substrate concentration of NH4+-N in systems without or with C. chinensis. The asterisk represents a significant difference between the systems with and without C. chinensis (p < 0.05).
Sustainability 16 09492 g005
Figure 6. The effect of the plant species richness (a) and composition (b) on the plant total biomass. Grey represents systems without C. chinensis, blue represents systems with C. chinensis; all values are means, and error bars represent standard errors. Vn, V. natans; Ac, A. calamus; Ps, P. stratiotes; Vn + AC, V. natans + A. calamus; Vn + Ps, V. natans + P. stratiotes; Ps + AC, P. stratiotes + A. calamus; Vn + AC + Ps, V. natans + A. calamus + P. stratiotes. The different letters at the top of the bar chart indicate significant differences among monocultures (p < 0.05); P represents the significance of the differences between the richness levels or compositions. The asterisk represents a significant difference between the systems with and without C. chinensis (p < 0.05).
Sustainability 16 09492 g006
Table 1. The effect of the species identity on the effluent N concentration (mg L−1).
V. natansA. calamusP. stratiotes
PresenceAbsencePresenceAbsencePresenceAbsence
(a)
TIN11.080 ± 0.97411.590 ± 0.73011.386 ± 0.94511.181 ± 0.81411.477 ± 0.80611.060 ± 0.954
NO3-N5.583 ± 0.9135.716 ± 1.0785.393 ± 0.8035.969 ± 1.1116.147 ± 0.810 **4.965 ± 0.782
NH4+ -N5.496 ± 0.9885.873 ± 1.1315.992 ± 1.0755.212 ± 0.8795.330 ± 0.8986.095 ± 1.119
(b)
TIN10.811 ± 1.05611.666 ± 0.91811.121 ± 1.03811.253 ± 1.05611.271 ± 0.80611.053 ± 1.093
NO3-N5.708 ± 0.4766.013 ± 0.7865.656 ± 0.4616.082 ± 0.4676.094 ± 0.810 *5.498 ± 0.283
NH4+ -N5.103 ± 0.9015.652 ± 0.8465.464 ± 1.0155.171 ± 0.9015.176 ± 0.8985.554 ± 1.060
Note: (a) systems without C. chinensis; (b) systems with C. chinensis; values are expressed as mean ± standard error, and significant differences between species identities are indicated in bold; * p < 0.05, ** p < 0.01.
Table 2. The effect of the species identity on the coefficient of variation of the effluent N concentration.
V. natansA. calamusP. stratiotes
PresenceAbsencePresenceAbsencePresenceAbsence
(a)
TIN0.253 ± 0.052 **0.318 ± 0.0330.301 ± 0.0480.254 ± 0.0520.288 ± 0.0440.272 ± 0.066
NO3-N0.319 ± 0.0680.332 ± 0.0740.344 ± 0.0790.299 ± 0.0470.304 ± 0.0660.352 ± 0.068
NH4+ -N0.447 ± 0.0930.550 ± 0.1440.522 ± 0.1480.450 ± 0.0790.475 ± 0.1020.513 ± 0.154
(b)
TIN0.308 ± 0.0560.307 ± 0.0540.316 ± 0.0540.297 ± 0.0560.322 ± 0.0470.289 ± 0.049
NO3-N0.298 ± 0.055 **0.206 ± 0.0690.344 ± 0.0680.299 ± 0.0550.291 ± 0.0540.314 ± 0.061
NH4+ -N0.517 ± 0.0730.508 ± 0.0820.522 ± 0.0890.450 ± 0.0730.526 ± 0.0720.496 ± 0.086
Note: (a) systems without C. chinensis; (b) systems with C. chinensis; values are presented as mean ± standard error, and significant differences among species identities are highlighted in bold; ** p < 0.01.
Table 3. The effect of the species identity on the substrate N concentration (mg g−1).
V. natansA. calamusP. stratiotes
PresenceAbsencePresenceAbsencePresenceAbsence
(a)
TIN1.379 ± 0.1001.299 ± 0.1201.481 ± 0.1071.286 ± 0.0771.409 ± 0.1091.299 ± 0.074
NO3-N1.256 ± 0.1281.235 ± 0.1481.346 ± 0.1081.115 ± 0.1651.173 ± 0.1381.346 ± 0.368
NH4+-N2.248 ± 0.1682.039 ± 0.1312.218 ± 0.1602.079 ± 0.1542.328 ± 0.107 *1.932 ± 0.200
biomass15.759 ± 0.82215.800 ± 2.13120.586 ± 1.2509.363 ± 1.17311.232 ± 0.75821.836 ± 1.974
(b)
TIN1.306 ± 0.1001.327 ± 0.1201.464 ± 0.1281.312 ± 0.0971.451 ± 0.1081.224 ± 0.064
NO3-N1.388 ± 0.104 *1.080 ± 0.1831.150 ± 0.0781.267 ± 0.1381.156 ± 0.0741.389 ± 0.143
NH4+-N2.158 ± 0.1371.982 ± 0.1782.292 ± 0.1161.944 ± 0.1582.304 ± 0.138 *1.928 ± 0.115
biomass14.463 ± 0.85217.298 ± 2.38820.602 ± 1.4959.113 ± 1.0159.702 ± 0.64723.645 ± 2.231
Note: (a) systems without C. chinensis; (b) systems with C. chinensis; values are presented as mean ± standard error, and significant differences among species identities are highlighted in bold; * p < 0.05.
Disclaimer/Publisher’s Note: The statements, opinions and data contained in all publications are solely those of the individual author(s) and contributor(s) and not of MDPI and/or the editor(s). MDPI and/or the editor(s) disclaim responsibility for any injury to people or property resulting from any ideas, methods, instructions or products referred to in the content.

