Abstract
This research focuses on developing an innovative platform to manage carbon footprint data related to office activities and monitor green spaces, integrating geoinformatics and machine learning technologies. The platform addresses the lack of automated systems for tracking carbon emissions, particularly in high paper consumption environments, such as those involving printing and photocopying. Additionally, it monitors green spaces within corporate settings, an aspect often overlooked in existing systems. The study demonstrates the platform’s capability to automate carbon footprint calculations and provide accurate assessments of green areas, achieving a high accuracy rate of 96.22% and a Kappa coefficient of 0.92. The results confirm the platform’s ability to deliver both comprehensive and granular environmental insights, supporting decision making for more sustainable office environments. The key novelty of this study lies in the integration of real-time data capture with geoinformatics and machine learning to efficiently track both carbon footprints and green spaces. This approach offers a practical solution to a gap in environmental data management in office settings, enabling organizations to align their practices with sustainability goals. The platform’s precise, automated system contributes significantly to the development of eco-friendly workplaces, highlighting its academic and practical value in the field of environmental sustainability.
1. Introduction
Countries across the globe are confronting critical challenges posed by climate change, global warming [1,2,3], environmental degradation [4,5,6], and unsustainable resource and energy consumption [7,8,9]. These issues not only affect environmental conditions but also have significant implications for the health and well-being of individuals, including employees within organizations [10,11]. In response, many nations have implemented policies and measures centered on prevention, mitigation, and monitoring, with an emphasis on achieving sustainable development goals (SDGs) and promoting environmental conservation [12,13,14]. One key area of focus for organizations is the concept of the green office, which aims to reduce costs, foster employee engagement, mitigate global warming, and improve overall organizational well-being [15,16,17]. Transitioning to a green office typically involves initiatives such as energy management, green space optimization, and the adoption of paperless operations [18,19,20,21,22]. However, a review of the relevant literature reveals that, despite widespread implementation of green office strategies, there is still a significant lack of real-time data recording and comprehensive data management platforms. This absence impedes real-time analysis, limiting the ability to identify problems and implement continuous improvements.
Research findings regarding green office practices and green space management have been well-documented, with studies employing various methodologies such as surveys and organizational assessments of green office adoption [23,24]. Common challenges identified include budget constraints, lack of awareness, and insufficient technical expertise. Nevertheless, green office initiatives have demonstrated clear benefits, such as reduced energy consumption, lower carbon emissions, and decreased waste, all of which promote environmental sustainability. These initiatives also promote behavioral changes in work practices, encouraging the conservation of natural resources and fostering environmental awareness [25]. Additionally, integrating green plants into office environments has been shown to positively affect employees’ physical and mental well-being, ultimately improving work efficiency. Despite these advantages, organizations promoting green offices have primarily focused on paperless initiatives, such as the use of digital files to replace paper, in efforts to become green organizations or green universities [26,27,28,29,30]. Studies have demonstrated that paperless practices significantly reduce water consumption and are more effective at mitigating global warming compared to practices involving traditional paper use [28]. Moreover, such practices contribute to reducing deforestation and pollution, aligning with sustainability development goals [29,30]. However, the development of platforms or applications that manage information related to paperless initiatives and green office practices remains limited. Existing applications often focus on waste management strategies but lack automation and real-time data management features [27]. A mobile application was developed to provide green office management insights and analyze paper usage, but it is limited to the Android operating system and requires the manual input of printing data. While the application presents paper usage data and costs through a dashboard, it lacks features such as automatic data retrieval from printer databases and individual user tracking, thus limiting its effectiveness in monitoring paper usage [31]. Additionally, no existing application has the capability to calculate the carbon footprint from paper usage in printing and photocopying, which hinders efforts to reduce an organization’s carbon footprint.
Research on green area analysis has extensively utilized satellite image processing and UAV imagery for effective assessments [32,33,34,35,36]. Various methodologies, such as the Normalized Difference Vegetation Index (NDVI) [36], provide reliable measures of vegetation health and greenness. However, a key limitation of these methods is the need for recalibrating threshold values when shifting between study areas. Visual analysis by experts can differentiate between green and non-green areas, but this approach is time-consuming when applied to large regions. ArcGIS has also been used for green area classification through raster calculations, though studies often fail to report the classification accuracy [32]. Machine learning techniques, such as artificial neural networks (ANN), have been applied to classify green areas using Sentinel-2A satellite imagery, achieving high accuracy (94.6%) [35]. Similarly, deep learning algorithms applied to Landsat 8 satellite images have produced an accuracy of 93.50% in real-time classification [35]. Despite these advances, some methods focus solely on presenting greenness values rather than classifying satellite images directly into green areas [34]. Furthermore, studies have explored the relationship between green areas and socioeconomic factors, such as income levels, to provide insights for regional development [36]. Research on the role of green spaces in workplace environments has shown that green spaces reduce stress, improve alertness, and foster creativity, ultimately enhancing well-being, communication, and social relationships in professional settings [37,38,39,40].
Despite these advancements, significant gaps remain in terms of automated, real-time data management systems for tracking both paper usage and carbon footprints, limiting the ability of organizations to effectively monitor and reduce their environmental impacts. Moreover, the lack of platforms that integrate green office practices with green space management represents a critical gap in sustainability efforts. Current solutions often require manual input or recalibration, reducing their efficiency and scalability. To address these limitations, this study proposes the development of a comprehensive platform that integrates geoinformatics, information technology, and machine learning. The platform will manage data related to printing and photocopying, calculate associated carbon footprints, and monitor green spaces within organizational premises. By automating these processes, the platform will enable precise, real-time tracking of carbon emissions, helping organizations align with green office policies and contribute to sustainable development goals. This integrated approach offers a robust solution for managing both carbon footprints and green space metrics, advancing environmental sustainability within organizations. The hypothesis of this study is that integrating real-time data from office activities, such as printing and photocopying, with machine learning and GIS technologies will enable accurate and automated carbon footprint calculations. The visualization of these data will enhance organizational decision making for sustainability goals.
2. Research Methodology
This research introduces the development of a platform or application designed to manage carbon footprint data derived from printing and photocopying activities within office settings and to analyze green space utilizing satellite and digital imagery. The primary objective is to devise an application that facilitates the advancement towards establishing green office practices and aligning organizational objectives with sustainable development goals. The second objective is to analyze and classify green spaces within organizations and agencies using satellite imagery and digital images, in conjunction with machine learning techniques, through greenness analysis and green space classification. This methodology enables organizations to leverage green space data for strategic planning, facilitating the effective management and expansion of green spaces to reduce the organization’s carbon footprint. The research focuses on the Faculty of Science and Industrial Technology at Prince of Songkla University’s Surat Thani Campus, as delineated in Figure 1. This academic institution operates within the purview of a university-type educational establishment, with a core mission centered on producing graduates equipped to meet labor market demands, conducting research, and providing academic services to society, while also preserving arts and culture. The faculty comprises administrative personnel, faculty members, and operational staff, and the communication methods encompass both digital and paper-based mediums for printing and photocopying. Typically, individual printing volumes are regulated through a quota system per person per annum; however, individuals may request additional print runs upon exhaustion of their quotas. Identified issues include the inability to monitor individual printing volumes over specified timeframes, the lack of real-time tracking for total faculty printing, and the absence of data necessary for calculating the faculty’s or department’s carbon footprint. Detailed research methodologies are explained in Section 2.1, Section 2.2, Section 2.3, Section 2.4 and Section 2.5.
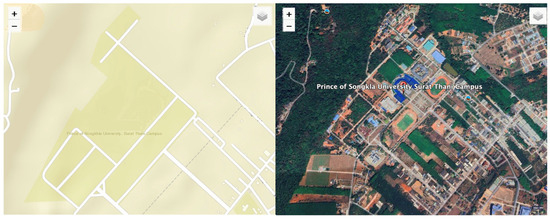
Figure 1.
Study area. Source: Image retrieved using Google Maps API (© Google, accessed on 1 May 2024).
2.1. Proposed Application Platform Architecture
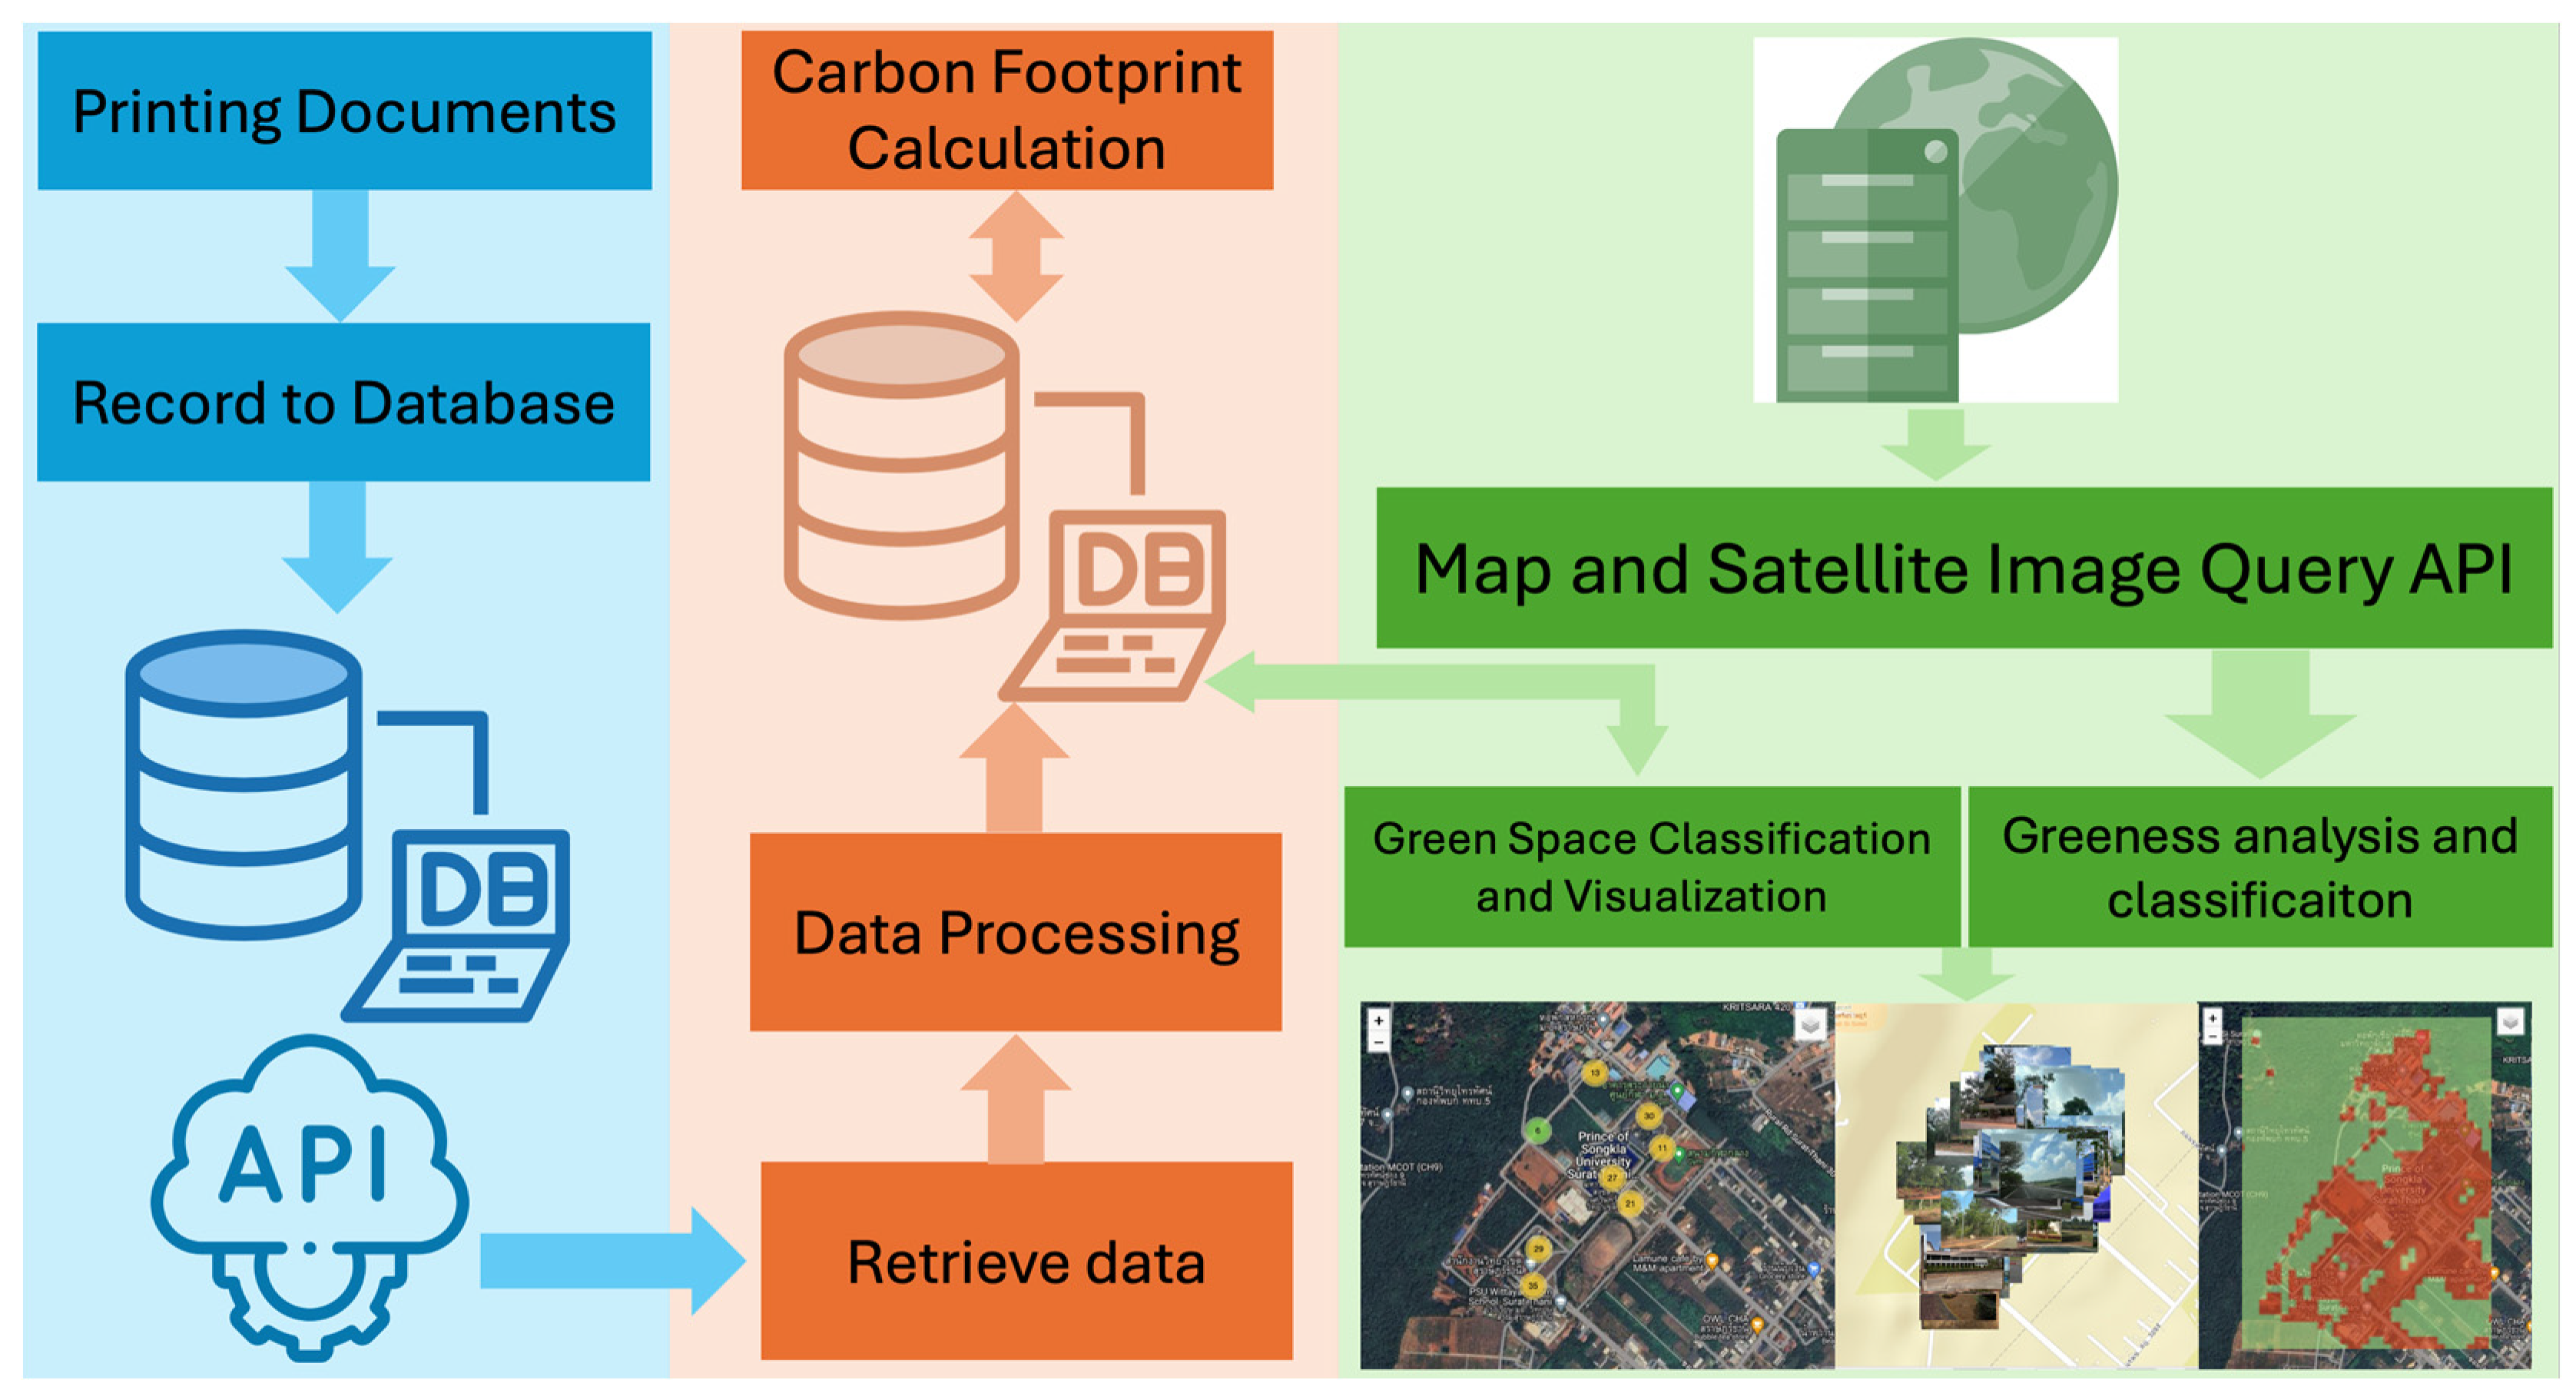
This research has formulated the architectural framework of the system or application, as depicted in Figure 2. The design operates within the current operational context of the faculty office, wherein printer services are accessible via the university’s intranet network, catering to three distinct user groups: lecturers/staff, executives, and administrators. Although individual print and copy counts are logged in a database to monitor yearly quotas, the absence of an application precludes real-time tracking and temporal analysis. Consequently, this study proposes the development of an application to serve all user groups, facilitating data retrieval through an application programming interface (API) for querying and storing information in the green office database. The resultant data are presented to each user group, enabling the tracking of both carbon footprint metrics and green space classifications. Furthermore, the operational details of the developed application or platform are delineated in Figure 3. The workflow comprises three distinct stages: firstly, recording the number of document pages into the database upon user initiation of print jobs; secondly, data retrieval, processing, and subsequent storage within the green office database for carbon footprint calculation and result display; and finally, querying map data and satellite imagery via Google Maps API and Google Earth Engine to analyze green areas within the university. This analysis involves calculating the NDVI and employing machine learning algorithms for green area classification.
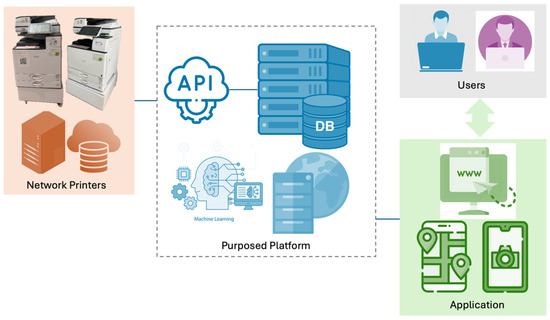
Figure 2.
Proposed application platform architecture.

Figure 3.
Proposed workflow of platform.
2.2. System Analysis and Design
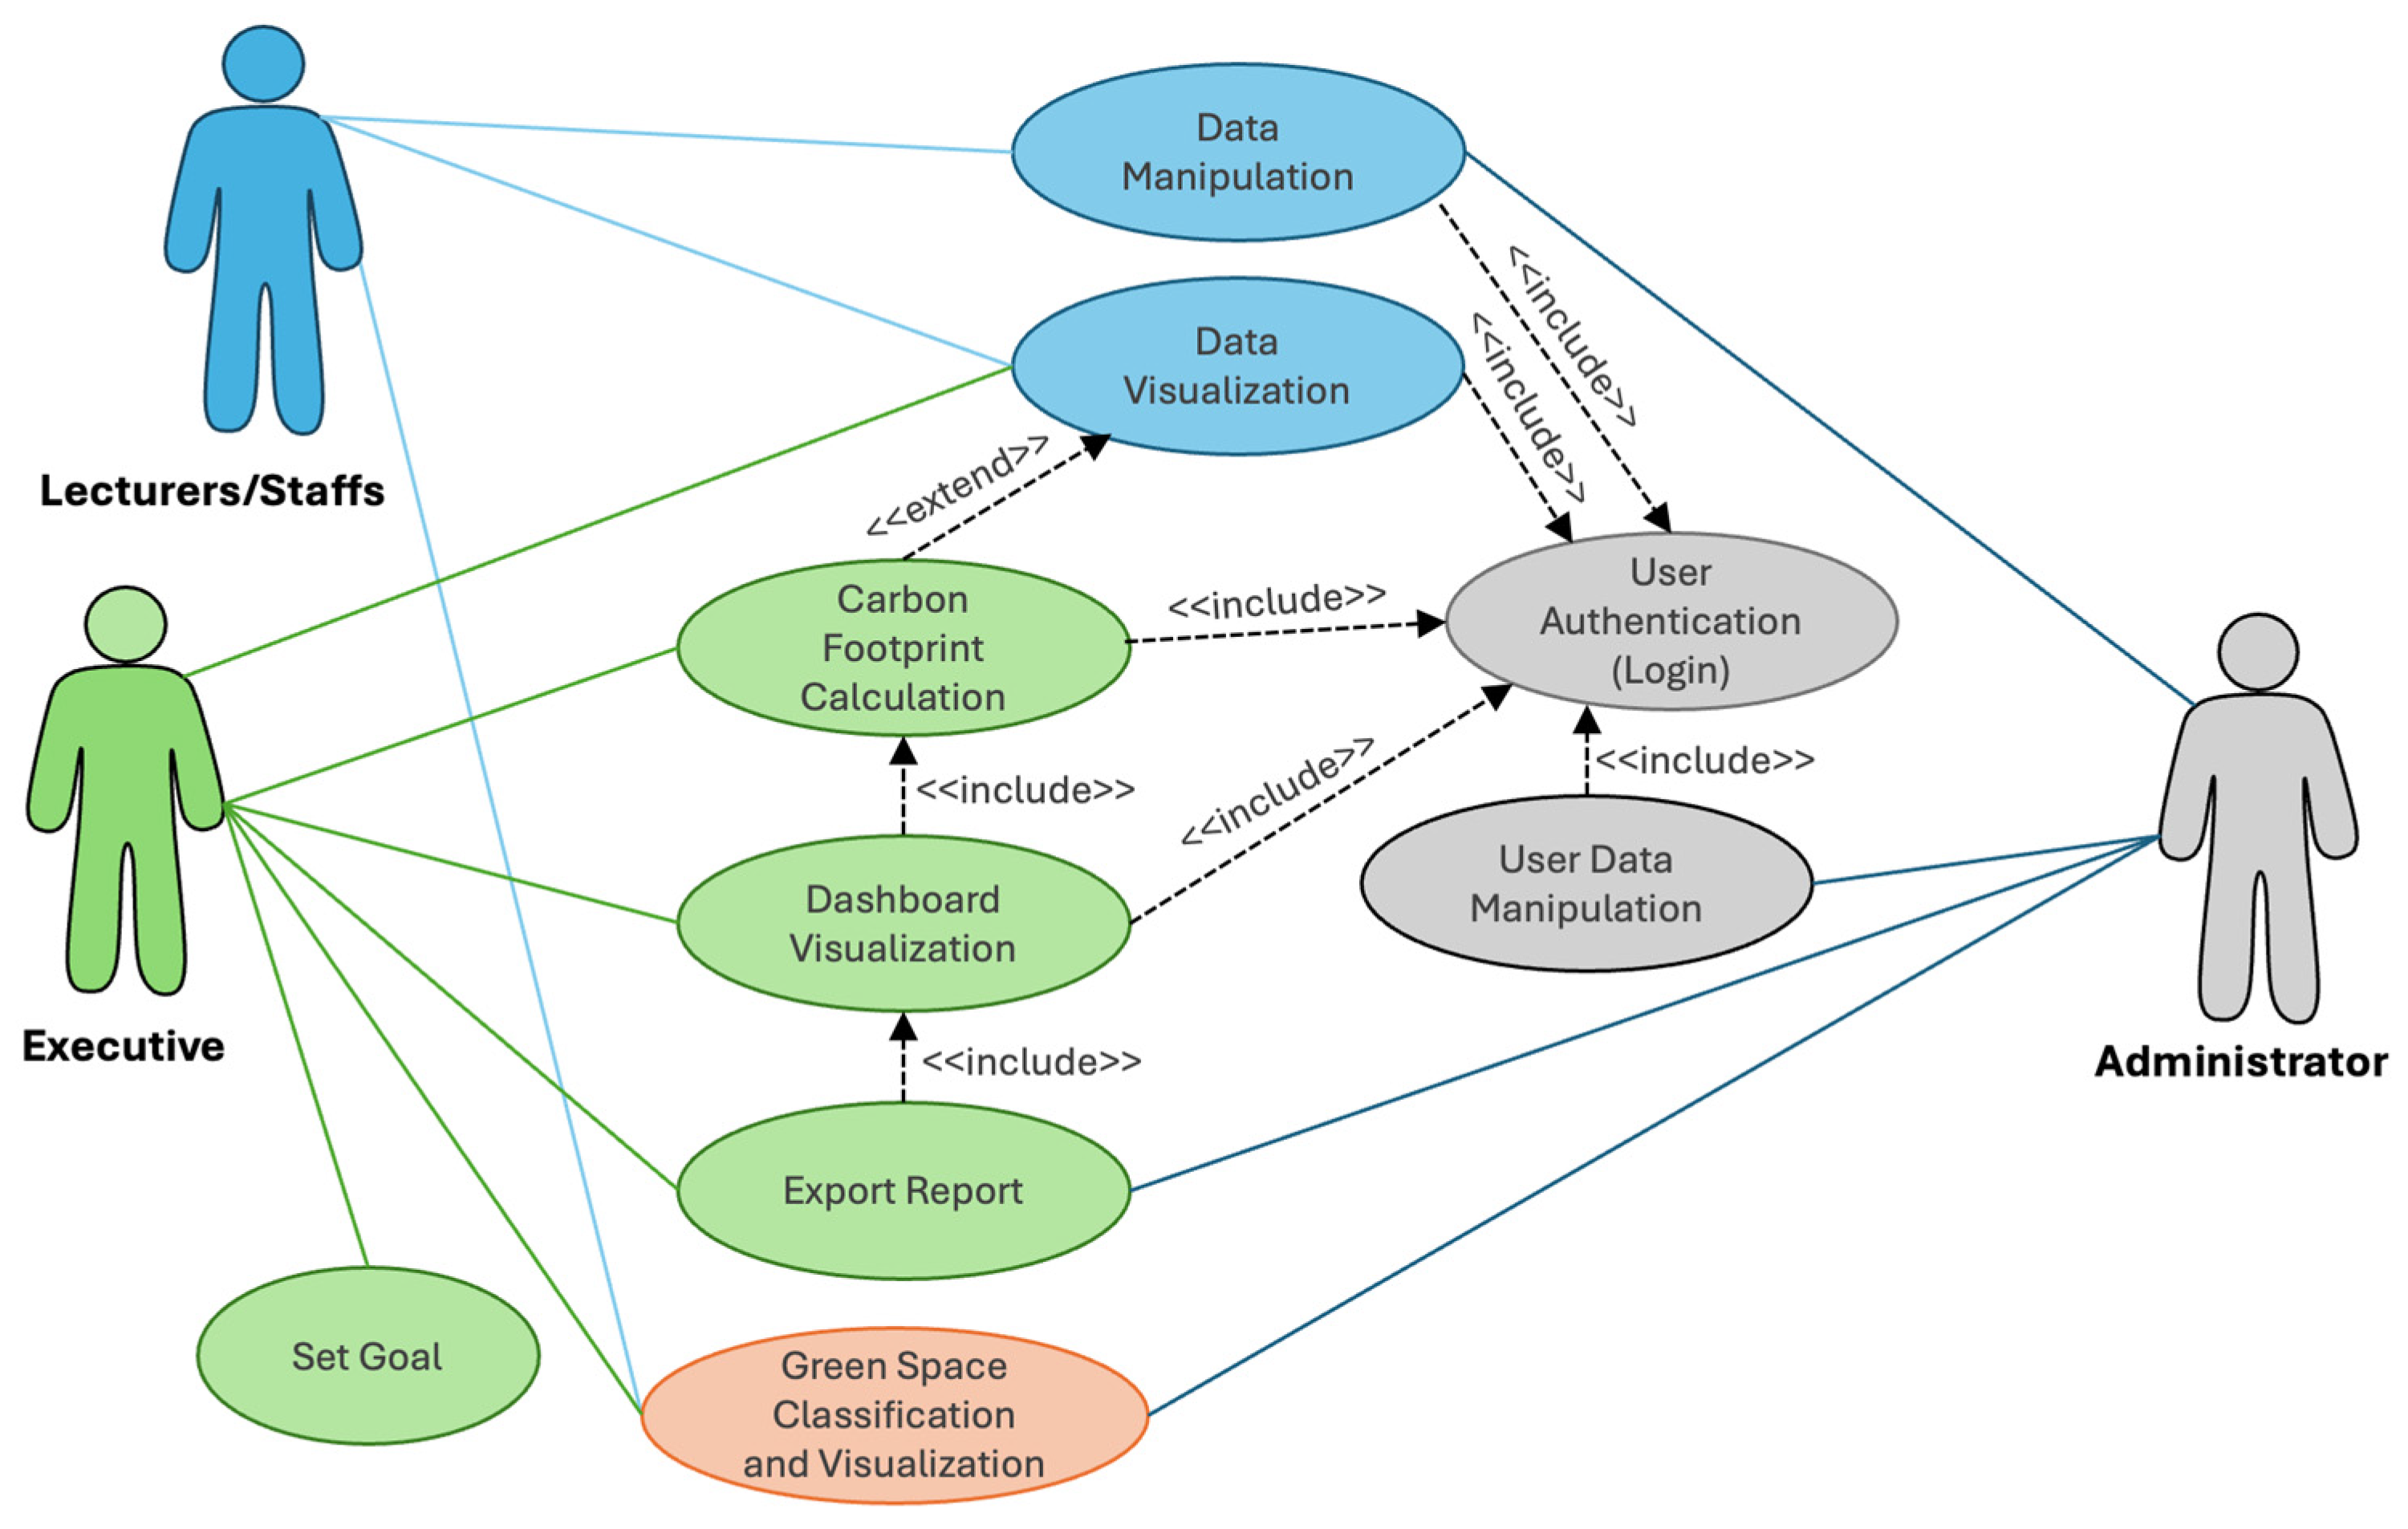
In this research, the results of analyzing and designing a system or application using the use case diagram in Figure 4 are presented. The diagram illustrates three user groups: lecturers/staff, executives, and administrators, each with distinct roles and abilities within the application. Members of the lecturers/staff group can utilize the application to display personal printing and photocopying data for specific time periods but are unable to access others’ data. They also have access to information about green area mapping. Executive users, in addition to viewing individual personnel’s printing and photocopying data within their unit, can track overall information for the entire group through the dashboard. They can export data in the MS Excel format and set carbon footprint usage goals for comparison with actual usage. Administrators can manage user accounts and printing and copying data. They can upload files manually when the API cannot retrieve data automatically for all user groups. Identity verification through the application is required for all three groups.

Figure 4.
Use case diagram.
2.3. Carbon Footprint Calculation and Visualization
In this study, data pertaining to the volume of paper consumed for photocopying and printing were employed to compute the carbon footprint associated with printing activities. Furthermore, carbon footprint calculations were based on data derived from the utilization of electronic documents, aiming to assess the extent to which carbon emissions can be mitigated through the adoption of electronic documents or digital files via the https://docs.psu.ac.th platform(accessed on 1 May 2024).
The platform’s visualization is designed to be intuitive and interactive, making carbon footprint data easy to understand. Users can view real-time results of resource usage and compare them with set targets over time. This capability helps users make informed decisions about their environmental impact and adjust their resource usage behavior as needed.
The application presented in this research currently sets carbon footprint targets on a monthly basis. This time frame was chosen because it strikes a balance between granularity and feasibility in tracking resource consumption patterns. A monthly target allows organizations to monitor their progress regularly without overwhelming users with overly frequent data adjustments, which could occur if shorter intervals, such as weekly or daily periods, were used. Furthermore, a monthly approach provides a clear time frame for evaluating trends, such as seasonal fluctuations in printing and photocopying usage or operational cycles, and makes it easier for decision makers to implement corrective actions or adjust targets accordingly.
The formula for calculating the carbon footprint (CFusage) from black-and-white printing and photocopying is given by the following:
where
CFusage = Number of Pages × Paper Weight × Emission Factorusage
CFusag represents the carbon footprint resulting from black-and-white printing and photocopying.
Number of Pages denotes the total number of sheets of paper used.
Paper Weight is the weight of a single sheet of paper, which, in this research, is set to 0.004375 kg.
Emission Factorusage represents the greenhouse gas emissions associated with printing and photocopying activities. In this study, it is assigned a value of 1.1400 kgCO2e per kg of paper.
More than 95% of office printing and photocopying within the departments at Prince of Songkla University is conducted in black and white, with most printers configured for black-and-white output. Therefore, this research focuses on calculating the carbon footprint exclusively for black-and-white printing and photocopying.
2.4. Greeness Analysis and Green Space Classification
This study analyzes and classifies green areas within the vicinity of Prince of Songkla University, Surat Thani Campus, using Landsat-8 satellite imagery data, in combination with the NDVI. To enhance classification accuracy, machine learning techniques, specifically the support vector machine (SVM) algorithm, are employed. The primary goal is to categorize green spaces into two distinct classes: green space and non-green space, facilitating the presentation of green space data within developed applications for planning, tracking, and analysis purposes.
Additionally, this study explores the relationship between the carbon footprint and the amount of green space within the organizational context, which is essential for sustainability planning. The NDVI is used to analyze and quantify green spaces, providing a clear understanding of the extent of vegetation. However, due to the medium resolution of Landsat-8 imagery, this data is insufficient for detailed monitoring, especially when analyzing green areas near or within buildings. To mitigate this limitation, digital image classification techniques are applied in conjunction with NDVI to obtain more comprehensive data for both outdoor and indoor green spaces. This integrated approach supports more effective organizational planning aimed at reducing the overall carbon footprint.
The SVM algorithm was selected for this research due to its proven effectiveness in high-dimensional data classification and its ability to handle non-linear relationships within datasets. When classifying complex environmental features such as green spaces, where boundaries between categories (e.g., green and non-green areas) may not always be linear, SVM excels using kernel functions. These kernels allow the algorithm to project the data into a higher-dimensional space, enabling it to more easily find the optimal separating hyperplane between the two classes, i.e., green space and non-green space. SVM is particularly well-suited for tasks involving remote sensing data and satellite imagery, such as that obtained from Landsat-8, where the data often includes noise, overlapping spectral features, and non-linearity between classes. SVM has demonstrated strong generalization ability, meaning it performs well, even with limited training data, a common challenge in environmental and land cover classification studies. Moreover, compared to other machine learning algorithms like decision trees or random forests, SVM typically offers superior classification accuracy, especially in binary classification problems like this one. Experimental comparisons in the field show that SVM consistently outperforms other algorithms by achieving higher precision and accuracy in land cover and vegetation classification tasks. This makes SVM the ideal choice for this study, in which high classification accuracy is critical for generating reliable green space data that can be used in sustainability planning, carbon footprint reduction strategies, and effective resource management. Table 1 provides the specific details of the SVM model used in this research.

Table 1.
Model parameter settings.
2.5. System Implementation
The system or application developed in this research adopts a web-based architecture and employs a variety of programming languages and software tools, including PHP 8.3, Python 3.7.9, JavaScript ES13, Google Maps API 3.55.1, Google Earth Engine, MySQL 8.0, and Visual Studio Code 1.85. Furthermore, a green space classification model was established using deep learning techniques, specifically through image processing. This involved training a model to classify images into two distinct categories: green space class and non-green class, utilizing image datasets comprising 300 images per class for training purposes. To assess the model’s performance, an independent set of 172 images per class, totaling 344 images, was utilized for evaluation, ensuring that these images were not included in the training dataset.
2.6. Usability Testing
Usability testing was conducted with 15 participants from three distinct user groups: lecturers/staff, executives, and administrators. These participants were selected to provide diverse perspectives on the platform’s usability across different roles. The evaluation focused on five key dimensions: simplicity and ease of use, font size appropriateness, dashboard clarity and understanding, appropriate data visualization, and system response time. Each participant completed tasks designed to explore the system’s functionalities and subsequently rated their experience using a 5-point Likert scale, where 1 represented the lowest satisfaction and 5 the highest. The feedback was quantitatively collected and used to inform the analysis of usability across these key dimensions. This approach ensured a comprehensive evaluation of the platform’s user interface and functionality across diverse user needs.
3. Results and Discussion
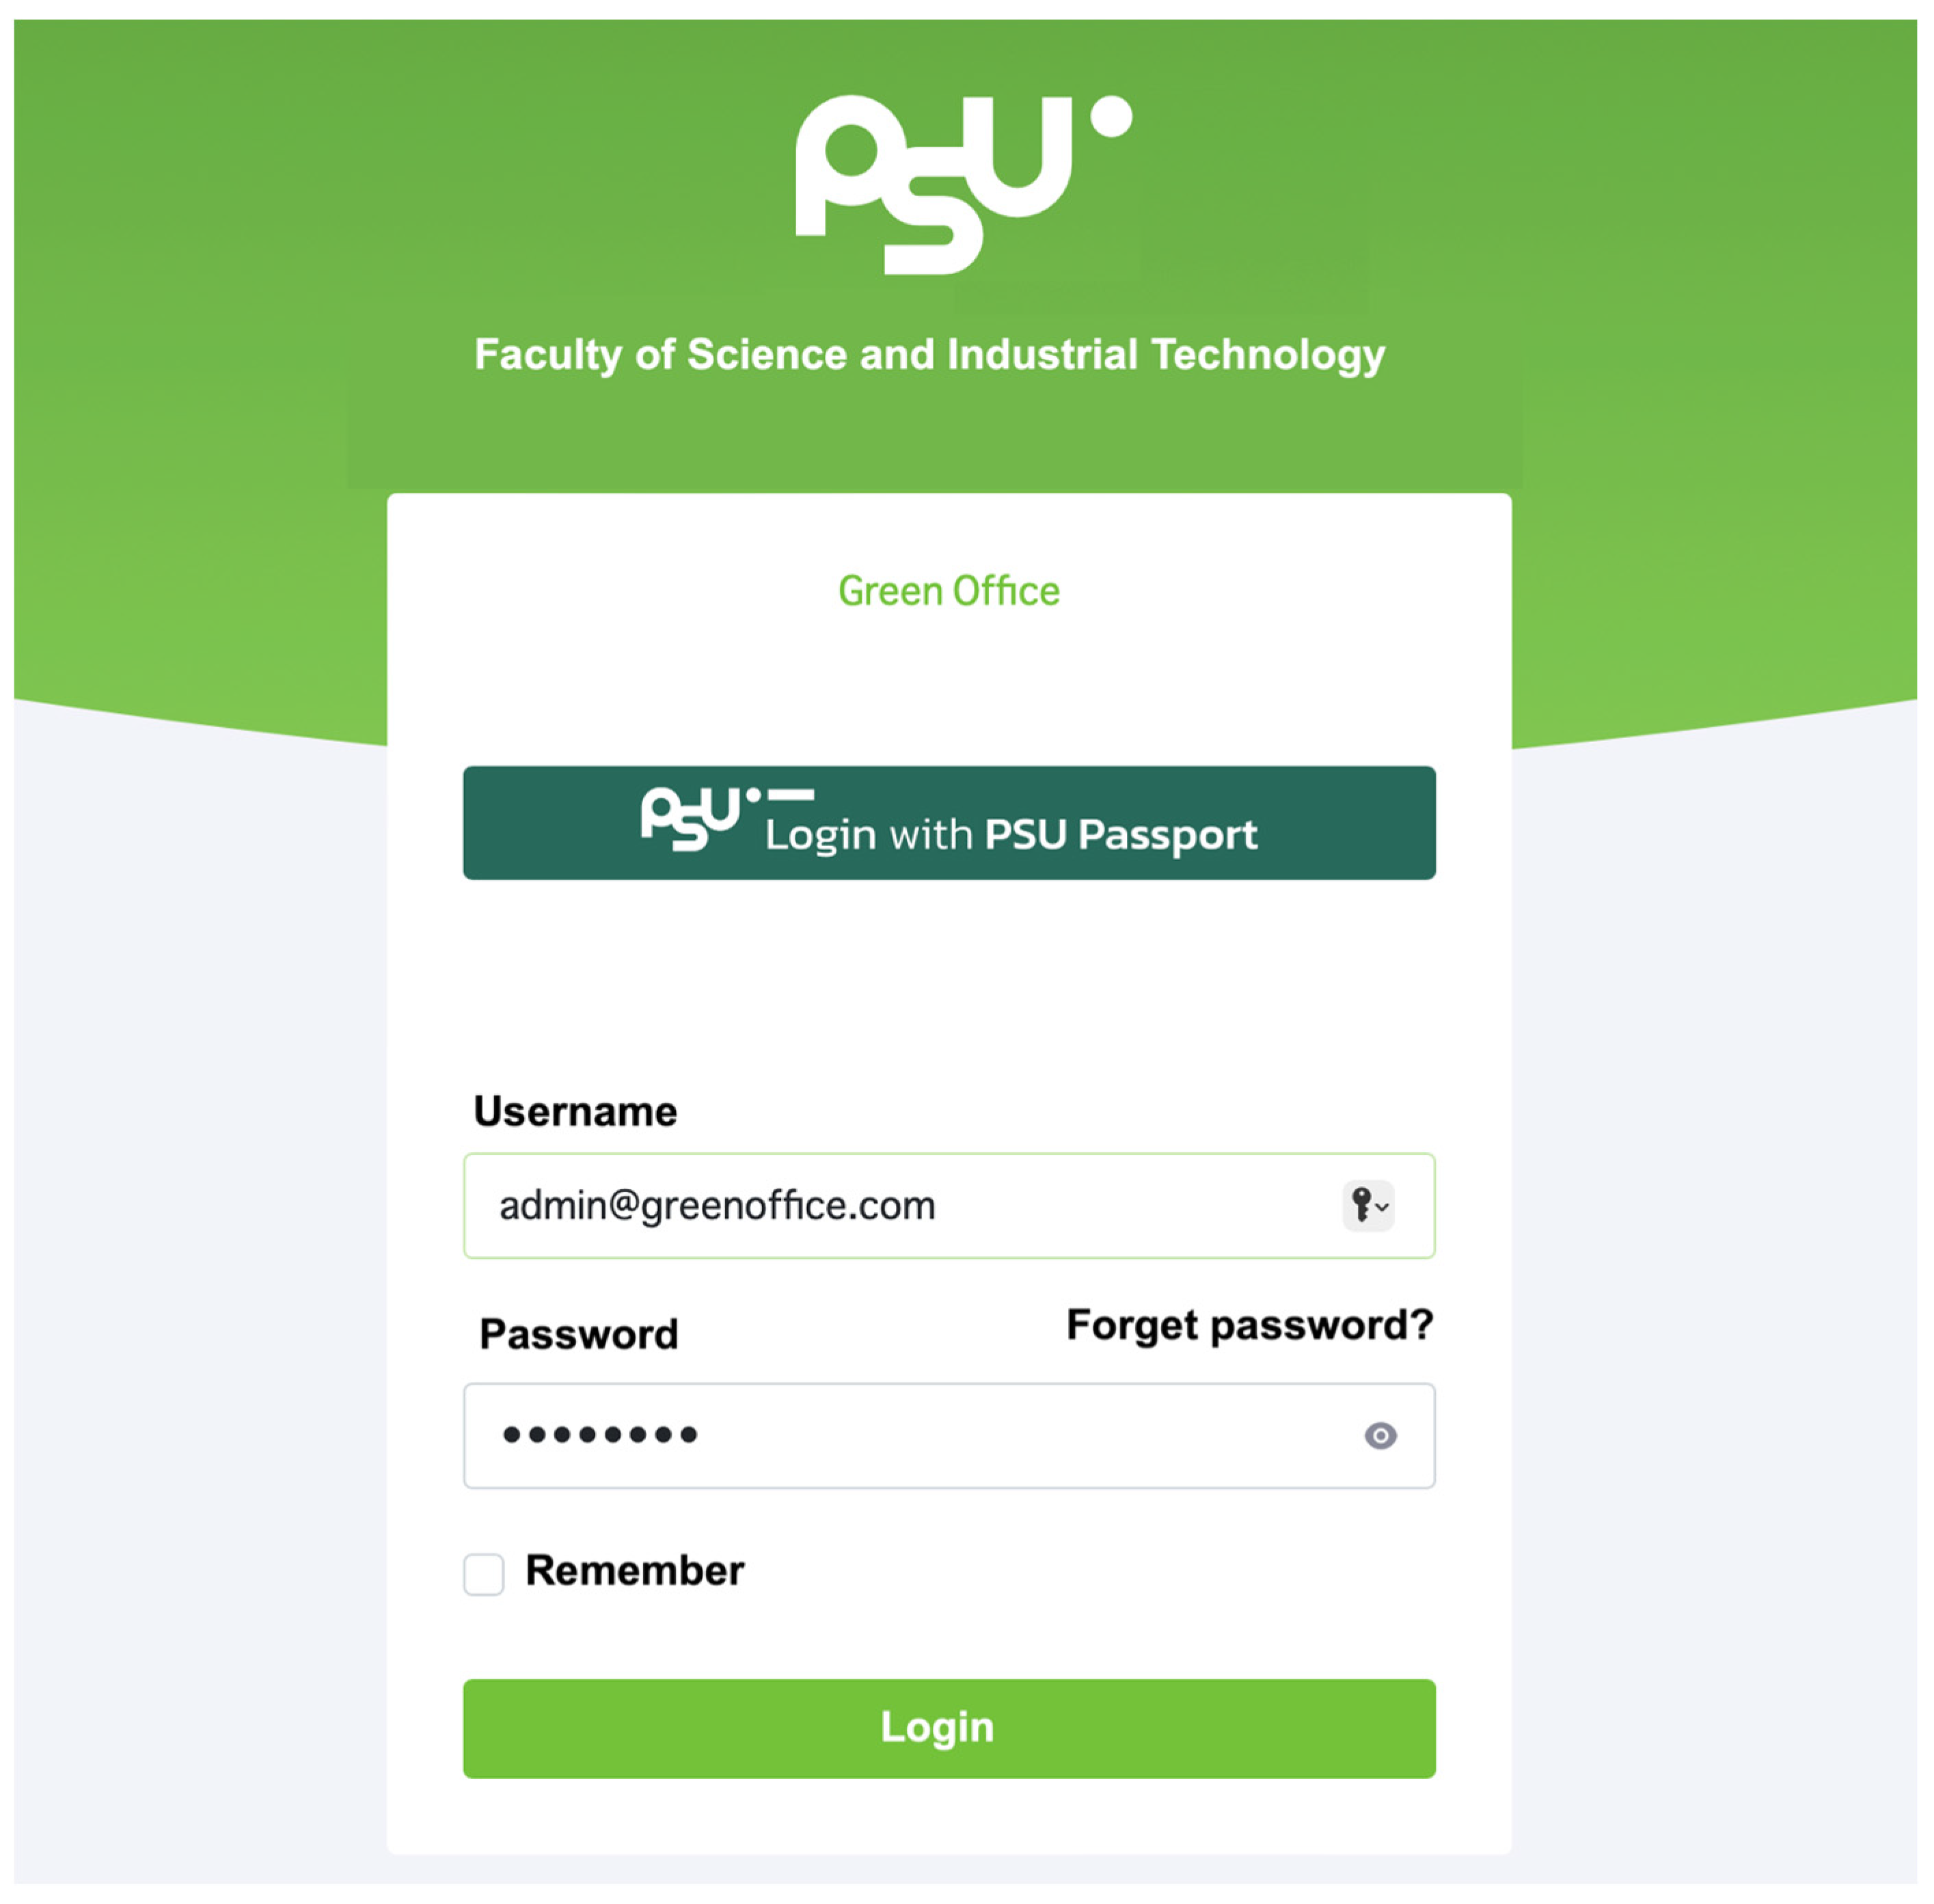
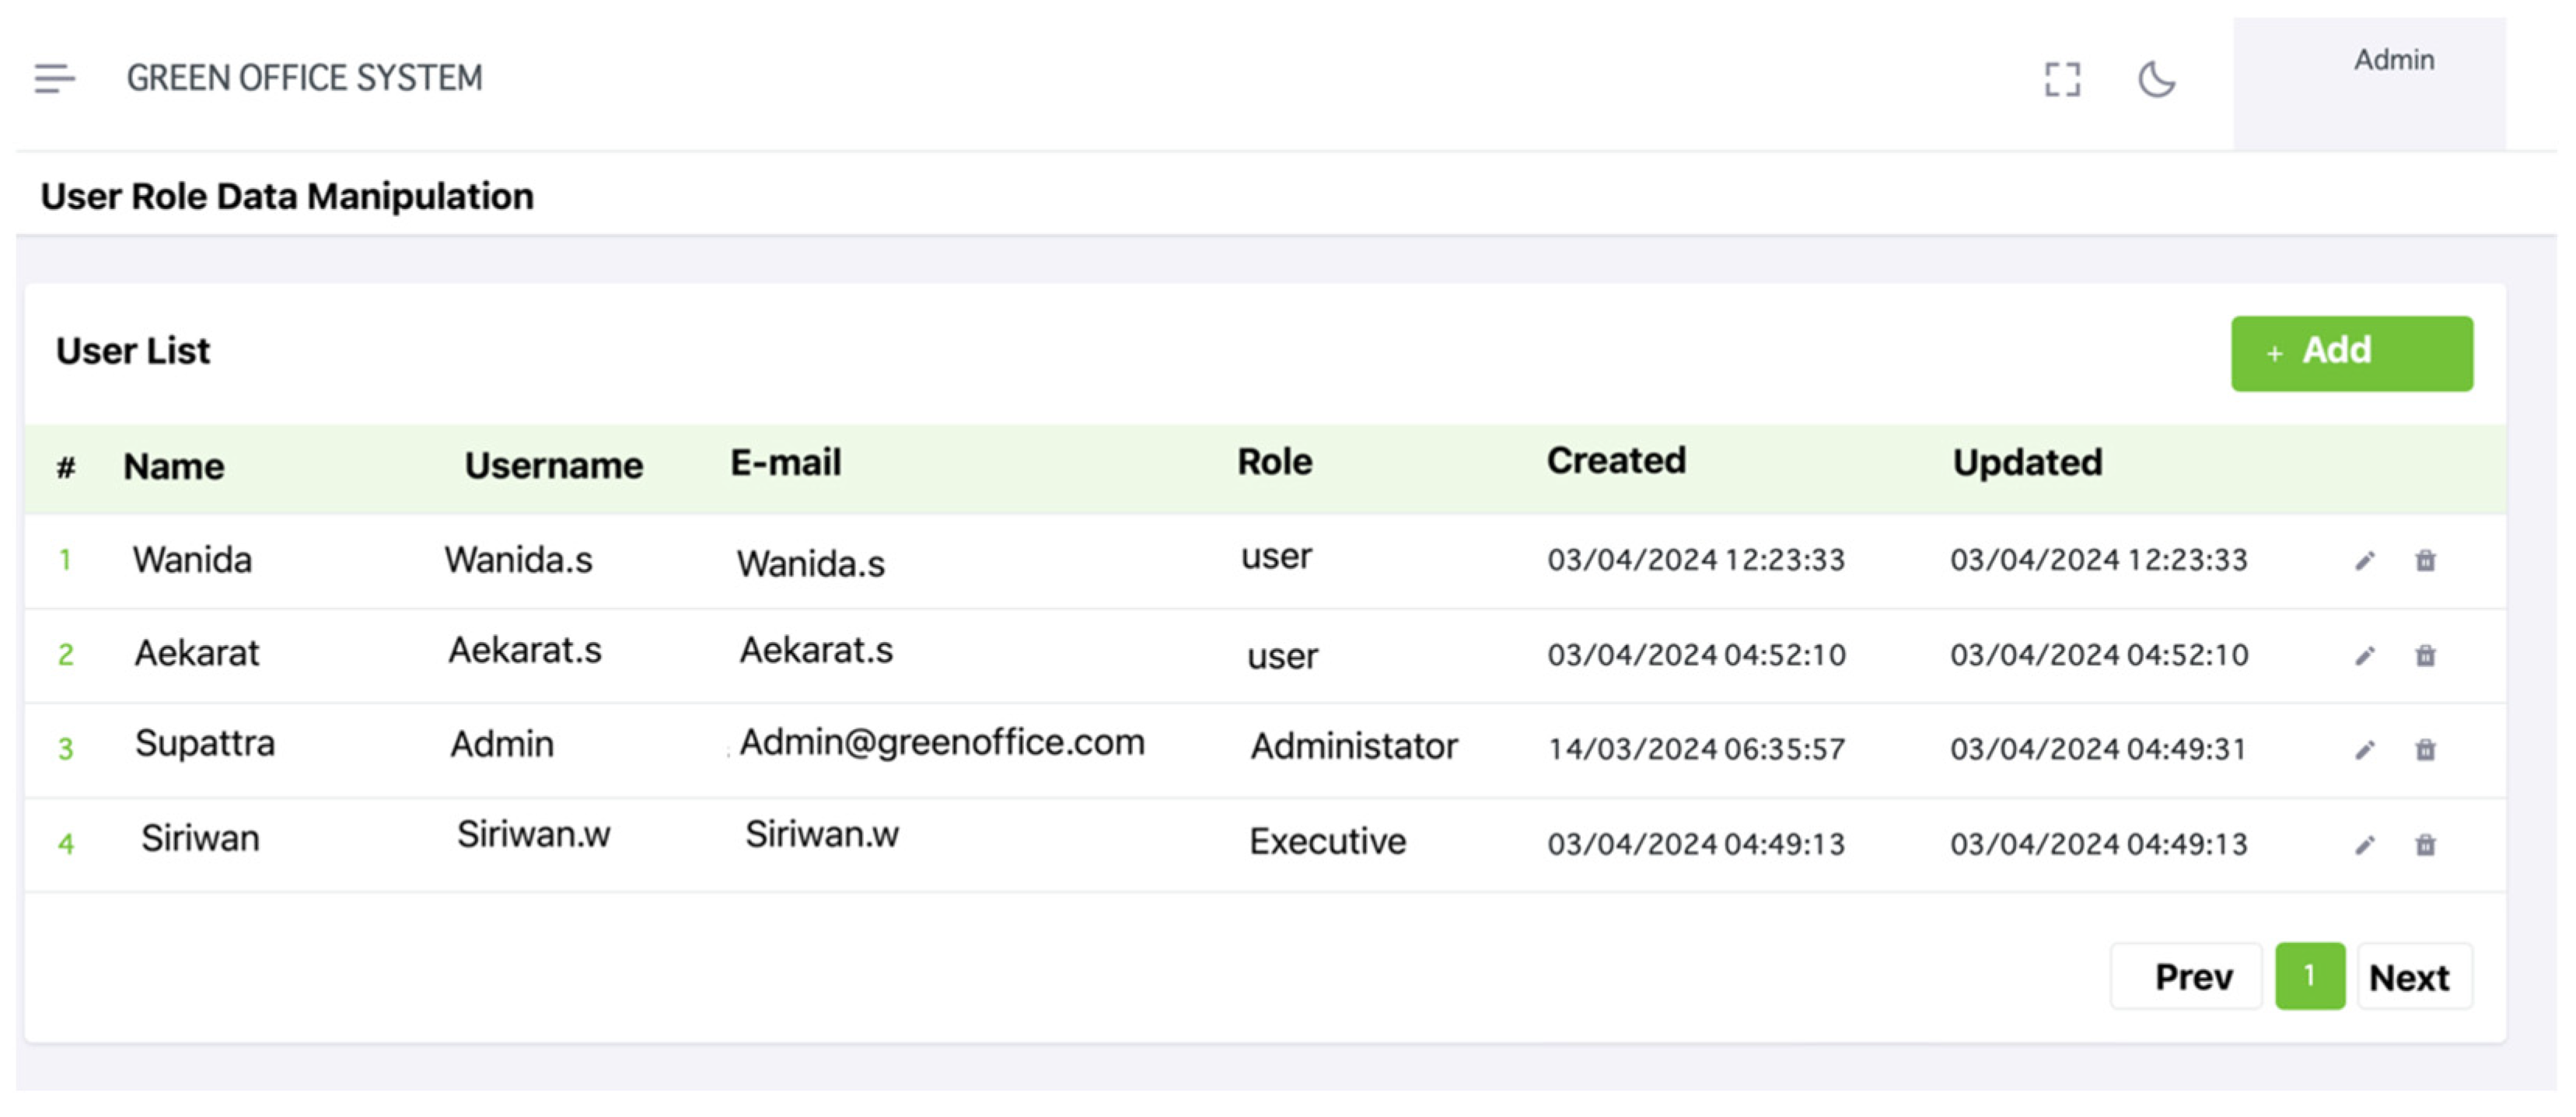
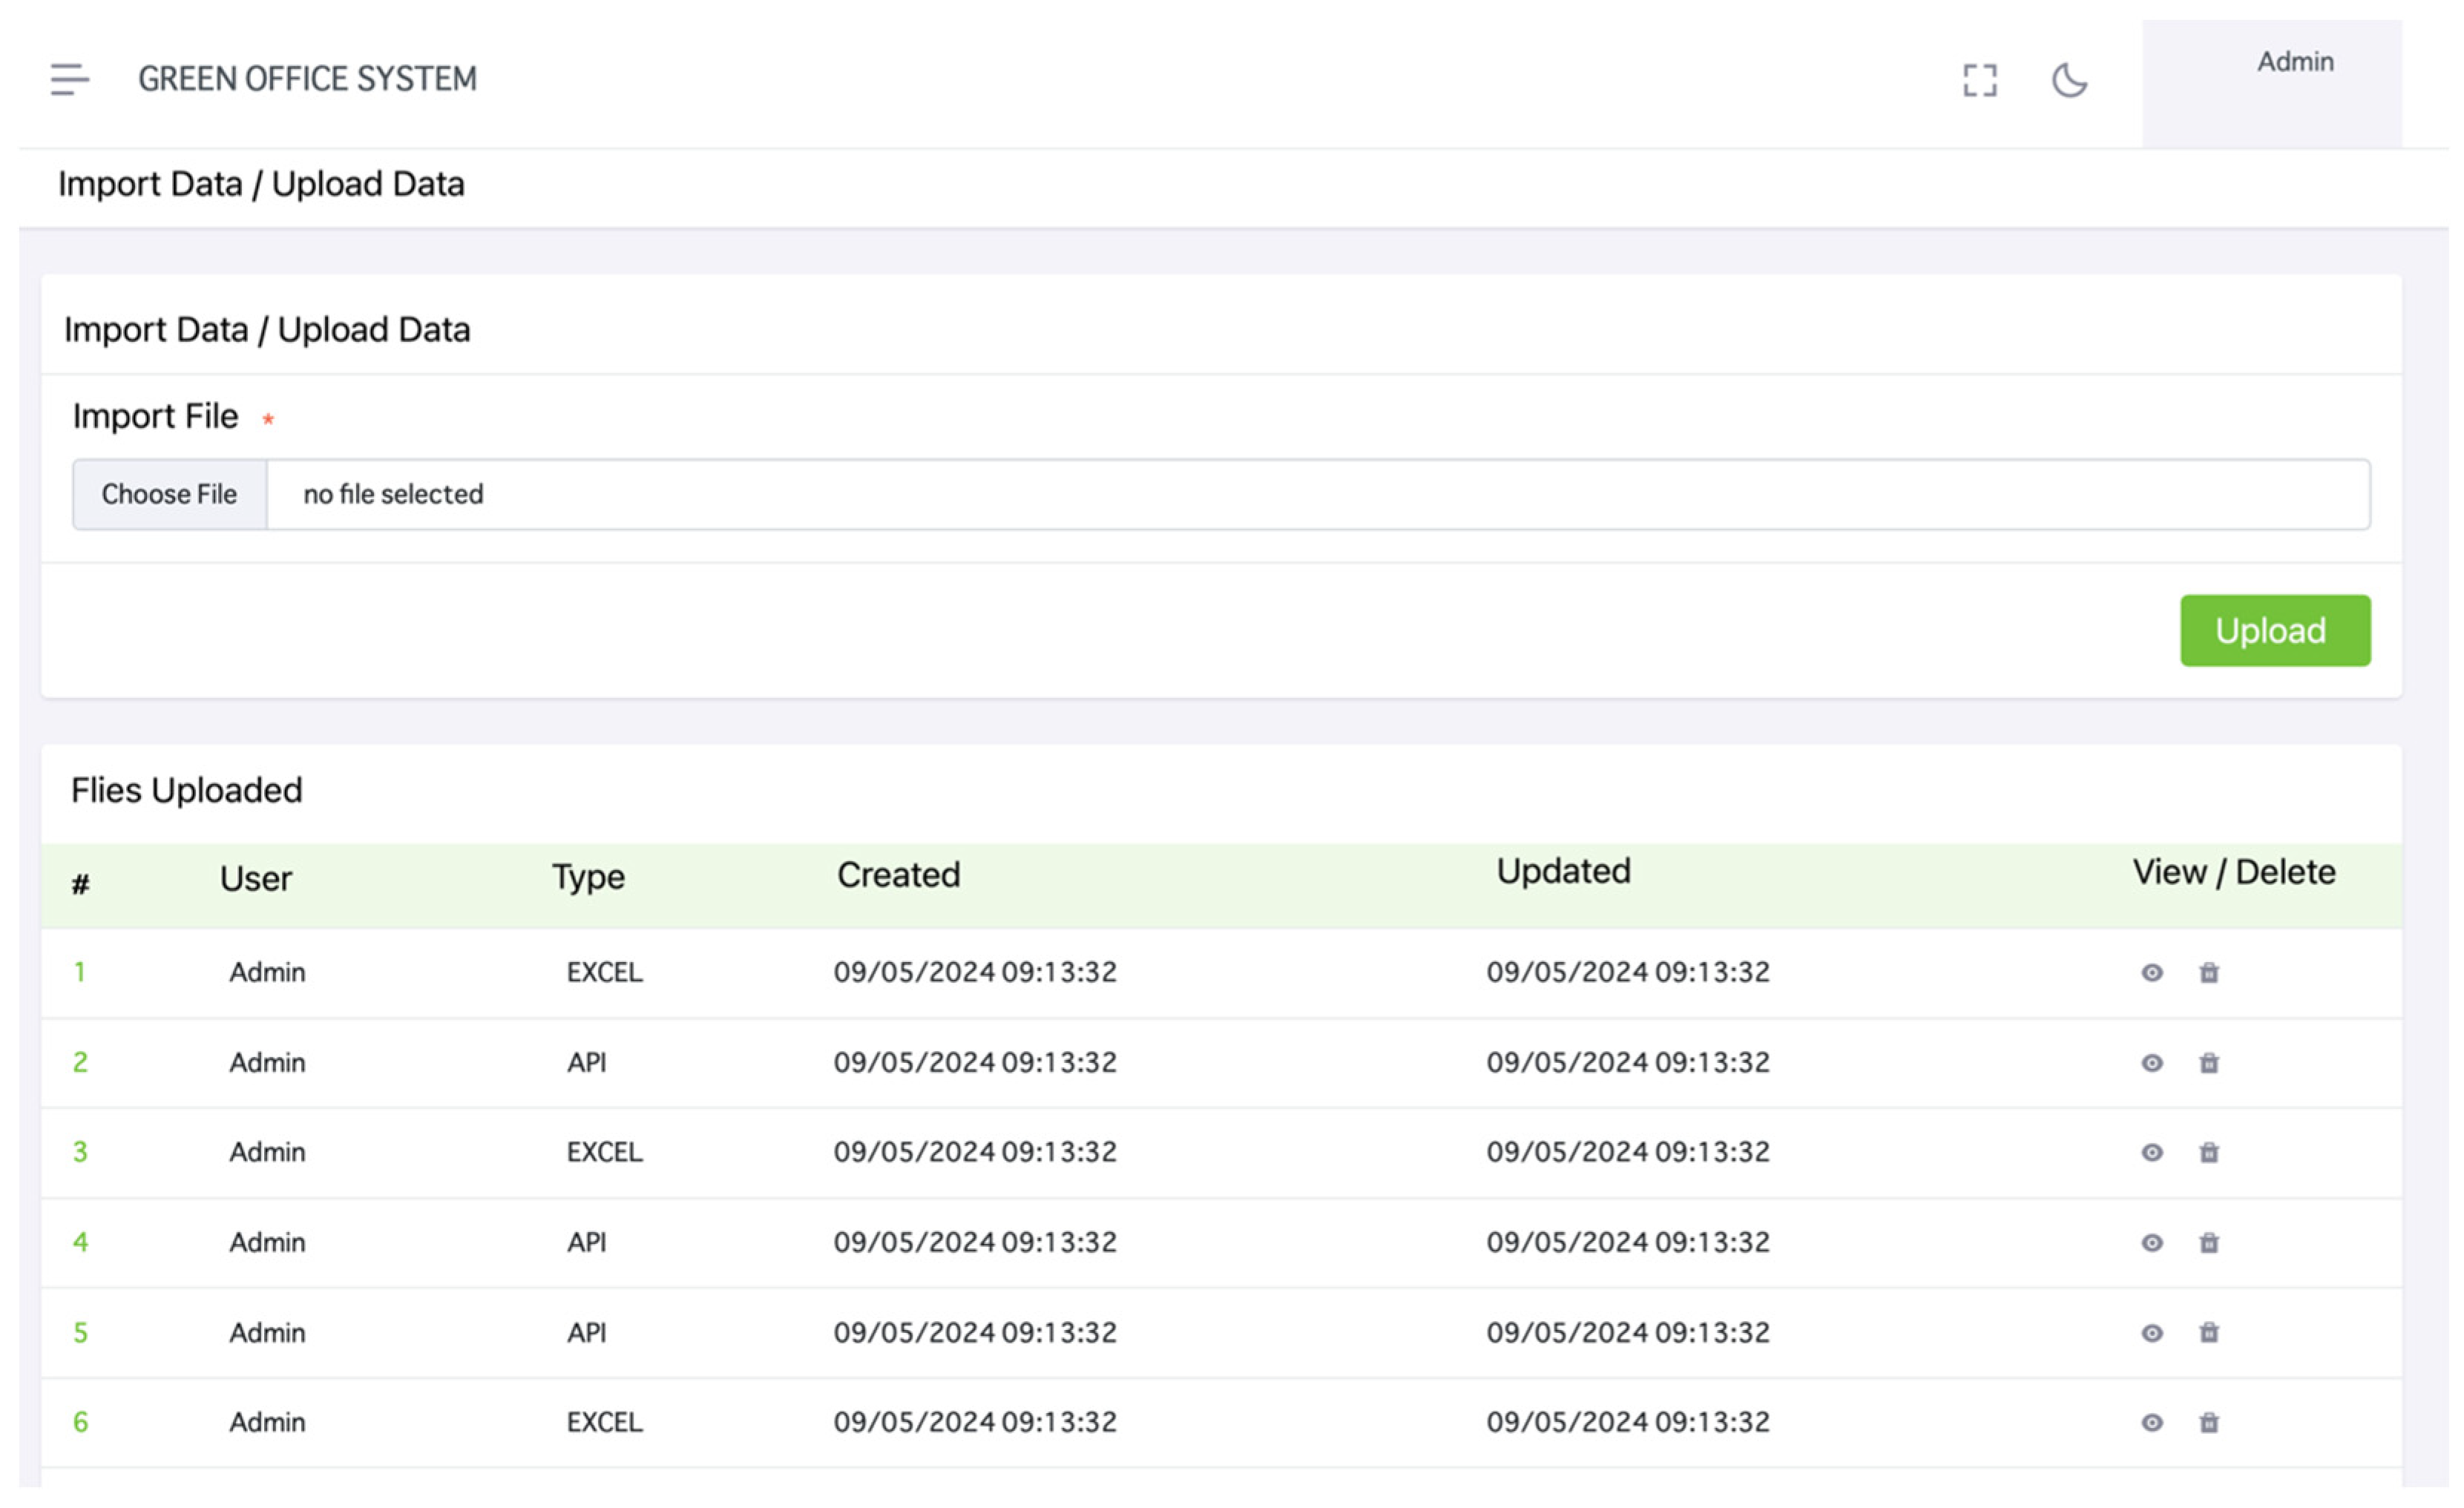
The results of developing the system or application used in this research encompass two principal components: the first component is designed for managing printing, photocopying, and electronic file usage to ascertain the carbon footprint. This segment includes functionalities for user authentication, depicted in Figure 5, wherein users employ their respective usernames and personnel passwords for system access. Notably, authentication is facilitated through programming via an application programming interface (API). Furthermore, user accounts and roles are administrable through the administrator interface, as illustrated in Figure 6, with default roles assigned to lecturers/staff members. Additionally, the administrator and executive user groups have the capability to configure supplementary settings. Moreover, the administrator possesses the authority to upload data files detailing the number of copies and prints generated by all users, with support for CSV or Excel file formats. Upon data upload, pertinent information, such as the recorder’s details, creation date, and update timestamp, are recorded. The interface depicted in Figure 7 facilitates the viewing of past uploads and provides options for data deletion. Typically, application development in this domain involves retrieving data regarding copies and prints from the database. However, for printers not integrated into the network, such as personal printers, data can be uploaded via file submission, ensuring accurate tracking aligned with actual usage volumes.
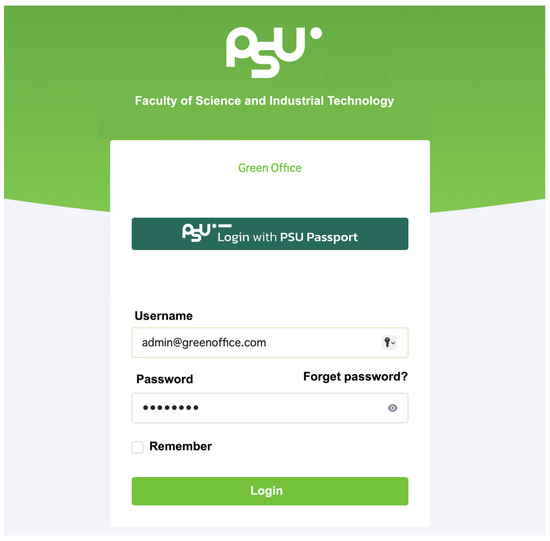
Figure 5.
User authentication interface.
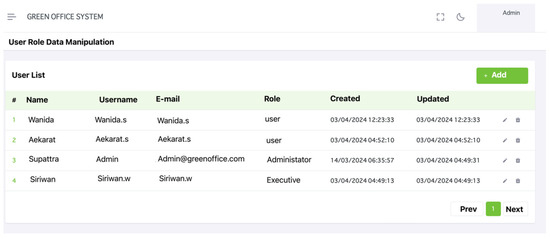
Figure 6.
Administrator interface (user permission data manipulation). Source: Image generated from the web application developed by the authors.

Figure 7.
Administrator interface (import data). Source: Image generated from the web application developed by the authors.
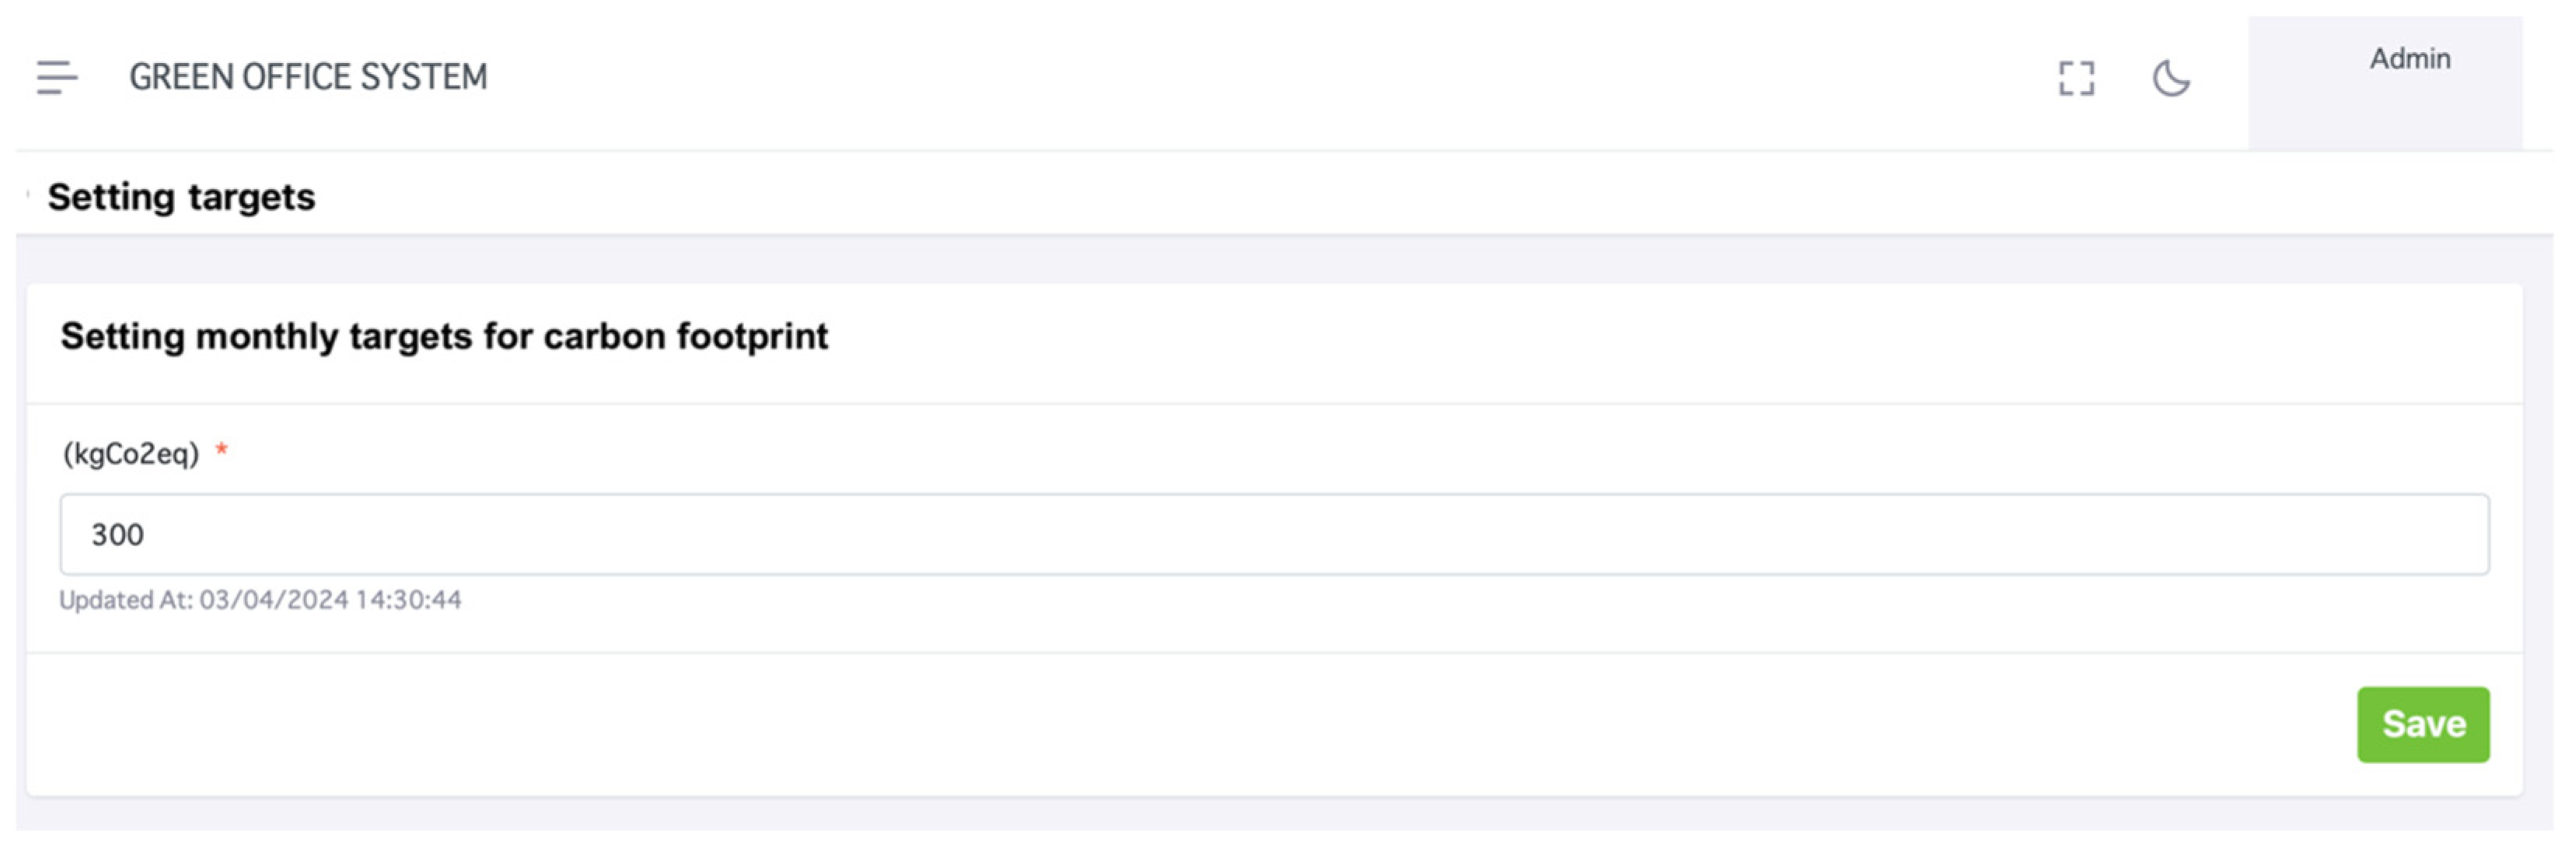
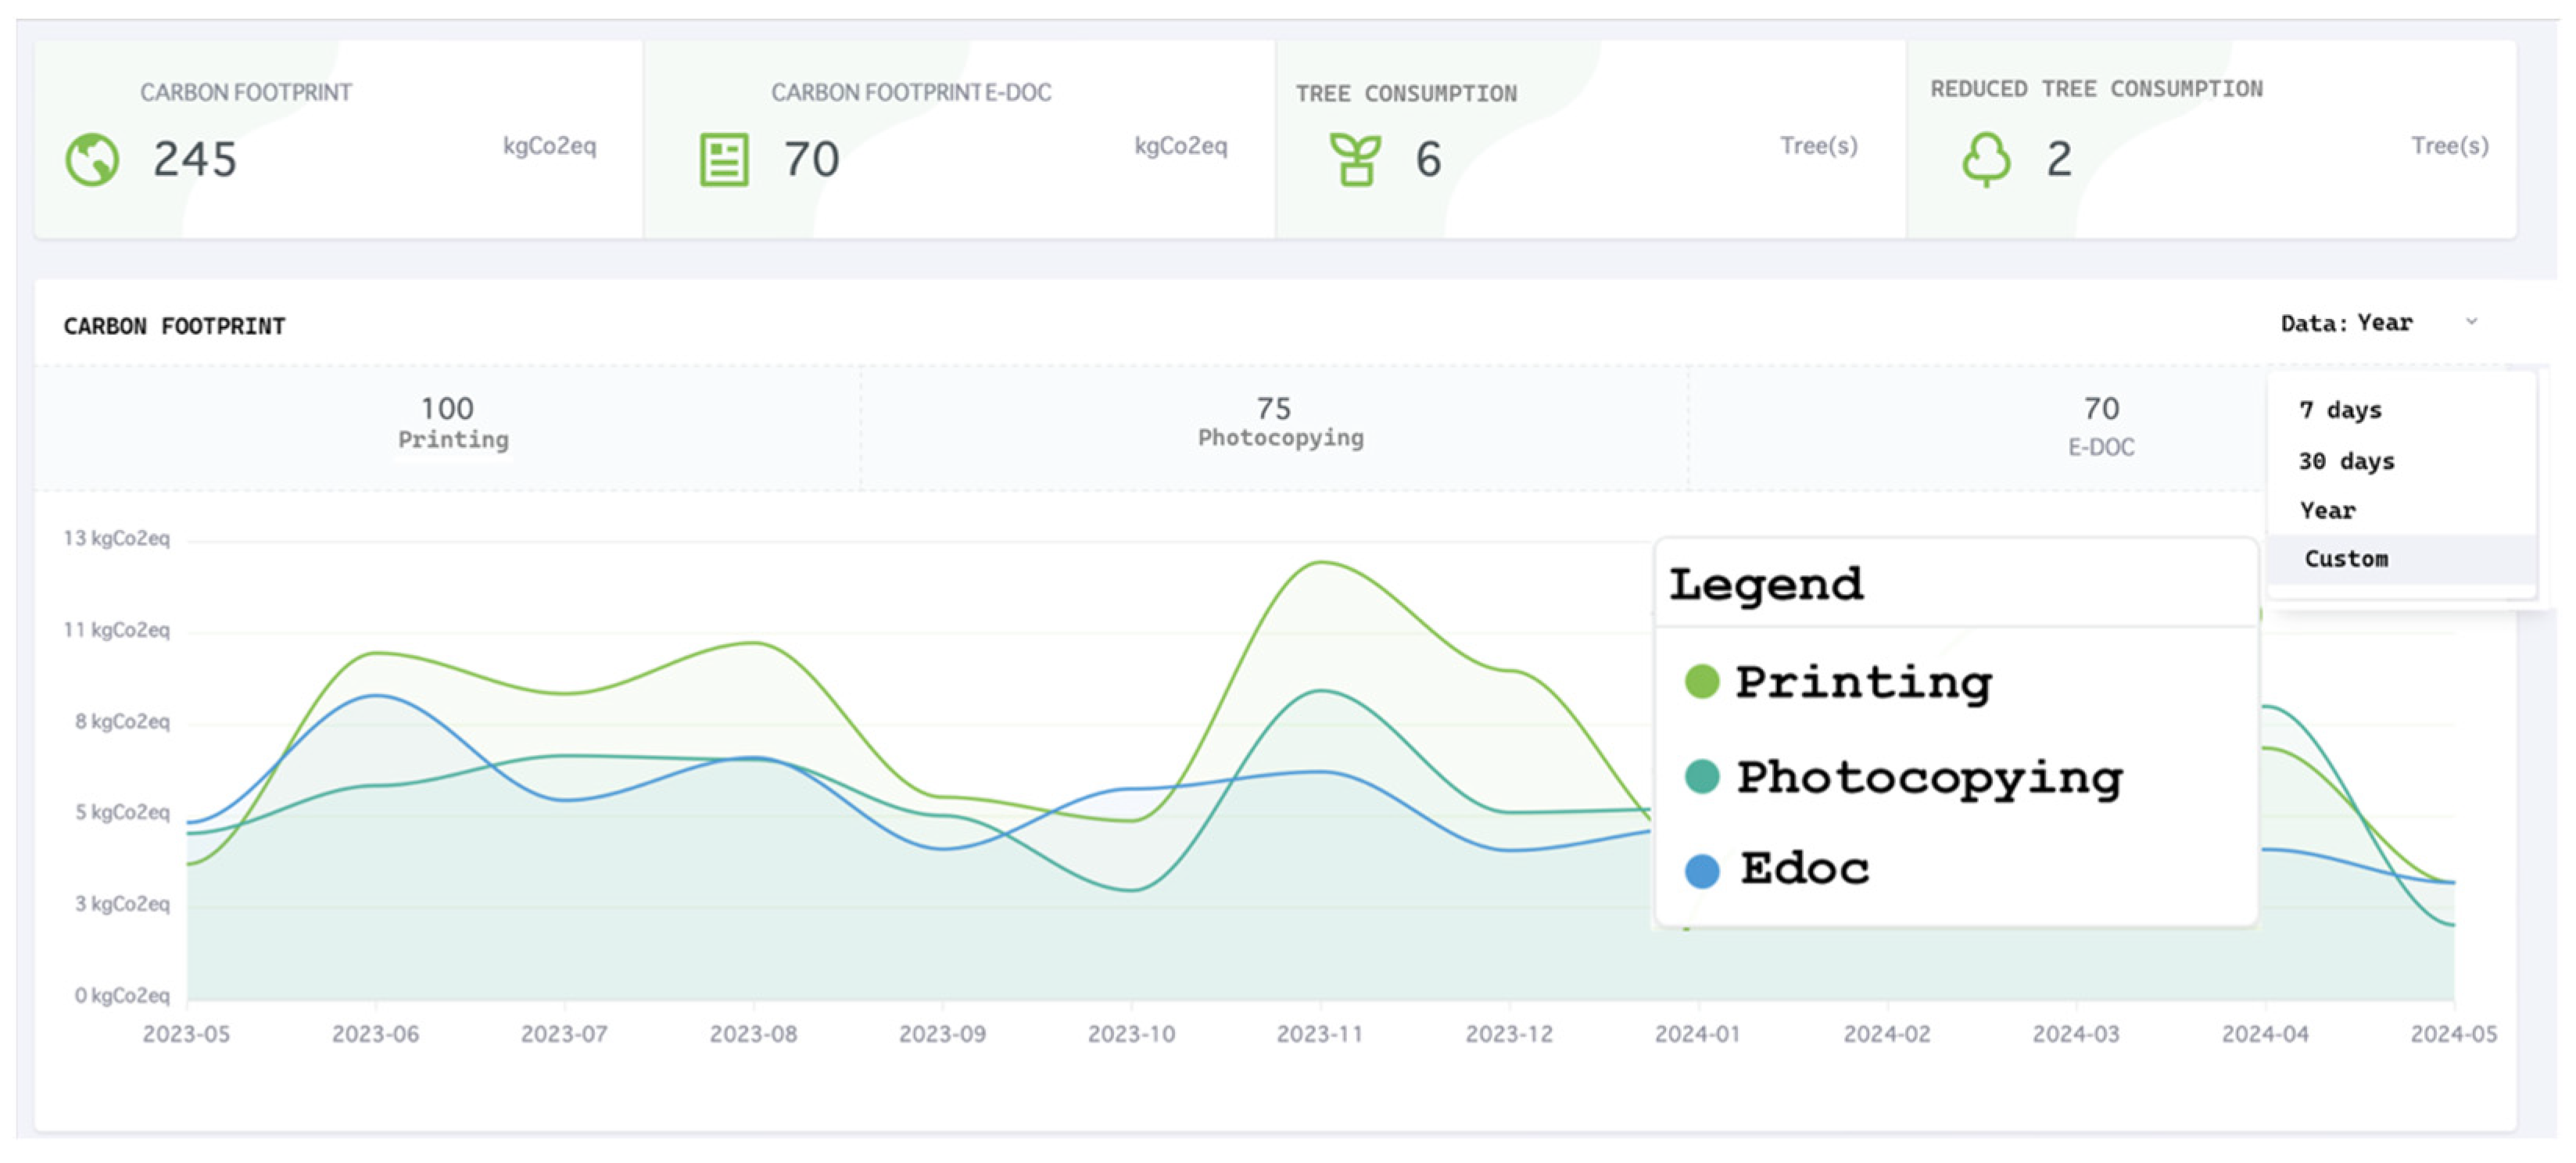
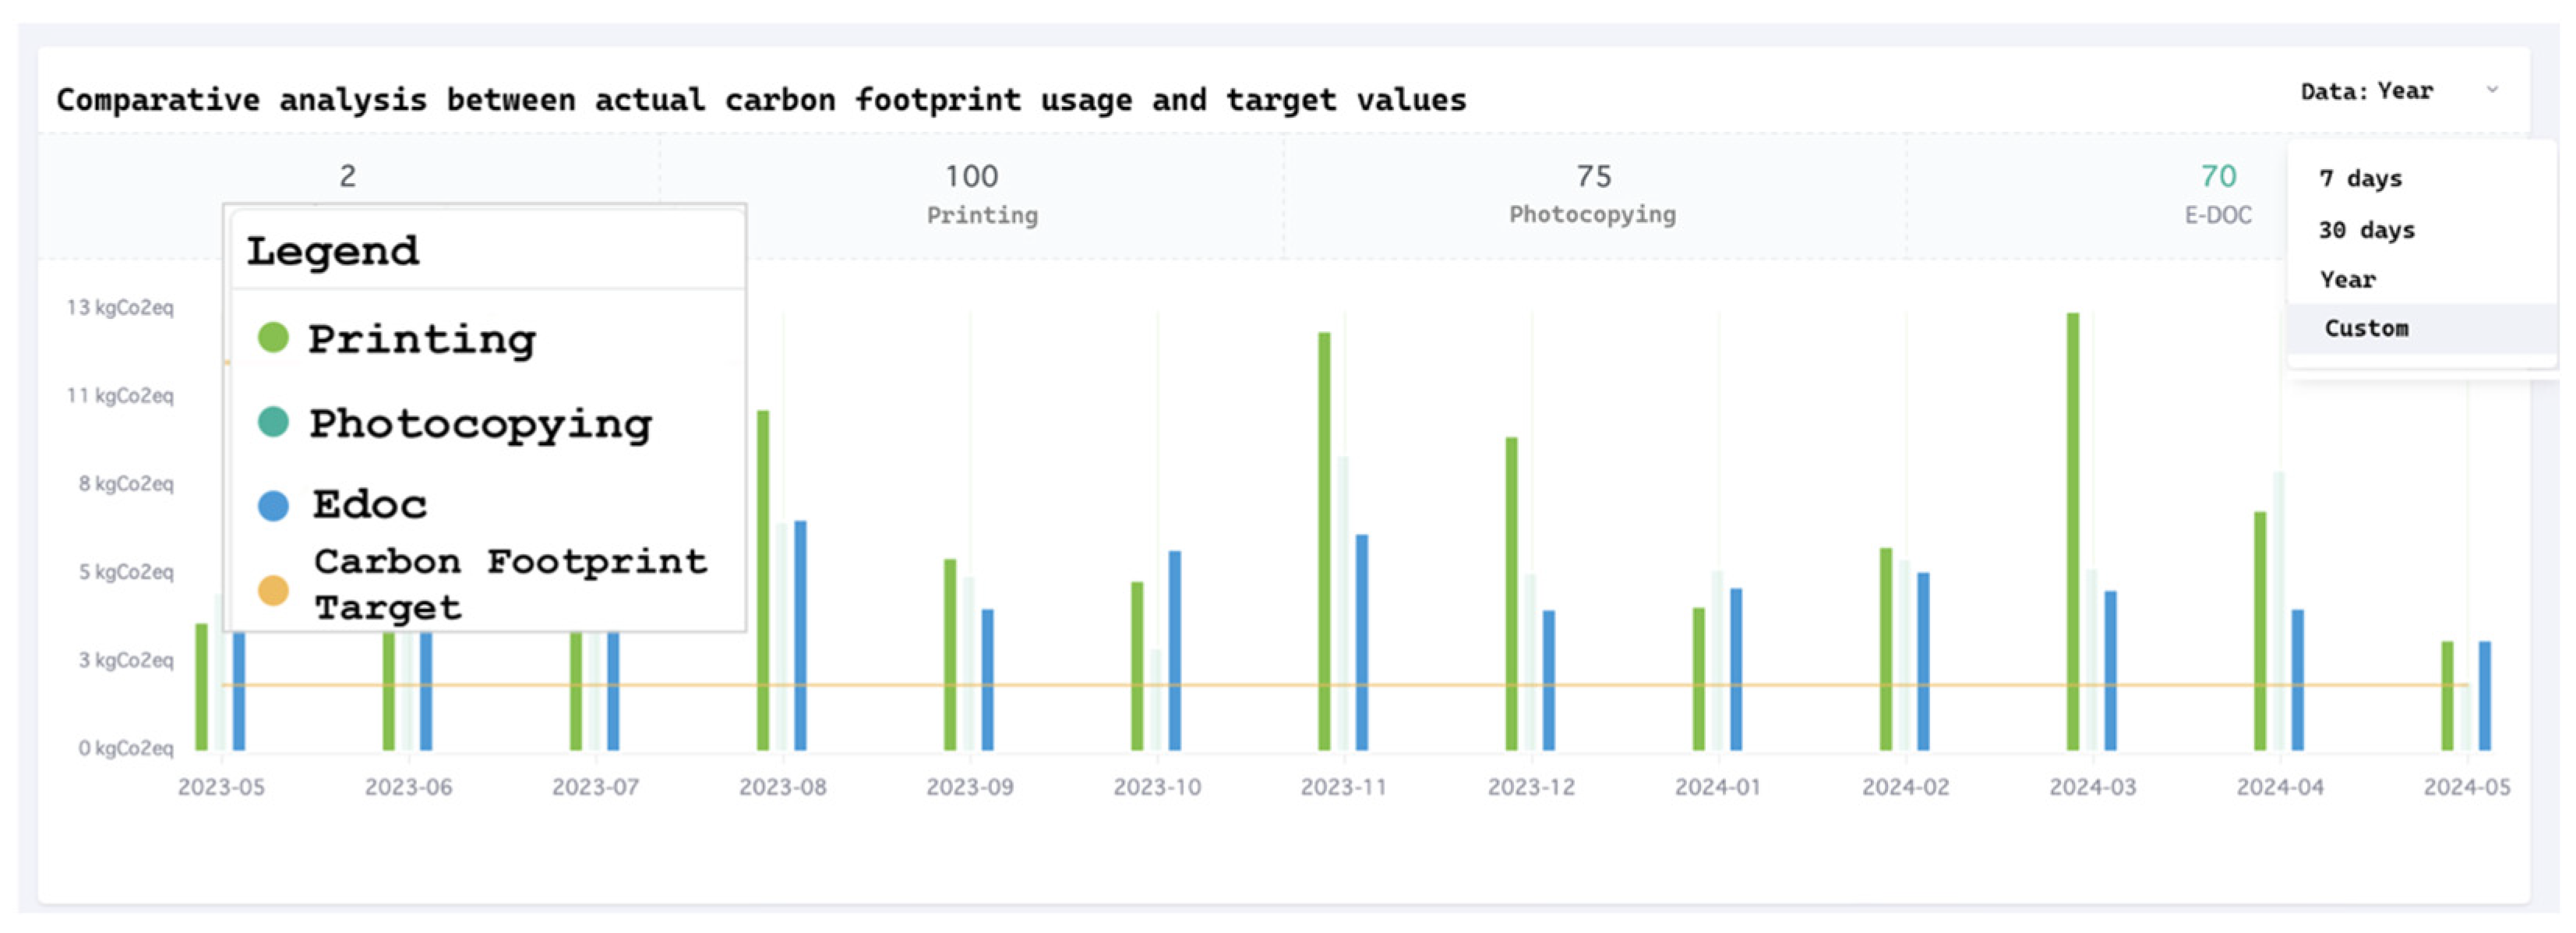
The application development results for executive users encompass the establishment of a monthly carbon footprint target, facilitated through the input of target quantities, as depicted in Figure 8. This functionality includes the display of date information, highlighting the most recent goal setting to inform executives of the timing of the latest goal establishment for informed decision making regarding goal adjustments. Furthermore, executive users can leverage the application to monitor diverse datasets, including the carbon footprint generated from printing and photocopying activities and carbon footprint reduction achieved through the utilization of digital files via the E-document system, as well as metrics related to tree consumption attributed to printing and photocopying, along with subsequent reductions. These metrics are presented comprehensively in a dashboard, as depicted in Figure 9, allowing for visualization through line graphs comparing carbon footprint quantities associated with monthly printing, photocopying, and E-document generation. Historical data from previous years is also accessible, serving as informative resources for strategic planning and policy formulation aimed at mitigating carbon footprint usage or reducing printing activities at the organizational level. The line graph presented in the application uses three colors: light green, dark green, and blue. The light green line represents the carbon footprint associated with printing, the dark green line represents the carbon footprint from photocopying, and the blue line represents the carbon footprint from electronic documents (E-docs). Moreover, the dashboard provides a comparative analysis between actual carbon footprint usage and target values for each month, as illustrated in Figure 10. The functionalities offered in this section enable agencies to monitor data against predefined objectives, facilitating the assessment of progress towards goals and the identification of usage disparities across different timeframes. Figure 10 presents three color-coded bar graphs: light green, dark green, and blue. The light green bars indicate the carbon footprint associated with printing, the dark green bars represent the carbon footprint from photocopying, and the blue bars show the carbon footprint from electronic documents (E-docs). The yellow line on the graph represents the monthly carbon footprint target set by the organization.

Figure 8.
Carbon footprint target setting interface. Source: Image generated from the web application developed by the authors.
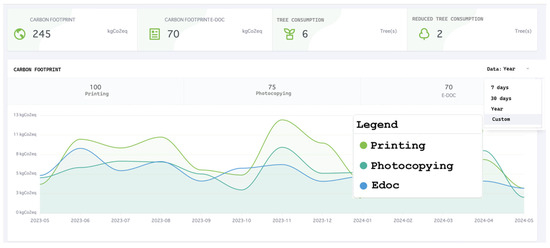
Figure 9.
Line graphs comparing carbon footprints on the dashboard. Source: Image generated from the web application developed by the authors.
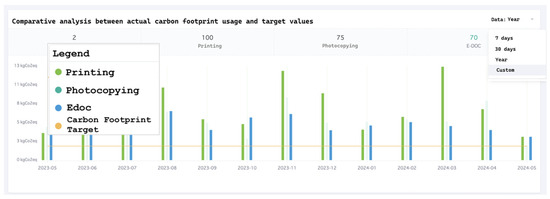
Figure 10.
Comparative analysis between actual carbon footprint usage and target values on the dashboard. Source: Image generated from the web application developed by the authors.
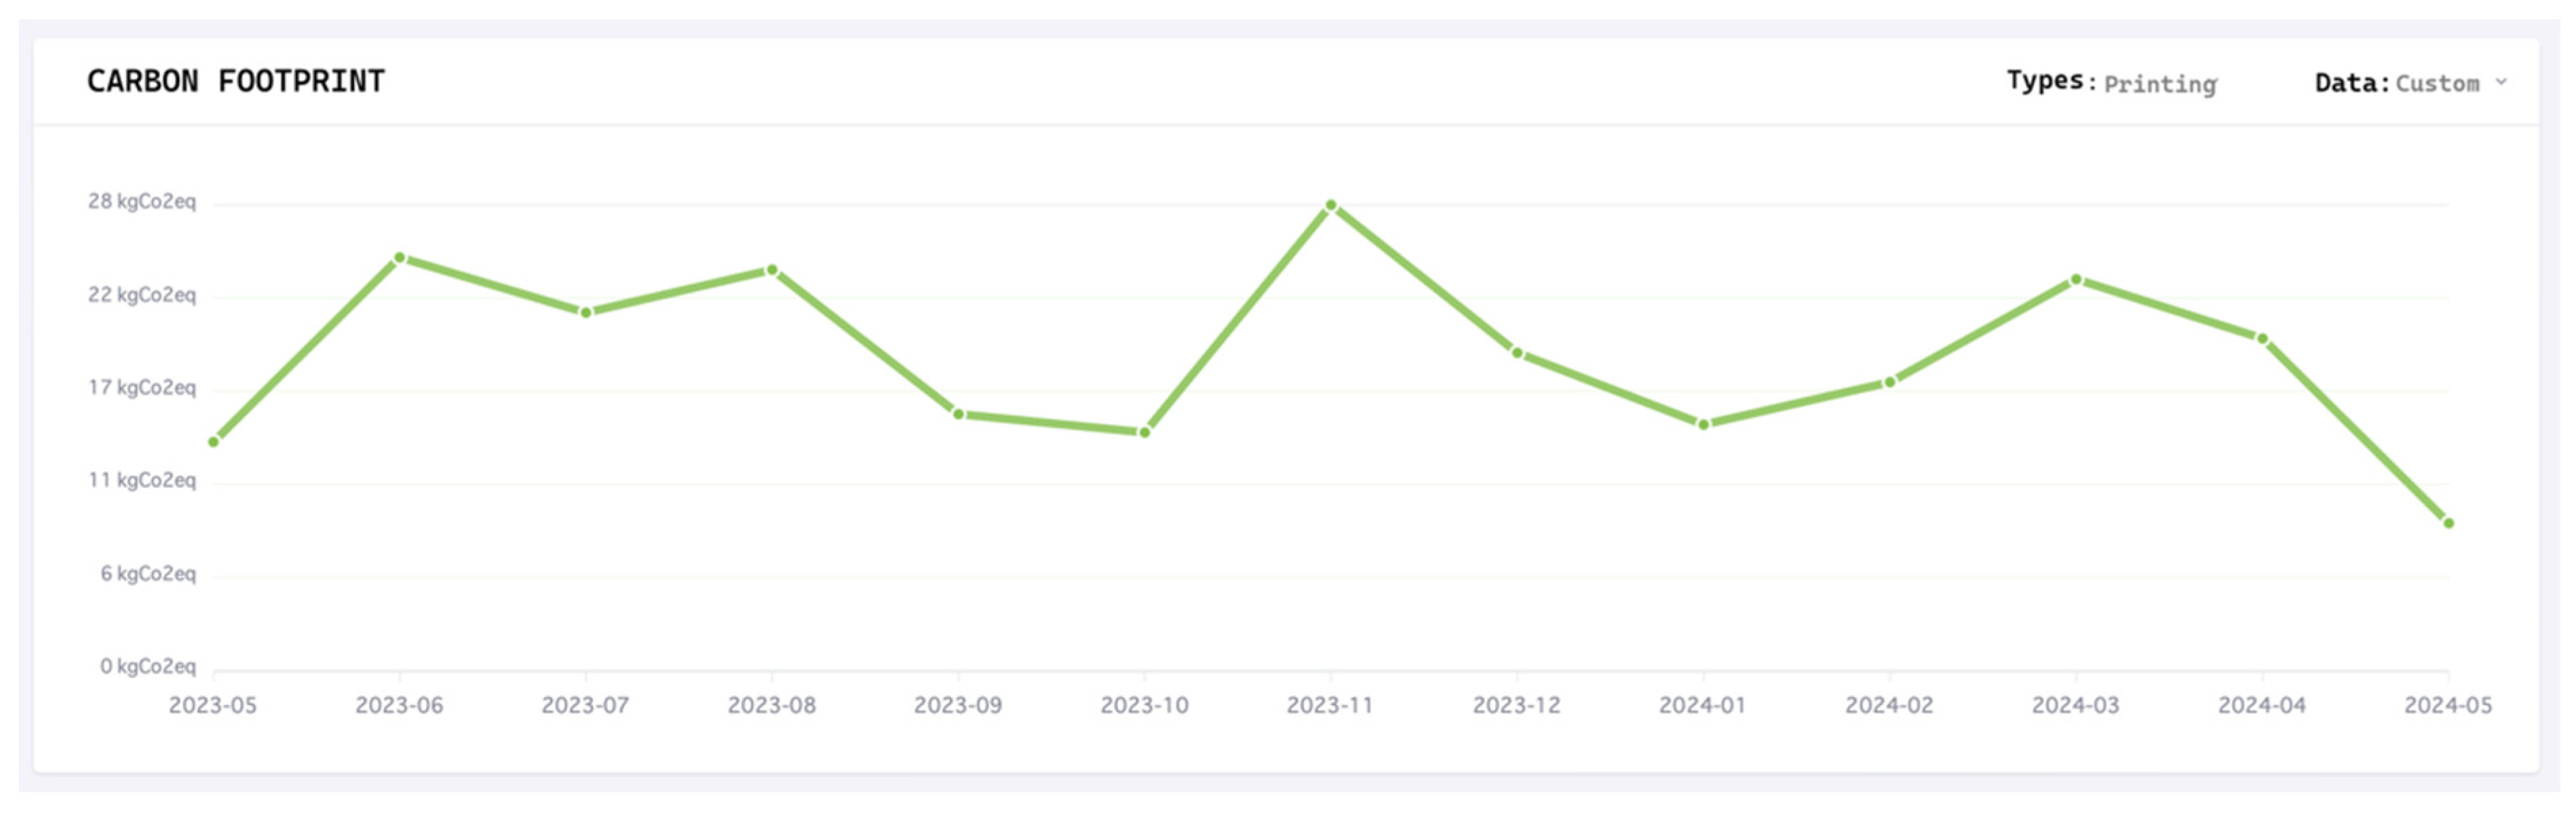
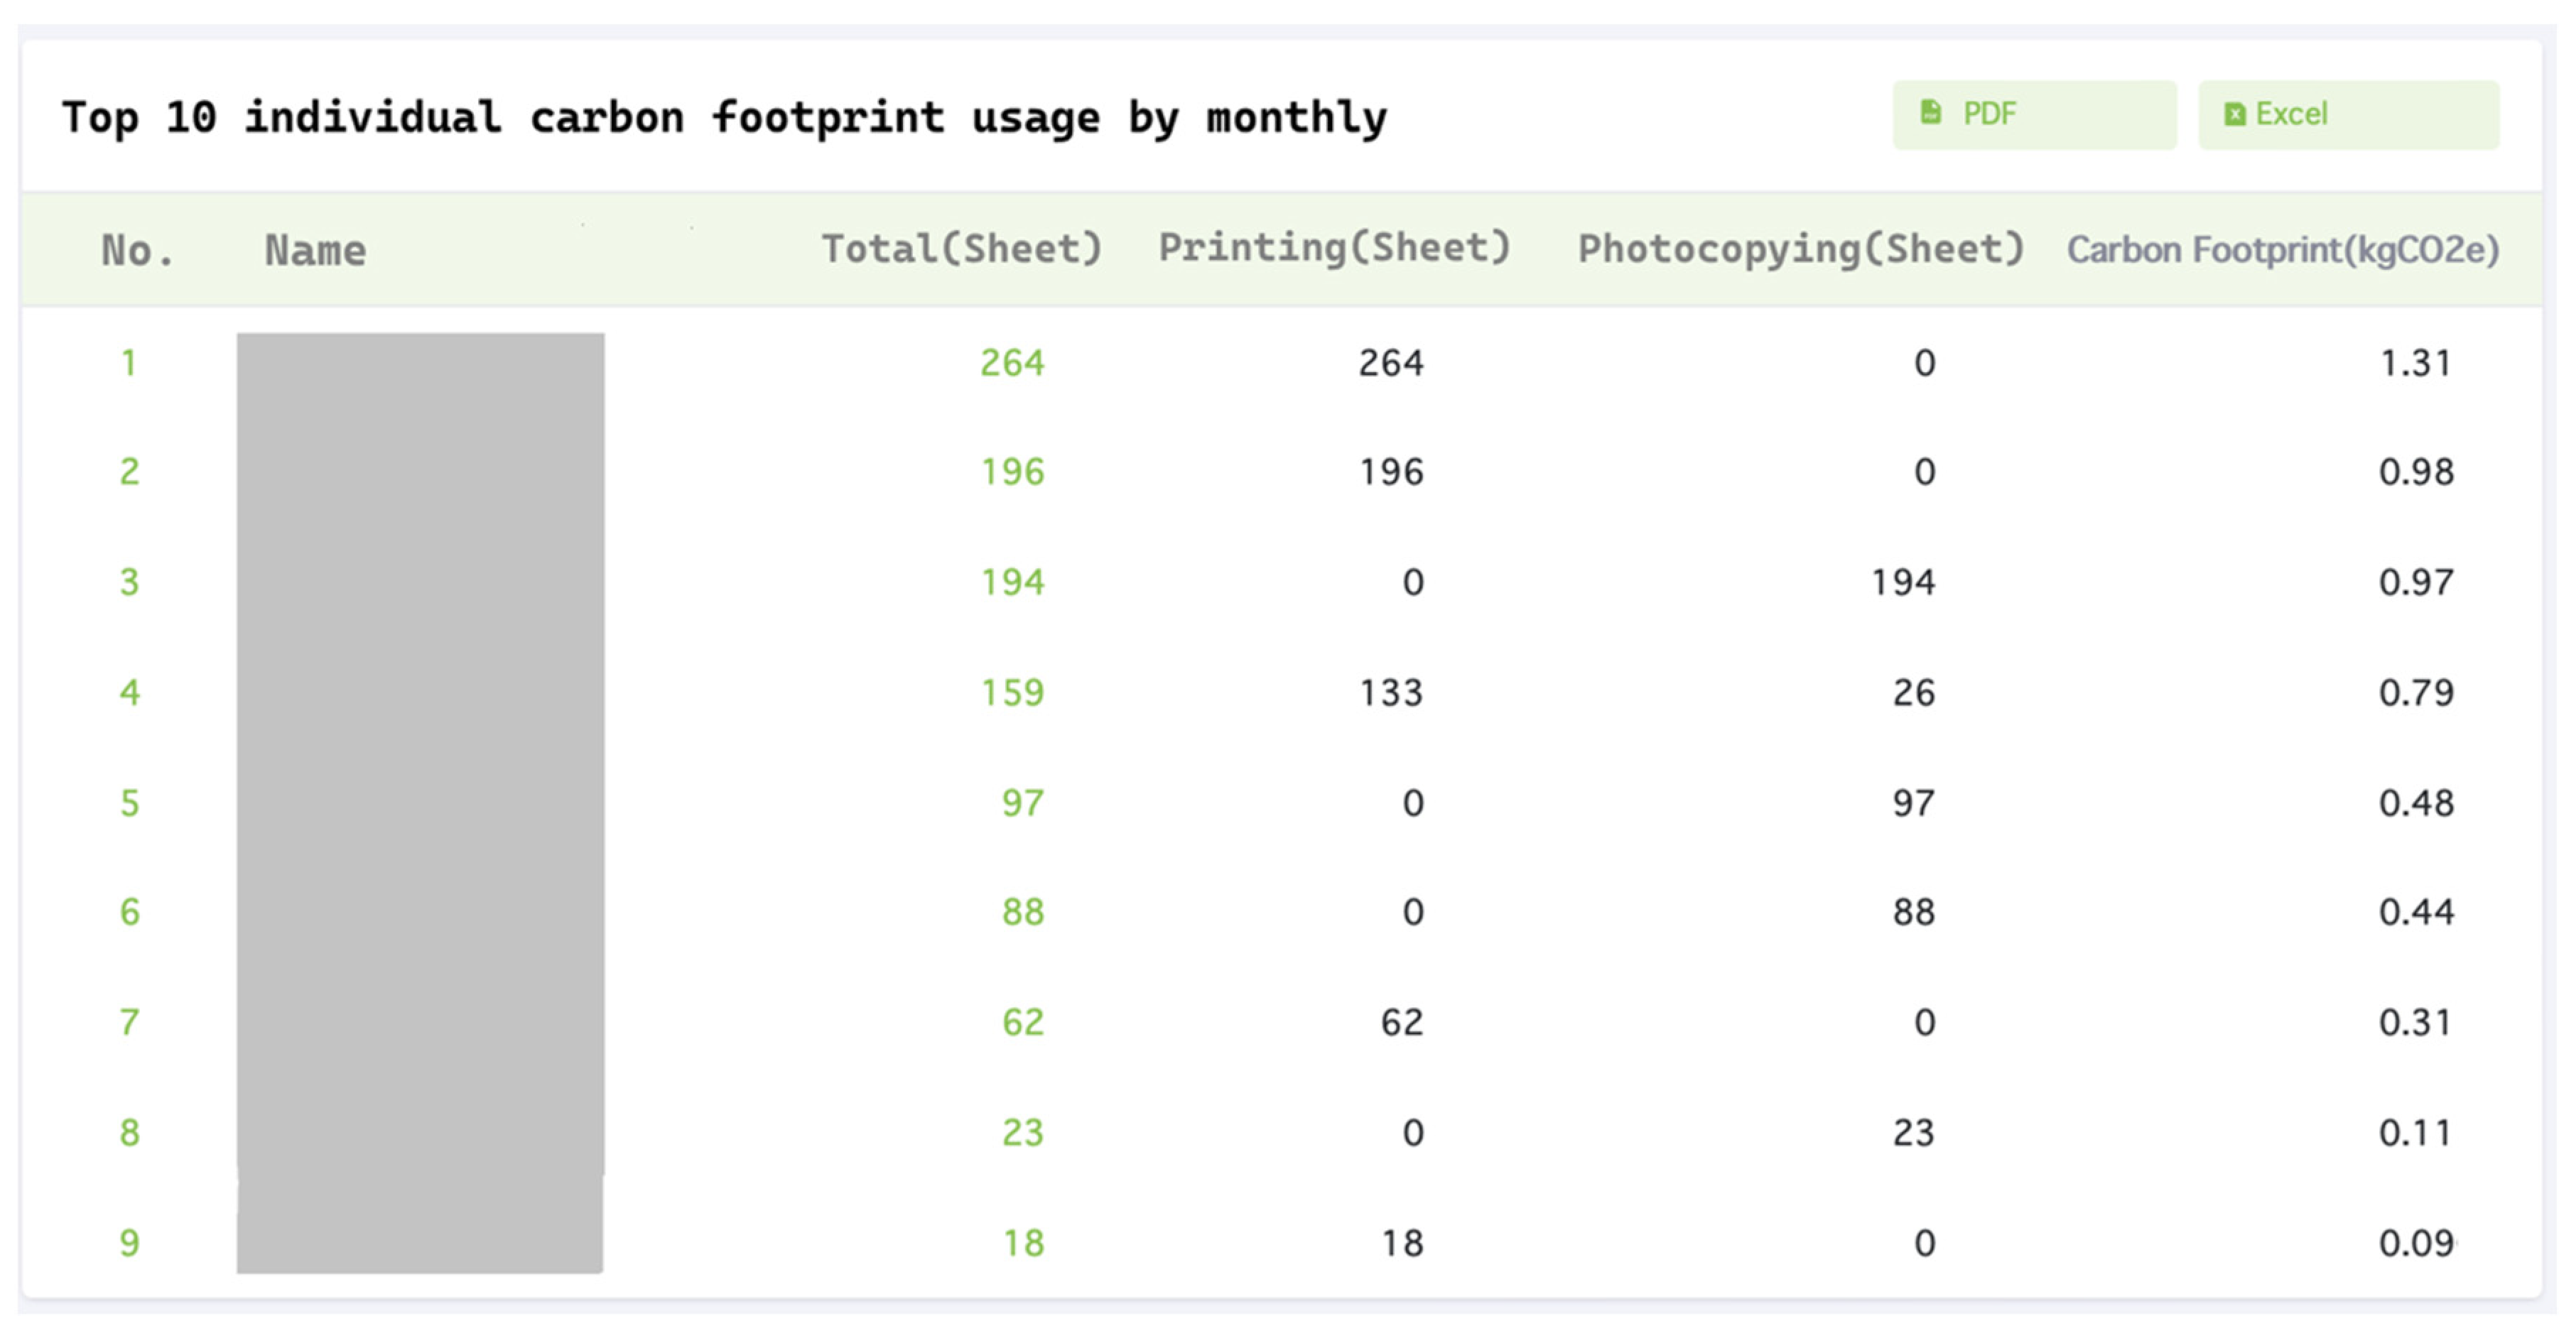
Moreover, the application has the capability to generate a line graph illustrating monthly carbon footprint data, as exemplified in Figure 11. This feature enables the analysis of monthly carbon footprint trends, facilitating the identification of usage patterns crucial for strategic planning and reviewing strategies aimed at mitigating future corporate carbon footprints. Additionally, the application enables the tracking of individual users and the analysis of printing, photocopying, and carbon footprint usage. It provides detailed information on individual users, including the top 10 most active users on a monthly basis (Figure 12). Furthermore, the application allows for data exportation in PDF and MS Excel formats on a monthly and yearly basis (Figure 13). The provision of comprehensive information in this section empowers executives to conduct in-depth analyses for root cause identification and planning, thereby informing various measures or strategies to curtail printing and photocopying activities among agency personnel. The results of application development in the domain of printing data management, photocopying, and digital file usage indicate that the developed application facilitates the tracking of the carbon footprint, deforestation, and reductions in deforestation resulting from the transition from paper to digital files within offices or organizations. These insights are invaluable for organizational planning towards the realization of green office objectives and can serve as a blueprint for implementation in other departments or faculties within the university.

Figure 11.
Line graph illustrating monthly carbon footprint data on the dashboard.
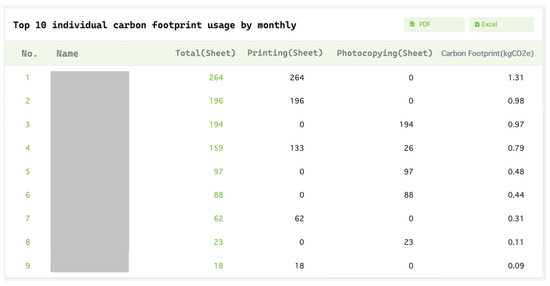
Figure 12.
Top 10 individual carbon footprint usage by month.
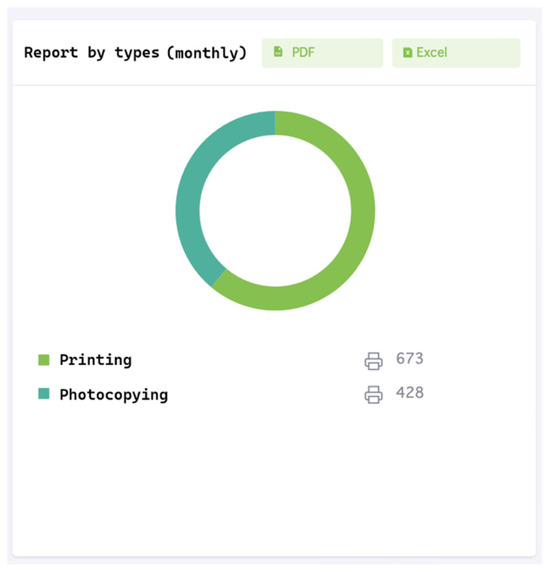
Figure 13.
Carbon footprint usage report by types.
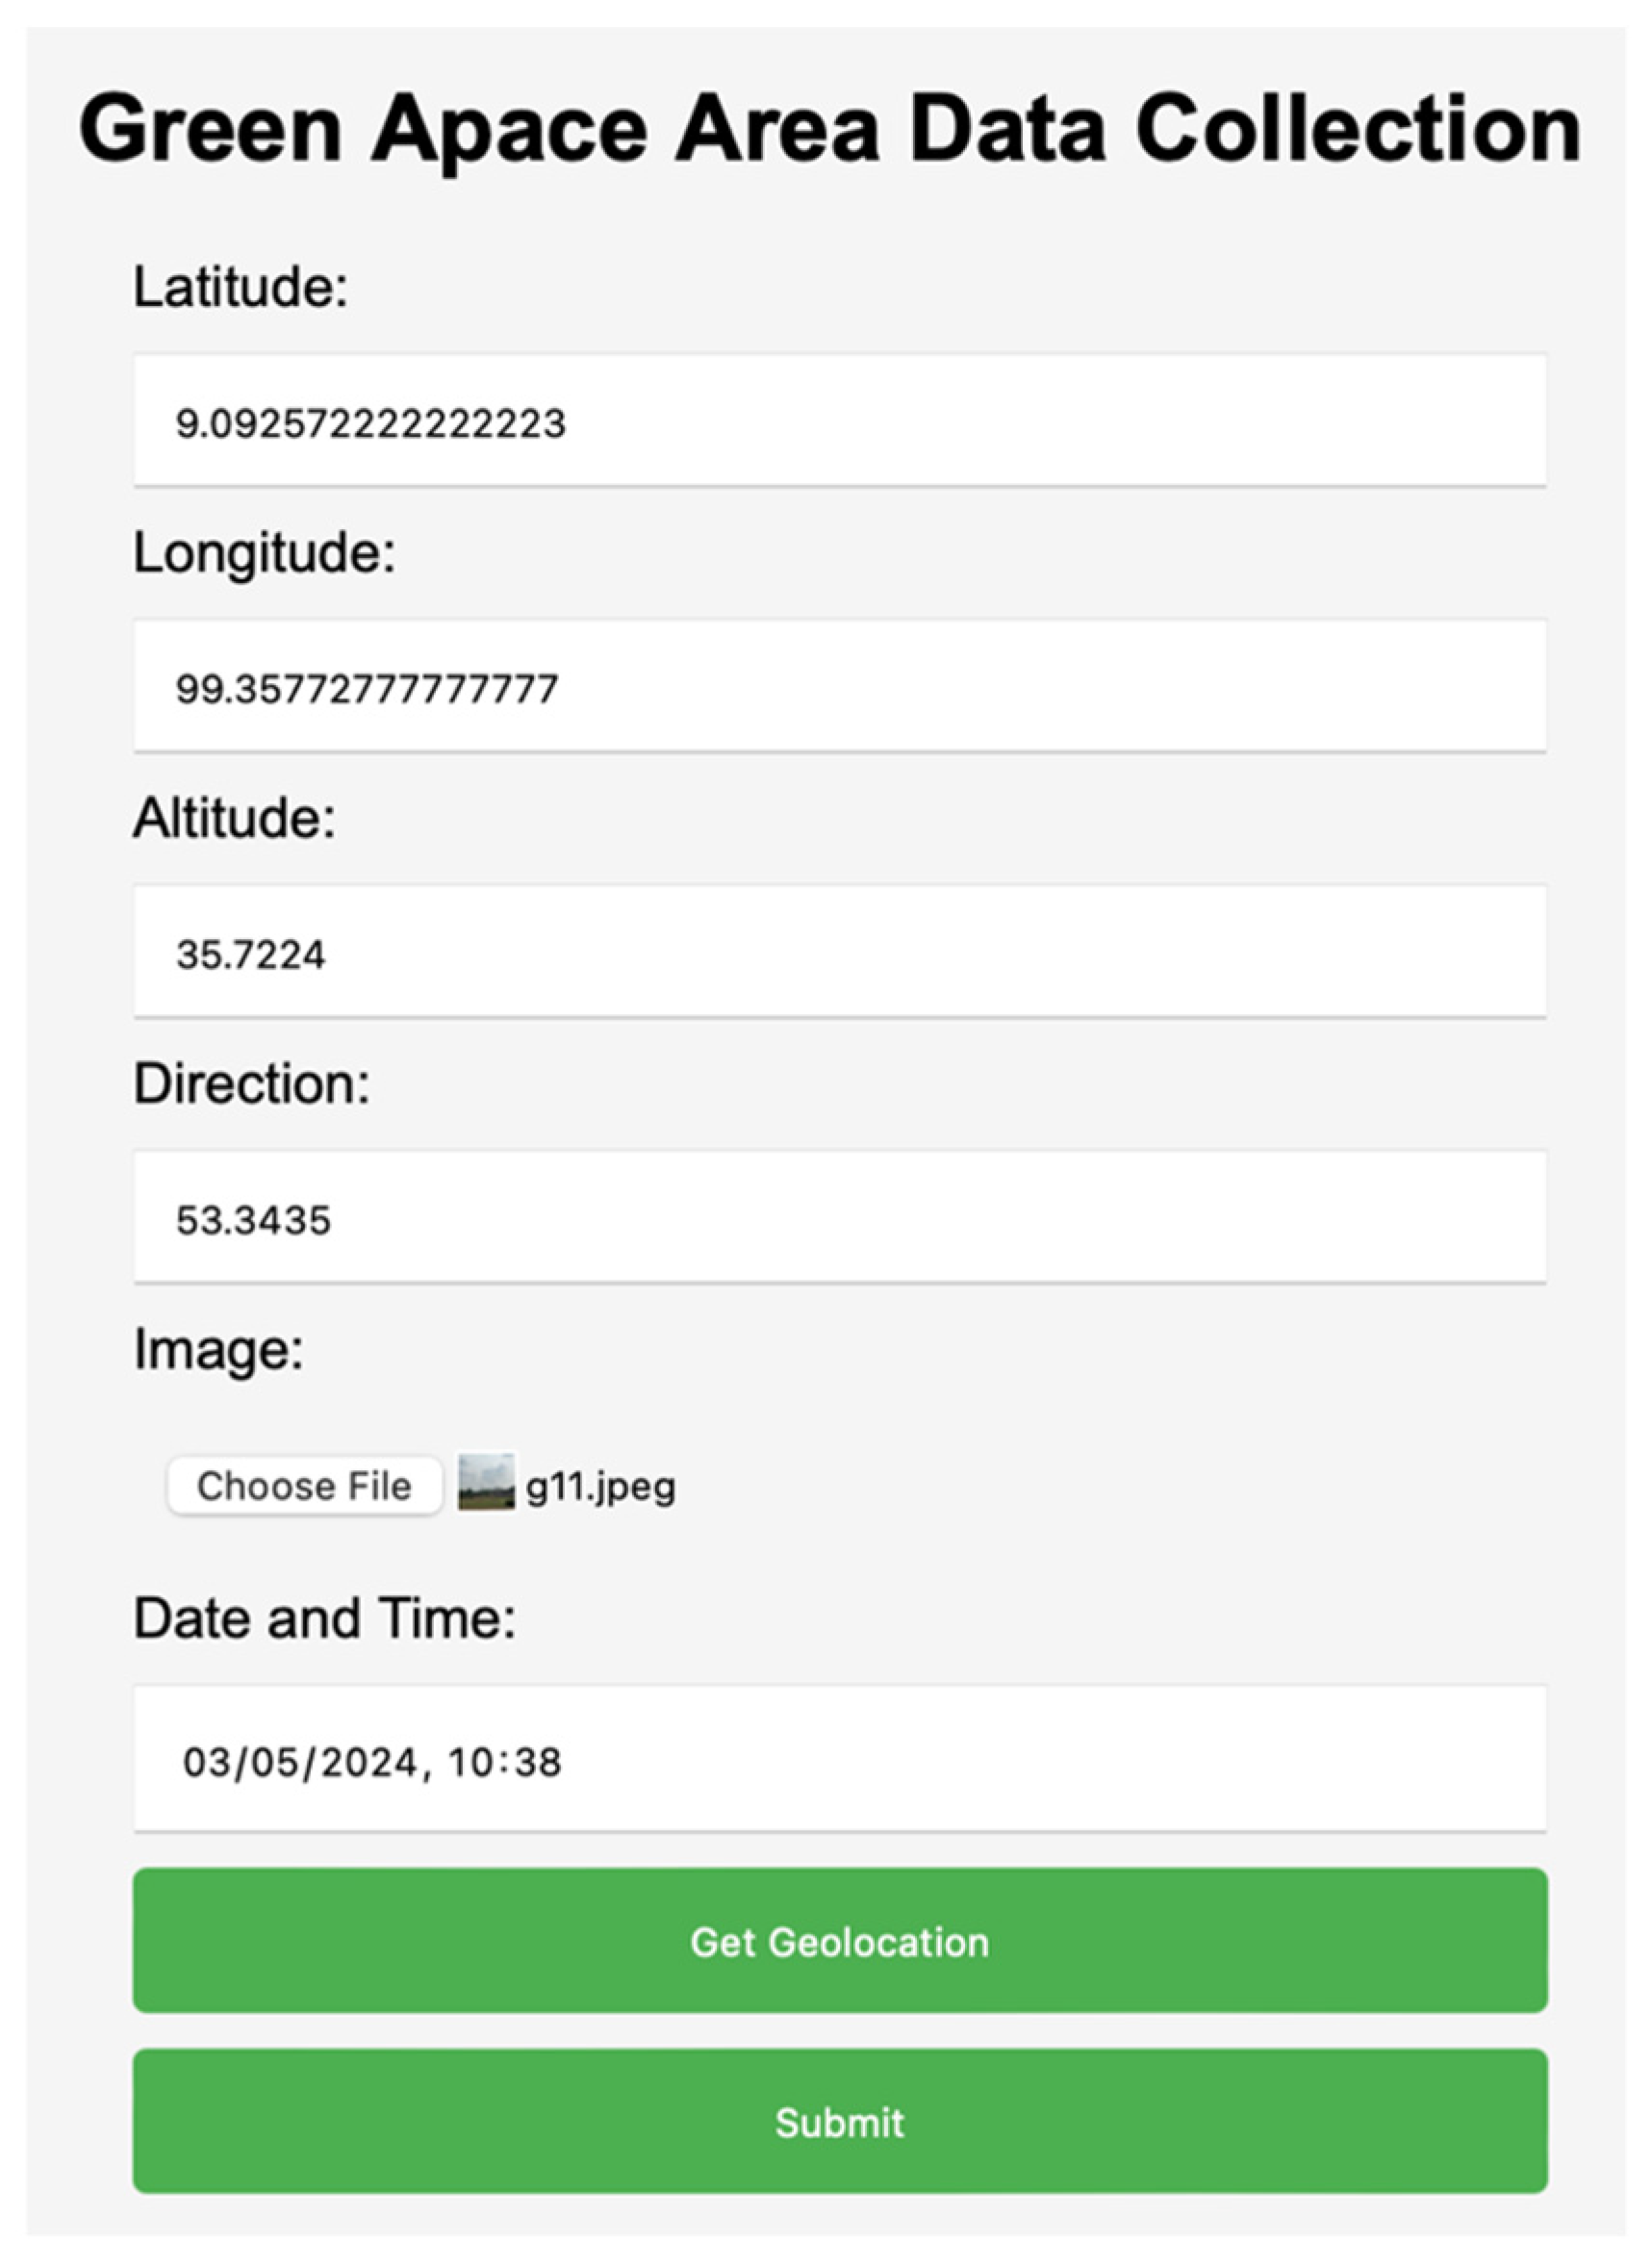
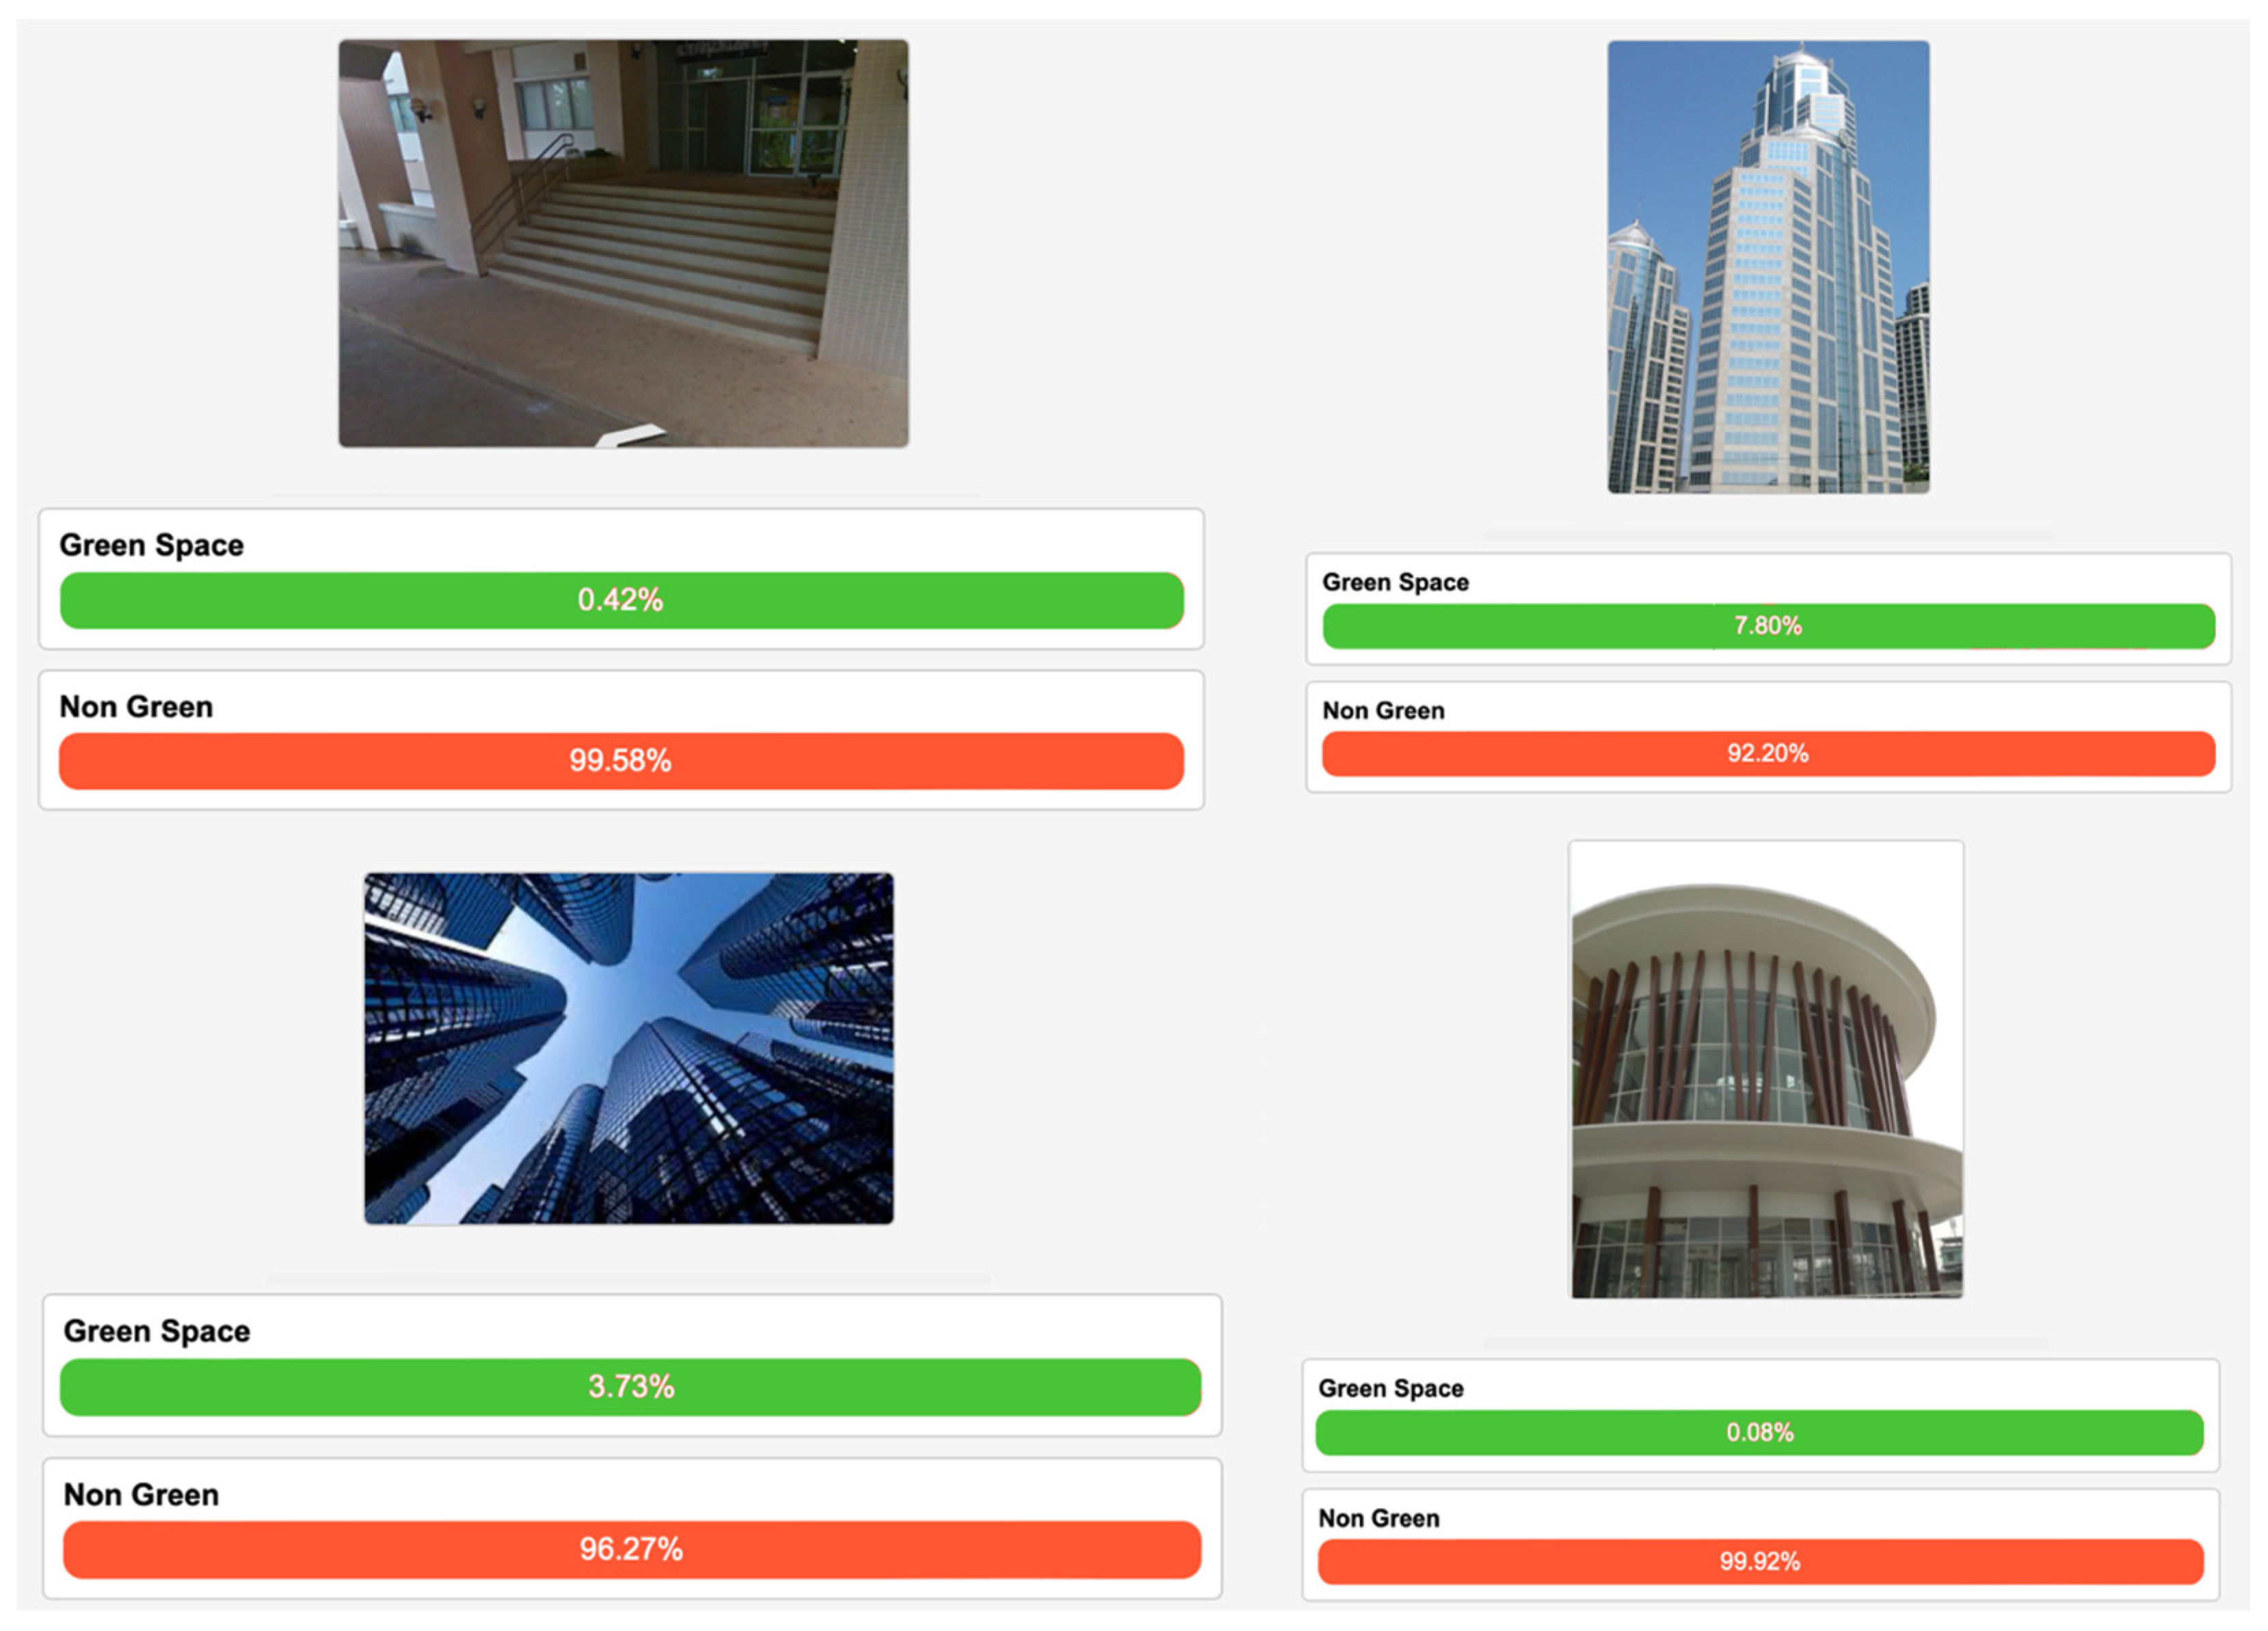
The results of application development in the second component encompass the analysis and classification of green areas within the Prince of Songkla University Surat Thani Campus vicinity, comprising various facets such as green area information management. Within this module, users are afforded the capability to input green area data via the application interface, as illustrated in Figure 14. Green area information encompasses latitude, longitude, altitude, and direction, along with photographic documentation of green spaces, accompanied by timestamps. The requisite data for users to import comprises photographs capturing green areas, with supplementary data extracted from the GPS functionality of the user’s smartphone. During the process of data recording for green area monitoring and classification, a deep learning model is deployed to discern whether the captured image features green elements such as trees, plants, or grass. Classification outcomes designate the recorded image as either green space, if verdant elements are identified, or non-green space, if the image predominantly depicts built structures. Exemplars of classification outcomes are depicted in Figure 15 and Figure 16. Figure 15 illustrates the classification result indicating green space, wherein an area within the photograph depicts a building or structure accompanied by allocated green space. Conversely, Figure 16 illustrates a non-green classification outcome, indicating an absence of greenery within the depicted area. Evaluation of the green area classification model’s efficacy reveals accurate classification performance. Assessment based on training and validation data attests to high accuracy, with an accuracy rate of 98.08% and a Kappa coefficient of 0.96 for the training dataset. Similarly, the validation dataset demonstrates commendable performance, with an accuracy rate of 99.22% and a Kappa coefficient of 0.92. Detailed evaluation metrics are presented in Table 2.

Figure 14.
Green space data input interface.
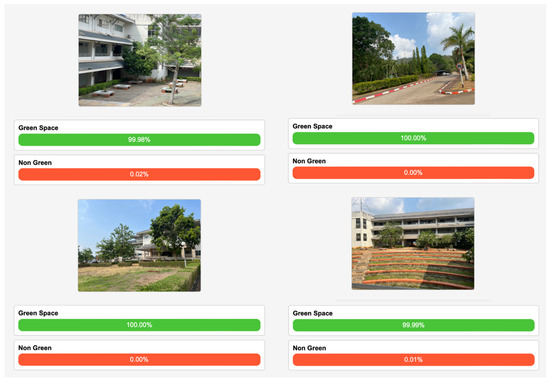
Figure 15.
Green space classification results using digital images.

Figure 16.
Non-green space classification results.
Table 2.
Accuracy assessment.
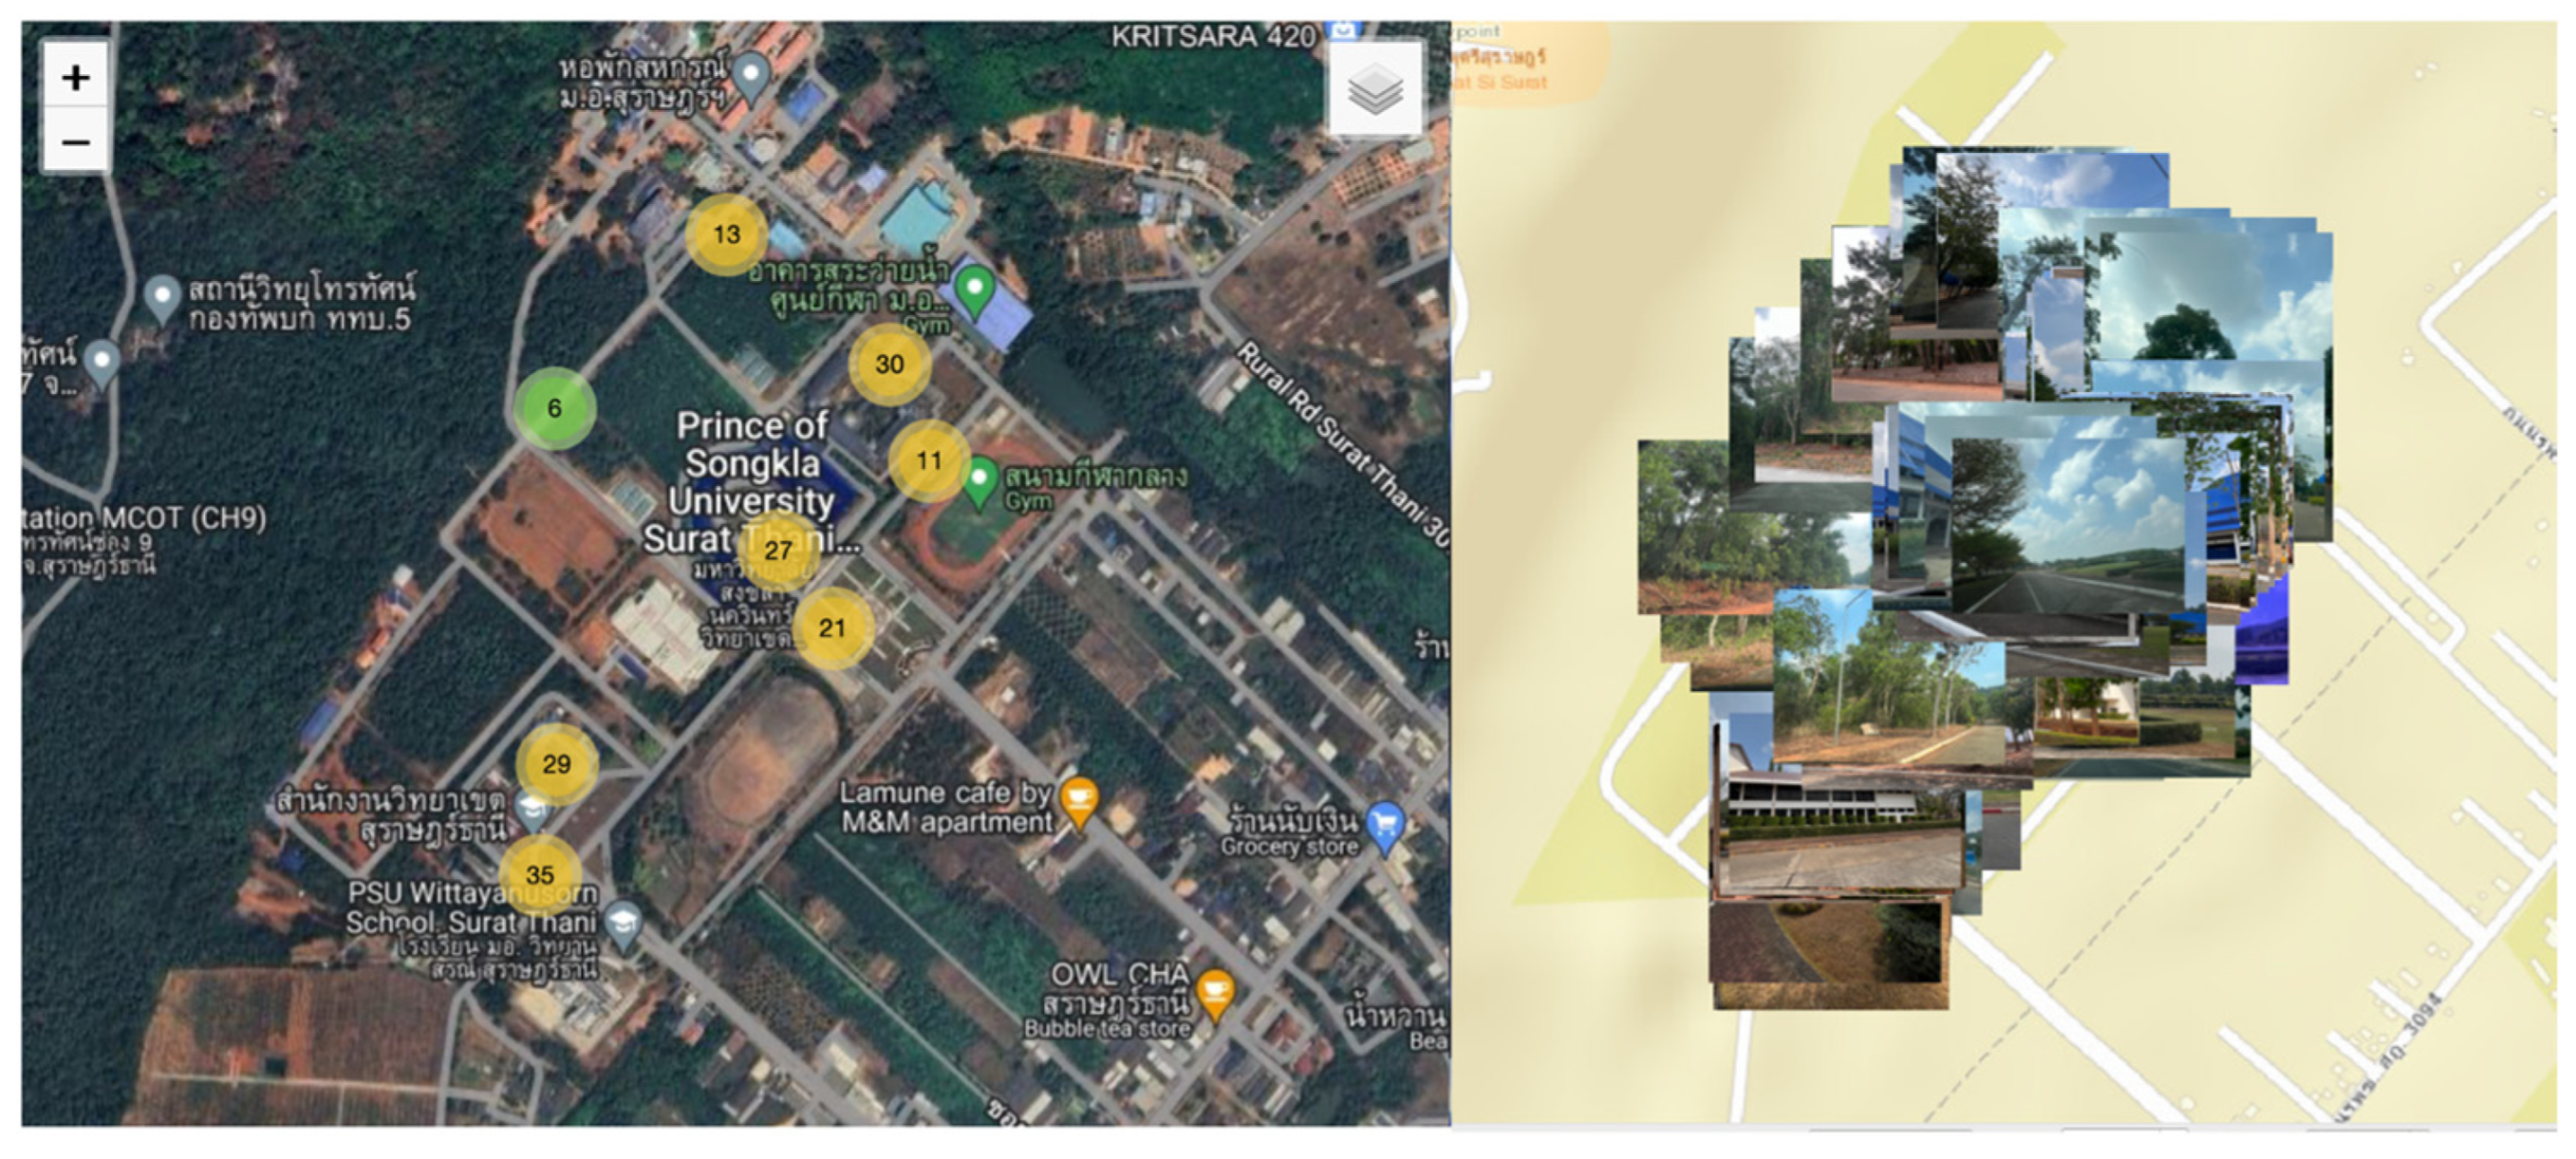
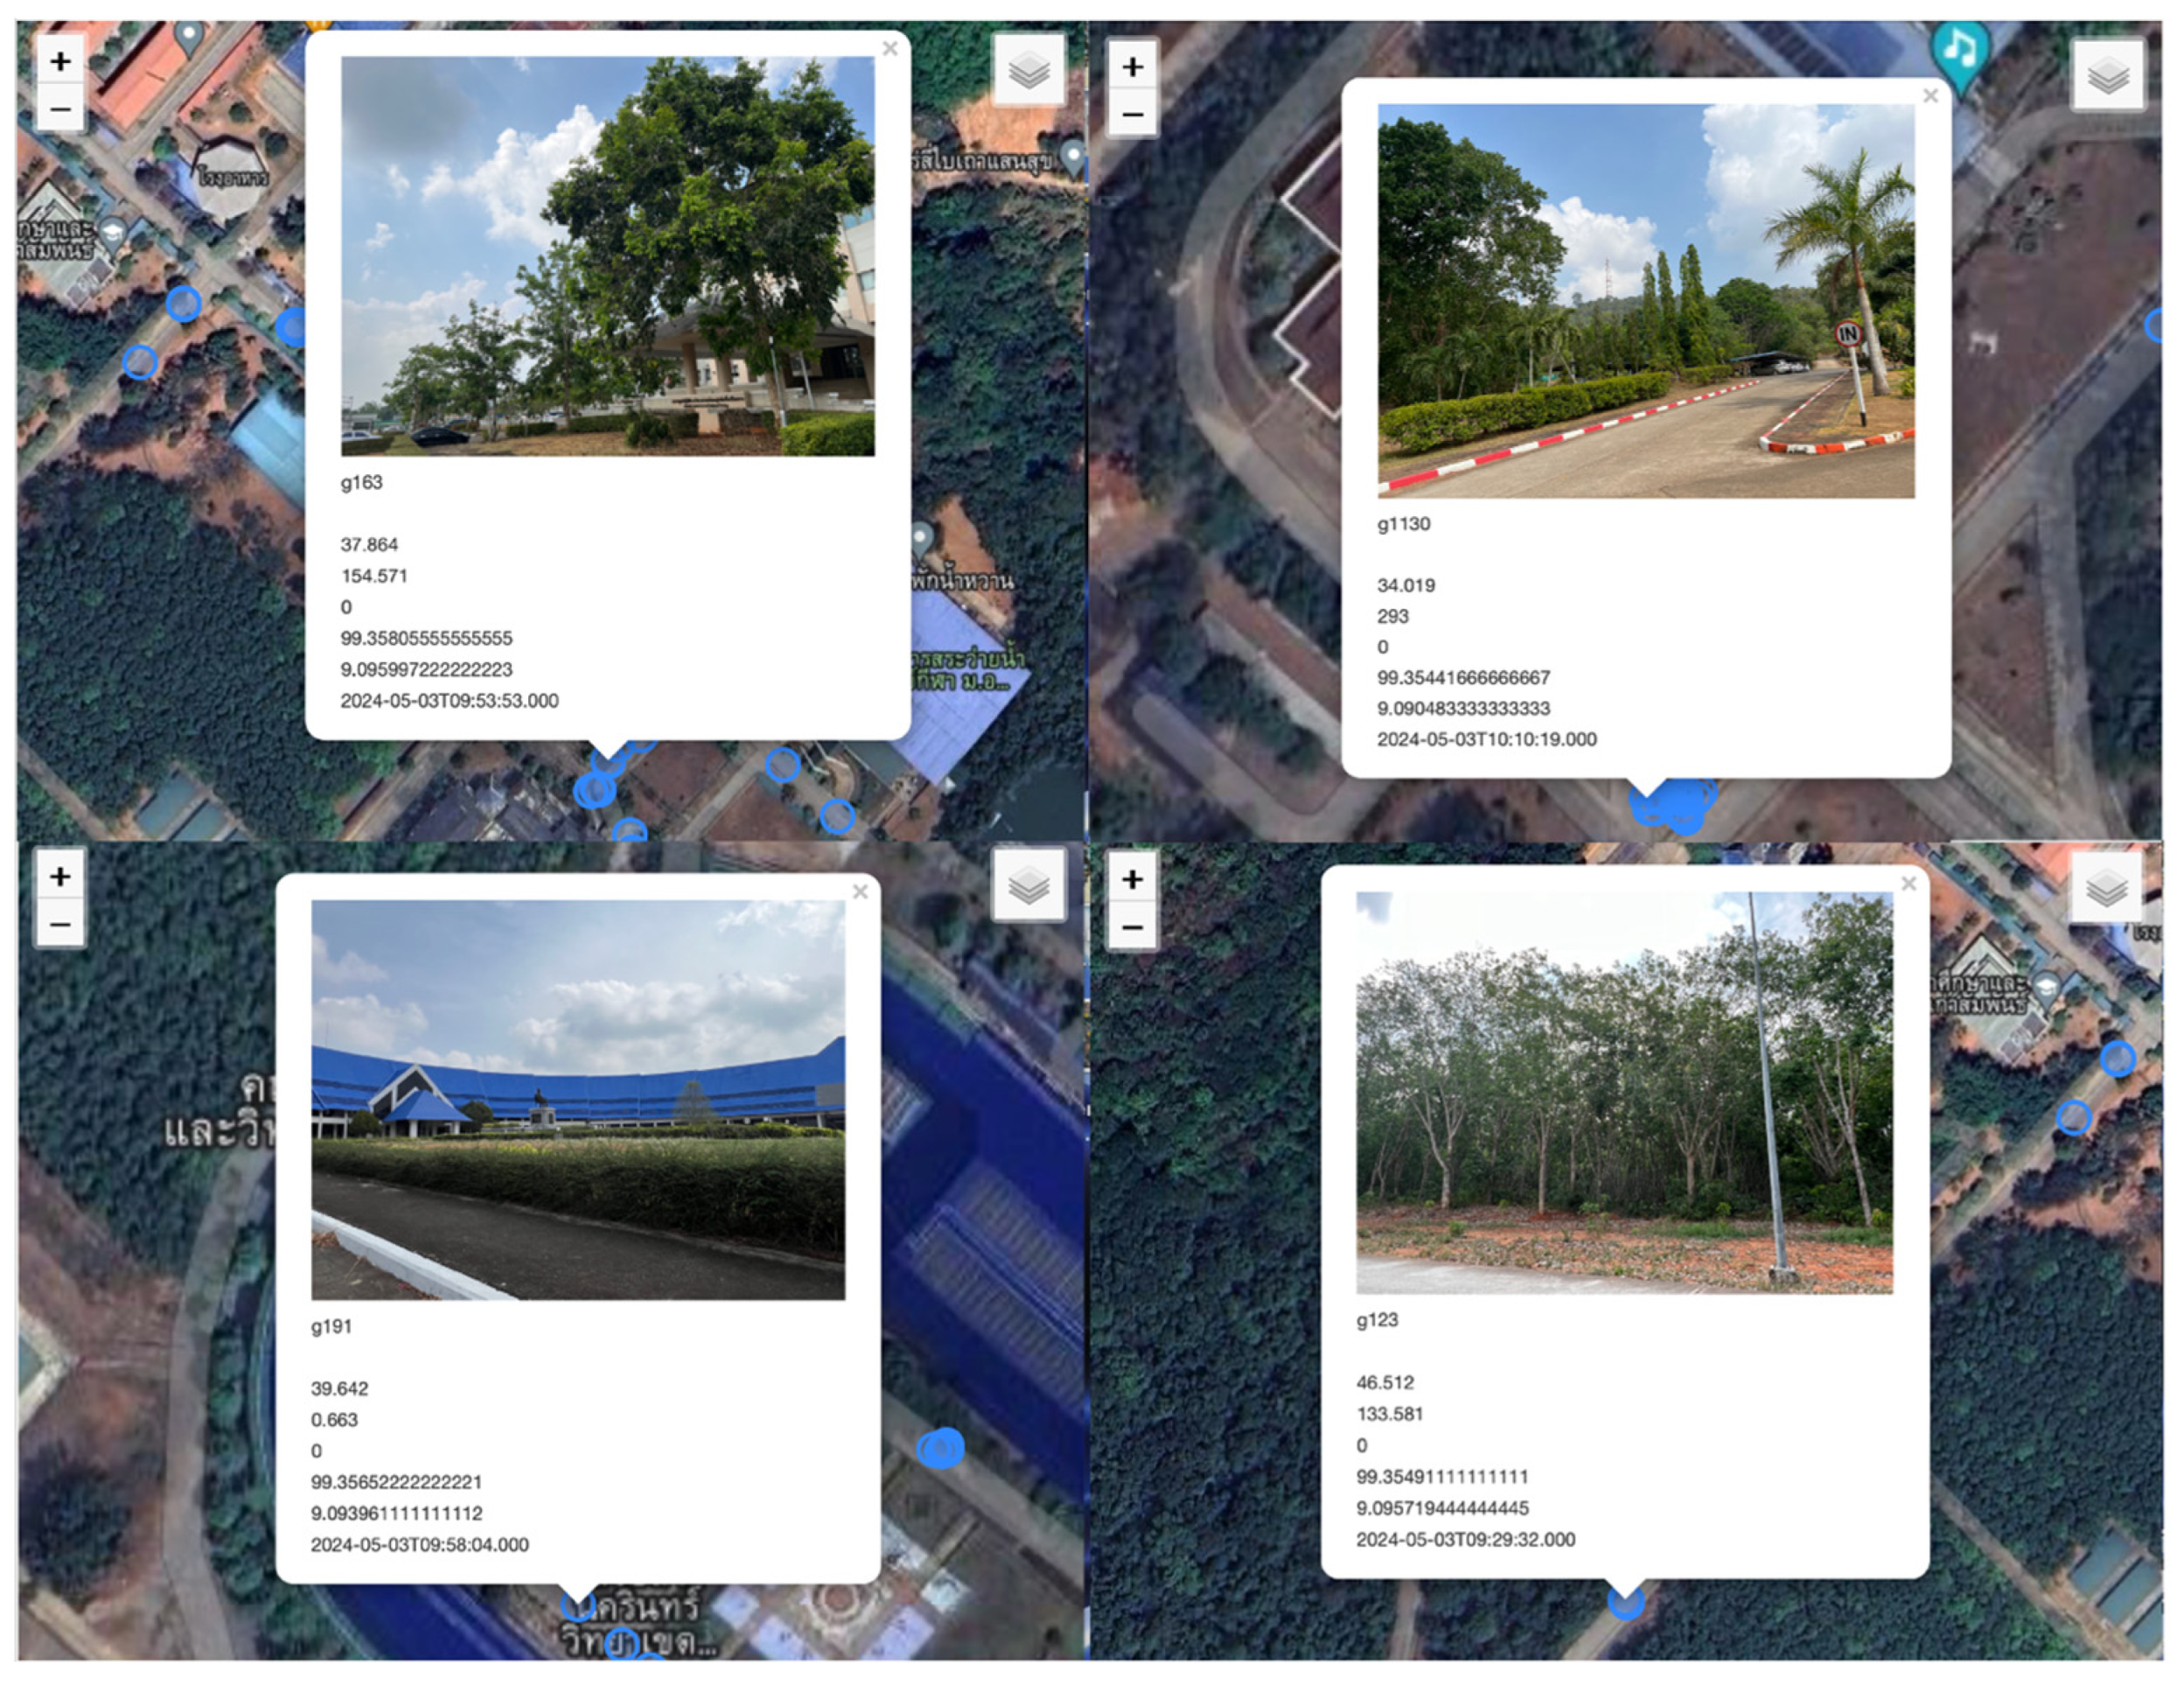
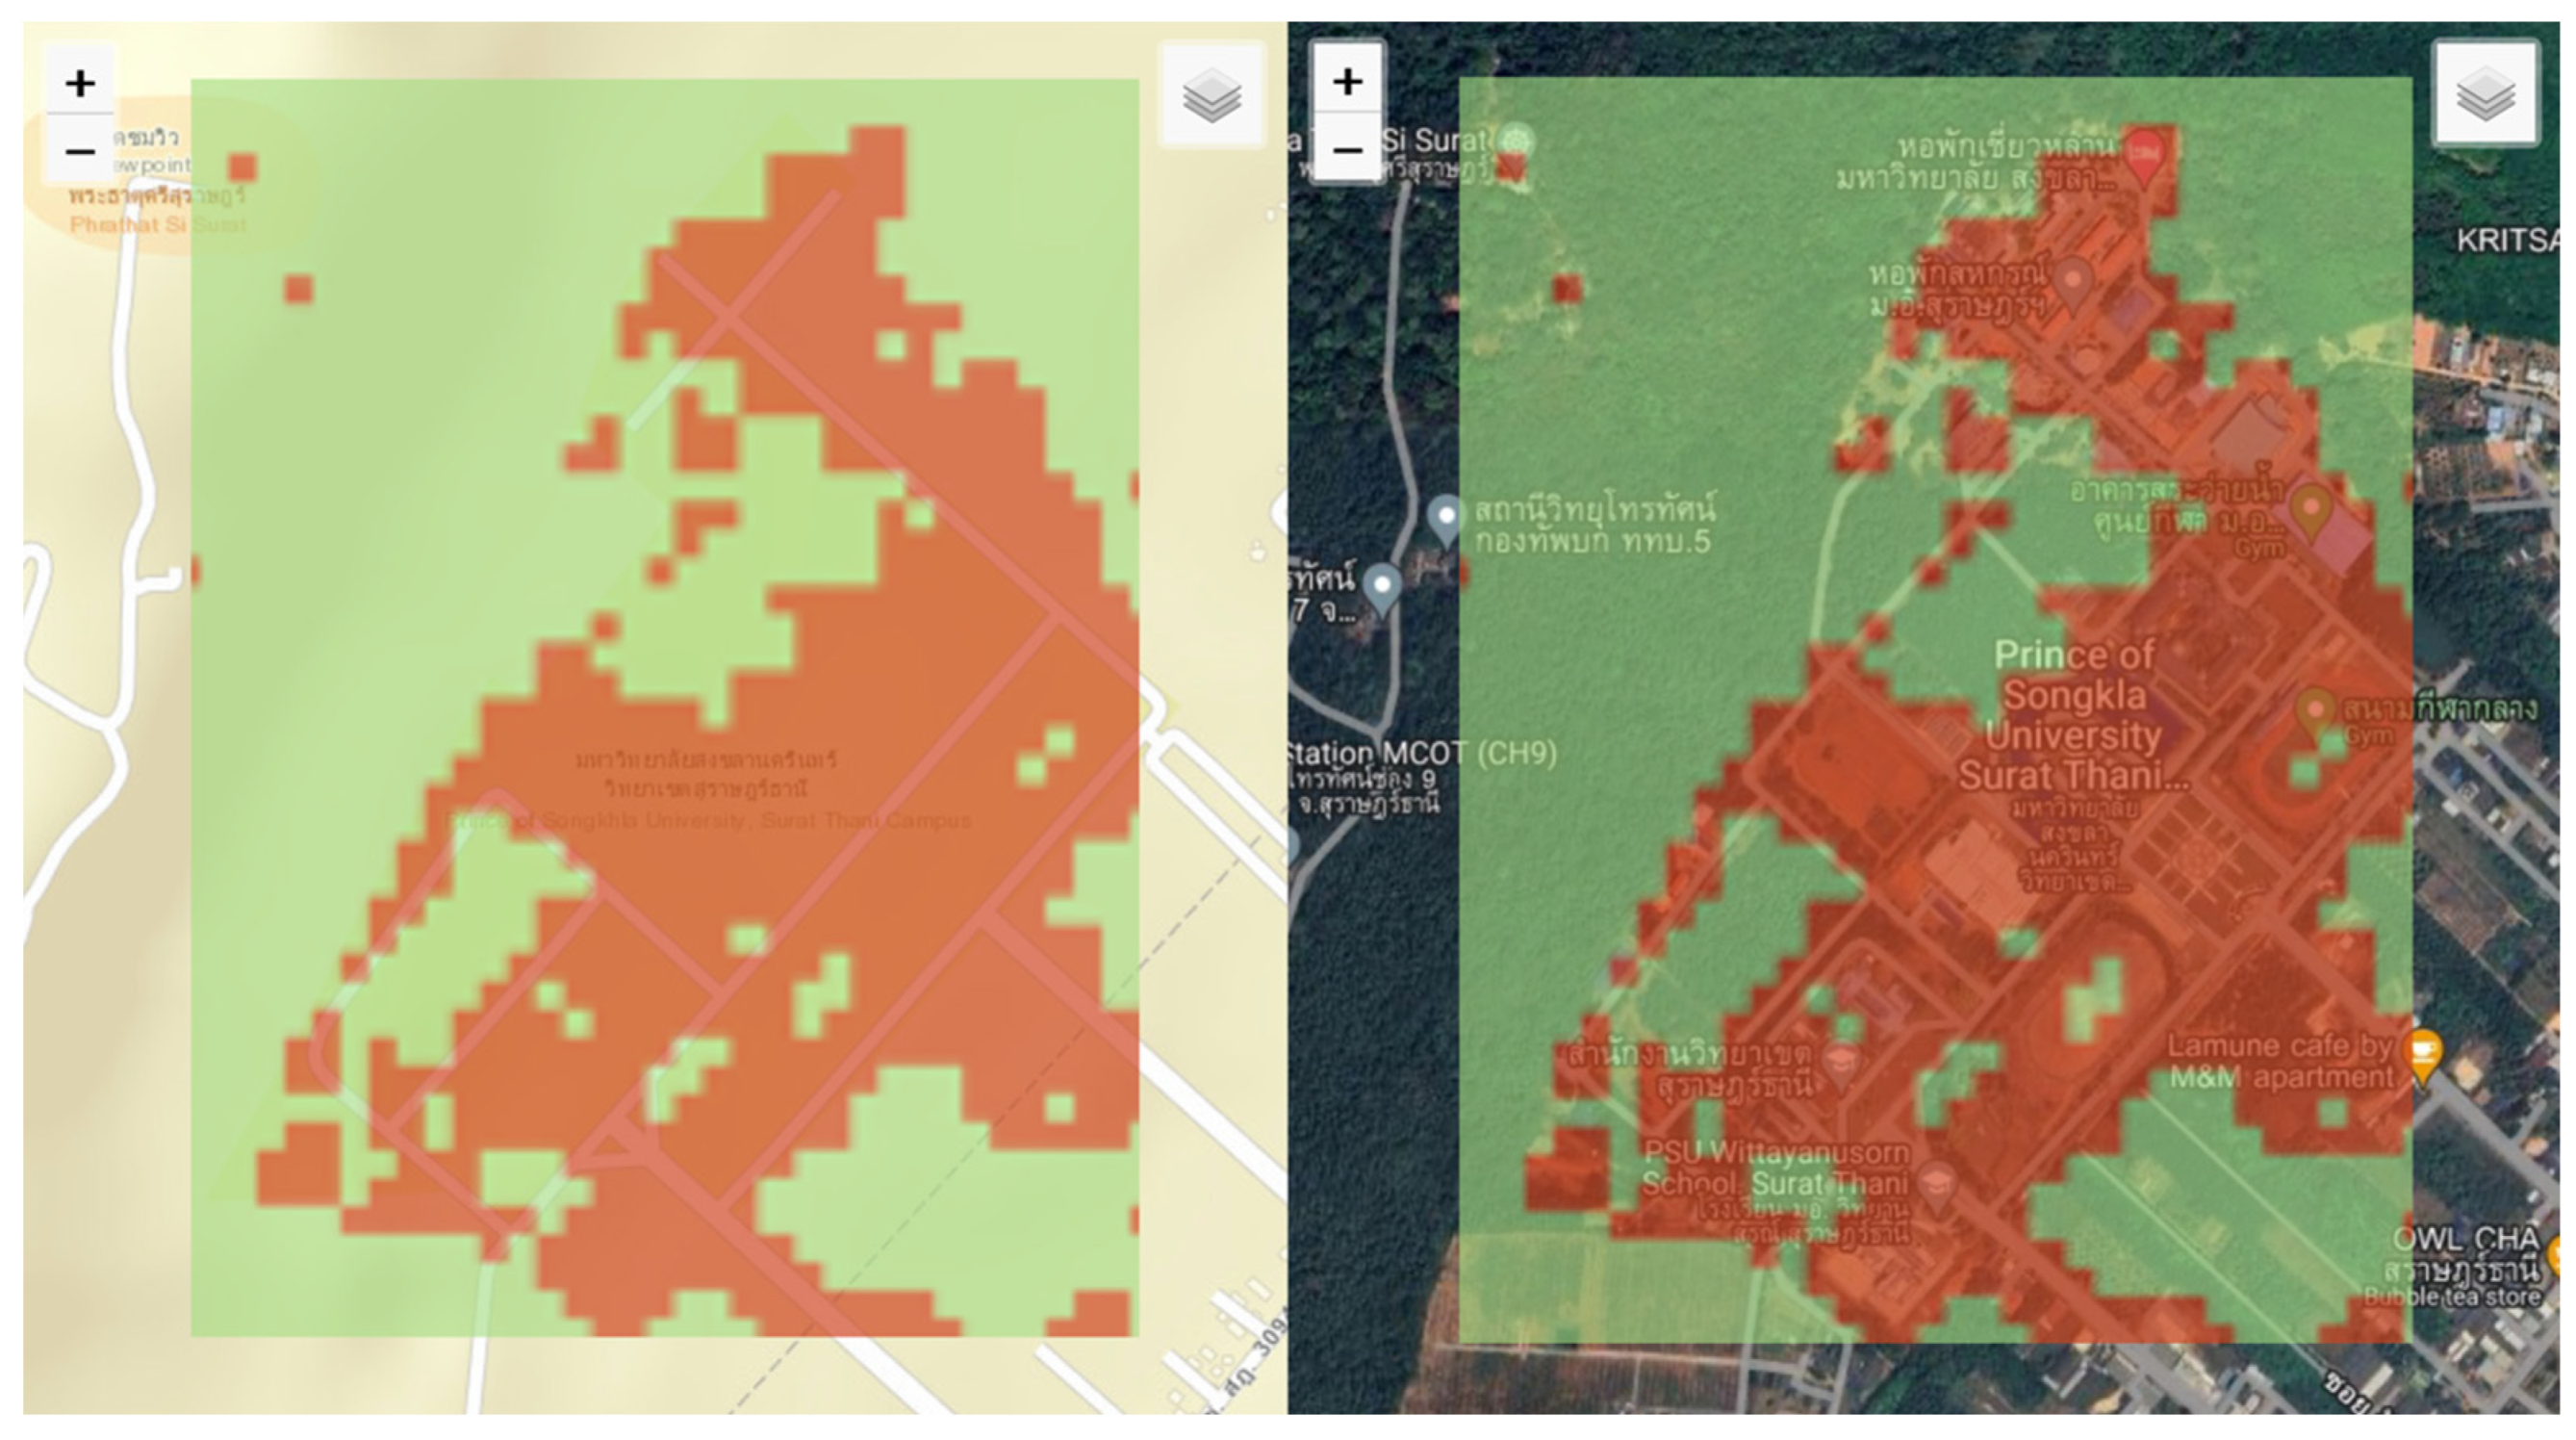
Furthermore, the application has the capacity to present the coordinates of recorded green areas or notify the users thereof, as depicted in Figure 17. This information is displayed in a map format, where numbers within yellow and green circles represent recorded green areas stored in the database. These records undergo verification utilizing a deep learning model to ascertain the presence of green areas within the captured images. The accompanying image on the right showcases a map delineating green areas within each region. Users can access the coordinates of each green space by selecting individual pins or markers, as illustrated in Figure 18. In this study, Landsat-8 satellite imagery was processed to assess greenness, with SVM employed for classification into green and non-green areas. The outcomes of this analysis are illustrated in Figure 19, which presents classification results superimposed onto ESRI and Google Hybrid maps. Red pixels denote non-green areas, while green pixels represent green spaces. Analysis findings indicate that the university area comprises green spaces accounting for 57.87% of the total area, with building areas accounting for 42.13%. Nonetheless, limitations persist due to the resolution of satellite images, leading to challenges in distinguishing small green areas. To address this, the study integrates ground-truthing through smartphone-captured green space photography and deep learning processing, yielding green space data reflective of real-world conditions. This data can serve as a foundation for developing support and management tools aimed at facilitating the efficient transition towards a green office or organization.

Figure 17.
Visualization of green space data using cluster markers.

Figure 18.
Green space data visualization.

Figure 19.
Green space classification results using satellite images.
To address the limitations of Landsat 8 imagery for detailed green space monitoring, particularly due to its medium spatial resolution (30 m), integrating ground-truthing with smartphone photography presents a complementary approach. Ground-truthing involves collecting real-world data to validate and enhance the accuracy of satellite image classifications. This approach offers the following advantages:
Improved spatial detail: Smartphone photography allows for the capture of high-resolution images of specific areas, providing detailed information that Landsat 8 imagery may not capture, particularly in small or complex green spaces such as urban parks, gardens, or areas near buildings. By comparing high-resolution smartphone images with satellite data, researchers can more effectively classify smaller or fragmented green spaces that may not be visible or accurately classified using Landsat 8 data alone.
Temporal flexibility: Smartphones enable real-time or on-demand data collection, making it possible to capture seasonal variations in vegetation or monitor short-term changes that the 16-day revisit cycle of Landsat imagery might miss. This capability is particularly valuable in monitoring areas that undergo rapid changes due to urbanization, seasonal vegetation growth, or other environmental factors.
One significant challenge is the need for personnel to physically capture photos using smartphones and then process the data. This introduces limitations in terms of time and human resources required for data collection and processing. Moreover, large-scale ground-truthing efforts may not be feasible due to logistical constraints, particularly in larger or more remote areas.
This study conducted a usability test involving three distinct user groups: lecturers/staff, executives, and administrators, with a total of 15 participants. The evaluation focused on five key usability dimensions: simplicity and ease of use, font size appropriateness, dashboard clarity and understanding, appropriate data visualization, and system response time. Participants rated each aspect on a 5-point Likert scale, with a score of 5 representing the highest level of satisfaction. The usability dimensions were assessed based on the feedback from the participants. The mean and standard deviation values for each dimension are presented in Table 3.
Table 3.
Usability testing results.
As shown in Table 3, the system response time and appropriate data visualization received the highest mean scores, each at 4.73, indicating that users particularly valued the system’s quick responsiveness and the clarity of its data presentation. In contrast, simplicity and ease of use, along with font size appropriateness, both received a mean score of 4.60, reflecting generally positive user experiences but with opportunities for further refinement. The relatively low standard deviations, ranging from 0.43 to 0.51, suggest a high level of consistency in user experiences across the different participant groups. This indicates that the platform’s usability features function reliably across a variety of user demographics.
Based on the results of developing an application tailored for managing printing, photocopying, and digital file usage data, along with the subsequent analysis and classification of green areas employing GIS and machine learning techniques, it is evident that the application facilitates data processing and presentation conducive to green office management within the Faculty of Science and Industrial Technology at Prince of Songkla University, Surat Thani Campus. This advancement addresses and rectifies limitations identified in previous research [27,28,31], encompassing diverse issues such as cross-platform compatibility, automated data retrieval from printer databases, and the capability to import files for non-network printers. Notably, the application enables the calculation of the carbon footprint resulting from printing and photocopying activities, along with tracking data pertaining to the printing and photocopying volumes of individual personnel. Moreover, this research integrates the development of an application aimed at analyzing and monitoring green areas within the study area, facilitating the management of green area information. Consequently, these endeavors contribute to fostering a more environmentally stable organizational milieu conducive to mitigating global warming and advancing towards the realization of low-carbon organizational objectives aligned with sustainable development goals.
While this study focuses on the analysis and classification of green spaces at Prince of Songkla University, Surat Thani Campus, the methodologies and applications developed for calculating carbon footprints and classifying green areas can be extended to other faculties and universities. The general approach used in this research provides a framework that can be adapted to different types of organizations with varying data structures, sustainability goals, and resource consumption patterns. However, the generalizability of the results depends on the following key factors:
- Organizational structure: Different organizations may have unique operational setups, resource consumption profiles, and sustainability practices. Adapting this platform to other settings requires customization based on specific organizational processes, such as resource usage frequency and reporting intervals (daily, weekly, monthly, etc.).
- Geographical and environmental differences: The performance of classification techniques, particularly NDVI and SVM, can vary across different geographical regions due to variations in vegetation types, climate, and environmental conditions. In this study, combining NDVI with SVM improved green space classification accuracy, especially during the dry season. However, when applying this approach in other regions, it is important to consider the vegetation type and seasonal patterns. For example, SVM may require retraining in regions with deciduous plants, as their seasonal behavior differs from that of evergreen species. Additionally, incorporating multi-temporal data ensures that the model can adapt to these variations, further enhancing classification accuracy. Future work should validate this approach in diverse climates and vegetation types to optimize performance.
- Carbon footprint metrics: The carbon footprint formulas and emission factors may vary based on regional practices, different energy consumption standards, and the types of activities specific to the organization. Custom equations may need to be developed to reflect the unique characteristics of each organization.
- Data availability: The availability of accurate and real-time data is crucial to the platform’s effectiveness. Organizations that lack detailed data on activities such as printing, photocopying, or energy usage may face difficulties in applying the platform without modifying their data collection practices.
By considering these factors, the methods and tools developed in this research can be applied as a flexible framework for organizations aiming to calculate carbon footprints and manage green spaces. Future studies could explore adapting this framework to different types of institutions or regions with diverse environmental and operational characteristics.
The integration of carbon footprint data from printing and photocopying activities with green space analysis provides organizations with a powerful tool for making informed sustainability decisions. The ability to monitor carbon emissions from internal operations while simultaneously assessing the carbon absorption capabilities of managed green spaces enables a more holistic approach to sustainability. By comparing these datasets, organizations can evaluate the trade-offs between reducing carbon emissions through operational changes (e.g., reducing printing) and increasing investment in green space initiatives to offset emissions. This integrated approach fosters a deeper understanding of the environmental impact of internal activities and supports more effective decision making aimed at minimizing environmental footprints.
4. Conclusions
This study introduces the development of a comprehensive platform that integrates digital image processing, satellite imagery, GIS technology, and machine learning to manage data related to printing and photocopying activities, calculate carbon footprints, and monitor green areas. The following key outcomes and future research directions are summarized:
- Platform efficiency: The platform automates carbon footprint calculations for office printing and photocopying, providing organizations with real-time, accurate assessments of their environmental impact. It effectively addresses limitations found in previous systems by enabling precise, streamlined analyses of both office activities and green space data.
- Environmental impact: By improving data management related to paper consumption, the platform helps organizations reduce their carbon footprints, decrease paper usage, and ultimately contribute to deforestation prevention. This reduction plays a crucial role in mitigating the effects of global warming, offering actionable solutions for both organizations and environmental stakeholders.
- Green office alignment: The platform’s ability to monitor green spaces supports organizations in aligning with sustainable development goals. By incorporating real-time monitoring of carbon footprints, the system encourages the implementation of green office initiatives that contribute to more eco-friendly and productive work environments.
- Future development: The platform’s capabilities should be expanded to include other carbon-generating activities, such as energy consumption. Adding such functionalities would enhance the platform’s ability to provide a holistic view of an organization’s environmental impact, allowing for more targeted and effective sustainability strategies. However, challenges to be expected include dealing with differences in data formats from multiple data sources and the need to customize the system to support different data standards. Additionally, ensuring data accuracy and integrating systems from multiple sources can take time, requiring good coordination between development teams and data providers.
- Integration with IoT: The application of Internet of things (IoT) technology should be explored in future research. IoT sensors could automatically track and monitor office electricity consumption and other energy use. This real-time data integration would allow for a more comprehensive analysis of office sustainability, offering actionable solutions.
In addition to the technical advancements presented in this study, future research could focus on incorporating features aimed at changing user behavior to promote more sustainable practices. For instance, integrating automatic alerts for exceeding energy or resource usage thresholds could provide real-time feedback, encouraging immediate action to reduce consumption. Furthermore, including sustainability metrics that allow users to visualize the direct impact of their actions could foster a more conscious approach to resource usage. The addition of incentive-based systems, such as reward mechanisms or comparisons with other users or departments, could enhance engagement and promote friendly competition. By incorporating these behavioral elements, future developments could transform platform functions from simply monitoring data to actively encouraging users to adopt more environmentally responsible habits.
Author Contributions
Conceptualization, S.P. and W.S.; methodology, W.S., S.P., S.C.-A., J.K., S.K., A.S. and K.P.; validation, W.S., S.P., S.C.-A., J.K., S.K., A.S. and K.P.; formal analysis, S.P. and W.S.; investigation, S.P. and W.S.; writing—original draft preparation, S.P. and W.S.; writing—review and editing, W.S., S.P., S.C.-A., J.K., S.K., A.S. and K.P.; supervision, S.P.; project administration, W.S. All authors have read and agreed to the published version of the manuscript.
Funding
This research was financially supported by Prince of Songkla University, Surat Thani Campus.
Institutional Review Board Statement
Not applicable.
Informed Consent Statement
Not applicable.
Data Availability Statement
Data are available on request to the authors.
Acknowledgments
We acknowledge the Faculty of Science and Industrial Technology, Prince of Songkla University, Surat Thani Campus, for supporting this research.
Conflicts of Interest
The authors declare no conflicts of interest.
References
- He, X.; Khan, S.; Ozturk, I.; Murshed, M. The Role of Renewable Energy Investment in Tackling Climate Change Concerns: Environmental Policies for Achieving SDG-13. Sustain. Dev. 2023, 31, 1888–1901. [Google Scholar] [CrossRef]
- Stepanov, I.; Makarov, I.; Makarova, E.; Smolovik, E. Climate Change and Challenges to Sustainable Development in the Russian Arctic. Clim. Chang. 2023, 176, 39. [Google Scholar] [CrossRef]
- Ma, M.; Wang, Q.; Liu, R.; Zhao, Y.; Zhang, D. Effects of Climate Change and Human Activities on Vegetation Coverage Change in Northern China Considering Extreme Climate and Time-Lag and Accumulation Effects. Sci. Total Environ. 2023, 860, 160527. [Google Scholar] [CrossRef] [PubMed]
- Bianchini, S.; Damioli, G.; Ghisetti, C. The Environmental Effects of the “Twin” Green and Digital Transition in European Regions. Environ. Resour. Econ. 2023, 84, 877–918. [Google Scholar] [CrossRef] [PubMed]
- Amir, M.; Deshmukh, R.G.; Khalid, H.M.; Said, Z.; Raza, A.; Muyeen, S.M.; Sopian, K. Energy Storage Technologies: An Integrated Survey of Developments, Global Economical/Environmental Effects, Optimal Scheduling Model, and Sustainable Adaption Policies. J. Energy Storage 2023, 72, 108694. [Google Scholar] [CrossRef]
- Ighalo, J.O.; Kurniawan, S.B.; Iwuozor, K.O.; Aniagor, C.O.; Ajala, O.J.; Oba, S.N.; Igwegbe, C.A. A Review of Treatment Technologies for the Mitigation of the Toxic Environmental Effects of Acid Mine Drainage (AMD). Process Saf. Environ. Prot. 2022, 157, 37–58. [Google Scholar] [CrossRef]
- Rad, M.A.V.; Kasaeian, A.; Niu, X.; Zhang, K.; Mahian, O. Excess Electricity Problem in Off-Grid Hybrid Renewable Energy Systems: A Comprehensive Review from Challenges to Prevalent Solutions. Renew. Energy 2023, 212, 538–560. [Google Scholar]
- Hussain, B.; Naqvi, S.A.A.; Anwar, S.; Usman, M. Effect of Wind and Solar Energy Production, and Economic Development on the Environmental Quality: Is This the Solution to Climate Change? Gondwana Res. 2023, 119, 27–44. [Google Scholar] [CrossRef]
- Chen, X.H.; Tee, K.; Elnahass, M.; Ahmed, R. Assessing the Environmental Impacts of Renewable Energy Sources: A Case Study on Air Pollution and Carbon Emissions in China. J. Environ. Manag. 2023, 345, 118525. [Google Scholar] [CrossRef]
- Sharma, A.K.; Sharma, M.; Sharma, A.K.; Sharma, M. Mapping the Impact of Environmental Pollutants on Human Health and Environment: A Systematic Review and Meta-Analysis. J. Geochem. Explor. 2023, 225, 107325. [Google Scholar] [CrossRef]
- Kumar, P.; Singh, A.B.; Arora, T.; Singh, S.; Singh, R. Critical Review on Emerging Health Effects Associated with the Indoor Air Quality and Its Sustainable Management. Sci. Total Environ. 2023, 872, 162163. [Google Scholar] [CrossRef] [PubMed]
- Wang, S.; Abbas, J.; Sial, M.S.; Álvarez-Otero, S.; Cioca, L.I. Achieving Green Innovation and Sustainable Development Goals through Green Knowledge Management: Moderating Role of Organizational Green Culture. J. Innov. Knowl. 2022, 7, 100272. [Google Scholar] [CrossRef]
- Khan, P.A.; Johl, S.K.; Akhtar, S. Firm Sustainable Development Goals and Firm Financial Performance through the Lens of Green Innovation Practices and Reporting: A Proactive Approach. J. Risk Financ. Manag. 2021, 14, 605. [Google Scholar] [CrossRef]
- Montesano, F.S.; Biermann, F.; Kalfagianni, A.; Vijge, M.J. Can the Sustainable Development Goals Green International Organisations? Sustainability Integration in the International Labour Organisation. J. Environ. Policy Plan. 2023, 25, 1–15. [Google Scholar] [CrossRef] [PubMed]
- Husin, A.E.; Kristiyanto, K.; Sinaga, L.; Arif, E.J. Analysis of Critical Factors Affecting Green Office Retrofits Based on the Latest Green Building Regulations in Indonesia. J. Infrastruct. Policy Dev. 2024, 8, 3790. [Google Scholar] [CrossRef]
- Rakhmetullina, S.; Shaimardanov, Z.; Petrova, O.; Idrisheva, Z.; Kolpakova, V.; Apseitova, A. Green Metrics Questionnaire as the Basis of Green University Strategy. In IOP Conference Series: Earth and Environmental Science, Proceedings of the 8th International Workshop on UI GreenMetric World University Rankings (IWGM 2022), Taiwan, China, 27–29 September 2022; IOP Publishing: Bristol, UK, 2023; Volume 1194, p. 012011. [Google Scholar]
- Huang, W.; Lin, G. The Relationship between Urban Green Space and Social Health of Individuals: A Scoping Review. Urban For. Urban Green. 2023, 85, 127969. [Google Scholar] [CrossRef]
- Nkini, S.; Nuyts, E.; Kassenga, G.; Swai, O.; Verbeeck, G. Comparative Analysis of the Energy Performance in Green and Non-Green Office Buildings in Dar Es Salaam, Tanzania. Energy Build. 2023, 293, 113202. [Google Scholar] [CrossRef]
- Barrutieta, X.; Kolbasnikova, A.; Irulegi, O.; Hernández, R. Energy Balance and Photovoltaic Integration in Positive Energy Buildings: Design and Performance in Built Office Case Studies. Archit. Sci. Rev. 2023, 66, 26–41. [Google Scholar] [CrossRef]
- Noubissie Tientcheu, S.I.; Chowdhury, S.P.; Olwal, T.O. Intelligent Energy Management Strategy for Automated Office Buildings. Energies 2019, 12, 4326. [Google Scholar] [CrossRef]
- Indarja, I.; Herawati, R.; Fachrani, K.F. Fulfillment of Green Open Space by the Regional Office in Semarang City. In IOP Conference Series: Earth and Environmental Science, Proceedings of the 3rd International Conference on Law, Economics, and Governance: Progressive Law in The Midst of Climate Change, Semarang, Indonesia, 5 April 2023; IOP Publishing: Bristol, UK, 2023; Volume 1270, p. 012002. [Google Scholar]
- Eshetu, S.B.; Yeshitela, K.; Sieber, S. Urban Green Space Planning, Policy Implementation, and Challenges: The Case of Addis Ababa. Sustainability 2021, 13, 11344. [Google Scholar] [CrossRef]
- Dewiyana, H.; Sumardiyono, B. Application of the Concept of Eco Office Building at Library of Users Universitas Sumatera Utara. In Proceedings of the Third Workshop on Multidisciplinary and Its Applications, WMA-3 2019, Medan, Indonesia, 11–14 December 2019. [Google Scholar]
- Ong, Y.S.; Yusof, N.A.; Osmadi, A. Challenges of Green Office Implementation: A Case Study in Penang, Malaysia. Int. J. Sustain. Constr. Eng. Technol. 2021, 12, 153–163. [Google Scholar]
- Aroonsrimorakot, S.; Laiphrakpam, M.; Korattana, C. Green Office, Its Features and Importance for Sustainable Environmental Management: A Comparative Review in Search for Similarities and Differences. Interdiscip. Res. Rev. 2019, 14, 31–38. [Google Scholar]
- Wang, W.; Chi, J.; Niu, S. Application of Green Plant Elements in Office Space. In Proceedings of the SHS Web of Conferences; EDP Sciences: Les Ulis, France, 2023; Volume 167, p. 02009. [Google Scholar]
- Dewi, N.P.S.P.; Ginaya, G.; Triyuni, N.N. Implementation of Green Office Management Policy in Human Resources Department of Anantara Uluwatu Bali Resort. Repositori Politeknik Negeri Bali. 2022. Available online: http://repository.pnb.ac.id/id/eprint/4271 (accessed on 1 May 2024).
- Kim, J.; Kim, Y.; Oh, S.; Kim, T.; Lee, D. Estimation of Environmental Impact of Paperless Office Based on Simple Model Scenarios. Int. J. Sustain. Build. Technol. Urban Dev. 2021, 12, 44–60. [Google Scholar]
- Yousufi, M.K. Exploring Paperless Working: A Step Towards Low Carbon Footprint. Eur. J. Sustain. Dev. Res. 2023, 7, em0228. [Google Scholar] [CrossRef]
- Mohamed, H.A.B.; Mohamad, M.H.; Ab Ghani, S.; Baker, R.; Lamin, K.; Mohaiyadin, N.M.; Mardzuki, K. The Application of Paperless and Green Theory in National Defence University of Malaysia: A Conceptual Study. J. Pertahanan 2020, 6, 37–45. [Google Scholar] [CrossRef]
- Mayyalgan, N.A.P.; Majid, M.A.; Toh, M.Z.; Bakar, N.A.A.; Shehadeh, A.; Otoom, M. Mobile-Based Green Office Management System Dashboard (GOMASH) for Sustainable Organization. In Proceedings of the International Conference on Information Systems and Intelligent Applications; Springer: Cham, Switzerland, 2021; pp. 581–591. [Google Scholar]
- Coroian, I.; Nap, M.; Pop, I.; Matei, F.; Sălăgean, T.; Deak, J.; Ficior, D. Using GIS Analysis to Assess Urban Green Space in Terms of Real Estate Development. Bull. Univ. Agric. Sci. Vet. Med. Cluj-Napoca Hortic. 2021, 78, 36–40. [Google Scholar] [CrossRef]
- Jantakat, Y.; Muankhamla, A.; Konkratok, Y.; Juntakut, P. Analysis of Sustainable Green Areas in Rajamangala University of Technology Isan. Arch. J. 2023, 36, 115–134. [Google Scholar]
- Puttinaovarat, S.; Horkaew, P. A Geospatial Platform for Crowdsourcing Green Space Area Management Using GIS and Deep Learning Classification. ISPRS Int. J. Geo-Inf. 2022, 11, 208. [Google Scholar] [CrossRef]
- Chen, Y.; Weng, Q.; Tang, L.; Liu, Q.; Zhang, X.; Bilal, M. Automatic Mapping of Urban Green Spaces Using a Geospatial Neural Network. GISci. Remote Sens. 2021, 58, 624–642. [Google Scholar] [CrossRef]
- Stessens, P.; Canters, F.; Khan, A.Z. Exploring Options for Public Green Space Development: Research by Design and GIS-Based Scenario Modelling. Sustainability 2021, 13, 8213. [Google Scholar] [CrossRef]
- Lygum, V.L.; Dupret, K.; Bentsen, P.; Djernis, D.; Grangaard, S.; Ladegaard, Y.; Troije, C.P. Greenspace as Workplace: Benefits, Challenges and Essentialities in the Physical Environment. Int. J. Environ. Res. Public Health 2023, 20, 6689. [Google Scholar] [CrossRef] [PubMed]
- Moisa, M.B.; Merga, B.B.; Deribew, K.T.; Feyissa, M.E.; Gurmessa, M.M.; Gemeda, D.O. Urban Green Space Suitability Analysis Using Geospatial Techniques: A Case Study of Addis Ababa, Ethiopia. Geocarto Int. 2023, 38, 2213674. [Google Scholar] [CrossRef]
- Zhukova, M.; Atkina, L.; Rakhmatullina, I. Modern Approach to Inventory of Urban Green Spaces Using GIS-Technologies (In Terms of the City of Rostov-on-Don). In IOP Conference Series: Earth and Environmental Science, Proceedings of the VI All-Russian Science and Technology Conference: Forests of Russia: Politics, Industry, Science, Education (FR 2021), St. Petersburg, Russia, 26–28 May 2021; IOP Publishing: Bristol, UK, 2021; Volume 876, p. 012086. [Google Scholar]
- Buchavyi, Y.; Lovynska, V.; Samarska, A. A GIS Assessment of the Green Space Percentage in a Big Industrial City (Dnipro, Ukraine). Ekológia 2023, 42, 89–100. [Google Scholar] [CrossRef]


Disclaimer/Publisher’s Note: The statements, opinions and data contained in all publications are solely those of the individual author(s) and contributor(s) and not of MDPI and/or the editor(s). MDPI and/or the editor(s) disclaim responsibility for any injury to people or property resulting from any ideas, methods, instructions or products referred to in the content. |
© 2024 by the authors. Licensee MDPI, Basel, Switzerland. This article is an open access article distributed under the terms and conditions of the Creative Commons Attribution (CC BY) license (https://creativecommons.org/licenses/by/4.0/).