Article

Research on the Application of Conjoint Analysis in Carbon Tax Pricing for the Sustainable Development Process of China

1
Faculty of Civil and Environmental Engineering, Harbin Institute of Technology, Shenzhen 518055, China
2
Faculty of Environmental Engineering, The University of Kitakyushu, Kitakyushu 802-8577, Japan
3
School of Architecture and Urban Planning, Shenzhen University, Shenzhen 518060, China
4
The Institute of Sustainable Development, Macau University of Science and Technology, Macau, China
*
Author to whom correspondence should be addressed.
Sustainability 2024, 16(21), 9407; https://doi.org/10.3390/su16219407
Submission received: 26 August 2024 / Revised: 25 October 2024 / Accepted: 28 October 2024 / Published: 30 October 2024
(This article belongs to the Section Economic and Business Aspects of Sustainability)

Abstract

:
This study aims to evaluate the preferences of Shanghai residents for four key attributes of carbon tax policies via the choice-based conjoint analysis method, with the goal of understanding the potential application of carbon tax policies in China. The findings indicate that the most critical concern for Shanghai residents is the annual cost of the ca trbonax (48.87%), followed by policy transparency (24.72%), revenue allocation (16.68%), and policy implementers (9.73%). The average willingness to pay is CNY 1435.28 annually, indicating a relatively high acceptance of carbon tax policies. Furthermore, increasing public awareness of carbon tax policies significantly enhances willingness to pay, which in turn helps increase tax revenue and promotes the development of low-carbon technologies. This study provides valuable insights for policymakers on carbon tax implementation, contributing to China’s transition to a low-carbon economy.

1. Introduction

Sustainability is closely linked to carbon taxation. As an economic tool, carbon taxes incentivize businesses and individuals to reduce carbon emissions by increasing fossil fuel prices, thereby mitigating environmental impacts and promoting sustainability. However, despite the global adoption of carbon tax policies, China has been cautious in their implementation. Studies have shown that public acceptance of carbon tax policies is closely tied to willingness to pay (WTP). Therefore, this study sought to address the following key questions: How effective is carbon taxation in the context of China’s economy? What is the public’s willingness to pay for a carbon tax? How do transparency and revenue allocation impact public acceptance of carbon taxation? Through a survey of Shanghai residents, this study aimed to explore these questions and provide policy recommendations for the implementation of carbon tax policies in China.
Climate change is closely related to human activities. Currently, global warming, which is mainly caused by massive emissions of greenhouse gasses, has dramatically affected human life and production [1]. To solve the many environmental and social problems caused by excessive greenhouse gas emissions, all countries need to make contributions, especially those countries with high emissions, such as the United States and China. As one of the major carbon-emitting countries in East Asia, China has a large population as well as processing plants that produce various products and vehicles that use a lot of fossil fuels. From 2000 to 2020, China’s carbon emissions increased from 3695.17 million tons to 9364.16 million tons, and China surpassed the European Union and the United States to become the world’s largest carbon emitter [2]. In 2020, the Chinese government announced that its carbon emissions will peak by 2030, and China will achieve carbon neutrality by 2060 [3]. For a country with such high carbon emissions, this is such a difficult goal to achieve such that some adjustments will have to be made to China’s various development policies. Whether based on developmental or environmental goals, limiting domestic carbon emissions has become one of the main goals of Chinese policymakers [4]. To reduce carbon emissions and eventually achieve carbon neutrality, many methods have been used worldwide, but they can be divided into two main categories: technical means and policy means. Technical means refer to new technical developments such as energy-saving technology, clean energy technology, carbon capture and storage, and new materials. Policy means include a range of tools at the government’s disposal to control greenhouse gas (GHG) emissions, including regulations, information programs, innovation policies, environmental subsidies, and taxes. Environmental taxes are highly regarded by the Organization for Economic Cooperation and Development (OECD) because of their important advantages in terms of efficiency, revenue generation, and policy transparency [5].
Economists, scientists, and governments have highlighted the important role of carbon pricing, including carbon taxes and emission trading, in limiting carbon emissions [6,7,8]. Focusing on carbon taxes, scholars have assessed the practical utility and social implications of carbon taxes through theoretical and empirical research while targeting different countries. Tax credits and deduction changes to motor fuel taxes have been discussed using the US as an example [9]. McEldowney and Salter examined environmental taxes in the UK to address the impacts of climate change and provide policy recommendations to support the design of environmental taxes in the UK, taking into account climate change taxes, carbon and energy taxes, transport taxes, congestion taxes, and road taxes [10]. Shmelev and Speck conducted an empirical econometric assessment of the effectiveness of a Swedish environmental policy on energy and carbon taxes and confirmed the role of environmental taxes as a practical policy tool to effectively reduce carbon emissions [11]. Ionescu noted the importance of achieving carbon peaking and carbon neutrality for achieving sustainable development and explained why carbon taxes, as part of the current environmental tax, are receiving much attention in policy development [12].
However, there are also several obstacles to the successful implementation of a carbon tax policy. Opposition from vested interests and lobbying efforts among the public will likely prevent successful implementation. Understanding the policy’s public acceptance is critical for policymakers to implement environmental policies. Public opposition directly led to the rejection of carbon taxes by voting in Washington State in 2016 and 2018, and violent protests against higher fuel taxes to reduce carbon emissions in France in 2018 [13]. Environmental taxation is still a new term for the Chinese public. Rushing into a policy related to a carbon tax without presurveying public acceptance would be a dangerous move that would undermine the government’s credibility.
Investigating the Chinese public’s willingness to pay carbon tax is essential for the implementation of a carbon pricing policy to promote the process of carbon neutrality in China. This study designed a questionnaire based on a conjoint analysis method and collected data from 805 respondents to understand the acceptance of carbon tax policies by Chinese people from different backgrounds to support carbon tax policymakers.
The structure of this paper is as follows. Section 2 reviews the relevant literature. Section 3 introduces the experimental method and specific process of the conjoint analysis method. The experimental results are discussed in Section 4. The willingness of the Chinese public to pay for carbon taxes is discussed and the conclusions of other scholars are discussed. We summarize our experimental conclusions and elaborate them in Section 5.

2. Literature Review

2.1. International Experience with Carbon Emission Policies

Global warming is driven primarily by massive emissions of greenhouse gasses [1]. To address the environmental and social issues caused by excessive greenhouse gas emissions, numerous countries have implemented carbon emission policies. The OECD [5] highlights that environmental taxes, including carbon taxes, are highly regarded for their efficiency, revenue generation, and policy transparency. Economists, scientists, and governments have emphasized the significant role of carbon pricing, including carbon taxes and emission trading, in limiting carbon emissions [6,7,8].
In the United States, studies have shown that adjusting fuel taxes can effectively promote the development of a low-carbon economy [14]. The UK’s environmental tax policies have provided valuable lessons for combating climate change and have offered policy recommendations for designing effective carbon taxes [10]. Sweden’s carbon tax policy has achieved remarkable success in reducing carbon emissions while fostering the development of low-carbon technologies [11]. Similarly, carbon tax implementations in South Africa and Australia have demonstrated varying economic and social impacts, providing a diverse set of outcomes for policymakers to consider [15]. These international experiences offer valuable insights and reference points for designing effective carbon tax policies in China.

2.2. Current Status and Challenges of China’s Carbon Tax Policy

China, as one of the largest carbon emitters in East Asia, has seen a significant increase in carbon emissions from 3405.2 million tons in 2000 to 9899 million tons in 2020, surpassing both the European Union and the United States in becoming the world’s largest carbon emitter [16]. In 2020, the Chinese government announced its commitment to peak carbon emissions by 2030 and achieving carbon neutrality by 2060 [3]. Despite these ambitious goals, the implementation of carbon tax policies in China remains cautious, primarily due to concerns about policy effectiveness and public acceptance [4].
Compared with countries such as Sweden, which have successfully implemented transparent and efficient carbon tax policies, China faces unique challenges. The primary obstacles include low public awareness and acceptance of carbon tax policies, as well as the need for transparent policy implementation processes [12]. Additionally, China’s vast population and regional economic disparities add complexity to the design and implementation of uniform carbon tax policies across different regions.

2.3. Relationship Between Willingness to Pay and Carbon Tax Acceptance

The success of carbon tax policies largely depends on public acceptance, which is closely linked to the willingness to pay (WTP) for such taxes. The WTP is a crucial metric for measuring the acceptance of carbon tax policies. Tsang and Burge [17] argued that the WTP reflects individuals’ subjective evaluation of the welfare benefits from carbon reduction, which may exceed the marginal social or abatement costs. Alberini et al. [18] reported that the average WTP to avoid one ton of CO2 emissions is EUR 94 in the Czech Republic and EUR 133 in Italy. Similarly, Kotchen et al. [19] reported that the average American is willing to pay USD 144 for a fossil fuel tax.
There is extensive literature describing the WTP for carbon taxes [20,21,22]. These studies highlight the variation in the WTP across different countries, methodologies, and samples, offering valuable insights into the public acceptance of carbon pricing. For example, Farrell [21] examined the WTP for carbon taxes in Ireland and reported that perceived fairness and the impact on household income significantly influence the WTP. Rausch et al. [22] utilized a general equilibrium approach with microdata for households to study the distributional impacts of carbon pricing, revealing that the WTP varies significantly across different income groups.

2.4. Implementation Barriers and Transparency of Carbon Tax Policies

Despite the global recognition of carbon tax policies, their implementation faces several barriers, including public opposition, lobbying by vested interests, and skepticism about policy transparency [23]. Public distrust in government processes can hinder the successful adoption of carbon tax policies. Studies have shown that increasing the transparency of policy implementation can increase public trust and acceptance [24].
For example, the “Yellow Vest” protests in France in 2018 were partly triggered by the perceived lack of transparency and fairness in the implementation of fuel taxes, which are closely related to carbon taxation [25]. In contrast, countries such as Sweden have managed to maintain high levels of public support for carbon taxes by ensuring that policy implementation processes are transparent and that tax revenues are allocated effectively to support low-carbon technologies [11]. Therefore, improving policy transparency is essential for increasing public willingness to pay and ensuring the successful implementation of carbon tax policies in China.

2.5. Research Hypotheses

Based on the findings and the literature discussed, the following research hypotheses are proposed:
Hypothesis 1:
Higher levels of understanding of carbon tax policies among the public will lead to a greater willingness to pay (WTP) for such policies.
Hypothesis 2:
Increased transparency in the implementation of carbon tax policies will significantly enhance public acceptance and their WTP.
Hypothesis 3:
The manner in which carbon tax revenues are allocated (e.g., investment in low-carbon technologies and clean energy initiatives) will significantly influence public support for carbon tax policies.
Hypothesis 4:
Public WTP for carbon tax policies in economically developed areas (such as Shanghai) will be higher than in less economically developed regions.
Hypothesis 5:
Enhancing transparency in the carbon tax policy implementation process will significantly increase the public’s WTP.

2.6. Summary

In summary, the global application of carbon tax policies provides valuable lessons for China. The successful implementation of carbon taxes not only relies on technical measures but also significantly depends on public support and understanding. Research shows that enhancing policy transparency and clearly communicating how tax revenues will be used are critical for gaining public trust [26,27]. Countries like Sweden have demonstrated that the transparent allocation of carbon tax revenues, such as funding renewable energy projects, is key to fostering public acceptance [11]. Additionally, the role of policy implementers—whether banks or government institutions—can affect the public’s perception of accountability and trust in the system [28]. The rational allocation of tax revenues, including reinvestment into green projects or reducing other taxes, can further increase public acceptance of carbon tax policies [28], thus contributing to China’s goal of achieving carbon neutrality.
The attributes selected for this study—annual cost, policy transparency, revenue allocation, and policy implementers—are based on the extensive literature highlighting their significance in determining public willingness to pay (WTP) for carbon taxes. These attributes have been supported by research from Carattini et al. [23] on green taxes, and further substantiated by studies from Marten and van Dender [26], Conway et al. [27], and Morris [28], all of which emphasize the importance of transparency, effective revenue use, and trusted institutions in shaping public perception and policy acceptance.

3. Methodology

This study employed a structured questionnaire to collect data from Shanghai residents, with 1000 questionnaires planned for distribution. All respondents were selected from the registered users of the Wenjuanxing (WJX) platform (https://www.wjx.cn/), and the sample was chosen on the basis of the distribution of education levels from the latest Chinese census data.
This study was conducted in two phases. The initial phase involved 50 respondents to refine the questionnaire and test the methodology. Subsequently, the main experiment involved data collection from 1000 respondents, conducted between August 2022 and September 2022.
After a thorough data cleaning process, 805 valid responses were retained for analysis, resulting in a response rate of 80.5%. During the cleaning process, 195 invalid questionnaires were removed due to incomplete or inconsistent responses. This rigorous data cleaning approach ensured the quality of the data on which the analysis is based, thereby enhancing the reliability of the study’s findings.
In studies involving multiple attributes, the choice of sample size is crucial. According to Orme [29] (2006), for conjoint analysis studies that include multiple features, a sample size should typically be between 300 and 500 to ensure the reliability of the results. By achieving a sample size of 805 valid responses, our study not only meets this standard but also provides a more comprehensive and representative outcome. Notably, the selection of respondents took into account the proportions of different educational levels in Shanghai, allowing the research to deeply reflect the acceptance of carbon tax policies among respondents from diverse backgrounds, further enhancing the representativeness and rationale of the results.
The questionnaire was designed to gather demographic information, including gender, age, education level, occupation, and income, to ensure a diverse sample. Additionally, choice-based conjoint analysis (CBCA) was employed to investigate the willingness of Shanghai residents to pay for carbon taxes. This method allows for an in-depth analysis of preferences for carbon tax policies on the basis of different attributes, particularly focusing on variations in policy transparency. The survey consisted of a total of 25 questions, including 5 open-ended questions to capture qualitative insights and 20 closed-ended questions, which employed Likert scales to measure the intensity of respondents’ preferences for various carbon tax policy scenarios. The two questionnaires used in the main experiment are presented in Appendix A and Appendix B.

3.1. Conjoint Analysis Method

Since the 1970s, conjoint analysis (CA) has been widely used in the field of evaluation of consumers’ multi-attribute utility functions [30,31]. The effectiveness of CA for the assessment of individual preferences has made it a common method for market research and scientific studies [32,33]. CA mimics the trade-off process of real consumers by examining the joint effects of combinations of attributes on respondents. Beggs’ work was the first application of conjoint analysis in the environmental domain [34]. Moreover, it has proven effective in assessing non-market values [35]. CA has also been promoted for identifying consumers’ willingness to pay for environmental issues [32]. It is inferred that CA can be used to examine the attitudes of residents toward different carbon tax policy attributes.
Each CA experiment should select properties of the problem that cause great concern to researchers. In this study, the ordinary least squares (OLS) method was used to estimate the part-worth utilities of different carbon tax policy attributes. In practice, large-scale CA studies have considered the fatigue effect for respondents due to the excessive number of attributes, thus causing a distortion of questionnaire results [36,37]. Furthermore, studies of cognitive processes have shown that only a few stimuli have an effective impact when individuals make trade-offs [38]. Similarly, Bigsby and Ozanne noted that only a small number of attributes are considered when influencing people to face choices and make decisions [39].

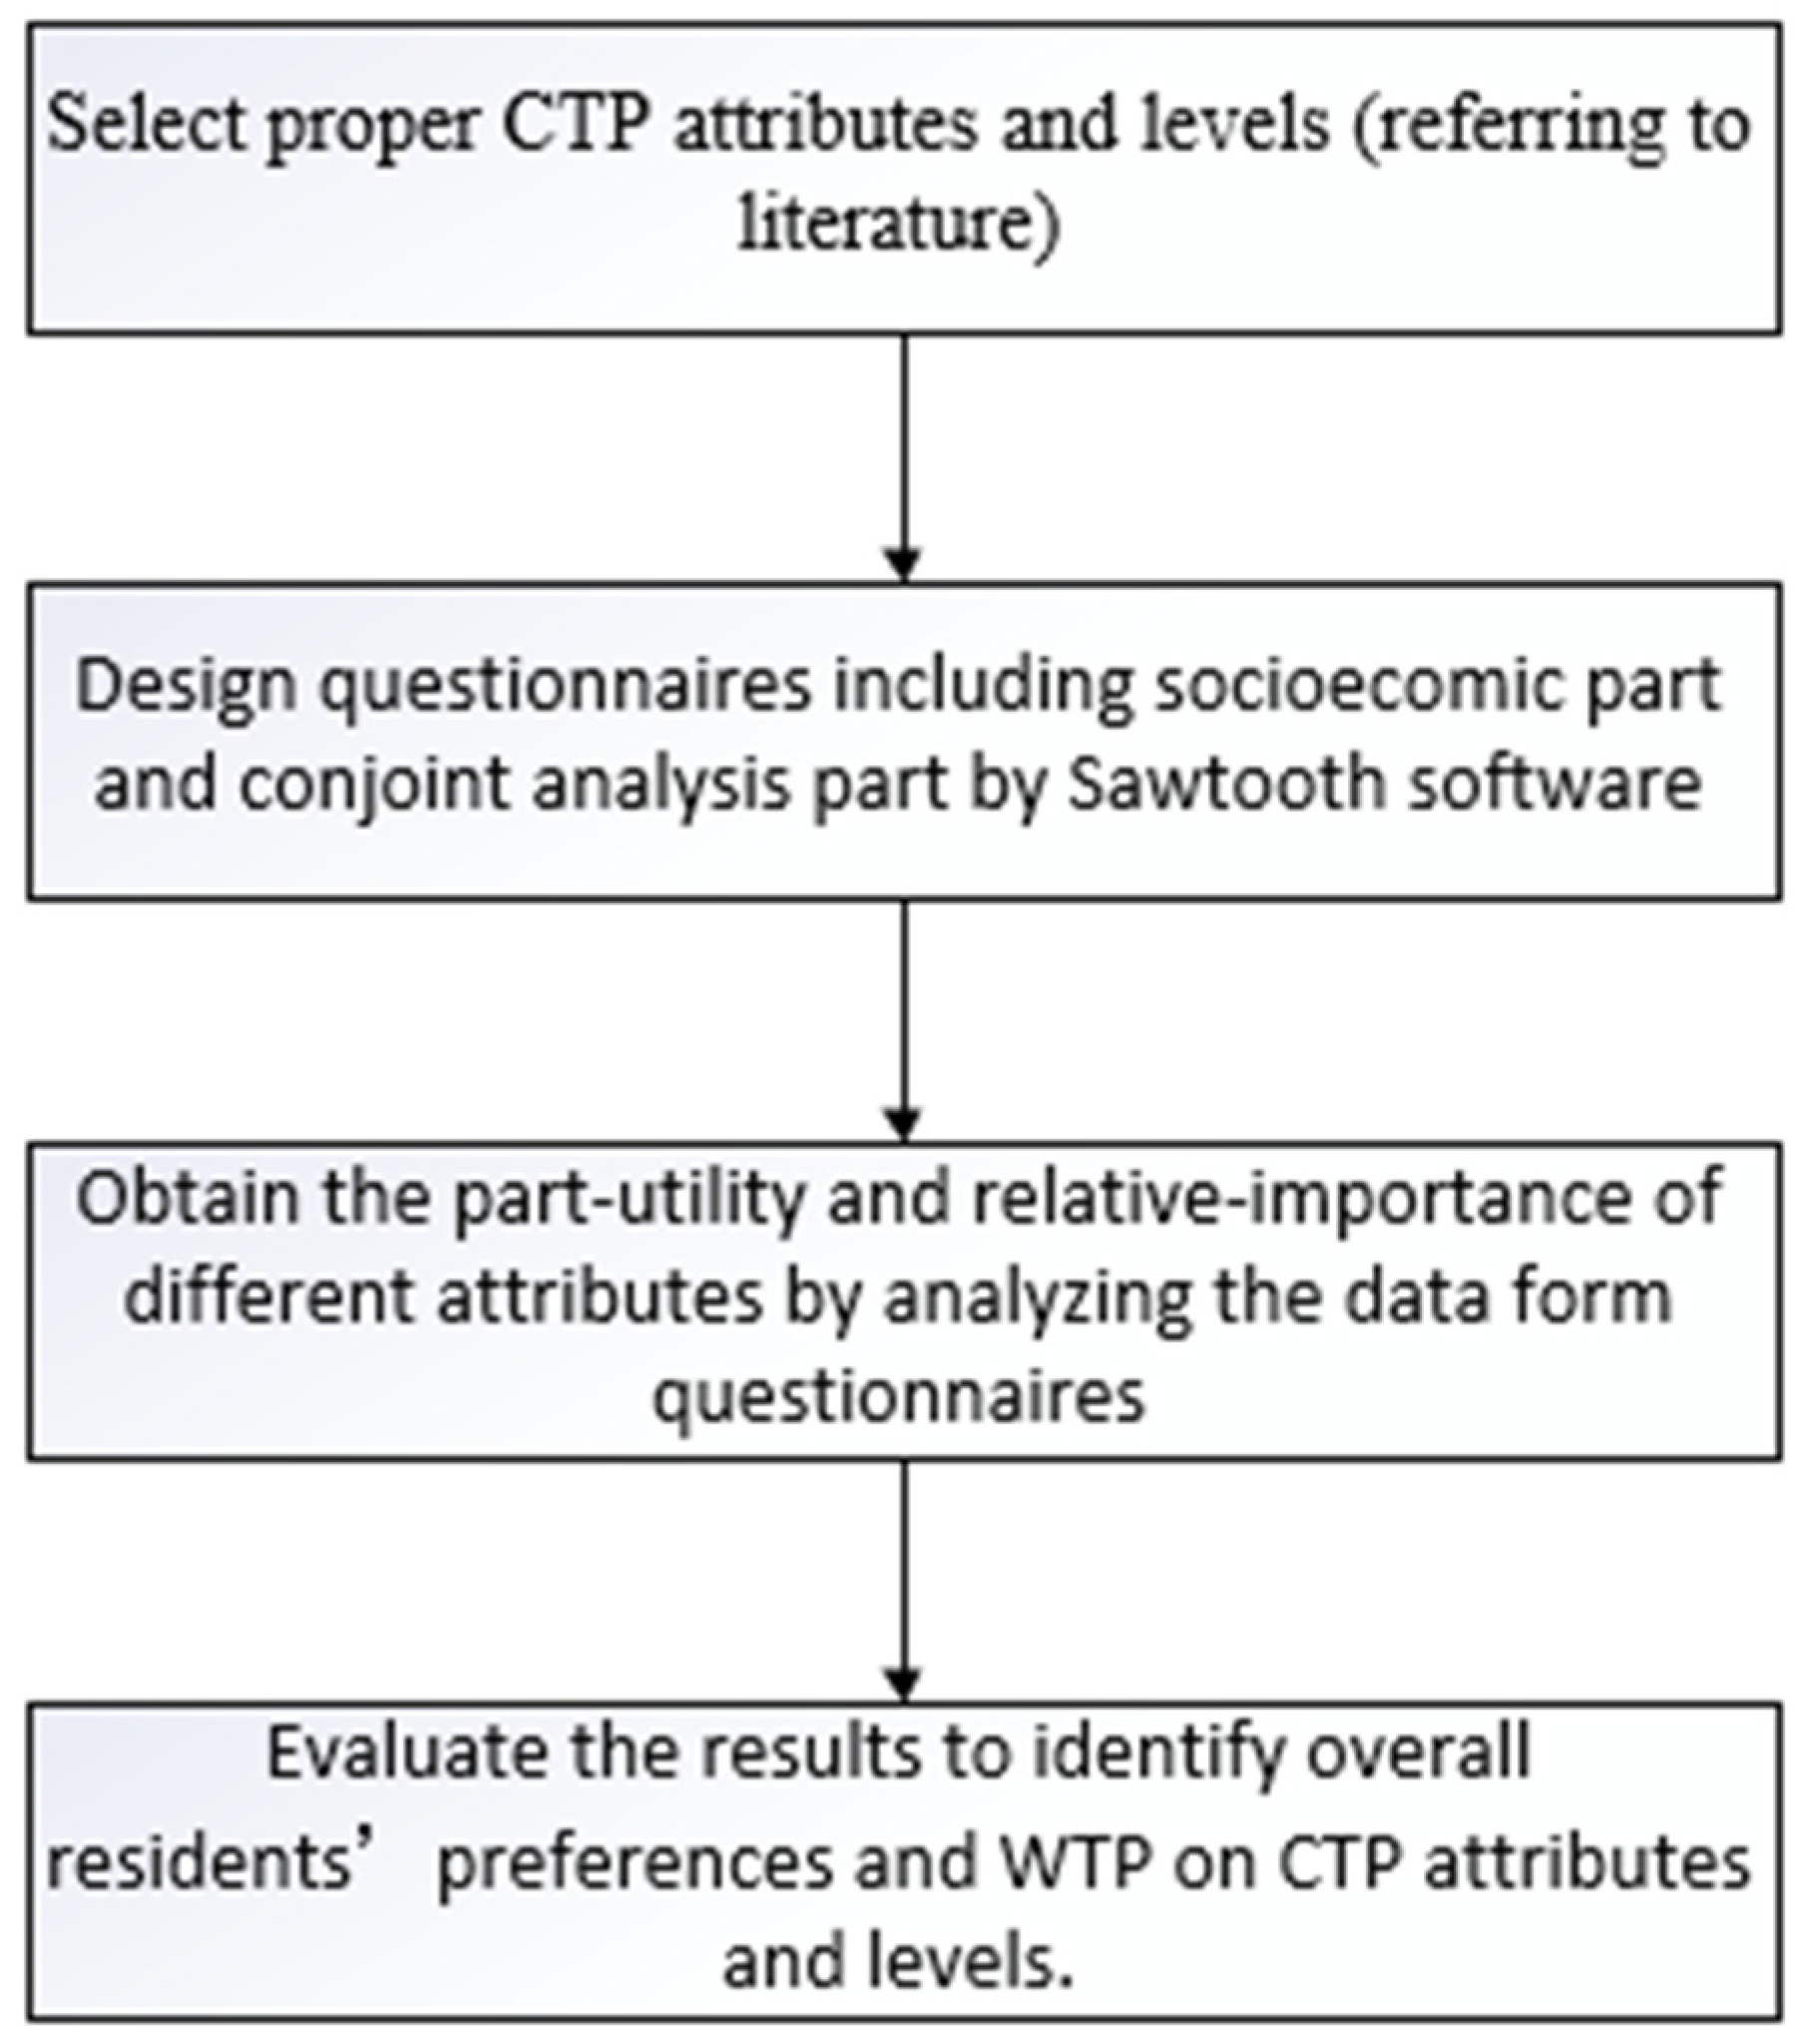
3.2. Experimental Process Design

Referring to Figure 1, the CTP properties and levels to be considered for this experiment were presented in Section 1. Previous methods have been used to select attributes. In Section 2, a questionnaire was presented to examine the respondents’ characteristics and socioeconomic information (e.g., gender, age, and education level, etc.) as the first part of the questionnaire (see Appendix A). The second part of the questionnaire was designed to examine different respondents’ preferences for CTP based on a combination of different CTP attributes and levels via Sawtooth software (version: Lighthouse Studio). Table 1 shows the specific attributes and levels. For the questionnaire design process, the attribute of “cost of carbon tax” needs some further clarification. The amount of carbon tax payment is usually calculated based on the amount of energy used or the basis of the amount of carbon dioxide emissions converted from it. Asking respondents how much they would be willing to pay for various sources of carbon tax would greatly increase the complexity of the questionnaire and confuse the respondents. Therefore, in this study, we chose to assume a combination of several carbon tax policy attributes and a total carbon tax payment price for respondents to evaluate. This total price paid will be said to include all energy and other related costs they overpay for carbon emissions. Finally, the respondents’ willingness to pay for the total cost of different attribute combinations is compared to help the government determine the direction of the establishment and reform of the carbon tax system. In the third part, we used the analysis function of the Sawtooth software to input the data obtained from the returned questionnaires. Then, during data processing, the questionnaire data were analyzed according to the model built with Sawtooth software. As a result, we obtained results (partial value utility and relative importance) that are representative of the residents’ CTP preferences. In the fourth section, we evaluate these results to determine the overall preferences and WTP of residents for CTP attributes.

3.3. Mathematical Model and Data Processing

The findings of the conjoint process of the survey were analyzed for all of the samples and by complying with 12 different social-demographic and personal variables. A function of Shanghai residents’ preference was evaluated from the CBCA data using a multinomial logit function. The function calculated the importance of the respective attribute relative to the other attributes in decision making, as well as the part utility for each level of the attributes.
U = β 0 + k 1 n β n X n
where β0 represents the constant coefficient of each alternative, and β1, β2, β3, …, βn denote the coefficients obtained through the logit model, which represent the relative weights of the attributes in each alternative. The weights of attributes indicate their importance for the respondents’ choice making, as well as the preference for all levels within the attribute.
The part-worth utility denotes a value that explains the importance of each attribute’s level for the respondents. It is measured on an interval scale of arbitrary origin, so it is meaningless to compare the values of utility at different levels of the attribute. Expressing the utility of partial values in monetary terms is a common way of making them easier to understand. Researchers always set price as a reference attribute in conjoint analysis experiments to calculate how much respondents are willing to pay to improve the level of other attributes. The monetary equivalent of the difference in utility represents the willingness to pay for a unit of utility change. It is considered to be an estimate that helps to evaluate the utility gap at different levels. Notably, WTP reveals the difference between the two levels, rather than referring to the value of a particular level. The lowest utility level can be set as the baseline value for willingness to pay for the same attribute, and other levels are shown as differences from the baseline value. In addition, relative importance is used to indicate the importance of different attributes to respondents. The value of relative importance is determined by the difference between the highest and lowest utility levels within an attribute.

4. Results

In this section, the data from the questionnaire and the results from the Sawtooth software analysis process are presented.

4.1. Socioeconomic Characteristics of the Respondents

The data shown in Table 2 consist of the percentage of 805 valid respondents with different socioeconomic characteristics. In order to ensure that the respondents selected for the questionnaire were as close to the reality as possible, we asked WJX to control the proportion of overall respondents according to the proportion of residents with different education levels (high school and below, bachelor and above) obtained from the Shanghai census as much as possible. Although this study focused on Shanghai, the city’s status as an economic and industrial hub offers valuable insights into urban public opinion on carbon tax policies. While the findings are relevant to similar urban areas, they may not fully reflect the views of rural or less economically developed regions. Expanding the geographic scope in future studies would help provide a more comprehensive national perspective.
Those who believed that they are affected by climate change amounted to 96.77%, but only 82.61% were aware of the carbon tax policy. This indicates that not all people who are aware of climate change are aware of the details of the carbon tax policy, and there is a need for further dissemination of the carbon tax policy.

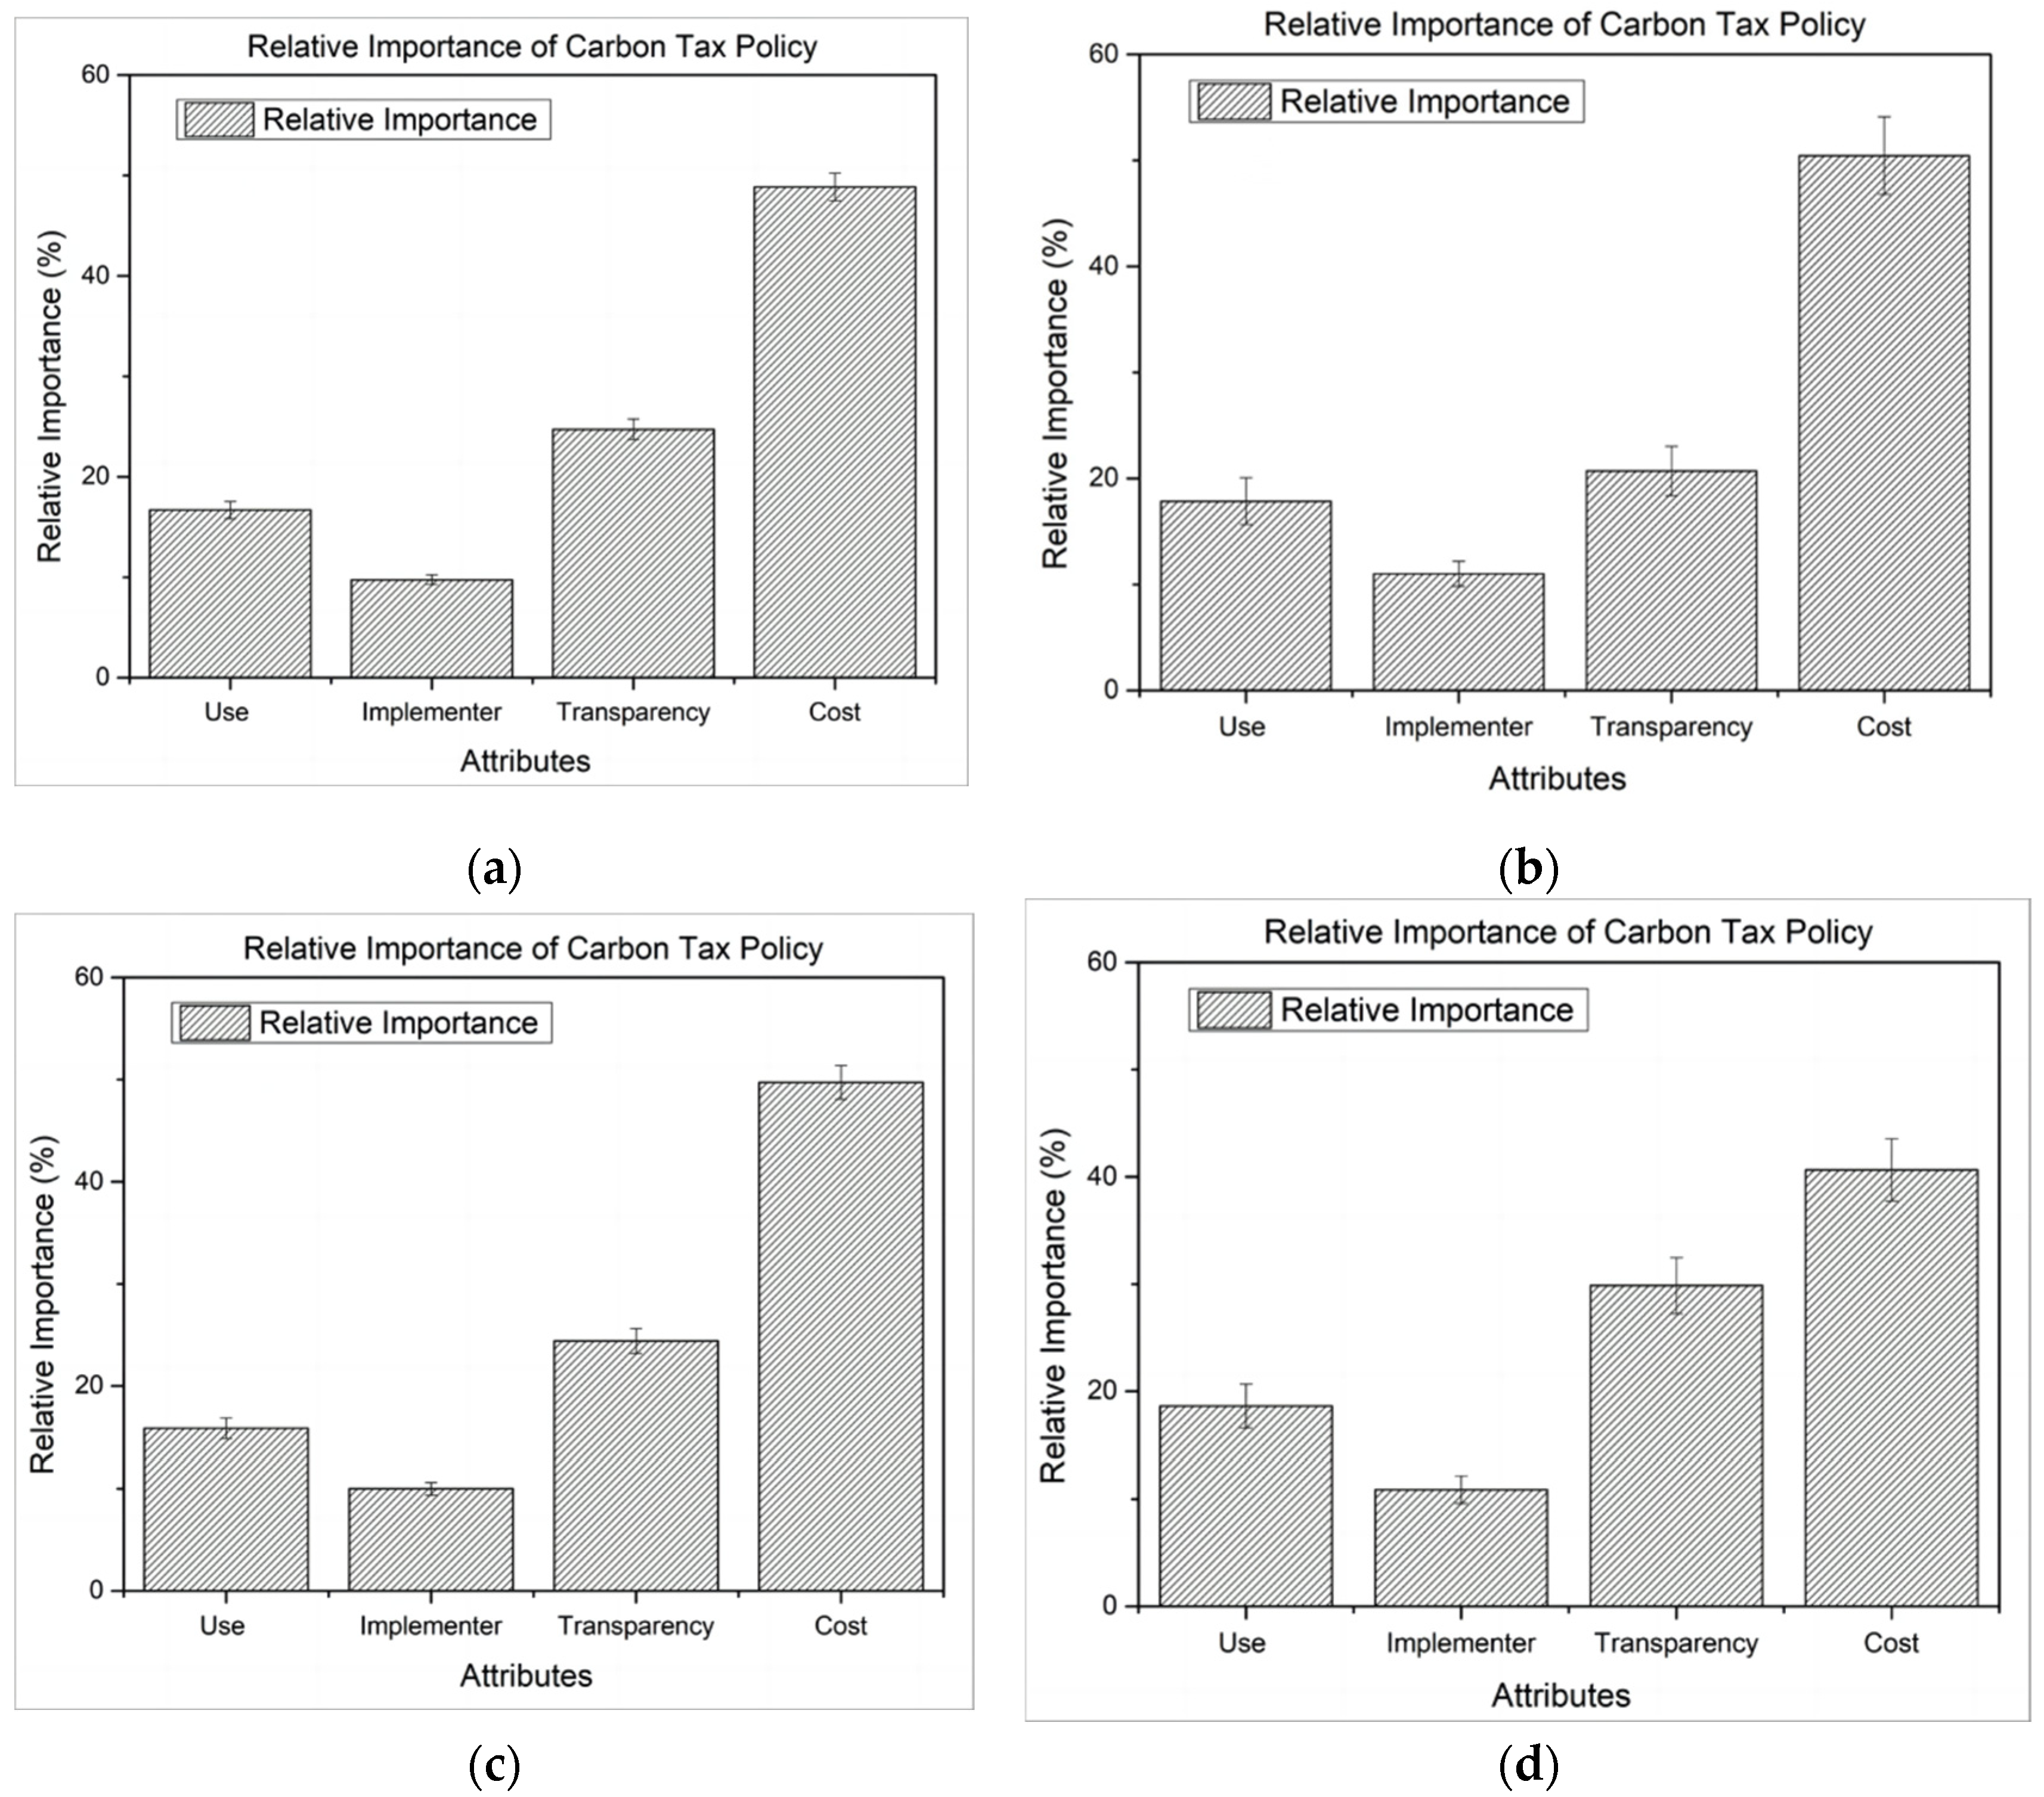
4.2. Relative Importance

The overall results of Shanghai residents’ CTP preferences are listed in Figure 2a. According to Figure 2a, the critical attribute of the respondents is the annual cost of the carbon tax policy (48.87%). The second critical attribute is transparency of the carbon tax policy implementation process (24.72%), followed by the use of carbon tax revenue (16.68%) and carbon tax policy implementers (9.73%). It is easy to see that among the three non-price attributes, the relative importance of transparency to residents is at least 50% greater than that of the other attributes. In other words, improving the transparency of carbon tax policy is the most effective way to increase the acceptance of carbon tax policy by the public.
Figure 2b–d show the relative importance of different CTP attributes for residents with different levels of understanding of the CTP. From Figure 2b–d, residents’ understanding level of the CTP improved from “None” to “Clear”. The results reveal that “use of carbon tax revenue” and “carbon tax policy implementers” have similar relative importance rates of approximately 18% and 10%, respectively, among residents with different perceptions of the CTP. In contrast to the performance of these two CTP attributes, the relative importance of the other attributes changed as residents’ knowledge of the CTP increased. The relative importance of “cost of CTP” (50.45%) was much greater for the group with no knowledge of the CTP than for the other two groups with knowledge of the CTP. As the understanding level of the CTP improved from “some” to “clear”, the relative importance of cost of the CTP decreased from 49.75% to 40.65%. In complete contrast to this trend, the relative importance of “transparency of carbon tax policy implementation process” rises as the level of understanding of the CTP increase. For the level from “None” to “Clear”, the relative importance is ordered as 20.7%, 24.41%, and 29.85%, respectively. This result clearly shows that as people’s understanding of carbon tax policies increases, their sensitivity to the cost of carbon taxes decreases and their demand for transparency in the implementation of carbon tax policies increases.

4.3. Willingness to Pay for CTP

Table 3 reveals the total willingness to pay (WTP) for different levels of the carbon tax policy. Compared with putting carbon tax revenue into the general tax budget, respondents in Shanghai are willing to pay more than 500 CNY/year to change the use of revenue to invest in low-carbon technologies or clean energy technologies. In terms of carbon tax policy transparency, the respondents expressed their preference for a WTP of more than 1000 CNY/year. In other words, people are willing to pay more than 1000 CNY/year in exchange for reasonable disclosure of the carbon tax collection and use process. In particular, the improvement in the transparency attribute has led to a significant increase in the public’s WTP for the carbon tax, which is a test of the importance of open acceptance in the implementation of the CTP. In addition, the government is the best implementer in the residents’ opinion. The last row of Table 3 shows the overall mean WTP, which represents the sum of the average WTP for each level of the three policy attributes: revenue usage, policy transparency, and policy implementer. This reflects the respondents’ mean willingness to pay for the carbon tax as a whole. The WTP data were obtained through a survey in which respondents provided their valuation of different policy attributes. By aggregating the WTP for each attribute, the mean provides an overall measure of how much respondents are willing to pay for the carbon tax when considering all aspects of the policy.
Table 4 shows the difference in the WTP for the carbon tax for people with different educational levels. In contrast to the findings of previous studies, we found that adults with educational levels below high school exhibited a higher WTP for the carbon tax (CNY 1652) after their understanding of carbon tax attributes improved. The reason for their greater average WTP increase than those with higher educational levels is their enthusiasm for using carbon tax revenue to support low-carbon and clean energy technologies. However, the more important factor remains the transparency attribute of the carbon tax policy, which is regarded as the most desirable attribute by people with any level of education, as demonstrated by improving the level of the WTP of this attribute.
Table 5 shows that residents with different family disposable incomes have different levels of the WTP for improving the carbon tax attributes. It shows that members of households with an annual disposable household income between CNY 30,000 and 50,000 show greater interest in investing in carbon tax revenues in areas related to low-carbon and new energy technologies. In addition, we analyzed the WTP composition of other groups and found that improving the transparency of carbon tax policies is still the most effective means of increasing residents’ WTP because improved transparency yields the greatest increase in WTP.
As illustrated in Figure 2b–d, the relative importance of different carbon tax policy (CTP) attributes shifts as the public’s understanding of carbon tax policies improves. This indicates that individuals with varying levels of awareness regarding carbon taxes have distinct preferences for its attributes, suggesting that understanding of the carbon tax may influence their willingness to pay for different attributes. To validate this observation, we gathered the data presented in Table 6, which show the willingness to pay (WTP) of residents with differing levels of understanding of the CTP. When residents’ understanding level of CTP increases from “None” to “Some,” the mean WTP rises from CNY 1072.16 to the “Clear” understanding level corresponding to the highest WTP of CNY 3246.18. This finding demonstrates that enhancing public awareness of carbon tax policies can significantly boost the public’s willingness to pay, thereby increasing carbon tax revenue and further promoting the development of low-carbon and new energy technologies. Such a positive stimulus is crucial for the effectiveness of carbon tax policies. In addition, Table 4 reveals that the increase in willingness to pay for the carbon tax is mainly concentrated on the attributes “use of carbon tax revenue” and “transparency of the CTP implementation process”. Moreover, the greater the level of understanding of the carbon tax, the greater the increase in WTP with the improvement in carbon tax attributes, especially the increase in “transparency” from “no process report” to “report regularly on the official process”. This part of the data show that improving the transparency of the carbon taxation process significantly increases the WTP and that the effect is more pronounced for people with a greater level of understanding of the CTP.

5. Discussion

5.1. Relative Importance of CTP Attributes

The results reveal that the cost of the carbon tax policy (CTP) was the most critical attribute for respondents, accounting for 48.87% of the total relative importance. However, transparency followed closely at 24.72%, indicating that citizens highly value clarity regarding policy implementation and revenue allocation. This finding aligns with international experiences, where countries such as Sweden and Norway have found that public acceptance of carbon taxes increases with transparent mechanisms for reporting the use of tax revenues [22,23].
In Sweden, which has had a carbon tax since the early 1990s, transparency in the use of revenues has been a key element in maintaining public support. The Swedish government has effectively communicated the environmental benefits of the tax, resulting in reductions in CO2 emissions without adverse effects on economic growth [40]. Such transparency fosters public trust, allowing the tax to remain a central part of Sweden’s climate policy even after three decades of implementation.
Similarly, in Norway, the clear communication of the carbon tax’s environmental benefits has led to sustained public support for the policy, emphasizing the importance of transparency in achieving effective carbon pricing [41]. This is particularly relevant in the Chinese context, where increasing transparency regarding CTP implementation could enhance public acceptance.

5.2. Differences in WTP Based on CTP Understanding Level

Figure 2b–d illustrate the relative importance of different CTP attributes on the basis of residents’ understanding of the CTP. For residents with no understanding of the CTP, the cost of the tax was the most important attribute, accounting for 50.45% of the total importance. This figure gradually decreased as respondents’ understanding of CTP improved: from 49.75% for those with some understanding to 40.65% for those with clear understanding. This shift highlights that as people become more informed about carbon tax policies, their sensitivity to costs diminishes, reflecting a trend observed in other countries.
In British Columbia, for example, public awareness campaigns have effectively shifted attention from the immediate costs of carbon taxes to long-term benefits, such as emission reductions and the utilization of revenues for public goods [42]. This aligns with our findings, which indicate that improving public awareness can alter perceptions of cost and lead to greater emphasis on the broader benefits of carbon taxes.
Furthermore, research has shown that individuals with higher levels of awareness are more likely to support environmental taxes, as emphasized in studies by Awunyo-Vitor et al. [43], who highlighted the impact of public understanding on support for carbon taxation, and Capasso [44], who noted that well-informed citizens tend to have higher acceptance levels of such policies. Additionally, studies such as those by Duan et al. and Yang et al. [45,46] have shown similar trends in China, reinforcing the idea that public education and awareness significantly affect acceptance.
The increasing importance of transparency as understanding improves is consistent with the findings of Klok et al. [47] in the Netherlands, who noted that transparency and clear communication about the environmental effectiveness of carbon taxes increased public acceptance, especially among more informed citizens. This sentiment is echoed by Sun et al. [48], who emphasized the necessity of transparency for fostering public trust in carbon pricing mechanisms.

5.3. Implications for Policymakers

The findings of this study provide actionable insights for policymakers. The growing importance of transparency as citizens’ understanding improves underscores the need for transparent governance and clear communication strategies. Efforts to demonstrate how carbon tax revenues are used and the environmental benefits achieved can play a vital role in fostering public acceptance.
Additionally, the steadily increasing WTP among residents of Shanghai reflects a growing societal readiness to support environmental policies perceived as fair and transparent. This potential for increased public acceptance mirrors successful strategies in Norway and Sweden, where transparent communication and regular updates on carbon tax benefits have cultivated trust and engagement among citizens [41].
Countries such as Finland have also reported that maintaining high levels of transparency and educating the public about the economic and environmental benefits of carbon taxes leads to increased acceptance (Khastar et al., 2020) [49]. By adopting similar strategies, China could further increase public acceptance of its carbon tax policy.

6. Conclusions

In this study, we utilized conjoint analysis to assess the significance of carbon tax policy (CTP) attributes among Shanghai residents with varying levels of CTP understanding. We also analyzed the overall and group-specific willingness to pay (WTP) for different CTP attribute levels. Although this study focused on Shanghai, the city’s status as an economic and industrial hub offers valuable insights into urban public opinion on carbon tax policies. While the findings are relevant to similar urban areas, they may not fully reflect the views of rural or less economically developed regions. Expanding the geographic scope in future studies would help provide a more comprehensive national perspective.
Data on CTP preferences were collected through questionnaires, and the analysis was conducted via a mathematical model in Sawtooth software. Our key findings are as follows:
  • While 96.77% of the respondents acknowledged the impacts of climate change, only 82.61% were aware of the carbon tax policy, indicating the potential for heightened awareness.
  • Among Shanghai residents, the annual cost of the carbon tax policy was most critical (48.87%), followed by transparency in policy implementation (24.72%), carbon tax revenue use (16.68%), and the identity of the policy implementers (9.73%).
  • Our findings suggest that carbon taxation can be an effective tool for environmental governance in China, particularly when it is combined with transparent policy implementation and strategic revenue allocation. The willingness to pay (WTP) for carbon tax policies among Shanghai residents was found to be significant, with an average WTP of 1435.28 CNY/year. This indicates robust public readiness to invest in policies aimed at combating climate change, especially when these policies are perceived as equitable and transparent.
  • Transparency in the carbon tax policy implementation process has emerged as a crucial factor influencing public acceptance. Our results indicate that enhancing transparency, from no progress reporting to regular updates on the official website, could increase the WTP by as much as CNY 2847.26.
  • Revenue allocation significantly impacts public perceptions. The respondents show a strong preference for carbon tax revenues to be invested in low-carbon technologies and clean energy initiatives, reflecting a growing awareness of the potential benefits of carbon taxation beyond mere cost concerns. This finding is consistent with research in other countries, such as Norway and Sweden, where the allocation of revenues to visible environmental projects has bolstered public support [22,40] (Metcalf, 2019; Scharin and Wallström, 2018).
This study contributes to understanding preferred CTP attribute levels among Chinese residents. WTP assessments can aid policymakers in optimizing carbon tax policy attributes. It is crucial to enhance public awareness alongside improving carbon tax policy attributes.

7. Limitations and Future Research

Despite these promising findings, this study has several limitations. One major limitation is the potential for sample bias, as the survey was conducted solely in Shanghai, an economic and industrial hub. While this provides valuable insights into urban public opinion, the results may not fully represent the views of residents in rural or less economically developed regions. Future studies should expand the geographic scope to include diverse populations across China, allowing for a more comprehensive understanding of national preferences regarding carbon taxation.
Moreover, this study’s reliance on self-reported data may introduce response bias, as participants might understate or overstate their willingness to pay on the basis of social desirability or a lack of knowledge about carbon tax policies. To increase the robustness of future research, incorporating preference surveys and qualitative interviews could provide deeper insights into public attitudes and behaviors toward carbon taxation.

Author Contributions

Conceptualization, J.Z.; Methodology, J.Z. and L.Z.; Software, J.Z.; Formal analysis, J.Z.; Resources, C.L. and X.J.; Data curation, X.J.; Writing—original draft, J.Z.; Writing—review & editing, X.J., L.Z. and Y.C.; Supervision, C.L. and Y.C.; Project administration, C.L.; Funding acquisition, L.Z. All authors have read and agreed to the published version of the manuscript.

Funding

This research was funded by the Guangdong Philosophy and Social Science Foundation Regular Project (grant number GD24CGL11); the Shenzhen Higher Education Institutions Stable Support Plan General Program (grant number 20231123102915001); and the Launch Fee for Scientific Research of Newly Introduced High-Precision and Scarce Talents in Shenzhen (grant number 827-000906).

Institutional Review Board Statement

The study was conducted in accordance with the Declaration of Helsinki. Ethical review and approval were waived for this study by the Institutional Review Board of Shenzhen University due to the following reasons: (1) Minimal Risk: The questionnaire only addressed policy preferences without involving any physical or psychological harm, and the risk was no greater than that encountered in daily life or standard social surveys. (2) Anonymity: No personally identifiable information was collected, and all data were processed and stored anonymously, ensuring full privacy protection. (3) Non-Invasive: This study was a non-invasive social science study with no biological or medical interventions. (4) No Involvement of Vulnerable Groups: The participants were ordinary adult residents, excluding vulnerable groups, thus reducing additional ethical risks. (5) Public Policy Research: The study focused on public policy acceptance related to carbon taxes, aiming to optimize policy without commercial interests or personal data usage. Informed consent was obtained from all participants, who were informed of the study’s purpose, assured of response anonymity, and confirmed their voluntary participation at the beginning of the questionnaire.

Informed Consent Statement

Written informed consent has been obtained from the patients to publish this paper.

Data Availability Statement

Data supporting the reported results are available from the corresponding author upon reasonable request.

Conflicts of Interest

The authors declare no conflicts of interest.

Appendix A. Questionnaire 1

We are conducting a survey which examines public preferences on the Carbon Tax Policy. We sincerely hope that you can spend a few minutes on this survey, and we would definitely value your opinions! Your identity and answers are absolutely confidential! (Since minors under the age of 16 are not allowed to participate in labor to obtain remuneration in China and have the ability to pay expenses, we require the questionnaire company to distribute the questionnaire to Shanghai citizens who are not younger than 16 years old)
  • Sociodemographic characteristics part.
  • Gender: Female, Male
  • Age: 16–30, 31–45, 46–60, >60
  • Marriage: married, single
  • Education level: Middle School, High School, Bachelor’s degree, Above bachelor’s degree
  • Number of family members: 1, 2, 3, 4, 5, 6, >6
  • Residence: Urban, Rural
  • Family disposable income per year (CNY): 0–30,000, 30,000–50,000, 50,000–100,000, 100,000–200,000, >200,000, Inconvenient
  • Annual electricity consumption: 0–1000, 1000–2500, 2500–5000, >5000
  • Annual gas consumption: 0–800, 800–1500, 1500–3000, >3000
  • Annual gasoline consumption: 0–2500, 2500–5000, 5000–10,000, >10,000
  • How to Consider the Impact of Climate Change on Your Life: None, little, some, huge.
  • How to evaluate your understanding on carbon tax: None, some, clearly.
  • A explanation of policy attributes and classification is as follows:
The purpose of Use of carbon tax revenue:
  • General tax budget (the income treasury is redistributed according to the will of the state)
  • Subsidies/grants for clean energy technology (to encourage the development of new technologies for low carbon dioxide emissions and new bases for absorbing and storing carbon dioxide in the air)
  • Subsidies/grants for low-carbon technologies or CCUS (encourage the development of new energy technologies that do not emit carbon dioxide and other pollutants)
Carbon tax collectors:
  • Energy companies
  • Bank
  • Government
The method of disclosure of the carbon tax policy implementation process:
  • No process report (the process and data will not be disclosed to the public throughout the process)
  • Report regularly on the official website (provide the relevant process and data of carbon tax collection by quarter or year)
  • Regularly report on the official website under the supervision of an independent third party (provide carbon tax collection-related progress and data on a quarterly or annual basis under the supervision of a non-interested third-party)
Cost of carbon tax (CNY): the amount of additional fees paid on energy expenditures and other fee related to carbon emission each year
  • Next part is Choice-based conjoint analysis part. Please pick one option from each question. And all of the options indicated four attributes as follow: Use of Carbon Tax Revenue, Carbon tax policy implementers, Transparency of carbon tax policy implementation process and Cost of Carbon Tax.
  • Which of the following carbon tax policies do you prefer?
    • Subsidies/grants for low-carbon technologies or CCUS, Energy Supplier, No process report, 700 CNY
    • Subsidies/grants for clean energy technology, Energy Supplier, no process report, 150 CNY
    • General tax budget, Government, Regularly report on the official website under the supervision of an independent third party, 1200 CNY
    • Subsidies/grants for low-carbon technologies or CCUS, Bank, Regularly report on the official website under the supervision of an independent third party, 1200 CNY
  • Which of the following carbon tax policies do you prefer?
    • General tax budget, Bank, Regularly report on the official website under the supervision of an independent third party, 150 CNY
    • General tax budget, Government, Regularly report on the official website under the supervision of an independent third party, 150 CNY
    • Subsidies/grants for clean energy technology, Government, No process report, 2000 CNY
    • Subsidies/grants for low-carbon technologies or CCUS, Government, Report regularly on the official website, 700 CNY
  • Which of the following carbon tax policies do you prefer?
    • Subsidies/grants for clean energy technology, Government, Report regularly on the official website, 700 CNY
    • Subsidies/grants for clean energy technology, Bank, Regularly report on the official website under the supervision of an independent third party, 350 CNY
    • Subsidies/grants for low-carbon technologies or CCUS, Energy Supplier
    • Regularly report on the official website under the supervision of an independent third party, 2000 CNY
    • General tax budget, Government, No process report, 150 CNY
  • Which of the following carbon tax policies do you prefer?
    • Subsidies/grants for low-carbon technologies or CCUS, Government, Regularly report on the official website under the supervision of an independent third party, 2000 CNY
    • General tax budget, Bank, Report regularly on the official website, 2000 CNY
    • Subsidies/grants for low-carbon technologies or CCUS, Bank, No process report, 350 CNY
    • General tax budget, Energy Supplier, No process report, 1200 CNY
  • Which of the following carbon tax policies do you prefer?
    • Subsidies/grants for clean energy technology, Bank, No process report, 150 CNY
    • Subsidies/grants for low-carbon technologies or CCUS, Government, No process report, 1200 CNY
    • Subsidies/grants for clean energy technology, Energy Supplier, Report regularly on the official website, 1200 CNY
    • Subsidies/grants for low-carbon technologies or CCUS, Energy Supplier, Regularly report on the official website under the supervision of an independent third party, 700 CNY
  • Which of the following carbon tax policies do you prefer?
    • Subsidies/grants for clean energy technology, Government, Report regularly on the official website, 350 CNY
    • Subsidies/grants for clean energy technology, Energy Supplier, Regularly report on the official website under the supervision of an independent third party, 1200 CNY
    • General tax budget, Energy Supplier, Regularly report on the official website under the supervision of an independent third party, 150 CNY
    • General tax budget, Bank, Report regularly on the official website, 150 CNY
  • Which of the following carbon tax policies do you prefer?
    • General tax budget, Government, No process report, 350 CNY
    • Subsidies/grants for clean energy technology, Bank, No process report, 700 CNY
    • Subsidies/grants for clean energy technology, Energy Supplier, Regularly report on the official website under the supervision of an independent third party, 700 CNY
    • Subsidies/grants for low-carbon technologies or CCUS, Government, Regularly report on the official website under the supervision of an independent third party, 1200 CNY
  • Which of the following carbon tax policies do you prefer?
    • Subsidies/grants for low-carbon technologies or CCUS, Government, Report regularly on the official website, 1200 CNY
    • Subsidies/grants for clean energy technology, Bank, No process report, 700 CNY
    • Subsidies/grants for low-carbon technologies or CCUS, Bank, Regularly, Report on the official website under the supervision of an independent third party, 700 CNY
    • General tax budget, Energy Supplier, No process report, 350 CNY
  • Which of the following carbon tax policies do you prefer?
    • Subsidies/grants for clean energy technology, Government, Regularly, Report on the official website under the supervision of an independent third party, 2000 CNY
    • Subsidies/grants for low-carbon technologies or CCUS, Energy Supplier, No process report, 150 CNY
    • General tax budget, Government, Report regularly on the official website, 350 CNY
    • General tax budget, Bank, No process report, 2000 CNY
  • Which of the following carbon tax policies do you prefer?
    • Subsidies/grants for low-carbon technologies or CCUS, Energy Supplier, Report regularly on the official website, 2000 CNY
    • Subsidies/grants for low-carbon technologies or CCUS, Bank, Report regularly on the official website, 350 CNY
    • Subsidies/grants for clean energy technology, Government, No process report, 700 CNY
    • General tax budget, Bank, Regularly report on the official website under the supervision of an independent third party, 700 CNY
  • Which of the following carbon tax policies do you prefer?
    • Subsidies/grants for clean energy technology, Energy Supplier, Report regularly on the official website, 350 CNY
    • Subsidies/grants for clean energy technology, Bank, Report regularly on the official website, 150 CNY
    • General tax budget, Government, Report regularly on the official website, 2000 CNY
    • General tax budget, Energy Supplier, Regularly report on the official website under the supervision of an independent third party, 1200 CNY
  • Which of the following carbon tax policies do you prefer?
    • Subsidies/grants for low-carbon technologies or CCUS, Bank, Regularly report on the official website under the supervision of an independent third party, 2000 CNY
    • Subsidies/grants for clean energy technology, Government, No process report, 350 CNY
    • General tax budget, Energy Supplier, No process report, 150 CNY
    • Subsidies/grants for clean energy technology, Bank, Regularly report on the official website under the supervision of an independent third party, 700 CNY

Appendix B. Questionnaire 2

We are conducting a survey which examines public preferences on the Carbon Tax Policy. We sincerely hope that you can spend a few minutes on this survey, and we would definitely value your opinions! Your identity and answers are absolutely confidential! (Since minors under the age of 16 are not allowed to participate in labor to obtain remuneration in China and have the ability to pay expenses, we require the questionnaire company to distribute the questionnaire to Shanghai citizens who are not younger than 16 years old)
  • Sociodemographic characteristics part.
  • Gender: Female, Male
  • Age: 16–30, 31–45, 46–60, >60
  • Marriage: married, single
  • Education level: Middle School, High School, Bachelor’s degree, Above bachelor’s degree
  • Number of family members: 1, 2, 3, 4, 5, 6, >6
  • Residence: Urban, Rural
  • Family disposable income per year (CNY): 0–30,000, 30,000–50,000, 50,000–100,000, 100,000–200,000, >200,000, Inconvenient
  • Annual electricity consumption: 0–1000, 1000–2500, 2500–5000, >5000
  • Annual gas consumption: 0–800, 800–1500, 1500–3000, >3000
  • Annual gasoline consumption: 0–2500, 2500–5000, 5000–10,000, >10,000
  • How to Consider the Impact of Climate Change on Your Life: None, little, some, huge.
  • How to evaluate your understanding on carbon tax: None, some, clearly.
  • A explanation of policy attributes and classification is as follows:
The purpose of Use of carbon tax revenue:
  • General tax budget (the income treasury is redistributed according to the will of the state)
  • Subsidies/grants for clean energy technology (to encourage the development of new technologies for low carbon dioxide emissions and new bases for absorbing and storing carbon dioxide in the air)
  • Subsidies/grants for low-carbon technologies or CCUS (encourage the development of new energy technologies that do not emit carbon dioxide and other pollutants)
Carbon tax collectors:
  • Energy companies
  • Bank
  • Government
The method of disclosure of the carbon tax policy implementation process:
  • No process report (the process and data will not be disclosed to the public throughout the process)
  • Report regularly on the official website (provide the relevant process and data of carbon tax collection by quarter or year)
  • Regularly report on the official website under the supervision of an independent third party (provide carbon tax collection-related progress and data on a quarterly or annual basis under the supervision of a non-interested third-party)
Cost of carbon tax (CNY): the amount of additional fees paid on energy expenditures and other fee related to carbon emission each year
  • Next part is Choice-based conjoint analysis part. Please pick one option from each question. And all of the options indicated four attributes as follow: Use of Carbon Tax Funds, Carbon tax policy implementers, Transparency of carbon tax policy implementation process and Cost of Carbon Tax.
  • Which of the following carbon tax policies do you prefer?
    • Subsidies/grants for clean energy technology, Bank, Regularly report on the official website under the supervision of an independent third party, 700 CNY
    • General tax budget, Government, No process report, 700 CNY
    • General tax budget, Bank, No process report, 2000 CNY
    • Subsidies/grants for low-carbon technologies or CCUS, Government, Report regularly on the official website, 150 CNY
  • Which of the following carbon tax policies do you prefer?
    • Subsidies/grants for low-carbon technologies or CCUS, Energy Supplier, Regularly report on the official website under the supervision of an independent third party, 350 CNY
    • Subsidies/grants for low-carbon technologies or CCUS, Bank, No process report, 700 CNY
    • Subsidies/grants for clean energy technology, Government, No process report, 150 CNY
    • Subsidies/grants for clean energy technology, Energy Supplier, Report regularly on the official website, 350 CNY
  • Which of the following carbon tax policies do you prefer?
    • General tax budget, Bank, Report regularly on the official website, 1200 CNY
    • Subsidies/grants for clean energy technology, Energy Supplier, No process report, 2000 CNY
    • Subsidies/grants for clean energy technology, Bank, Regularly report on the official website under the supervision of an independent third party, 700 CNY
    • Subsidies/grants for low-carbon technologies or CCUS, Bank, No process report, 350 CNY
  • Which of the following carbon tax policies do you prefer?
    • General tax budget, Energy Supplier, Report regularly on the official website, 2000 CNY
    • Subsidies/grants for clean energy technology, Government, Regularly report on the official website under the supervision of an independent third party, 350 CNY
    • Subsidies/grants for low-carbon technologies or CCUS, Government, No process report, 350 CNY
    • Subsidies/grants for low-carbon technologies or CCUS, Energy Supplier, Regularly report on the official website under the supervision of an independent third party, 150 CNY
  • Which of the following carbon tax policies do you prefer?
    • Subsidies/grants for clean energy technology, Energy Supplier, No process report, 1200 CNY
    • General tax budget, Energy Supplier, Report regularly on the official website, 700 CNY
    • Subsidies/grants for low-carbon technologies or CCUS, Government, Report regularly on the official website, 150 CNY
    • General tax budget, Bank, Regularly report on the official website under the supervision of an independent third party, 350 CNY
  • Which of the following carbon tax policies do you prefer?
    • General tax budget, Government, No process report, 700 CNY
    • Subsidies/grants for clean energy technology, Bank, No process report, 1200 CNY
    • Subsidies/grants for low-carbon technologies or CCUS, Energy Supplier Report regularly on the official website, 350 CNY
    • Subsidies/grants for low-carbon technologies or CCUS, Government, Report regularly on the official website, 2000 CNY
  • Which of the following carbon tax policies do you prefer?
    • General tax budget, Government, No process report, 350 CNY
    • Subsidies/grants for clean energy technology, Bank, No process report, 700 CNY
    • Subsidies/grants for clean energy technology, Energy Supplier, Regularly report on the official website under the supervision of an independent third party, 700 CNY
    • Subsidies/grants for low-carbon technologies or CCUS, Government, Regularly report on the official website under the supervision of an independent third party, 1200 CNY
  • Which of the following carbon tax policies do you prefer?
    • General tax budget, Bank, No process report, 150 CNY
    • Subsidies/grants for low-carbon technologies or CCUS, Energy Supplier No process report, 700 CNY
    • Subsidies/grants for clean energy technology, Bank, Regularly report on the official website under the supervision of an independent third party, 1200 CNY
    • Subsidies/grants for clean energy technology, Government, Regularly report on the official website under the supervision of an independent third party, 2000 CNY
  • Which of the following carbon tax policies do you prefer?
    • General tax budget, Energy Supplier, Regularly report on the official website under the supervision of an independent third party, 350 CNY
    • Subsidies/grants for clean energy technology, Bank, Report regularly on the official website, 150 CNY
    • Subsidies/grants for clean energy technology, Government, Regularly report on the official website under the supervision of an independent third party, 1200 CNY
    • Subsidies/grants for low-carbon technologies or CCUS, Bank, Report regularly on the official website, 2000 CNY
  • Which of the following carbon tax policies do you prefer?
    • General tax budget, Government, No process report, 700 CNY
    • Subsidies/grants for low-carbon technologies or CCUS, Bank, Regularly report on the official website under the supervision of an independent third party, 2000 CNY
    • Subsidies/grants for low-carbon technologies or CCUS, Energy Supplier No process report, 1200 CNY
    • General tax budget, Energy Supplier, Report regularly on the official website, 700 CNY
  • Which of the following carbon tax policies do you prefer?
    • Subsidies/grants for clean energy technology, Bank, Report regularly on the official website, 2000 CNY
    • Subsidies/grants for low-carbon technologies or CCUS, Government, Regularly report on the official website under the supervision of an independent third party, 150 CNY
    • General tax budget, Government, Report regularly on the official website, 1200 CNY
    • Subsidies/grants for clean energy technology, Energy Supplier, Regularly report on the official website under the supervision of an independent third party, 350 CNY
  • Which of the following carbon tax policies do you prefer?
    • Subsidies/grants for low-carbon technologies or CCUS, Bank, Regularly report on the official website under the supervision of an independent third party, 2000 CNY
    • Subsidies/grants for clean energy technology, Government, No process report, 350 CNY
    • General tax budget, Energy Supplier, No process report, 150 CNY
    • Subsidies/grants for clean energy technology, Bank, Regularly report on the official website under the supervision of an independent third party, 700 CNY

References

  1. Huang, G.; Xu, Z.; Qu, X.; Cao, J.; Long, S.; Yang, K.; Hou, H.; Wang, Y.; Ma, X. Critical climate issues toward carbon neutrality targets. Fundam. Res. 2022, 2, 396–400. [Google Scholar] [CrossRef] [PubMed]
  2. Xu, H.; Xia, B.; Jiang, S. The Impact of Industrial Added Value on Energy Consumption and Carbon Dioxide Emissions: A Case Study of China. Sustainability 2023, 15, 16201. [Google Scholar] [CrossRef]
  3. Hao, J.; Gao, F.; Fang, X.; Nong, X.; Zhang, Y.; Hong, F. Multi-factor decomposition and multi-scenario prediction decoupling analysis of China’s carbon emission under dual carbon goal. Sci. Total Environ. 2022, 841, 156788. [Google Scholar] [CrossRef] [PubMed]
  4. Chang, W.-Y.; Wang, S.; Song, X.; Zhong, F. Economic effects of command-and-control abatement policies under China’s 2030 carbon emission goal. J. Environ. Manag. 2022, 312, 114925. [Google Scholar] [CrossRef] [PubMed]
  5. OECD. Environmental Taxation: A Guide for Policy Makers. 2011. Available online: https://www.oecd.org/env/tools-evaluation/48164926.pdf (accessed on 13 January 2023).
  6. International Monetary Fund. Fiscal Monitor: How to Mitigate Climate Change. 2019. Available online: https://www.imf.org/en/Publications/FM/Issues/2019/09/12/fiscal-monitor-october-2019 (accessed on 18 October 2022).
  7. Maestre-Andrés, S.; Drews, S.; van den Bergh, J. Perceived fairness and public acceptability of carbon pricing: A review of the literature. Clim. Policy 2019, 19, 1186–1204. [Google Scholar] [CrossRef]
  8. World Bank. State and Trends of Carbon Pricing. 2019. Available online: https://openknowledge.worldbank.org/handle/10986/31755 (accessed on 18 October 2022).
  9. Saez, E. Tax Incidence and Efficiency Costs of Taxation. 2019. Available online: https://eml.berkeley.edu/~saez/course131/taxincidence_ch19.pdf (accessed on 18 October 2022).
  10. McEldowney, J.; Salter, D. Environmental taxation in the UK: The climate change levy and policy making Denning Law. Denning LJ 2015, 28, 37–65. [Google Scholar] [CrossRef]
  11. Shmelev, S.E.; Speck, S.U. Green fiscal reform in Sweden: Econometric assessment of the carbon and energy taxation scheme Renew. Sustain. Energy Rev. 2018, 90, 969–981. [Google Scholar] [CrossRef]
  12. Ionescu, L. The economics of the carbon tax: Environmental performance, sustainable energy, and green financial behavior. Geopolit. Hist. Int. Relat. 2020, 12, 101–107. [Google Scholar] [CrossRef]
  13. Carattini, S.; Kallbekken, S.; Orlov, A. How to win public support for a global carbon tax. Nature 2019, 565, 289–291. [Google Scholar] [CrossRef]
  14. Szasz, J. Which approaches to climate policy decrease carbon dioxide emissions? Evidence from US states, 1997–2017. Energy Res. Soc. Sci. 2023, 97, 102969. [Google Scholar] [CrossRef]
  15. Benavente, J.M.G. Impact of a carbon tax on the Chilean economy: A computable general equilibrium analysis. Energy Econ. 2016, 57, 106–127. [Google Scholar] [CrossRef]
  16. Olivier, J.G.J.; Bouwman, A.F.; Van der Maas, C.W.M.; Berdowski, J.J.M. Emission database for global atmospheric research (EDGAR). Environ. Monit. Assess. 1994, 31, 93–106. [Google Scholar] [CrossRef] [PubMed]
  17. Tsang, F.; Burge, P. Paying for Carbon Emissions Reduction; RAND Corporation: Santa Monica, CA, USA, 2011; Available online: https://www.rand.org/pubs/occasional_papers/OP312.html (accessed on 18 January 2023).
  18. Alberini, A.; Bigano, A.; Ščasný, M.; Zvěřinová, I. Preferences for Energy Efficiency vs. Renewables: What Is the Willingness to Pay to Reduce CO2 Emissions? Ecol. Econ. 2018, 144, 171–185. [Google Scholar] [CrossRef]
  19. Kotchen, M.J.; Boyle, K.J.; Leiserowitz, A.A. Willingness-to-pay and policy-instrument choice for climate-change policy in the United States. Energy Policy 2013, 55, 617–625. [Google Scholar] [CrossRef]
  20. Fabre, A.; Douenne, T. Can We Reconcile French People with the Carbon Tax? Disentangling Beliefs from Preferences; FAERE—French Association of Environmental and Resource Economists: Paris, France, 2019; Available online: https://ideas.repec.org/p/fae/wpaper/2019.10.html (accessed on 18 January 2024).
  21. Farrell, N. What factors drive inequalities in carbon tax incidence? Decomposing socioeconomic inequalities in carbon tax incidence in Ireland. Ecol. Econ. 2017, 142, 31–45. [Google Scholar] [CrossRef]
  22. Rausch, S.; Metcalf, G.E.; Reilly, J.M. Distributional impacts of carbon pricing: A general equilibrium approach with micro-data for households. Energy Econ. 2011, 33, S20–S33. [Google Scholar] [CrossRef]
  23. Carattini, S.; Baranzini, A.; Thalmann, P.; Varone, F.; Vöhringer, F. Green taxes in a post-Paris world: Are millions of nays inevitable? Environ. Resour. Econ. 2017, 68, 97–128. [Google Scholar] [CrossRef]
  24. Hammerle, M.; Best, R.; Crosby, P. Public acceptance of carbon taxes in Australia. Energy Econ. 2021, 101, 105420. [Google Scholar] [CrossRef]
  25. Douenne, T.; Fabre, A. French attitudes on climate change, carbon taxation and other climate policies. Ecol. Econ. 2020, 169, 106496. [Google Scholar] [CrossRef]
  26. Marten, M.; van Dender, K. The Use of Revenues from Carbon Pricing; OECD Taxation Working Papers 2019, No. 43; OECD Publishing: Paris, France, 2019. [Google Scholar] [CrossRef]
  27. Conway, D.; Richards, K.; Richards, S.; Keenlyside, P.; Mikolajczyk, S.; Streck, C.; Ross, J.; Anthony Liu, A.; Tran, A. Carbon Tax Guide: A Handbook for Policy Makers; No. 129668; The World Bank: Washington, DC, USA, 2017; pp. 1–172. Available online: http://documents.worldbank.org/curated/en/728421535605566659/Carbon-Tax-Guide-A-Handbook-for-Policy-Makers (accessed on 18 January 2024).
  28. Morris, A.C. Proposal 11: The Many Benefits of a Carbon Tax. 15 Ways to Rethink the Federal Budget; Brookings Institution: Washington, DC, USA, 2013; pp. 63–69. Available online: https://www.ourenergypolicy.org/wp-content/uploads/2013/07/Carbon-Tax.pdf (accessed on 15 October 2024).
  29. Orme, B.K. Getting Started with Conjoint Analysis: Strategies for Product Design and Pricing Research; Madison (WI) Research Publishers LLC: Manhattan Beach, CA, USA, 2006. [Google Scholar]
  30. Green, P.E.; Rao, V.R. Conjoint measurement-for quantifying judgmental data. J. Mark. Res. 1971, 8, 355–363. [Google Scholar] [CrossRef]
  31. Johnson, R.M. Trade-off analysis of consumer values. J. Mark. Res. 1974, 11, 121–127. [Google Scholar] [CrossRef]
  32. Alriksson, S.; Öberg, T. Conjoint analysis for environmental evaluation. Environ. Sci. Pollut. Res. 2008, 15, 244–257. [Google Scholar] [CrossRef] [PubMed]
  33. Lieder, M.; Asif, F.M.A.; Rashid, A. A conjoint analysis of circular economy value propositions for consumers: Using “washing machines in Stockholm” as a case study. J. Clean. Prod. 2018, 172, 264–273. [Google Scholar] [CrossRef]
  34. Beggs, S.; Cardell, S.; Hausman, J. Assessing the potential demand for electric cars. J. Econom. 1981, 17, 1–19. [Google Scholar] [CrossRef]
  35. Daniels, R.F.; Hensher, D.A. Valuation of environmental impacts of transport projects: The challenge of self-interest proximity. J. Transp. Econ. Policy 2000, 34, 189–214. [Google Scholar]
  36. Gao, S.; Smits, M.; Wang, C. A conjoint analysis of corporate preferences for the sectoral crediting mechanism: A case study of Shanxi Province in China. J. Clean. Prod. 2016, 131, 259–269. [Google Scholar] [CrossRef]
  37. Klahr, D.; Wallace, J.G. An information processing analysis of some Piagetian experimental tasks. Cogn. Psychol. 1970, 1, 358–387. [Google Scholar] [CrossRef]
  38. Raz, C.; Piper, D.; Haller, R.; Nicod, H.; Dusart, N.; Giboreau, A. From sensory marketing to sensory design: How to drive formulation using consumers’ input? Food Qual. Prefer. 2008, 19, 719–726. [Google Scholar] [CrossRef]
  39. Bigsby, H.R.; Ozanne, L.K. The purchase decision: Consumers and environmentally certified wood products. For. Prod. J. 2002, 52, 100–105. [Google Scholar]
  40. Scharin, H.; Wallström, L. Public support for carbon taxes: The role of political communication and trust. Environ. Politics 2018, 27, 1085–1105. [Google Scholar]
  41. Klenert, D.; Mattauch, L.; Combet, E.; Edenhofer, O.; Hepburn, C.; Rafaty, R.; Stern, N. Making carbon pricing work for citizens. Nat. Clim. Change 2018, 8, 669–677. [Google Scholar] [CrossRef]
  42. Carattini, S.; Carvalho, M.; Fankhauser, S. Overcoming public resistance to carbon taxes. Wiley Interdisciplinary Reviews. Clim. Change 2018, 9, e531. [Google Scholar] [CrossRef]
  43. Awunyo-Vitor, D.; Ishak, S.; Seidu Jasaw, G. Urban Households’ willingness to pay for improved solid waste disposal services in Kumasi Metropolis, Ghana. Urban Stud. Res. 2013, 2013, 659425. [Google Scholar] [CrossRef]
  44. Capasso, S.; Cicatiello, L.; De Simone, E.; Gaeta, G.L.; Mourão, P.R. Fiscal transparency and tax ethics: Does better information lead to greater compliance? J. Policy Model. 2021, 43, 1031–1050. [Google Scholar] [CrossRef]
  45. Duan, H.X.; Lü, Y.-L.; Li, L. Chinese public’s willingness to pay for CO2 emissions reductions: A case study from four provinces/cities. Adv. Clim. Change Res. 2014, 5, 100–110. [Google Scholar] [CrossRef]
  46. Yang, J.; Zou, L.; Lin, T.; Wu, Y.; Wang, H. Public willingness to pay for CO2 mitigation and the determinants under climate change: A case study of Suzhou, China. J. Environ. Manag. 2014, 146, 1–8. [Google Scholar] [CrossRef]
  47. Klok, J.; Larsen, A.; Dahl, A.; Hansen, K. Ecological tax reform in Denmark: History and social acceptability. Energy Policy 2006, 34, 905–916. [Google Scholar] [CrossRef]
  48. Sun, C.; Yuan, X.; Yao, X. Social acceptance towards the air pollution in China: Evidence from public’s willingness to pay for smog mitigation. Energy Policy 2016, 92, 313–324. [Google Scholar] [CrossRef]
  49. Khastar, M.; Aslani, A.; Nejati, M. How does carbon tax affect social welfare and emission reduction in Finland? Energy Rep. 2020, 6, 736–744. [Google Scholar] [CrossRef]
Figure 1. Detailed experimental procedures.
Sustainability 16 09407 g001
Figure 2. (a) Relative importance of different CTP attributes for all residents; (b) relative importance of different CTP attributes for residents without an understanding of the CTP; (c) relative importance of different CTP attributes for residents with some understanding of the CTP; (d) relative importance of different CTP attributes for residents with a clear understanding of the CTP.
Sustainability 16 09407 g002
Table 1. Specific attributes and levels of the CBCA experiment.
AttributesLevels
Use of carbon tax revenueGeneral tax budget
Subsidies/grants for clean energy technology
Subsidies/grants for low-carbon technologies or CCUS
Carbon tax policy implementersBank
Energy supplier
Government
Transparency of carbon tax policy implementation processNo process report
Report regularly on the official website
Regularly report on the official website under the supervision of an independent third party
Cost of carbon tax (CNY)150
350
700
1200
2000
Table 2. Percentages of respondents with different socioeconomic characteristics.
Socioeconomic CharacteristicsPercentage (%)
GenderMale41.24%
Female58.76%
Age16–3053.17%
31–4542.48%
46–603.85%
>600.50%
MarriageMarried67.58%
Single32.42%
Educational levelMiddle school or below2.48%
High school62.86%
Bachelor30.93%
Master or above3.73%
Family members11.12%
23.73%
339.63%
427.70%
520.50%
65.84%
>61.49%
ResidenceUrban85.84%
Rural14.16%
Family disposable income0–30,0002.11%
30,000–50,0008.70%
50,000–100,00019.38%
100,000–200,00040.37%
>200,00027.08%
Inconvenient2.36%
Annual electricity consumption0–100033.17%
1000–250042.24%
2500–500020.99%
>50003.60%
Annual gas consumption0–80041.86%
800–150037.14%
1500–300018.14%
>30002.86%
Annual gasoline consumption0–250035.78%
2500–500030.43%
5000–10,00026.46%
>10,0007.33%
Climate change impactNone3.23%
Little20.75%
Some59.01%
Huge17.02%
Understanding of carbon taxNone17.39%
Some67.08%
Clear15.53%
Table 3. Willingness to pay for different levels of all attributes.
AttributesLevelsAnnual Willingness to Pay (CNY)
Use of carbon tax revenueGeneral tax budget0.00
Subsidies/grants for clean energy technology503.90
Subsidies/grants for low-carbon technologies or CCUS611.81
Carbon tax policy implementersBank0.00
Energy supplier160.55
Government424.81
Transparency of carbon tax policy implementation processNo process report0.00
Report regularly on the official website1122.74
Regularly report on the official website under the supervision of an independent third party1482.05
Mean 1435.28
Table 4. Willingness to pay for different levels of all attributes (respondents with different educational levels).
AttributesLevelsWillingness to Pay
Educational Level (CNY)
High SchoolBachelor’s DegreeMaster’s Degree or Above
Use of carbon tax revenueGeneral tax budget0.00 0.00 76.72
Subsidies/grants for clean energy technology698.28 297.40 0.00
Subsidies/grants for low-carbon technologies or CCUS743.72 443.06 392.44
Carbon tax policy implementersBank0.00 0.00 0.00
Energy supplier163.26 119.92 65.99
Government495.88 338.70 283.56
Transparency of carbon tax policy implementation processNo process report0.00 0.00 0.00
Report regularly on the official website1246.08 977.76 1521.10
Regularly report on the official website under the supervision of an independent third party1608.80 1344.60 2033.16
Mean 1652.001173.811457.65
Table 5. Willingness to pay for different levels of all attributes (respondents with family disposable income).
AttributesLevelsWillingness to Pay
Family Disposable Income per Year (CNY)
0–30,00030,000–50,000100,000–200,000>200,000
Use of carbon tax revenueGeneral tax budget108.95 0.00 0.00 0.00
Subsidies/grants for clean energy technology0.00 1070.62 501.02 472.23
Subsidies/grants for low-carbon technologies or CCUS118.10 1320.41 541.81 681.99
Carbon tax policy implementersBank0.00 0.00 0.00 0.00
Energy supplier188.23 385.03 183.64 43.75
Government470.71 441.62 387.75 395.71
Transparency of carbon tax policy implementation processNo process report0.00 0.00 0.00 0.00
Report regularly on the official website456.71 907.38 1067.22 1489.62
Regularly report on the official website under the supervision of an independent third party575.60 1064.44 1333.90 2048.86
Mean 639.431729.831338.451710.72
Table 6. Willingness to pay for different levels of all attributes (respondents with different understanding of carbon tax).
AttributesLevelsWillingness to Pay
Understanding of Carbon Tax (CNY)
NoneSomeClear
Use of carbon tax revenueGeneral tax budget000
Subsidies/grants for clean energy technology442.13 455.66 979.07
Subsidies/grants for low-carbon technologies or CCUS342.12 554.78 1749.54
Carbon tax policy implementersBank0.00 0.00 0.00
Energy supplier123.40 158.68 86.41
Government335.19 420.21 478.93
Transparency of carbon tax policy implementation processNo process report0.00 0.00 0.00
Report regularly on the official website850.72 1010.37 2847.26
Regularly report on the official website under the supervision of an independent third party1122.91 1342.81 3597.32
Mean 1072.161314.173246.18
Disclaimer/Publisher’s Note: The statements, opinions and data contained in all publications are solely those of the individual author(s) and contributor(s) and not of MDPI and/or the editor(s). MDPI and/or the editor(s) disclaim responsibility for any injury to people or property resulting from any ideas, methods, instructions or products referred to in the content.

