Article

Can ESG Disclosure Stimulate Corporations’ Sustainable Green Innovation Efforts? Evidence from China

Asia-Europe Institute, Universiti Malaya, Kuala Lumpur 50603, Malaysia
*
Author to whom correspondence should be addressed.
Sustainability 2024, 16(21), 9390; https://doi.org/10.3390/su16219390
Submission received: 7 October 2024 / Revised: 24 October 2024 / Accepted: 26 October 2024 / Published: 29 October 2024

Abstract

:
The Environmental, Social, and Governance (ESG) Composite Rating denotes corporations’ capability for supporting sustainable development activities, social responsibility, and transparent and ethical governance. It aims to inform investors and stakeholders about the company’s sustainability and social responsibility risks. ESG has increasingly become an informal yet significant driving force in promoting sustainable green innovation within the diversified co-governance environmental management system. This paper examines the dynamic relationship between ESG performance and sustainable green innovation practices in Chinese A-share listed companies from 2011 to 2022. The results show a positive correlation between ESG performance and the level of corporate sustainable green innovation. They also validate the moderating roles of informal external pressure and internal development demands. While the moderating effect of public environmental concern (PEC) is not significant, corporate digital transformation (CDT) significantly and positively moderates the relationship between ESG performance and sustainable green innovation. These findings offer policymakers and corporations a means to formulate a framework to shape the conduct of corporations to meet the market’s green development needs and to establish instruments that promote green innovation.

1. Introduction

Global corporate management practices have undergone profound transformations due to the challenges posed by climate change and the increasing environmental awareness of stakeholders [1,2]. The Environmental, Social, and Governance (ESG) framework has gradually become a core indicator for assessing corporate sustainability performance. From the perspectives of resource-based theory and organizational learning theory, green innovation has become a strategic requirement for companies to achieve sustainable development and is crucial for long-term growth and adaptation in a dynamic environment [3]. Although the ESG framework has become a mainstream standard for evaluating corporate social responsibility and environmental performance, its role in driving corporate innovation remains uncertain and highly debated. On the one hand, proponents argue that ESG practices can enhance corporate innovation capabilities through resource integration and reputation building [4]. By demonstrating their commitment to environmental and social responsibility, investments in environmental responsibility (similar to ESG investments) can effectively enhance a firm’s reputation and brand value, thereby gaining broader trust from consumers and investors [4]. On the other hand, critics suggest that environmental investments may increase operational costs in the short term, thereby dampening innovation motivation, especially in the absence of effective management and external support [5,6]. The existing literature has not yet fully explained this paradox, resulting in significant differences in expectations regarding the innovation benefits of ESG strategies when companies implement them.
Current research generally holds that voluntary ESG disclosures provide companies with greater flexibility and operational feasibility [7]. First, ESG disclosures allow companies to determine the content and scope of the information based on their unique business environment and strategic goals, thereby aligning environmental responsibility more closely with their business objectives [8]. At the same time, ESG disclosures can alleviate information asymmetry between investors and firms, enabling investors to better understand ESG-related risks and mitigate adverse selection problems [7]. For example, research conducted in EU countries shows that ESG disclosures significantly enhance a company’s financing capability and play a key role in reducing uncertainty and failure rates in risk assessments [9].
Compared with informal environmental regulations such as ESG, traditional environmental regulations (e.g., emissions standards and pollution control laws) are designed to enforce corporate compliance and prevent environmental degradation through strict legal requirements [10,11]. However, these top-down, mandatory environmental management measures often face numerous challenges during implementation. First, China’s vast territory and uneven economic development present significant challenges to the implementation of formal environmental regulations, including local protectionism and weak enforcement [12]. Second, the rigidity of formal environmental regulations hinders their ability to adapt to rapidly changing market conditions and technological innovations, lacking the necessary flexibility to address emerging environmental issues [11]. Moreover, the economic burdens imposed on enterprises, such as investments in clean technology and pollution control measures, can have a negative impact on their profitability [13]. Furthermore, setting fixed emission targets and allocating quotas to achieve reduction goals may lead to “quota competition”, which can weaken the incentives for firms to innovate and distort market competition [14]. Finally, formal environmental regulations may stifle green innovation, as firms may only strive to meet the minimum legal requirements rather than pursue higher environmental standards [7].
Given this context, many scholars have attempted to explore the relationship between ESG-related variables and innovation-related variables. From the perspective of the stakeholder theory, firms that effectively manage relationships with diverse stakeholders—including employees, customers, communities, and regulators—are more likely to engage in innovation that is both profitable and sustainable [3]. Additionally, the resource-based view asserts that companies with unique ESG-related resources and capabilities are better positioned to develop innovative solutions that offer a competitive edge [15]. In addition, empirical research has also explored the direct link between them. For example, recent findings suggest that ESG practices can significantly impact green innovation by alleviating financing constraints, aligning with stakeholder environmental expectations, and strengthening organizational identity. These elements collectively enhance an enterprise’s ability to pursue innovative, eco-friendly projects, underscoring ESG’s essential role in advancing sustainable corporate practices.
However, despite the increasing attention given to the ESG–innovation relationship, several research gaps remain. First, previous studies have primarily focused on the relationship between ESG and innovation, with less attention given to sustainable green innovation, which better reflects a company’s capacity and potential for sustainable green development. Second, most relevant research concentrates on the direct relationship between the ESG framework and green innovation [16], with limited research on the combined effects of ESG practices, external pressures—like public environmental concern (PEC)—and internal capabilities—like corporate digital transformation (CDT)—on sustainable green innovation. Third, in empirical research conducted in China, PEC is still in the exploratory stage, and the moderating effect of PEC on the relationship between ESG and sustainable green innovation has not been adequately studied. Fourth, empirical studies from emerging markets like China remain limited, even though these markets’ ESG reporting and CDT are rapidly developing, necessitating more empirical research to explore their impacts and mechanisms. Finally, while the impact of ESG may vary across different regions and industries, there is a lack of related research.
To address these gaps, this study aims to investigate how ESG performance affects corporate sustainable green innovation. Specifically, this research seeks to examine the moderating roles of CDT and PEC in moderating the relationship between ESG performance and sustainable green innovation. Furthermore, the study explores the heterogeneity of this relationship across different industries and regions. The key research questions include: (1) Can and how does ESG performance influence sustainable green innovation? (2) Do CDT and PEC have moderating effects on the relationship between ESG performance and sustainable green innovation? (3) Can and how do regional and industry characteristics influence the relationship between ESG performance and sustainable green innovation? This study is based on a sample of A-share listed companies in China from 2011 to 2022.
This research makes several theoretical and empirical contributions to the existing literature on ESG, PEC, CDT, and sustainable green innovation. First, the findings offer actionable insights for policymakers and business leaders to encourage transparent ESG disclosures, integrate ESG principles into corporate strategies, and promotes green innovation through financial incentives and regulatory frameworks, thereby fostering a more sustainable and digitally enabled business environment. Second, the research highlights the significant moderating role of CDT in the ESG–innovation relationship, emphasizing the potential of advanced digital technologies to enhance ESG initiatives and drive green innovation. Third, although the direct moderating effect of PEC was not significant, the study provides insights into the evolving role of societal attention towards environmental issues, suggesting future potential. Fourth, the study explores the heterogeneity of ESG’s impact across regions and industries, revealing that this influence varies due to regional differences and industrial endowments. Finally, the methodological rigor, including robustness checks with alternative variables and instrumental variable methods, ensures the reliability and validity of the results.

2. Literature Review and Hypothesis Development

2.1. ESG Disclosure and Firms’ Sustainable Green Innovation

Developing a comprehensive ESG performance rating is crucial for advancing corporate sustainable green innovation. Sustainable green innovation refers to a corporation’s continuous introduction of new products, services, or processes to adapt to market changes and technological advancements, thereby maintaining its competitive edge and long-term development [17]. A multinational study based on empirical data from China and Japan indicates that while environmental disclosure in China can enhance corporate benefits and sustainability over the long term, China’s emerging market still requires improvement in terms of carbon emissions. There is a pressing need to implement more “voluntary green” measures to boost green innovation capabilities [18].
Studies have shown that corporations with strong ESG performance often achieve better innovation outcomes. ESG performance can stimulate market incentives and accelerate investment in environmental aspects, such as the adoption of clean technologies and circular economy models, which can expedite the output of green innovative products [2]. Furthermore, ESG performance encourages corporations to lead in green transformation initiatives [19]. Public evaluation of corporate ESG implementation can enhance the transparency of corporate disclosures, emphasize meeting stakeholder needs, and alleviate the conflict of information asymmetry between corporations and stakeholders [20]. Activities within the social dimension, such as improving the transparency of corporate behavior, can enhance the corporation’s brand image and employee satisfaction, thereby increasing the innovative drive within the corporation [21].
Effective ESG performance not only provides a solid foundation for firms’ internal governance structures to support green transformation, but it also acts as an external stimulus that drives a firm’ s sustained green innovation efforts, thereby helping firms secure long-term sustainable competitive advantages in highly competitive markets. On the one hand, the enhancement of a firm’s comprehensive capabilities in Environmental, Social Responsibility, and Governance (ESG) dimensions can create a more stable environment conducive to innovative activities [22]. The disclosure of ESG performance not only reflects the firm’s commitment to these practices but also signals its proactive alignment with governmental and societal expectations for green and sustainable development [4,23]. However, if there is a lack of transparency in such disclosures, this may lead to information asymmetry among stakeholders [24], resulting in incomplete contracting [25], which ultimately triggers moral hazards and undermines the firm’s ability to engage in sustainable innovation [2].
On the other hand, unlike traditional approaches to building competitive advantages that rely on the monopolistic control of resources, the ESG strategy emphasizes inclusive and sustainable development through green technology and product innovation, thereby establishing a more resilient and long-term competitive position. A higher ESG rating can not only enhance a firm’s reputation and attract greater interest from investors but also facilitate access to green financing and other forms of capital, further promoting investments in green innovation projects [18]. With the effective allocation of these resources, firms can develop more environmentally friendly products, thereby achieving their social responsibility objectives while simultaneously enhancing market competitiveness and expanding their market presence [20]. Based on these insights, this study proposes the following hypothesis:
H1. 
ESG performance has a positive impact on Firms Sustainable Green Innovation.

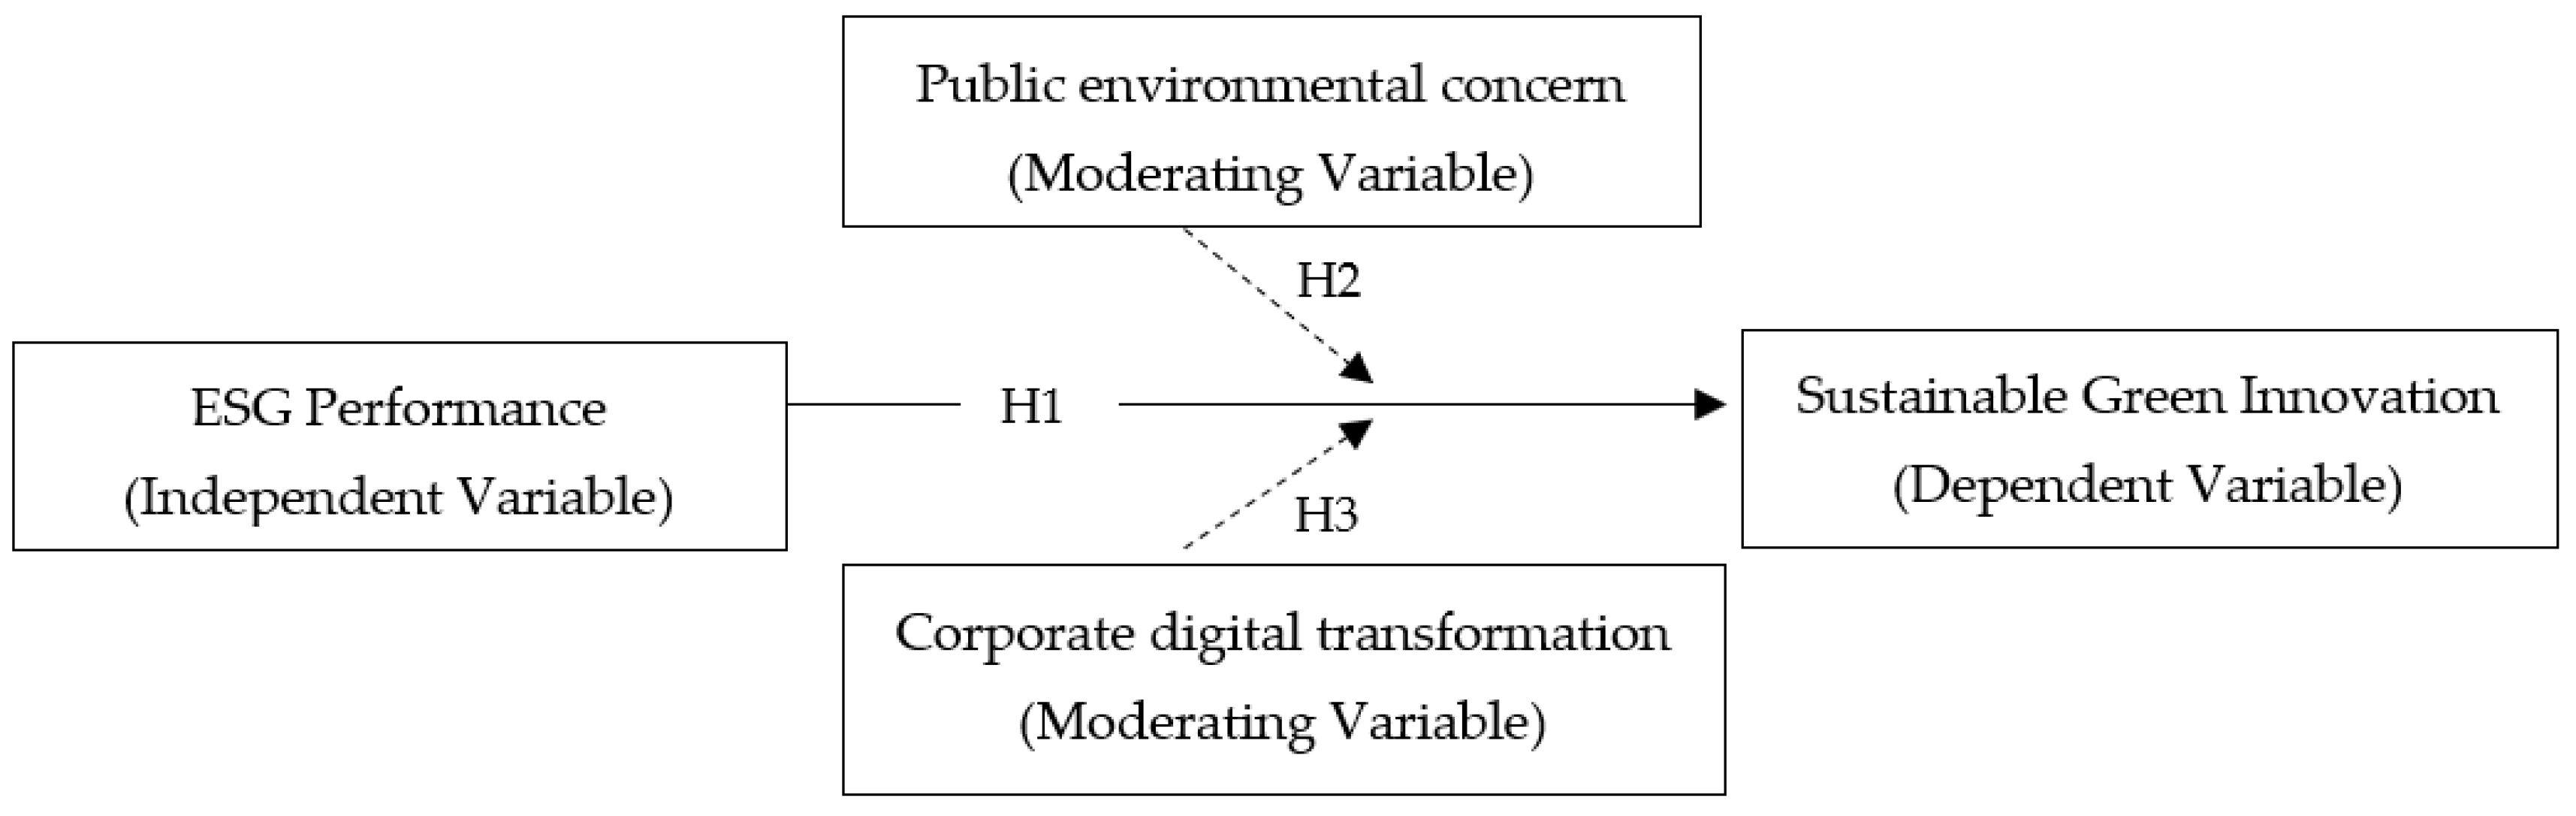
2.2. Moderation Effect of Public Environmental Concern (PEC) and Corporate Digital Transformation (CDT)

PEC influences corporate behavior and strategic planning. With society’s growing attention to environmental issues, corporations must invest additional efforts and resources to meet ecological requirements [16]. This heightened societal attention can amplify the relationship between ESG and sustainable green innovation, as corporations seek to align their operations with social expectations and demands. Corporations that proactively respond to PEC might gain a competitive edge through eco-friendly products and processes [26]. Moreover, PEC can prompt firms to invest more in R&D for sustainability, fostering innovation that could not only address environmental challenges but also open new market opportunities [27].
Previous studies have attempted to empirically analyze the relationships between PEC, ESG performance, and corporate green innovation. The findings suggest that heightened public concern for environmental issues significantly enhances corporate ESG performance, particularly in large enterprises and in regions with a higher degree of marketization [28]. Additionally, based on a quasi-natural experiment of the PM 2.5 pollution surge in China at the end of 2011, it was observed that, compared to non-heavily polluting firms, the probability of CEO turnover in heavily polluting firms significantly increased under heightened PEC. To mitigate public pressure, these heavily polluting firms responded by increasing green investments to demonstrate their commitment to environmental responsibilities and to address external environmental demands [27]. However, although existing studies have examined the independent effects of PEC on ESG performance and green innovation, there remains a lack of comprehensive research exploring how PEC moderates the relationship between ESG ratings and corporate green innovation. This research gap underscores the need for further investigation into the moderating role of PEC in the ESG–green innovation relationship to construct a more complete theoretical framework and provide empirical support. This leads us to the next hypothesis:
H2. 
PEC positively moderates the relationship between ESG and corporate sustainable green innovation.
Sustainable green innovation requires the support of advanced digital technologies. As digital technology rapidly evolves, CDT has become a powerful driver for sustainable green innovation. Despite challenges such as technological barriers, adapting organizational culture, and data security issues, current research highlights the advantages of CDT in enhancing the relationship between ESG and corporate sustainable green innovation [29]. Digital technologies enable corporations to improve ESG performance through better data collection, analysis, and reporting [30]. Tools such as big data analytics, the Internet of Things (IoT), and artificial intelligence (AI) help firms identify risks and opportunities related to sustainability, optimal resource usage, and the development of innovative solutions to environmental and social challenges [30,31]. Additionally, these digital tools enable firms to predict market trends and consumer demands more accurately, guiding their innovative activities [31].
CDT also facilitates more effective stakeholder engagement, allowing corporations to better understand and meet the expectations of customers, investors, and regulators concerning ESG issues. Research indicates that corporations in regions with strong digital capabilities tend to better manage green innovation from the source, maximizing the elimination or minimization of pollutant emissions from the beginning of the process [32]. Therefore, corporations that successfully integrate digital technologies into their ESG strategies may experience a stronger positive impact on their innovation outcomes [29]. Based on the above opinions, the study proposes the following hypothesis:
H3. 
CDT positively moderates the relationship between ESG performance and sustainable green innovation.
Building on above the proposed hypotheses, we present the theoretical research model for this study in Figure 1.

3. Research Methodology

3.1. Sample Selection and Data Sources

This study selected Shanghai and Shenzhen A-share listed companies (2011–2022) as the research sample due to data limitations. To ensure the representativeness and rigor of the sample, we selected only companies with normal listing status, excluding ST and *ST companies to maintain stable operations and complete financial and ESG data while removing firms with missing key variables to improve reliability. The 2011–2022 period was chosen because 2011 marked a key turning point in China’s green development, with the introduction of low-carbon city pilot policies and carbon trading programs. This time frame best reflects corporate behavior in green innovation, ESG performance, and low-carbon transformation, making it ideal for analyzing the relationship between ESG and green innovation. Next, to ensure data accuracy, the sample was cleansed by applying a 1% winsorization to all continuous variables. Consequently, a total of 19,637 firm-year observations were obtained. The ESG index used in this paper was sourced from Huazheng, while the remaining company-level financial data and industry-characteristic data were derived from the CSMAR database and the WIND database.

3.2. Variable Selection

3.2.1. Independent Variable

The ESG Composite Rating (ESG_score) consolidates a company’s performance across environmental, social, and governance dimensions to evaluate its overall sustainability and ethical impact. Adopting the methodology of Li et al. [33], which has been widely acknowledged for its relevance in the Chinese context, this study employs the Huazheng ESG rating system. The Huazheng system classifies corporate ESG performance into nine levels, ranging from C to AAA, representing the lowest to the highest sustainability scores [34,35]. These tiers are assigned numerical values from 1 (C) to 9 (AAA), with higher values indicating superior ESG practices. To ensure the robustness of the results and their generalizability across varying contexts, the Bloomberg ESG Index was also incorporated for robustness testing [36].

3.2.2. Dependent Variable

Firms’ Sustainable Green Innovation (Innovation) refers to the continuous development and implementation of environmentally friendly products, processes, or services that contribute to sustainability and reduce ecological footprints [37]. Following the methodology of He et al. [36], this paper quantified the degree of Sustainable Green Innovation by comparing the number of green patent applications between previous and subsequent periods. Specifically, Firms’ Sustainable Green Innovation is gauged by the rate of sequential growth—the ratio of the aggregate number of patent applications between years t − 1 and t to that of years t − 2 and t − 1. This rate is further multiplied by the total patent applications accrued between years t − 1 and t to produce a quantifiable measure of innovative persistence. The formula is shown as below.
I n n o v a t i o n t = P a t e n t t + P a t e n t t 1 P a t e n t t 1 + P a t e n t t 2 × ( P a t e n t t + P a t e n t t 1 )
In this context, I n n o v a t i o n t represents the firm’s sustainable green innovation in year t, while P a t e n t t 2 , P a t e n t t 1 , and P a t e n t t   denote the firm’s green innovation patent application data for years t − 2, t − 1, and t, respectively. To enhance the validity of the conclusions, this study conducted a robustness test following the approach of Fang and Hu [38]. It applied the natural logarithm of the sum of green patent applications (patent).

3.2.3. Moderation Variables

PEC (Baidu_Index) measures societal attention towards environmental stewardship and pollution remediation [39]. The internet, facilitated by its expansive reach, has become an indispensable platform for public engagement, knowledge dissemination on environmental governance, and social issue advocacy. Within this digital ecosystem, Baidu’s search engine, which commands over a 70% market share in Mainland China [35], served as a barometer for public interest. In this vein, following the data measurement protocols established by Tao et al. [35], this study employed the Baidu Index, leveraging keyword search data on “environmental pollution” and “haze”, to develop an index that encapsulates PEC on an annual and regional scale for publicly listed companies.
CDT (DIGI_score) is significant for China’s high-quality development and acts as a catalyst for the evolution and progression of conventional industries [40]. Following the approaches used by Wu et al. and Zhao et al., this investigation quantifies CDT through a frequency count of terminologies related to nine key dimensions: AI technology, big data, cloud-based computing services, blockchain, implementation of digital technologies, software, internet business models, smart manufacturing systems, and modern information technology systems [40,41].

3.2.4. Control Variables

In line with the methodological frameworks adopted by Tang [34], as well as Wang and Chu [32], this study controled for both macro-level and micro-level contingencies to mitigate potential biases stemming from internal and external corporate forces. At the macro level, the regional GDP (gdp) and the Herfindahl–Hirschman Index (hindex) were introduced into the model to counterbalance any bias originating from disparities in regional economic prosperity and industrial concentration [42]. At the micro level, this investigation drew on the methods from Tan and Zhu [43] and Wu et al. [20], ensuring that intrinsic corporate attributes—such as Tobin’s Q (tpq), corporate age (age), equity concentration (holder), and the number of directors (board)—were duly accounted for in our analytical model. The codes corresponding to these variables are systematically laid out in Table 1.

3.3. Empirical Model

To verify the influence of ESG performance ratings on firms’ sustainable green innovation (model 2) and the moderating effects of PEC (model 3) and CDT (model 4), this study employed the following model for exploration:
I n n o v a t i o n i , t = β 0 + β 1 E S G _ s c o r e i , t + β 2 C o n t r o l s i , t + μ 1 Y e a r F E + μ 2 F i r m F E + ε i , t
I n n o v a t i o n i , t = β 0 + β 1 E S G _ s c o r e i , t + β 2 B a i d u _ I n d e x i , t + β 3 B a i d u _ I n d e x i , t × E S G _ s c o r e i , t + β 4 C o n t r o l s i , t + μ 1 Y e a r F E + μ 2 F i r m F E + ε i , t
I n n o v a t i o n i , t = β 0 + β 1 E S G _ s c o r e i , t + β 2 D I G I _ s c o r e i , t + β 3 D I G I _ s c o r e × E S G _ s c o r e i , t + β 4 C o n t r o l s i , t + μ 1 Y e a r F E + μ 2 F i r m F E + ε i , t
In the above formulas, i represents the listed firms, t denotes time, and ϵ represents the random error term. Innovation is the independent variable, while ESG_score is the dependent variable. Baidu_Index and DIGI_score are the moderating variables, and Controls denote the set of control variables.

4. Results

4.1. Descriptive Statistics Analysis

Table 2 presents the descriptive statistics of the variables used in this study. It can be observed that the sustainable green innovation levels among the listed companies in China vary significantly, ranging from a low score of 0 to a high of 15.931. This spread underscores the heterogeneity in green innovation capacity across firms. The mean ESG_score stands at 4.124, accompanied by a standard deviation of 1.163, highlighting a substantial diversity in ESG performance across corporations and time, with many firms demonstrating commendable ESG practices.
Regarding the moderating variables, the Baidu_Index has an average of 2.353 and a standard deviation of 2.316, indicating varying levels of public environmental attention among firms. Similarly, the DIGI_score shows a mean of 0.140 and a standard deviation of 0.347, reflecting differences in the level of CDT across firms.
Table 3 displays the Pearson correlation matrix. The correlation coefficient between the ESG_score and Innovation is 0.151, which is statistically significant at the 1% level, indicating a preliminary positive influence of ESG performance ratings on firms’ sustainable green innovation. Additionally, the Baidu_Index and DIGI_score both positively associate with the Innovation and ESG_score values, suggesting the effectiveness of the moderating variables could be preliminarily confirmed. Also, the correlation coefficients for all other variables are below the critical value of 0.6. Meanwhile, this study conducted a collinearity test, and the results indicate a maximum value of 1.22 and a mean of 1.11, both well below the critical threshold, suggesting no severe issues of multicollinearity in the model.

4.2. Regression Results and Analysis

Table 4 presents the regression results of the ESG Composite Rating (ESG_score) on Firms’ Sustainable Green Innovation (Innovation). Column (1) provides the baseline regression without fixed effects. In column (2), firm-level and regional-level control variables are included, while column (3) incorporates additional control variables and applies both firm and year fixed effects. The results consistently show a positive and significant relationship between ESG scores and innovation across all models, suggesting that higher ESG scores are associated with enhanced sustainable green innovation.
Specifically, in the baseline model (1), which does not control for any variables or fixed effects, a one-unit increase in ESG_score is associated with a significant improvement of 0.588 units in the level of corporate green innovation (t = 9.979, p < 0.01). This result indicates that, in the initial analysis, higher ESG scores effectively promote corporate green innovation. When firm-level and regional-level control variables are introduced in model (2), the ESG coefficient slightly decreases to 0.545 (t = 9.229, p < 0.01), but still maintains a significant positive impact. This finding suggests that, after accounting for firm-specific characteristics (e.g., firm size) and external economic conditions (e.g., regional economic development levels), the effect of ESG performance on corporate green innovation remains significant and robust.
In model (3), after further incorporating firm and year fixed effects, the ESG coefficient drops to 0.131 (t = 4.872, p < 0.01). Although the coefficient declines substantially, it still retains a significant positive relationship. This reduction in the coefficient indicates that, after controlling for firm-specific factors (e.g., corporate culture and internal management practices) and temporal trends, the influence of ESG on corporate green innovation is somewhat attenuated. This could be attributed to the fact that, with the inclusion of firm-specific and time-related factors, part of the explanatory power is absorbed by these fixed effects. Nevertheless, the ESG score’s positive effect remains, indicating that firms with higher ESG scores continue to maintain an advantage in green innovation over the long term. This stability may reflect firms’ sustained investments in long-term ESG strategies and the growing emphasis placed on ESG performance by society and the market.

4.3. Robustness Test

The initial findings support Hypothesis 1. To confirm these results, we employed several robustness checks. First, we replaced the independent variable ESG_score with the Bloomberg ESG score (ESG_r) to ensure consistency across the rating methods. Additionally, we substituted the dependent variable (Innovation) with the total number of green patent applications (Patent), broadening the scope of the innovation indicators. Finally, we applied instrumental variable methods using ‘broad ESG’ funds’ holdings and market value to address potential endogeneity. These checks aim to validate the robustness and generalizability of the relationship between ESG and sustainable green innovation.

4.3.1. Alternative Independent Variable

To mitigate potential measurement discrepancies within the model, this study substituted the independent variables from the baseline regression with ESG ratings sourced from Bloomberg [35,36]. This preference for Bloomberg’s ESG rating system is predicated on its global recognition and broad-ranging applicability. Furthermore, the evolution of ESG metrics in China aids corporations in forging a responsible and publicly esteemed social image. Thus, Huazheng, as a Chinese company, might tend to exaggerate its ESG performance in its scoring system [38]. Accordingly, the reevaluation of our research model utilizing Bloomberg’s ESG rating technique serves as an indirect assessment of the robustness of our initial findings and the validity of the proposed ESG rating score within our analysis.
As outlined in Table 5, the outcomes are in line with those from the baseline regression featured in Table 4. Columns (1) through (3) consecutively delineate the univariate regression outcomes, the results with control variables, and the results with control variables plus firm and year fixed effects. The results are consistent with the baseline regression outcomes using Huazheng’s ESG scores as independent variables, with Innovation being significantly positive at the 1% level (β = 0.088, t = 7.059), thereby validating the robustness of the conclusions of this paper.

4.3.2. Alternative Dependent Variable

Drawing upon prior research methodologies [44,45], this study employed the total number of green patent applications as an alternative variable for sustainable green innovation. Table 6 illustrates that the correlation coefficient between ESG_score and patents remains positive and significant at the 1% level, thereby reinforcing the robustness of the central conclusions of this research.

4.3.3. Endogeneity Tests

The baseline results indicate that a high ESG Composite Rating can enhance capabilities for sustainable green innovation. However, considering the potential issues of omitted variables and sample selection bias that could lead to endogeneity [46], this study adopted the instrumental variable method to conduct robustness checks.
Drawing from the previous literature [38], this study utilizes the emergence of ESG-themed public funds in China as an exogenous shock. We employed the number of “pan-ESG” funds holding a firm’s shares (FundN) and the market value of these holdings (FundV) as instrumental variables for the ESG Composite Rating, using the two-stage least squares (2SLS) method for empirical analysis. The rationale for these instrumental variables is twofold. First, ESG-themed public funds could influence corporate governance and positively affect their ESG performance [47], thereby meeting the relevance criterion with the independent variable. Second, Xie and Lyu argue that the shareholding information of “pan-ESG” funds, dictated by fund management corporations, is unlikely to directly impact a firm’s green patent output [48]. Moreover, Fang and Hu assert that corporate green innovation relies significantly on the scientific knowledge or engineering expertise of participants in specific fields, which exceeds the general qualifications expected of fund managers, ensuring the exclusivity of the shareholding information of “pan-ESG” funds [38].
Table 7 displays the results of the instrumental variable regression. Column (1) contains the first-stage regression outcomes, showing that the regression coefficients for the instrumental variables FundN and FundV are significantly positive at the 1% level. This indicates a strong positive relationship between the number of “pan-ESG” funds held and their market value with ESG_score. Column (2) provides the second-stage regression results, with the estimated coefficient for ESG_score being significantly positive. This suggests that even after addressing endogeneity concerns, the ESG composite score continues to support the firm’s sustainable green innovation, thus further confirming Hypothesis 1.
Furthermore, the regression model has conducted statistical tests to ensure the validity of the two sets of instruments employed: First, the F-statistic of 46.656 in the first stage regression surpasses the threshold of 10, indicating no weak instrument variable problem. Second, the Kleibergen–Paap rk LM statistic significantly rejects the “under-identification of instrumental variables” hypothesis at the 1% significance level. Additionally, the F-statistic values for CD (F = 86.71) and KP (F = 46.66) exceed the critical value of 19.93 at the 10% level, rejecting the null hypothesis of “weak identification of instrumental variables.” Moreover, since the number of instruments in this study exceeds the number of endogenous variables, over-identification tests, and endogeneity tests were conducted and passed, as evidenced by a p-value of 0.9862 for the Hansen J statistic and a p-value of 0.0086 for the endogeneity test. These tests affirm that the instruments constructed for this study are reasonable.

5. Further Analysis: Heterogeneity Test and Moderation Effect Analysis

5.1. Heterogeneity Test

The empirical findings demonstrate that the ESG Composite Rating significantly bolsters firm sustainable green innovation. Next, we will further discuss the heterogeneities underlying this relationship to explore the impact of ESG ratings on sustainable green innovation across various contexts. At the industry level, firms are categorized into heavily polluting and non-heavily polluting enterprises. At the regional level, distinctions are made based on different administrative divisions.

5.1.1. Heterogeneity Analysis on Firm Level

First, we categorized firms into heavily polluting and non-heavily polluting listed companies. The corresponding industry codes cover B06, B07, B08, B09, B10, B11, B12, C17, C18, C19, C22, C25, C26, C27, C28, C29, C31, C32, and D44. This categorization approach aligns with the “Guidelines on Environmental Information Disclosure of Listed Companies,” which has been issued by the Ministry of Environmental Protection of the People’s Republic of China, the 2012 version of CSRC industry classification standard and scholarly interpretations of these provisions [49,50].
Columns (1) and (2) of Table 8 present the regression results for the categorization of heavily polluting companies. The estimated coefficients of the ESG Composite Rating are positively significant for both heavily polluting companies (β = 0.155, t = 5.365) and non-heavily polluting companies (p = 0.101, t = 2.416). It is notable that the ESG Composite Rating has a stronger impact on improving the sustainable green innovation capabilities of heavily polluting companies. This firm-level heterogeneity could be attributed to the increased public scrutiny and stricter governmental regulations that heavily polluting firms encounter in their market activities. Enhanced corporate ESG performance and improved sustainable green innovation outputs can help them establish a more favorable market image, as well as gain greater recognition and market opportunities [23]. Therefore, the findings indicate that the influence of ESG on a firm’s sustainable green innovation varies according to industry endowments.

5.1.2. Heterogeneity Analysis on Regional Level

Considering China’s large territorial area and the imbalance in economic development, this paper categorized the samples into different regions. The division method follows the “Division Method of the Eastern, Western, Central, and Northeastern Regions” by the National Bureau of Statistics of China. Based on the socio-economic development conditions of different regions in China, it divided up a total of four regions.
As illustrated in columns (3)–(6) of Table 8, the regression results based on regional divisions reveal that the ESG Composite Rating has a significantly positive coefficient across the Northeast region (β = 0.146), Western region (β = 0.152), Eastern region (β = 0.133), and Central region (β = 0.111). This demonstrates that the ESG Composite Rating significantly enhances the green innovation of the listed companies across all four regions. However, the data suggest that the levels of significance in the Northeast and Central regions are comparatively lower, with a 5% significance level.
This regional heterogeneity might be attributed to, first, the relative underdevelopment of listed companies in the Northeast and Central regions, which mostly belongs to the primary and secondary industries. Second, the sample size of the specific listed companies in these regions is relatively small, with only 1007 and 3021 companies, respectively, constituting a minor fraction of the total sample. These findings highlight that the influence of ESG implementation on a firm’s sustainable green innovation is subject to regional disparities.

5.2. Moderation Effect Analysis

5.2.1. Informal External Pressure Moderation: Public Environmental Concern (PEC)

This paper attempts to verify the moderating role of PEC. On the one hand, focusing on the moderating effect of informal external pressures can mitigate the adverse impacts of formal environmental pressures [12,13]. Specifically, it can alleviate “attention misallocation” caused by governmental formal pressures and the excessive emphasis on local economic development driven by the “growth-only theory”, which could subsequently deteriorate ESG performance and innovation outcomes [34]. On the other hand, the moderating effect of informal external pressures from stakeholders and the public can assist enterprises in establishing a positive social image [4,23,35]. PEC, manifested through discussions on social media, news media reports, and advocacy by social groups, can encourage firms to modify their behavior, attitudes, or decisions to align with public expectations or societal values. This could also potentially create reputational capital for investors, meaning that corporations with high ESG scores tend towards higher ethical standards and greater managerial self-discipline, which may enhance the role of the moderating effect of external pressures induced by social responsibility participation [51,52]. This paper therefore suggests that PEC will positively moderate the relationship between the ESG Composite Rating and firm sustainable green innovation.
This study investigated the moderating effect of PEC by adding the interaction term (Baidu_Index × ESG_score). Column (1) of Table 9 presents the regression results, showing that although the coefficient for PEC is positive in the relationship between ESG and innovation, it has not yet achieved a significant moderating role. This could be due to several reasons. First, an examination of the sample data shows that the PEC values for most firms are concentrated around 5, indicating a relatively narrow distribution of the moderating variable across the sample. This narrow variation may result in insufficient differentiation across firms or time periods, thereby weakening its moderating effect on the ESG–green innovation relationship. As a result, the high concentration of PEC values could potentially explain the lack of significance in its moderating effect. Second, the relationship between PEC and corporate innovation might be mediated by other factors, such as government policies, market incentives, or technological capabilities [53]. As a result, the direct moderating effect of PEC on the ESG–innovation link might be diluted. Third, as the ESG Composite Rating is a relatively new concept, public awareness may not yet have reached the threshold necessary to significantly impact innovation outputs. According to Lyu et al.’s Threshold Effect research into PEC [54], the significant effect of sustainable green innovation only becomes evident when PEC reaches a certain level. They suggest that the potential of PEC to enhance the relationship between ESG and sustainable green innovation is not fully realized until there is a higher degree of public awareness [54]. Therefore, while PEC may influence corporate ESG practices, its direct moderating effect on innovation may not be substantial currently.

5.2.2. Internal Development Moderation: Corporate Digital Transformation (CDT)

As enterprises increasingly deepen their CDT at the market level, they also adjust their behaviors according to market dynamics, providing corresponding value to investors [4,23]. Based on signaling theory, the drive for corporate green innovation benefits from a deepening level of digitalization, and the extent of CDT can also contribute positively to the corporation in terms of market competition, deepening the impact of ESG performance [20]. Wu et al. [2] also suggest that in intensifying market competition, enterprises with advanced digitalization levels tend to a more advantageous position and can seize the opportunities of CDT to further drive green innovation, thereby gaining a competitive edge. This paper thus suggests that CDT may positively moderate the relationship between the ESG Composite Rating and firm sustainable green innovation.
This paper, referencing the method of Zhao et al., constructed a CDT index (DIGI_score) for listed companies using the text analysis method and created an interaction term (DIGI_score × ESG_score) [40]. As displayed in Column (2) of Table 9, the regression results reveal that the coefficient of the CDT index with the ESG Composite Rating is significantly positive at the 1% level, confirming the positive moderating effect of CDT.
To further examine the moderating effect of CDT on the relationship between ESG disclosure and firms’ sustainable innovation capabilities, this study analyzed the changes in the slope under varying levels of digital transformation intensity. The results, depicted in a slope chart, illustrate the differential predictive effect of ESG disclosure on sustainable innovation across high and low levels of digital transformation. To further clarify the significance of the moderating effect, this study conducted a simple slope test to analyze the predictive effect of ESG_score on innovation at different levels of CDT. Figure 2 shows that when DIGI_score is in the high group (one standard deviation above the mean) (Bsimple = 0.120, p = 0.008), the effect is significantly higher compared to the low group (one standard deviation below the mean) (Bsimple = 0.118, p = 0.007). Therefore, CDT, as a pivotal organizational capability, significantly strengthens the positive impact of ESG disclosure on sustainable innovation outputs. Specifically, in firms exhibiting advanced digital transformation, ESG disclosure is more effectively aligned with digital technology applications, thus facilitating greater investments in green technologies and the development of sustainable innovation strategies.

6. Conclusions and Implications

6.1. Conclusions

Given the growing interest in ESG ratings in recent years and the academic tendency to correlate them with financial performance [18], exploring the relationship between ESG and corporate sustainable green innovation is of great significance [37,44]. This study examines the evolving relationship between ESG ratings and enterprises’ capacity for sustainable green innovation, along with the moderating effects of PEC and CDT. Using panel data from A-share listed companies from 2011 to 2022, we empirically examined the nexus between ESG performance and sustainable green innovation. To verify the reliability of our baseline results and address heterogeneity, we conducted key variable substitutions, endogeneity checks, and examined heterogeneity effects.
The key findings based on the analysis are as follows: (1) The ESG framework significantly fosters green innovation at the corporate level, with robustness of results confirmed through variable substitution methods. Moreover, the study passes endogeneity tests using the instrumental variable method. (2) In terms of heterogeneous effects, the impact of the ESG framework on sustainable green innovation varies across different regions and industrial contexts. To be specific, at the regional level, our analysis found less significance in the Northeast and Central regions due to lower industrial development and smaller sample sizes. At the firm level, heavily polluting corporations pay more attention to ESG ratings and their impact on green innovation due to heightened scrutiny from the government and stakeholders on sustainability and social responsibility, which could potentially affect their long-term benefits, such as brand image and investment opportunities. (3) Regarding moderating effects, the study considered both informal external pressures and internal development needs. In this context, informal external pressures refer specifically to PEC, which encompasses societal awareness and expectations regarding environmental sustainability, while internal development needs refer to CDT, which reflects a company’s strategic focus on integrating digital technologies to improve operational efficiency, innovation capacity, and long-term competitiveness. The findings indicate that the moderating effect of PEC on the relationship between ESG and sustainable green innovation is not significant. This may be attributed to the nascent stage of ESG as a concept in China, which requires greater public awareness, or a potential threshold effect where PEC has not yet reached a critical level of influence [53].

6.2. Implications

Drawing from the empirical findings, this study provides constructive insights and policy implications for both policymakers and businesses. For policymakers, first, it is essential to promote sustainable green innovation by encouraging firms to adopt positive ESG behaviors. Governments can achieve this by employing financial instruments and incentives that support investments in green technologies and sustainable practices, such as green bonds, subsidies, and grants.
Second, a unified ESG rating system is necessary to help corporations and investors develop more consistent strategies for promoting green innovation. This is because different rating agencies vary in their coverage of ESG dimensions, measurement methods, and weighting systems, which may result in discrepancies in rating outcomes [55,56]. For example, Moody’s ESG, S&P Global, and MSCI all use the three main dimensions, but their specific evaluation metrics vary, as do their emphases on different dimensions, leading to divergent ratings for the same company [56,57]. This variation makes it difficult for stakeholders to accurately compare corporate ESG performance, potentially raising doubts about the ratings. To minimize the impact of these differences on the results, we employed the ESG rating methods from both a Chinese agency and an American one. The former focuses on the ESG performance of Chinese domestic companies, while the latter adheres to global standards. Although the coefficients differ, overall, the positive effect of ESG on sustainable green innovation remains significant and robust in our analysis. This demonstrates that our conclusions are relatively reliable and persuasive.
Lastly, the engagement of the public in ESG evaluations and environmental issues is crucial [53]. Given that PEC was not significant in this study, policymakers can indirectly encourage companies to adopt more responsible practices by raising public awareness of the importance of environmental issues and ESG initiatives. This can be achieved through public campaigns, educational programs, and measures that promote corporate transparency. By strengthening the role of public oversight and encouraging consumers and investors to prefer companies with strong ESG commitments, policymakers can create market-driven incentives for businesses to adopt more sustainable practices. This increased public awareness will accelerate the regulatory tipping point, as companies may proactively adjust their practices to meet public expectations before facing stricter regulations [54].
For businesses, it is vital for corporate leaders to integrate ESG frameworks into their strategic development planning and operational practices, recognizing the long-term value that ESG alignment can bring. On the one hand, corporations should recognize the significant role of CDT, leveraging it as a key driver to enhance their ESG performance, utilizing digital tools for better data management, increased transparency, and improved stakeholder interaction. On the other hand, corporations should consider combining ESG and green innovation as a joint strategy, correctly identifying and exploiting the impetus that ESG ratings can provide for sustainable green innovation, adjusting strategies to meet evolving social expectations, encouraging more ESG practices, and reducing potential reputational risks.

6.3. Limitations

First, the study’s findings are based on Chinese A-share listed companies, which may limit their generalizability to other countries or markets with different regulatory, economic, and cultural contexts. Future research could expand the scope by incorporating data from various countries to validate and enhance the applicability of the results. Specifically, new studies could conduct cross-country comparisons to explore whether the relationship remains robust across different regulatory environments, cultural norms, and levels of economic development. For example, investigating how ESG initiatives differ between developed economies and emerging markets could reveal the diverse impacts of ESG on innovation in various regions. Furthermore, future research could focus on how international ESG standards and frameworks, such as the United Nations Sustainable Development Goals (SDGs), shape corporate behavior and promote green innovation globally. By examining these factors, researchers can identify global best practices, uncover the diverse mechanisms driving the ESG–green innovation relationship, and contribute to the development of unified ESG evaluation standards.
Second, this study focused on the moderating roles of PEC and CDT. However, other potential moderators, such as government policies, industry-specific regulations, and market conditions, were not considered. Future research could examine these factors to provide a more holistic understanding of the dynamics between ESG and sustainable green innovation.

Author Contributions

Writing—original draft, M.L.; Supervision, R.R. All authors have read and agreed to the published version of the manuscript.

Funding

This research received no external funding.

Institutional Review Board Statement

Not applicable.

Informed Consent Statement

Not applicable.

Data Availability Statement

The data are available with reasonable request.

Conflicts of Interest

The authors declare no conflicts of interest.

References

  1. Kim, S.; Yoon, A. Analyzing active fund managers’ commitment to ESG: Evidence from the United Nations Principles for Responsible Investment. Manag. Sci. 2023, 69, 741–758. [Google Scholar] [CrossRef]
  2. Wu, L.; Yi, X.; Hu, K.; Lyulyov, O.; Pimonenko, T. The effect of ESG performance on corporate green innovation. Bus. Process Manag. J. 2024. [Google Scholar] [CrossRef]
  3. Tu, Y.; Wu, W. How does green innovation improve enterprises’ competitive advantage? The role of organizational learning. Sustain. Prod. Consum. 2021, 26, 504–516. [Google Scholar] [CrossRef]
  4. Quintana-García, C.; Marchante-Lara, M.; Benavides-Chicón, C.G. Towards sustainable development: Environmental innovation, cleaner production performance, and reputation. Corp. Soc. Responsib. Environ. Manag. 2022, 29, 1330–1340. [Google Scholar] [CrossRef]
  5. Porter, M.E.; Van der Linde, C. Toward a new conception of the environment-competitiveness relationship. J. Econ. Perspect. 1995, 9, 97–118. [Google Scholar] [CrossRef]
  6. Flammer, C. Corporate social responsibility and shareholder reaction: The environmental awareness of investors. Acad. Manag. J. 2013, 56, 758–781. [Google Scholar] [CrossRef]
  7. Krueger, P.; Sautner, Z.; Tang, D.Y.; Zhong, R. The effects of mandatory ESG disclosure around the world. J. Account. Res. 2024. [Google Scholar] [CrossRef]
  8. He, G.; Liu, Y.; Chen, F. Research on the impact of environment, society, and governance (ESG) on firm risk: An explanation from a financing constraints perspective. Financ. Res. Lett. 2023, 58, 104038. [Google Scholar] [CrossRef]
  9. Giakoumelou, A.; Salvi, A.; Bekiros, S.; Onorato, G. ESG and FinTech funding in the EU. Res. Int. Bus. Financ. 2024, 69, 102233. [Google Scholar] [CrossRef]
  10. Xu, F.; Tian, M.; Yang, J.; Xu, G. Does environmental inspection led by the central government improve the air quality in China? The moderating role of public engagement. Sustainability 2020, 12, 3316. [Google Scholar] [CrossRef]
  11. Zhang, M.; Liu, X.; Ding, Y.; Wang, W. How does environmental regulation affect haze pollution governance? An empirical test based on Chinese provincial panel data. Sci. Total Environ. 2019, 695, 133905. [Google Scholar] [CrossRef] [PubMed]
  12. Liu, J.; Diamond, J. China’s environment in a globalizing world. Nature 2005, 435, 1179–1186. [Google Scholar] [CrossRef] [PubMed]
  13. Wang, H.; Fan, C.; Chen, S. The impact of campaign-style enforcement on corporate environmental action: Evidence from China’s central environmental protection inspection. J. Clean. Prod. 2021, 290, 125881. [Google Scholar] [CrossRef]
  14. Robiou du Pont, Y.; Rogelj, J.; Hsu, A.; Van Vuuren, D.; Hoepner, A.G. Corporate emissions targets and the neglect of future innovators. Science 2024, 384, 388–390. [Google Scholar] [CrossRef]
  15. Barney, J. Firm resources and sustained competitive advantage. J. Manag. 1991, 17, 99–120. [Google Scholar] [CrossRef]
  16. Zhang, F.; Qin, X.; Liu, L. The interaction effect between ESG and green innovation and its impact on firm value from the perspective of information disclosure. Sustainability 2020, 12, 1866. [Google Scholar] [CrossRef]
  17. Tidd, J.; Bessant, J.R. Managing Innovation: Integrating Technological, Market and Organizational Change; John Wiley & Sons: Hoboken, NJ, USA, 2020; pp. 18–20. [Google Scholar]
  18. Chin, W.C.; Rasiah, R.; Furuoka, F. The corporate environmental and financial performance nexus: A comparison of corporations in China and Japan. Energy Effic. 2024, 17, 29. [Google Scholar] [CrossRef]
  19. Yin, S.; Yu, Y. An adoption-implementation framework of digital green knowledge to improve the performance of digital green innovation practices for industry 5.0. J. Clean. Prod. 2022, 363, 132608. [Google Scholar] [CrossRef]
  20. Wu, S.; Li, Y. A study on the impact of digital transformation on corporate ESG performance: The mediating role of green innovation. Sustainability 2023, 15, 6568. [Google Scholar] [CrossRef]
  21. Aguilera, R.V.; Rupp, D.E.; Williams, C.A.; Ganapathi, J. Putting the S back in corporate social responsibility: A multilevel theory of social change in organizations. Acad. Manag. Rev. 2007, 32, 836–863. [Google Scholar] [CrossRef]
  22. Zhang, Q.; Loh, L.; Wu, W. How do environmental, social and governance initiatives affect innovative performance for corporate sustainability? Sustainability 2020, 12, 3380. [Google Scholar] [CrossRef]
  23. Freeman, R.E. Strategic Management: A Stakeholder Approach; Cambridge University Press: Cambridge, UK, 2010. [Google Scholar]
  24. Kanno, M. Does ESG performance improve firm creditworthiness? Financ. Res. Lett. 2023, 55, 103894. [Google Scholar] [CrossRef]
  25. Hart, S.L.; Ahuja, G. Does it pay to be green? An empirical examination of the relationship between emission reduction and firm performance. Bus. Strategy Environ. 1996, 5, 30–37. [Google Scholar] [CrossRef]
  26. Zhao, L.; Zhang, L.; Sun, J.; He, P. Can public participation constraints promote green technological innovation of Chinese enterprises? The moderating role of government environmental regulatory enforcement. Technol. Forecast. Soc. Change 2022, 174, 121198. [Google Scholar] [CrossRef]
  27. Gu, Y.; Ho, K.C.; Yan, C.; Gozgor, G. Public environmental concern, CEO turnover, and green investment: Evidence from a quasi-natural experiment in China. Energy Econ. 2021, 100, 105379. [Google Scholar] [CrossRef]
  28. Ren, X.; Ren, Y. Public environmental concern and corporate ESG performance. Financ. Res. Lett. 2024, 61, 104991. [Google Scholar] [CrossRef]
  29. Hess, T.; Matt, C.; Benlian, A.; Wiesböck, F. Options for formulating a digital transformation strategy. MIS Q. Exec. 2016, 15, 123–139. [Google Scholar]
  30. Nambisan, S.; Wright, M.; Feldman, M. The digital transformation of innovation and entrepreneurship: Progress, challenges and key themes. Res. Policy 2019, 48, 103773. [Google Scholar] [CrossRef]
  31. Li, H.; Wu, Y.; Cao, D.; Wang, Y. Organizational mindfulness towards digital transformation as a prerequisite of information processing capability to achieve market agility. J. Bus. Res. 2021, 122, 700–712. [Google Scholar] [CrossRef]
  32. Wang, Z.; Chu, E. Shifting focus from end-of-pipe treatment to source control: ESG ratings’ impact on corporate green innovation. J. Environ. Manag. 2024, 354, 120409. [Google Scholar] [CrossRef]
  33. Li, W.; Hu, H.; Hong, Z. Green finance policy, ESG rating, and cost of debt—Evidence from China. Int. Rev. Financ. Anal. 2024, 92, 103051. [Google Scholar] [CrossRef]
  34. Tang, H. ESG performance, investors’ heterogeneous beliefs, and cost of equity capital in China. Front. Environ. Sci. 2022, 10, 992559. [Google Scholar] [CrossRef]
  35. Tao, Y.; Hou, W.; Liu, Z.; Yang, Z. How can public environmental concerns enhance corporate ESG performance?—Based on a dual perspective of external pressure and internal concerns. Sci. Sci. Manag. S. T. 2023, 1–28. (In Chinese) [Google Scholar]
  36. McBrayer, G.A. Does persistence explain ESG disclosure decisions? Corp. Soc. Responsib. Environ. Manag. 2018, 25, 1074–1086. [Google Scholar] [CrossRef]
  37. He, Y.; Zhou, H.; Ding, J. Research on the impact of technological diversification on the persistence of innovation at firm-level. Stud. Sci. Sci. 2017, 35, 1896–1909. [Google Scholar] [CrossRef]
  38. Fang, X.; Hu, D. Corporate ESG performance and innovation—Evidence from A-share listed companies. Econ. Res. J. 2023, 58, 91–106. [Google Scholar] [CrossRef]
  39. Wang, Y.; Zhao, Z.; Shi, M.; Liu, J.; Tan, Z. Public environmental concern, government environmental regulation and urban carbon emission reduction—Analyzing the regulating role of green finance and industrial agglomeration. Sci. Total Environ. 2024, 924, 171549. [Google Scholar] [CrossRef] [PubMed]
  40. Zhao, C.; Wang, W.; Li, X. How does digital transformation affect corporate total factor productivity? Financ. Trade Econ. 2021, 42, 114–129. [Google Scholar] [CrossRef]
  41. Wu, F.; Hu, H.; Lin, H.; Ren, X. Corporate digital transformation and capital market performance—Evidence from stock liquidity. Manag. World 2021, 37, 130–144. (In Chinese) [Google Scholar] [CrossRef]
  42. Kong, D.; Liu, S.; Wang, Y. Market competition, property rights, and government subsidies. Econ. Res. J. 2013, 2, 13. (In Chinese) [Google Scholar]
  43. Tan, Y.; Zhu, Z. The effect of ESG rating events on corporate green innovation in China: The mediating role of financial constraints and managers’ environmental awareness. Technol. Soc. 2022, 68, 101906. [Google Scholar] [CrossRef]
  44. Yang, Y.; Ruan, X. Digital transformation, green technology innovation, and corporate ESG performance—The moderating role of environmental regulation. J. Harbin Univ. Commer. (Soc. Sci. Ed.) 2023, 5, 34–47. (In Chinese) [Google Scholar]
  45. Zhang, D. Can digital finance empowerment reduce extreme ESG hypocrisy resistance to improve green innovation? Energy Econ. 2023, 125, 106756. [Google Scholar] [CrossRef]
  46. Attig, N.; Boubakri, N.; El Ghoul, S.; Guedhami, O. Firm internationalization and corporate social responsibility. J. Bus. Ethics 2016, 134, 171–197. [Google Scholar] [CrossRef]
  47. Dimson, E.; Karakaş, O.; Li, X. Active ownership. Rev. Financ. Stud. 2015, 28, 3225–3268. [Google Scholar] [CrossRef]
  48. Xie, H.J.; Lyu, X. Responsible multinational investment: ESG and Chinese OFDI. Econ. Res. J. 2022, 57, 83–99. [Google Scholar]
  49. Liu, M.; Luo, X.; Lu, W.-Z. Public perceptions of environmental, social, and governance (ESG) based on social media data: Evidence from China. J. Clean. Prod. 2023, 387, 135840. [Google Scholar] [CrossRef]
  50. Li, Q.; Xiao, Z. Heterogeneous Environmental Regulation Tools and Green Innovation Incentives: Evidence from Green Patents of Listed Companies. Econ. Res. J. 2021, 55, 192–208. Available online: https://kns.cn.jingshi2015.com/kcms2/article/abstract?v=IylmbgxpP4Rkd0jYN38Q1dBMmHoB4Vm56wVnyRqLmkpVC8ArzrQTAtxTn1wP9V6b75U4VFMCFvuLwk5za8LjyBCN01qxeLb7Z7QuUYdJhJumVfPlrIHCBbUGRCPvP3DqChqxHKa7Bl-v6cpxeB2jE5uYqQDJTMjkr3llSBVcU5k=&uniplatform=NZKPT (accessed on 25 October 2024). (In Chinese).
  51. Chouaibi, S.; Rossi, M.; Siggia, D.; Chouaibi, J. Exploring the moderating role of social and ethical practices in the relationship between environmental disclosure and financial performance: Evidence from ESG companies. Sustainability 2021, 14, 209. [Google Scholar] [CrossRef]
  52. Chouaibi, S.; Affes, H. The effect of social and ethical practices on environmental disclosure: Evidence from an international ESG data. Corp. Gov. Int. J. Bus. Soc. 2021, 21, 1293–1317. [Google Scholar] [CrossRef]
  53. Boons, F.; Lüdeke-Freund, F. Business models for sustainable innovation: State-of-the-art and steps towards a research agenda. J. Clean. Prod. 2013, 45, 9–19. [Google Scholar] [CrossRef]
  54. Lyu, D.; Wang, J.; Tang, Q. Has digital economy realized the “Increase of Quantity and Improvement of Quality” of green innovation. J. Shanxi Univ. Financ. Econ. 2023, 45, 55–68. [Google Scholar] [CrossRef]
  55. Hardyment, R. Measuring Good Business: Making Sense of Environmental, Social and Governance (ESG) Data; Taylor & Francis: Abingdon, UK, 2024; pp. 188–238. [Google Scholar]
  56. Berg, F.; Koelbel, J.F.; Rigobon, R. Aggregate confusion: The divergence of ESG ratings. Rev. Financ. 2022, 26, 1315–1344. [Google Scholar] [CrossRef]
  57. Wu, H.; Zhong, Y.; Wu, Y. The Manifestation, Cause and Countermeasures of the Differences in ESG Rating at Home and Abroad. J. Univ. South China (Soc. Sci. Ed.) 2023, 24. [Google Scholar] [CrossRef]
Figure 1. Theoretical research model.
Sustainability 16 09390 g001
Figure 2. Simple slope plot for Moderation Effect.
Sustainability 16 09390 g002
Table 1. Description of variables.
ItemVariableDescription
ESG_scoreESG Composite RatingAll listed companies were rated by ESG rating score
InnovationFirms’ Sustainable Green InnovationThe year-over-year growth rate of (the total number of patent applications between years t − 1 and t) compared to (the total from years t − 2 to t − 1), multiplied by (the combined total of patent applications for years t − 1 and t).
Baidu_IndexPublic Environmental ConcernBaidu Search Index—Daily Average
DIGI_scoreDigital transformationUsing text analysis and expert scoring methods to measure.
tpqFirm sizeTobin’s Q.
ageFirm ageThe logarithm of the total days since the firm was first listed.
holderEquity concentrationThe proportion of shares owned by the 5 largest shareholders.
boardNumber of directorsThe log-transformed count of board directors.
hindexIndustry concentrationMeasurement based on the Herfindahl–Hirschman Index.
gdpGDPThe log value of the provincial GDP.
FirmFirm controlFirm-specific fixed effects are accounted.
YearYear controlTime-specific fixed effects are accounted.
Table 2. Descriptive statistics.
VariableObsMeanStd. Dev.MinMax
Innovation19,6370.0100.1270.00015.931
ESG_score19,6374.1241.1630.0007.750
Baidu_Index19,6372.3532.3160.00012.740
DIGI_score19,6370.1400.3470.0005.890
tpq19,6370.0220.0650.0067.296
age19,63710.3517.7521.00032.000
share19,6375.5271.6130.0009.847
board19,6378.5831.8020.00021.000
Hindex19,6370.2050.1860.0001.000
gdp19,6371.0730.0290.9461.164
Table 3. Summary of correlation analysis.
Variable(1)(2)(3)(4)(5)(6)(7)(8)(9)(10)
Innovation1
ESG_score0.151
***
1
Baidu_Index0.054
***
0.033
***
1
DIGI_score0.149
***
0.076
***
0.246
***
1
tpq−0.077
***
−0.151
***
0.078
***
0.078
***
1
age−0.006−0.064
***
0.063
***
0.059
***
−0.031
***
1
share0.021
***
0.137
***
0.043
***
−0.097
***
−0.121
***
−0.204
***
1
board0.060
***
0.055
***
−0.057
***
−0.105
***
−0.137
***
0.104
***
0.090
***
1
Hindex−0.030
***
−0.059
***
0.023
***
0.032
***
0.013
*
−0.042
***
0.066
***
0.029
***
1
gdp−0.050
***
0.016
**
−0.173
***
−0.229
***
0.032
***
−0.344
***
0.088
***
0.070
***
0.031
***
1
Note: * p < 0.1, ** p < 0.05, *** p < 0.01.
Table 4. Regression results of ESG Composite Rating (ESG_score) on Sustainable Green Innovation (Innovation).
Variable(1)(2)(3)
InnovationInnovationInnovation
ESG_score0.588 ***0.545 ***0.131 ***
(9.979)(9.229)(4.872)
tpq −0.041 ***0.005
(−4.351)(0.672)
age −0.0500.040
(−1.383)(0.783)
share −2.986−5.175
(−0.297)(−1.260)
board 0.362 **0.077
(2.167)(1.145)
Hindex −0.143−0.090
(−1.217)(−1.167)
gdp −2.957 ***1.280
(−5.036)(1.593)
cons−0.200 **13.213 ***−6.588 *
(−2.524)(4.219)(−1.697)
N19,63719,63719,637
adj. R-sq0.0230.0310.667
Firm FENoNoYes
Year FENoNoYes
Note: * p < 0.1, ** p < 0.05, *** p < 0.01; t statistics in parentheses.
Table 5. Regression results of the fixed-effects models with the alternative independent variable (ESG_r).
Variable(1)(2)(3)
InnovationInnovationInnovation
ESG_r0.083 ***0.088 ***0.088 ***
(5.920)(5.373)(7.059)
tpq −0.060 ***−0.071 ***
(−6.257)(−7.354)
age −0.113 ***0.016
(−3.004)(0.412)
share −4.6397.116
(−0.449)(0.908)
board 0.324 *0.445 ***
(1.852)(3.674)
Hindex −0.222 *−0.049
(−1.830)(−0.633)
gdp −3.096 ***1.744
(−5.475)(1.326)
cons0.494 ***14.848 ***−9.983
(12.431)(4.919)(−1.597)
N19,63719,63719,637
adj. R-sq0.0140.0260.200
Firm FENoNoYes
Year FENoNoYes
Note: * p < 0.1, *** p < 0.01; t statistics in parentheses.
Table 6. Regression results of the fixed-effects models for the alternative dependent variable (patent).
Variable(1)(2)(3)
PatentPatentPatent
ESG_score0.437 ***0.404 ***0.447 ***
(9.531)(8.829)(9.208)
tpq −0.032 ***−0.041 ***
(−4.820)(−5.616)
age −0.0290.065 **
(−1.043)(2.159)
share 0.0586.244
(0.008)(1.154)
board 0.266 **0.332 ***
(2.143)(3.662)
Hindex −0.071−0.024
(−0.751)(−0.384)
gdp −1.873 ***1.168
(−4.756)(1.240)
_cons−0.163 ***8.183 ***−7.369
(−2.665)(3.894)(−1.647)
N19,63719,63719,637
adj. R-sq0.0230.0310.210
Firm FENoNoYes
Year FENoNoYes
Note: ** p < 0.05, *** p < 0.01; t statistics in parentheses.
Table 7. Results of the 2SLS regression by instrumental variable.
Variable(1)(2)
ESG_ScoreInnovation
FundN0.001 ***
(5.872)
FundV0.002 ***
(4.889)
ESG_score 0.986 **
(2.243)
tpq−0.012 ***0.014
(−4.251)(1.422)
age−0.080 ***0.120
(−8.019)(1.536)
share8.498 ***−12.070
(5.441)(−1.547)
board−0.0070.029
(−0.293)(0.366)
Hindex−0.051 ***−0.027
(−2.748)(−0.386)
gdp0.1310.743
(0.663)(0.982)
Firm FEYesYes
Year FEYesYes
N19,63719,637
Kleibergen–Paap rk LM statistic70.933 ***
Kleibergen–Paap Wald rk F statistic46.656 ***
Hansen J statisticChi-sq (1) p-val = 0.9862
Endogeneity testChi-sq (1) p-val = 0.0086
F46.656
Note: ** p < 0.05, *** p < 0.01; t statistics in parentheses; The Hansen J statistic has a p-value of 0.9862, which is greater than 0.1, indicating that the null hypothesis of the exclusion restriction can be accepted.
Table 8. Heterogeneity tests.
Based on IndustryBased on Region
Non-PollutionKey PollutionNortheastEasternCentralWestern
(1)(2)(3)(4)(5)(6)
InnovationInnovationInnovationInnovationInnovationInnovation
ESG_score0.101 **0.155 ***0.146 **0.111 ***0.133 **0.152 ***
(2.416)(5.365)(2.128)(3.555)(2.323)(2.870)
tpq0.029 ***−0.0020.0150.0020.0190.001
(3.146)(−0.260)(0.621)(0.301)(1.562)(0.093)
age−0.167 ***0.105 ***−0.405 ***0.0220.0450.234 ***
(−2.825)(2.989)(−3.764)(0.595)(0.649)(2.890)
share0.875−6.2778.135−8.483 **−0.7240.403
(0.134)(−1.592)(0.562)(−2.021)(−0.093)(0.050)
board0.0390.0380.315 *0.0400.189−0.008
(0.398)(0.633)(1.668)(0.600)(1.636)(−0.054)
Hindex0.048−0.106 **−0.371−0.103 *0.0080.010
(0.323)(−2.031)(−1.437)(−1.804)(0.048)(0.106)
gdp−1.5262.338 ***−3.085 *2.555 ***0.824−0.198
(−1.547)(3.524)(−1.705)(2.787)(0.682)(−0.136)
_cons7.767 *−10.565 ***14.672 *−11.247 ***−3.9590.626
(1.677)(−3.393)(1.736)(−2.615)(−0.697)(0.093)
N538413,939100712,95530212737
adj. R-sq0.6130.6880.5840.6720.6800.651
Firm FEYesYesYesYesYesYes
Year FEYesYesYesYesYesYes
Note: * p < 0.1, ** p < 0.05, *** p < 0.01; t statistics in parentheses.
Table 9. Results of the moderating effects.
Variable(1)(2)
InnovationInnovation
ESG_score0.132 ***0.119 ***
(5.594)(5.102)
Baidu_Index−0.005
(−0.194)
Baidu_Index × ESG_score0.032
(1.529)
DIGI_score 0.039 ***
(5.194)
DIGI_score × ESG_score 0.057 ***
(3.543)
tpq0.0050.005
(0. 937)(0. 966)
age0.0360.028
(1.244)(0.982)
share−4.956−5.697 *
(−1.522)(−1.224)
board0.0730.056
(1.422)(1.081)
Hindex−0.091 *−0.091 *
(−1.945)(−1.941)
gdp1.224 **1.179 **
(2.266)(2.182)
_cons−5.165 **−4.869 *
(−2.037)(−1.920)
N19,63719,637
adj. R-sq0.6670.668
Firm FEYesYes
Year FEYesYes
Note: * p < 0.1, ** p < 0.05, *** p < 0.01; t statistics in parentheses.
Disclaimer/Publisher’s Note: The statements, opinions and data contained in all publications are solely those of the individual author(s) and contributor(s) and not of MDPI and/or the editor(s). MDPI and/or the editor(s) disclaim responsibility for any injury to people or property resulting from any ideas, methods, instructions or products referred to in the content.

