Article

The Spatial Impact of Innovative Human Capital on Green Total Factor Productivity in Chinese Regions Based on Quantity and Quality Dimensions

Business School, Guilin University of Technology, Guilin 541004, China
Sustainability 2024, 16(21), 9358; https://doi.org/10.3390/su16219358
Submission received: 17 August 2024 / Revised: 23 October 2024 / Accepted: 25 October 2024 / Published: 28 October 2024

Abstract

:
Green total factor productivity (GTFP) is a key driver of China’s green development, and innovative human capital (IHC) plays a pivotal role in enhancing GTFP. This study examines the impact of the quantity and quality dimensions of IHC on regional GTFP in China. Using panel data from 30 Chinese provinces from 2004 to 2018, this study constructs a spatial Durbin model (SDM) to empirically analyze the role of IHC in regional GTFP. Three main conclusions are obtained: (1) both the quantity and quality of IHC can significantly and directly improve regional GTFP, yet regional heterogeneity exists. In the eastern region, both IHCA and IHCQ have a significant impact, while in the middle-western region, only IHCA has a significant effect on GTFP; (2) IHC can boost the enhancement of regional GTFP through technological progress; and (3) the quantity of IHC (IHCA) produces a spatial spillover effect on regional GTFP, whereas the quality of IHC (IHCQ) does not exhibit this effect. Based on these conclusions, strategies for the green development of China and the coordinated development of the eastern and middle-western regions are proposed. The Chinese government should integrate IHC development into its environmental policies to improve environmental awareness and optimize the efficiency of human capital, taking regional differences into account.

1. Introduction

At present, China’s development mode has already changed from high-speed development to high-quality growth. Green development is necessary for China’s high-quality development. Green development is both an opportunity and a challenge for China. The opportunity is that green development provides a clear direction for China’s high-quality development, and the challenge is how to achieve high-quality development under the harsh constraints of environmental protection.
Improving GTFP is the key to China’s effective response to the challenges. Green total factor productivity (GTFP) has emerged as the key index for evaluating sustainable economic development. It measures the efficiency with which an economy uses various inputs to produce environmentally friendly outputs. The concept of GTFP integrates environmental factors into the measurement of traditional total factor productivity (TFP), emphasizing the importance of resource conservation and ecological balance in economic development. So, environmental regulations and their influence on GTFP have become issues of particular concern to some scholars recently. Luo et al. (2022) discussed how stringent environmental policies can lead to compliance costs initially but eventually stimulate green innovations that enhance GTFP [1]. Liu et al. (2022) also argued that properly stringent environmental regulations significantly enhance the capacity of innovation to drive China’s green growth [2].
Analyzing GTFP from the spatial perspective has become another research hotspot, as many scholars explore the influence of different factors on the growth of GTFP. Wang et al. (2021) employed the spatial Durbin model to examine the spatial effect of green technology innovation on GTFP in China from the regional perspective. The research results indicate that GTFP generally has shown an overall upward trend, highest in the eastern region and the lowest in the western region, and the Moran index shows a dynamic trend of “rise → decline → rise” and is significantly positive [3]. Zhou and Zhang (2023) further conducted a targeted measurement and spatiotemporal analysis of the GTFP of Chinese cities. The results exhibit that the GTFP of Chinese cities has generally shown an upward trend, but the rate of increase has been gradually slowing down, and there are obvious spatial differences. The eastern region is notably higher than the central and western regions. Technological progress is the main factor driving its growth [4].
The core of GTFP is green technological innovation, which is fundamentally a subset of technological progress stemming from deliberate research and development (R&D) activities [5]. Jiakui et al. (2023) stress the significance of technological innovation in promoting improvements in GTFP. They argue that green technological progress is essential for enhancing productivity without sacrificing environmental sustainability. Green technological innovation essentially belongs to the category of technological progress, and technological progress comes from conscious R&D activities [6]. R&D activities are the main innovative behavior in human society, and the main force of this activity is a large number of R&D personnel, who are innovative talents with a large amount of innovative human capital (IHC). IHC is specifically manifested as a willingness to change and support and promote innovation, as well as the ability to use innovative and effective methods to solve problems and promote development [7]. At present, China’s development mode has already transformed from “factor-driven” to “innovation-driven”, and high-quality development cannot be achieved without the support of innovative talents. IHC, as a scarce resource, plays a crucial role in China’s high-quality development stage [8].
Nowadays, the main contradiction in China is the ever-increasing demand of the people for a better life and the imbalanced and insufficient development. To promote high-quality development, efforts must be made to improve GTFP. In this context, whether IHC can effectively improve the GTFP of different regions in China is a question worth studying. Meanwhile, an in-depth study of the internal relationship between IHC and regional GTFP can provide theoretical advice for the high-quality development of China’s economy and the timely achievement of the “dual carbon goals”.
In previous research, most scholars have focused on the impact of human capital on TFP growth [9,10]. As human society pays more attention to green development, some scholars have probed into the effect of human capital in improving GTFP [9,11,12]. With the further deepening of the understanding of human capital heterogeneity, some scholars have discussed the influence of environmental regulations on GTFP from the perspective of IHC [13]. The study of the spatial impact of innovative human capital on GTFP based on quantity and quality dimensions is a novel approach that addresses several limitations of previous research. Firstly, previous studies have often focused on either the quantity or quality of human capital, but not both. By considering both the quantity and quality of IHC, this study provides a more comprehensive understanding of the role of human capital in improving GTFP. Secondly, the above-mentioned research did not analyze the direct effect of IHC on improving regional GTFP in China, nor did it explore the indirect impact on GTFP through technological progress. In this paper, however, we delve into both these aspects. We examine the direct influence of IHC on regional GTFP and also explore how IHC indirectly affects GTFP through its role in promoting technological progress. Thirdly, this study takes a spatial econometric approach, which allows us to analyze the spatial spillover effects of IHC on GTFP. This is important as economic activities are often spatially interdependent, and the impact of IHC on GTFP may not be limited to a specific region. Keeping this in view, this study can fill the limitations of the previous studies and enrich the existing literature. Additionally, this paper employs spatial econometric models to analyze GTFP due to their ability to accurately capture the spatial interdependencies and spillover effects that commonly exist in the dynamics of regional productivity [14]. The rationale for selecting this particular method is that GTFP is influenced not only by local factors but also by significant spatial interdependencies and spillover effects. These spatial dynamics are often neglected by traditional econometric models, which may result in inaccurate estimations and an incomplete understanding of the underlying relationships. The preference for spatial econometric models over alternatives, such as ordinary least squares (OLS) regression, is due to OLS’s assumption of observation independence, which overlooks spatial correlations. This limitation makes OLS less suitable for analyzing GTFP, where spatial effects are prominent. Time series analysis, another commonly used method, primarily focuses on the temporal dimension and may fail to adequately capture spatial patterns and interactions. In contrast, spatial econometric models can consider both spatial and non-spatial factors simultaneously, providing a more comprehensive and accurate analysis of the determinants and dynamics of GTFP. This is crucial for formulating effective regional development policies and for understanding the overall performance of the economy within a spatial context.
The remaining parts of this article are arranged as follows: The second section contains a literature review. The third section presents a theoretical discussion and proposed research hypotheses. The fourth section constructs an evaluation index system and spatial econometric model for regional GTFP. The fifth section is related to an empirical exploration of the effect of IHC on regional GTFP, and a heterogeneity analysis of the influence of IHC on GTFP between the eastern and the middle-western areas. The final section presents the conclusion and suggestions.

2. Literature Review

2.1. TFP and GTFP

TFP, also known as Solow residual, was put forward by the famous American economist Robert Solow in 1957. TFP is a significant engine of economic growth [11]. While exploring the relationship between TFP and economic growth in different countries and regions, previous studies revealed that TFP is an important force that promotes economic growth [9,12]. Although the improvement of TFP can achieve economic growth, it also brings serious environmental pollution [13]. The essential reason is that TFP only considers the expected output but not the non-expected output, namely, the damage to the natural environment caused by the discharge of pollutants in production activities [14]. In 1983, Pittman first used data envelopment analysis (DEA) to measure the unexpected outputs of production activities, which can be regarded as the bud of the study of GTFP [15]. At present, more scholars have gradually increased their attention to the connection between GTFP and economic growth and other aspects. GTFP not only considers the constraints of traditional TFP in terms of input but also comprehensively considers the restrictions of resources and environment that can effectively reflect the sustainability of the economic development of a country or region [16]. Some scholars argue that GTFP is currently an important indicator to maintain a balance between energy consumption, economic development, and environmental protection [11].
Under the background of China’s development, as the country transitions from high-speed growth to high-quality growth, green development has become essential. GTFP has emerged as a key indicator for assessing sustainable economic progress. It measures how efficiently an economy harnesses various inputs to produce environmentally friendly outputs. Moreover, GTFP is a more reliable indicator than TFP for evaluating the level of green development [14]. However, most existing studies on China primarily focus on the issue of achieving a balance between economic growth and environmental sustainability based on GTFP, yet to some extent neglect the influence exerted by the spatial spillover effect of GTFP among different regions. The study aims to expand current knowledge by exploring the spatial dynamics of GTFP within the context of China’s regional green development.

2.2. The Influence of Human Capital on GTFP

Some scholars think that technological advancement is the major way to improve GTFP [17]. The endogenous growth theory holds that human capital is the key factor of technological progress. Some scholars have conducted in-depth studies on the connections between human capital and GTFP mainly focusing on the perspective of education. For instance, Liu et al. (2023) found that high levels of human capital achieved through education promoted the growth of GTFP in OECD countries [18]. Some scholars used the sum of average years of schooling to represent human capital in their empirical studies and found that human capital is a crucial factor to promote GTFP [19]. Hang and You (2021) also found that total human capital measured by average years of schooling has a positive effect on the improvement of GTFP [9].
However, some scholars point out that although education level is the most popular way to measure human capital, it is not comprehensive enough and does not include other forms of human capital accumulation [20]. From the perspective of human capital composition, some scholars separate human capital into two kinds, namely, academic education and non-academic education. [19]. Can Cheng et al. (2022) introduced a more comprehensive human capital structure when measuring China’s GTFP, consisting of education, health, R&D, and training [11]. Yao et al. (2023) used years of education, the full-time equivalent of R&D work, and job income to comprehensively estimate IHC, and found that IHC is the main driving force for promoting GTFP [21].
The above studies have primarily focused on the quantity of IHC (IHCA) in relation to GTFP. Notably, these studies did not pay enough attention to the quality of IHC (IHCQ) and its influence on GTFP. Previous studies have usually neglected the comprehensive analysis of both the quantity and quality of IHC and its direct and indirect effects on regional GTFP. Moreover, the mechanisms and spatial effects of IHC on GTFP warrant further investigation. This study seeks to fill this gap by exploring the direct impact of IHC on regional GTFP and examining how IHC indirectly affects GTFP through its role in promoting technological progress. In addition, by employing spatial econometric models, this study analyzes the spatial spillover effects of IHC on GTFP, which is essential for understanding the overall performance of the economy within a spatial framework and developing effective regional development policies.

2.3. The Measuring Methods of Innovative Human Capital

IHC is part of human capital and the most crucial part. When measuring IHC, scholars usually follow the measurement methods of human capital.
Currently, the measurement methods of human capital can be generally separated into three categories. First, the education stock method. Schultz, the founder of the human capital theory, pointed out that education is an important path for human capital investment. The education stock method measures human capital by the number of years of education. Second, the cost method, that is, using expenditures on human capital investment as the basis for measuring human capital. Third, the income method, which means using the present value of a person’s income across their expected lifespan to measure his or her human capital level.
At present, most scholars researching issues related to IHC also adopt these three methods. However, some scholars only use one method (such as the education stock method) to measure IHC [8,15], while some scholars use two or more methods for comprehensive measurement in order to more accurately reflect the value of IHC. For example, Jin et al. (2023) used both the education stock method and the cost method when exploring the impact of environmental regulations on GTFP from the perspective of IHC, representing IHC as the product of regional education level and R&D expenditure [13]; Zhang et al. (2024) adopted the education stock method and the income method when studying the impact of the agglomeration of IHC on the urban green development efficiency of China, using the multiplier of the number of higher education graduates and the average year-end monetary wage to evaluate IHC at the education level [16]; Yao et al. (2023) used all of the above three methods when analyzing the impact of the expansion of postgraduate enrollment in China and IHC on GTFP. They added the data of the three indicators of the number of years of education of the labor force, R&D expenditure, and lifetime income after standardization and de-quantification, and then took the logarithm to measure innovative human capital [11].
However, the above three methods are mainly used to calculate the stock of human capital and are unlikely to reflect the quality of human capital. Based on this, some scholars use indicators such as the number of patents and the number of scientific papers to reflect the innovation ability of IHC [17,18].
This paper will calculate not only the quantity of IHC but also its quality. In terms of calculating the quantity of IHC, like most scholars, this paper adopts the education stock method, that is, the number of years of education. This paper defines IHC as the human capital possessed by employees with higher education, so the number of years of education here refers to the number of years of higher education. When calculating the quality of IHC, this paper adopts indicators such as the number of patents and the number of scientific papers, as used by the scholars mentioned above, because these two indicators can better reflect the quality of IHC.

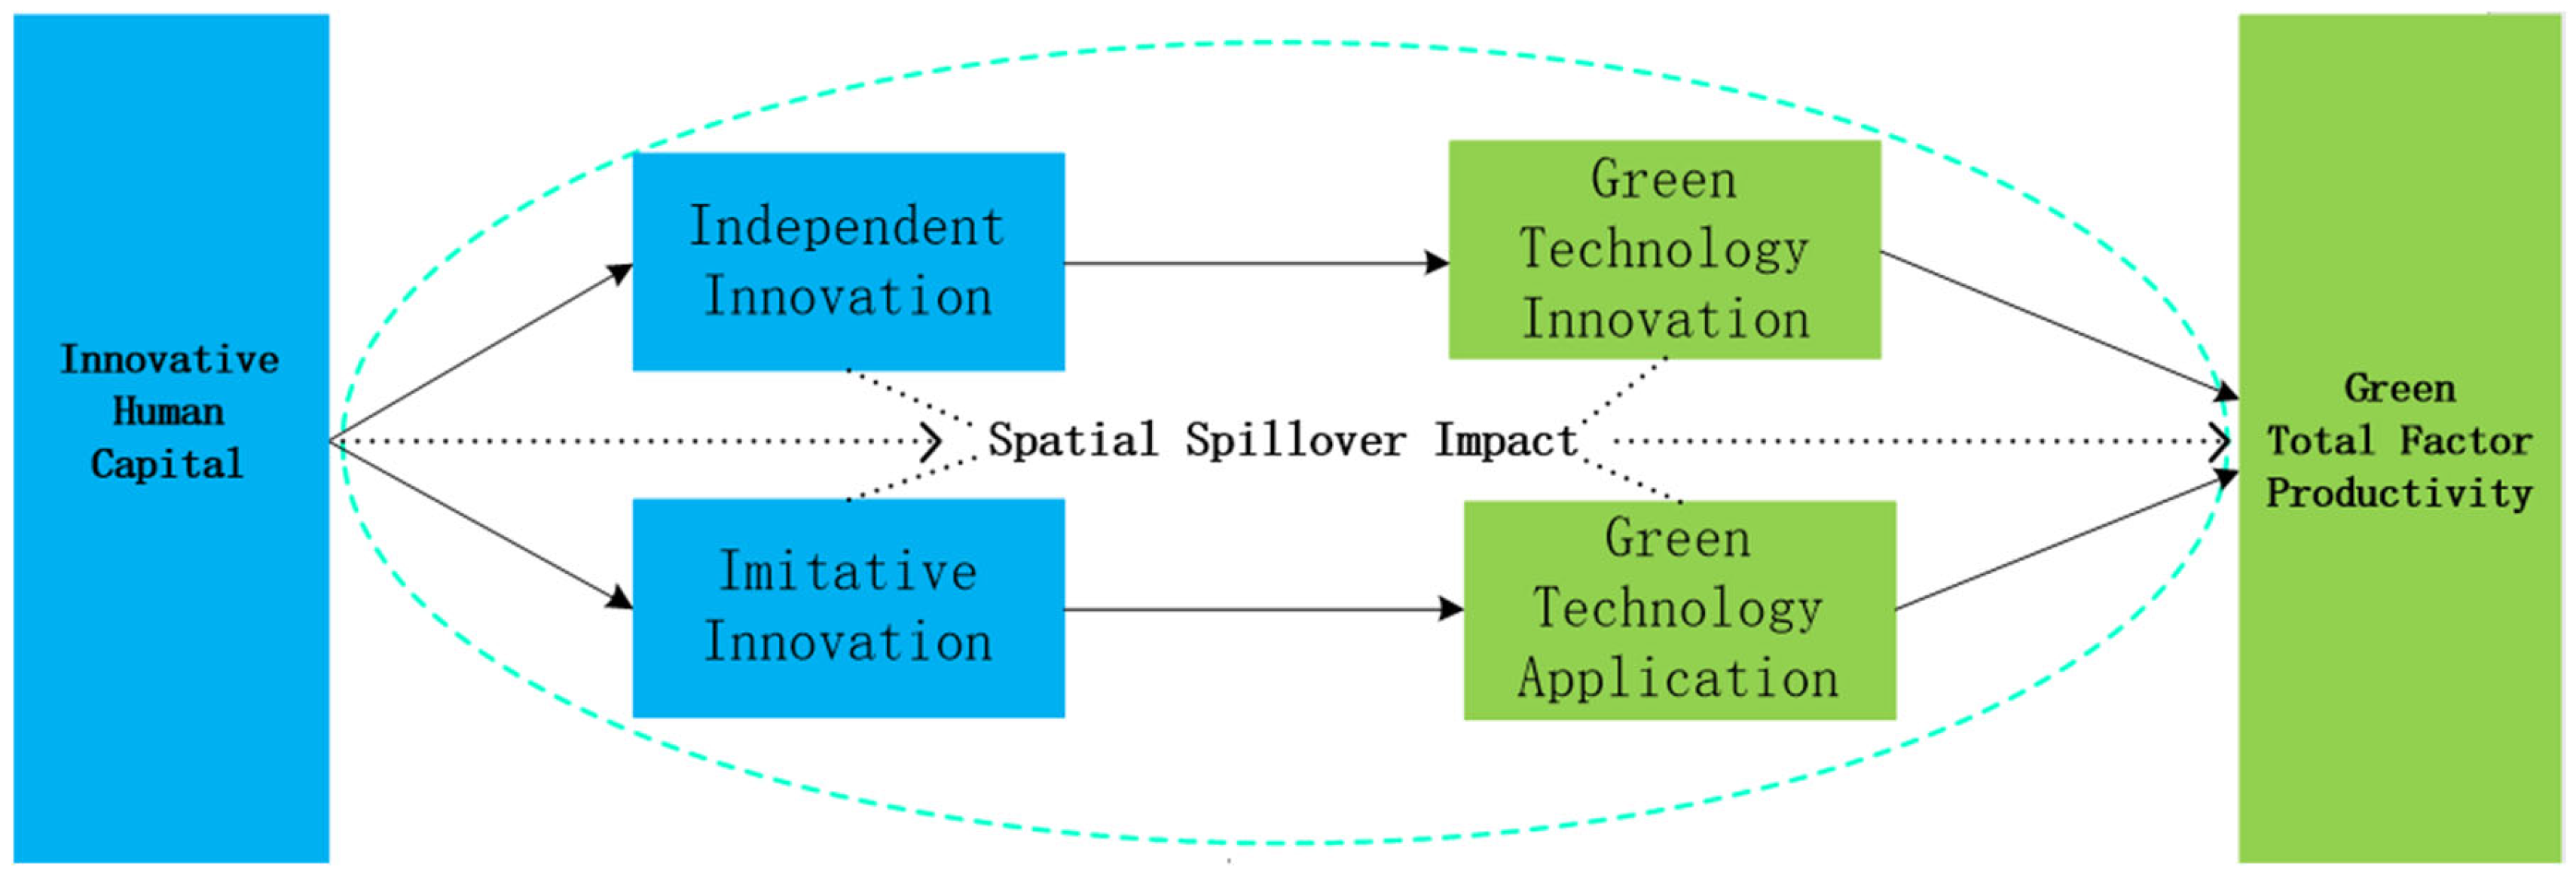
3. Theoretical Mechanisms and Research Hypotheses

In recent years, researchers have focused on the environmental effects of various macroeconomic indicators such as political stability [22], financial inclusion [23], and technological innovation [24]. Human capital can have a positive impact on the environment. High levels of human capital are associated with increased environmental awareness and the demand for a better quality of life, which can lead to reduced ecological impacts such as carbon emissions and ecological footprints [25]. The environmental impact of innovation human capital is a relatively new research topic. In this context, this study analyzes the direct and indirect effects of IHC on green development and presents these two topics in the following literature section.

3.1. Analysis of the Direct Mechanism of IHC’s Effects on GTFP

First, IHC can promote the absorption of external technology and advanced management experience. Huang et al. (2021) emphasize the importance of human capital in assimilating imported technology and management experience, particularly in the context of emerging economies like China [19]. For a long time, China has taken foreign direct investment as the main means of introducing advanced technology and equipment and using experience and skills to promote the efficiency of regional GTFP [26]. Among these, IHC is an important condition for absorbing and digesting imported technology and management experience.
Second, innovative human resources can replace traditional production factors to a small extent. The strong knowledge reserve of IHC can promote the efficient use of resources and replace traditional input factors such as natural resources, physical capital, and general labor to a certain extent, making social and economic production activities less dependent on them, thereby realizing the growth in energy saving, emissions reduction, and GTFP.
Based on the above analysis, the article puts forward the following two hypotheses:
H1a. 
The quantity of IHC can significantly improve GTFP.
H1b. 
The quality of IHC can significantly improve GTFP.

3.2. Analyzing the Indirect Mechanism of IHC Influencing GTFP

First, IHC can promote the transformation of consumer awareness to green environmental protection. Educated consumers, who possess higher IHC, exhibit stronger abilities to obtain and analyze information, leading to the adoption of greener consumption habits and reduced environmental impact [20]. As a result, consumption habits that have a passive effect on the natural environment will be gradually eliminated, and greener consumption methods will be further supported. Based on this, IHC can guide the transformation of consumption patterns scientifically, while further acting on producers from the supply structure, promoting the transformation of production activities towards greener and energy-saving methods, enhancing the application and R&D of environmental protection technologies, and promoting a series of changes and upgrades among manufacturers.
Second, green technological innovation is the pivotal factor influencing the improvement of GTFP. Green technological innovation can not only directly enter production as an input factor, affecting GTFP, but also have an impact on other economic activities, thereby enhancing GTFP. Consequently, a heightened level of IHC enhances a region’s efficacy in sustainable practices such as green production and environmental conservation, thereby bolstering its crucial role in the context of GTFP [27].
This article thus proposes two further hypotheses:
H2a. 
The quantity of IHC indirectly improves GTFP through technical progress.
H2b. 
The quality of IHC indirectly enhances GTFP through technical progress.

3.3. Spatial Spillover Mechanism of IHC Affecting GTFP

Knowledge and skills are important cornerstones of human capital. Low-level human capital acts as a hindrance to the development of local innovation, whereas intermediate and high-level human capital promote it [21]. IHC is high-level human capital which contains higher level or higher quality knowledge and technology. The non-competitive and partially non-exclusive nature of knowledge and technology is prone to spatial spillover or diffusion, which has an impact on GTFP.
In general, areas with higher economic development levels will invest more funds in green technology development, environmental governance, and other aspects, and are more able to attract IHC from other areas, thus creating a “siphon effect”. For areas with lower GTFP levels and relatively backward economic development, the supporting conditions for the development of green technological innovation are weak, and the competitive effect and demonstrating effect of green development in developed areas are firm. IHC exchange is a crucial means of cross-regional innovation coordination that boosts spatial spillovers of advanced knowledge and technology and serves as a key channel for backward regions to upgrade their green technology level.
Therefore, the last two hypotheses are put forward in this article:
H3a. 
The quantity of IHC causes an obvious spatial impact on regional GTFP.
H3b. 
The quality of IHC causes an obvious spatial impact on regional GTFP.
The theoretical mechanism of IHC affecting GTFP is also presented in Figure 1. As shown in Figure 1, IHC affects GTFP through direct, indirect, and spatial spillover mechanisms. The direct mechanisms include the promotion of IHC on technology absorption and resource optimization; the indirect mechanisms involve the driving force of IHC on the transformation of consumer awareness and green technology innovation; and the spatial spillover mechanism emphasizes the importance of IHC in the spatial diffusion of knowledge and technology among regions. These mechanisms interact with each other and jointly affect the green development of regions and the improvement of GTFP.

4. Model Construction and Variables Description

4.1. Building a Calculation Model for GTFP

Currently, the main methods for calculating GTFP include the C-D production function method, the Solow residual approach, data envelopment analysis (DEA), and stochastic frontier analysis (SFA). There are significant differences in the advantages and disadvantages of the various methods. When thinking about the calculation of GTFP in the case of multiple inputs and multiple outputs, DEA contains great advantages.
The traditional radial angle DEA model does not consider the influence of the amount of slack on the efficiency measure, nor does it consider random error and the interference of the external environment on the subjects. However, the SBM model without radial directions and angles can differentiate the efficiency of effective decision-making units, and deal with the non-zero slack problem that may exist in the input and output as well. Taking into account the above two aspects, this article chooses the index of SBM-GML to estimate GTFP in different regions of China. The detailed estimation steps are stated below:
Firstly, the set of production possibilities is calculated. The research in this paper is carried out from the provincial level, so the provinces are taken as a decision-making segment and set as   D M U K , where K is the amount of national inter-provincial units. x = x 1 ,   ,   x n represents N kinds of production factors input by each DMU, where x R N + , M kinds of expected output y = y 1 ,   ,   y m R N + , and I kinds of undesired outputs b = b 1 ,   ,   b m R N + . We use x k t ,   y k t ,   b k t to mean the input and output of phase t. If the set of production possibilities of the t period is P t x , then
  P t x = y t ,   b t : k = 1 K z k t y k m t y k m t ,   m ;   k = 1 K z k t y k m t = b k i t ,   i ;   k = 1 K z k t x k n t x k n t ,   n ;   k = 1 K z k t = 1 ,   z k t 0 ,     k
In Formula (1), z k t is the weight of section data and z k t 0 , which means constant returns to scale; k = i K z k t = 1 ,     z k t 0 , also means constant returns to scale. However, at this point, P t x may experience a false fact of technological regression, so   P t x can be constructed according to   P G x . The specific model is
  P G x = y t ,   b t : t = 1 T k = 1 K z k t y k m t y k m t ,   m ;   t = 1 T k = i K z k t y k m t = b k i t ,   i ;   t = 1 T k = i K z k t x k n t x k n t ,   n ;   t = 1 T k = i K z k t = 1 ,   z k t 0 ,     k  
Secondly, the SBM direction distance function needs to be solved. The function including unexpected outputs is defined below:
S V t x t ,   k ,   y t ,   k ,   b t ,   k ,   g x ,   g y ,   g b = m a x 1 N n = 1 N S n x g n x + 1 M + I m = 1 M S m y g m y + i = 1 I S i b g i b 2 s . t . k = 1 K z k t x k n t + S n x x k n t ,   n ; k = 1 K z k t y k m t S m y = y k m t , m ; k = 1 K z k t b k i t + S n b b k i t ,   i ; k = i K z k t = 1 ,   z k t 0 ,   k S m y 0 ,   m ; S i b 0 , i
In Formula (3) ,   g x indicates the directional vector of input reduction, g y means the directional vector of expected output increase, and g b means the directional vector of unexpected output reduction; S n x , S m y , and S i b represent redundant input slack variables, inadequate expected output slack variables, and excessive unexpected output slack variables, respectively. S V t means that the actual input and unexpected output are more than the border input and output, whereas the expected output is less than the border output. Similarly, the global directional distance function of SBM can be written as:
  S V G x t ,   k ,   y t ,   k ,   b t ,   k ,   g x ,   g y ,   g b = m a x 1 N n = 1 N S n x g n x + 1 M + I m = 1 M S m y g m y + i = 1 I S i b g i b 2 s . t . k = 1 K z k t x k n t + S n x = x k n t ,   n ; k = 1 K z k t y k m t S m y = y k m t , m ; k = 1 K z k t b k i t + S n b = b k i t ,   i ;   k = i K z k t = 1 ,   z k t 0 ,   k S m y 0 ,   m ; S i b 0 ,   i
Finally, the GML index is constructed. GTFP is calculated by constructing the index according to SBM:
  G T F P t t + 1 = 1 + S V G x t ,   y t ,   b t ,   g x ,   g y ,   g b S V G x t + 1 ,   y t + 1 ,   b t + 1 ,   g x ,   g y ,   g b
The calculation result of GTFP takes 1 as the threshold. If it is bigger than 1, it represents an improvement in the efficiency of regional green growth. If it is less than 1, it represents a decrease in the efficiency of regional green growth. If it is equivalent to 1, it represents that the efficiency of regional green growth is in a stable state.

4.2. GTFP Measurement and Evaluation System

GTFP not only needs to consider the input–output efficiency and the first-rank distribution of factor resources in the process of social and economic development but also needs to focus on the environmental pollution of the ecosystem. Based on the practices of scholars such as Feng and Zhang (2017), Zhang et al. (2022), and Zhong and Fang (2024) [22,23,24], this paper selects some commonly used, highly representative, and easily data-accessible input–output-related indicators to construct an evaluation system for GTFP, as shown in Table 1. In terms of the selection of input indicators, this article chooses labor, capital, and energy input as measurement indicators. The output includes two types: one is the expected output, which takes GDP as the specific evaluation index; the other is the non-expected output, which involves specific evaluation indicators.
In the above indicator system, capital input takes fixed capital stock as the specific indicator and economic output takes real GDP as the specific measurement indicator. The data of these two indicators are found in the China Statistical Yearbook and the statistical yearbooks of provincial regions. For the fixed capital stock indicator, this article uses the perpetual inventory method for calculations, with a depreciation rate of 9.6% and a base period of 2000 years. For the real GDP index, this paper deflates it using the year 2000 as the base period. The input of energy is computed through the consumption of energy used by each provincial region, and the index data are collected from the China Energy Statistical Yearbook and the national development and statistical bulletins of each provincial region. The specific indicators of environmental output are COD discharge in industrial wastewater and SO2 discharge, and the indicator data are collected from the China Environmental Statistical Yearbook. Table 2 shows the descriptive statistics of each variable.

4.3. Empirical Model Construction and Variable Data

4.3.1. Spatial Durbin Model

The study mainly delves into the spatial influence of IHC on regional GTFP. It is necessary to scrutinize the spatial correlations of IHC and GTFP. There are several different methods to examine the spatial correlation between variables like Moran’s I Index, the Geary Index, and the Getis–Ord Index. Among them, Moran’s I Index is more commonly used by scholars around the world. Therefore, this paper also adopts Moran’s I Index to test the spatial correlations of IHC and GTFP. The test of spatial correlation is related to the spatial weight. Spatial weights usually include adjacency weight, distance weight, economic weight, and comprehensive weight. Considering that adjacency and distance are two prominent features causing spatial effects between different regions, this paper uses adjacency weight and distance weight to conduct the test of spatial correlation. Under the two types of weights, this paper respectively tests the spatial correlations of GTFP and IHC, and calculates their global and local Moran’s I index values. The measurement results show that under both weights, there are significant spatial correlations between GTFP and IHC. Currently, spatial econometric models primarily include spatial lag models (SLM), spatial error models (SEM), and the spatial Durbin model (SDM). SLMs assume that spatial interaction comes from an explained variable, while SEMs believe that spatial interaction originates from the impact of random errors. However, in reality, green production activities can form spatial correlation relationships through exchanges and interactions and upstream and downstream relationships in production. Therefore, it is necessary to consider the spatial effect of the explained variable. But if the spatial effect of the core explanatory variable is not included in the model, this effect will enter the error term. At this point, models that only contain the spatial interaction of the explained variable or only the error term are inadequate. Hence, this paper chooses the SDM, which can consider both of the above effects, to study the spatial effect of IHC on GTFP.
As the core independent variables of this article, both IHCA and IHCQ have obvious spatial spillover impact, so it is more in line with the practical requirements to set up a model that includes the spatial correlation of IHC activities. In addition, spatial lag models (SLM) suppose that spatial interactions originate from the dependent variable, while spatial error models (SEM) suppose that spatial interactions originate from the impact of random errors. However, in reality, to consider the possible spatial correlation between green production activities and the upstream and downstream relations of production through communication and interaction, we need to consider the spatial effect from the dependent variable. However, if the spatial effect of the core independent variable is not involved in the model, the effect will be included in the error term; in this case, it is difficult to apply the spatial interaction models which only include the dependent variables or the error term. Therefore, this article chooses the SDM model that can consider the above two effects to investigate the spatial effect of IHC on GTFP. The spatial Durbin models for this study are as follows:
G T F P i t = α i + ρ j = 1 n W i j G T F P i t + β i I H C A i t + φ j = 1 n W i j I H C A i t + γ X i t + φ j = 1 n W i j X i t + λ W i j μ i t + ε i t
G T F P i t = α i + ρ j = 1 n W i j G T F P i t + β i I H C Q i t + φ j = 1 n W i j I H C Q i t + γ X i t + φ j = 1 n W i j X i t + λ W i j μ i t + ε i t
In Formulas (6) and (7), GTFP is the dependent variable, while IHCA and IHCQ are the core independent variables. Moreover, Wij represents the spatial weight, Xit represents the control variable, β means the independent variables’ regression coefficient, ρ means the dependent variable’s spatial regression coefficient, φ means the independent variables’ spatial regression coefficient, and λ means the spatial error regression coefficient.

4.3.2. Selection and Description of Variables

(1) Dependent variable: GTFP is calculated based on 2004, considering the unexpected output of green production, using the super-efficient SBM model without orientation and GML index, and calculated by MAXDEA software 9.
(2) Core independent variable: This article measures IHC from two aspects: quantity and quality. IHCA is calculated as follows:
I H C i t Q u a n t i t y = j 3 E m p l o y e d   p o p u l a t i o n i t × p r o p o r t i o n   o f   t e r t i a r y   e d u c a t i o n i t j × Y e a r s   o f   t e r t i a r y   e d u c a t i o n j
In the Formula (8), IHCitQuantity indicates the amount of IHC in the i-th province in year t, and i can be neglected while considering the whole country. j = 1 indicates junior college education, j = 2 indicates undergraduate education, and j = 3 indicates postgraduate education (covering masters and PhDs). According to Li and Du (2019), junior college education = 15 years, undergraduate education = 16 years, and graduate education = 21 years [28].
IHCQ is calculated as follows:
I H C i t Q u a l i t y = 10,000 × ( N u m b e r   o f   s c i e n t i f i c   a n d   t e c h n o l o g i c a l   p a p e r s   p u b l i s h e d i t + N u m b e r   o f   p a t e n t s   g r a n t e d   d o m e s t i c a l l y i t ) N u m b e r   o f   e m p l o y e d   p e o p l e   w i t h   t e r t i a r y   e d u c a t i o n i t
In the Formula (9) , IHCitQuality means the quality of IHC in the i-th province in year t, and i can be neglected while considering the whole country. There are two conversion coefficients between scientific papers and authorized patents: a and b. Referring to the empirical practice of Chinese research institutes, universities, and other organizations on the conversion between scientific and technological papers and authorized patents, the conversion ratio of a and b is 1:1.
The measurement unit is per 10,000 employees, which is based on the computing method taken by the Chinese National Bureau of Statistics in the construction of the innovation index. The number of scientific and technological papers refers to the number of these kinds of papers publicly published by Chinese writers involved in the three main international indexes SCI, SSCI, and EI. Authorized patents include three types of patents: design, utility model, and invention.
(3) Mechanism variable: In this study, technological innovation (TEC) means the product created by IHC, and considering that the measurement of IHCQ includes patent data, this article adopts the total revenue of new products as the measurement index for technological innovation.
(4) Control variables:
(a)
The first control variable is foreign investment size, which is calculated as the ratio of foreign direct investment to GDP and expressed as FDI. FDI is considered as it has a potential influence on the regional economy and environment. It can bring advanced technologies and management experience, which may impact GTFP [25]. FDI is converted through the average exchange rate of the US dollar and Yuan every year.
(b)
The second one is the government’s size, which is calculated as the ratio of government spending to GDP and expressed as GOV. The function of government in an economy is essential as it can allocate resources and affect economic activities. The proportion of government expenditure in GDP impacts GTFP based on the specific use of the expenditure. Spending on scientific research and environmental protection may have a positive influence on GTFP, while general fiscal expenditure might have a negative effect [26].
(c)
The third one is the urbanization level, which is calculated as the ratio of the urban population to the whole population and expressed as URB. Urbanization is a complex process that affects resource use and environmental quality. As mentioned by Wang et al. (2024) [27], the ratio of urban population to the whole population can indicate the degree of urbanization and its potential effect on GTFP.
(d)
The fourth one is international trade which is calculated by the ratio of total imports and exports to GDP and expressed as EX. International trade can impact a region’s industrial structure and technological progress, subsequently affecting GTFP [28]. The total amount of imports and exports is converted from US dollars to RMB based on the average exchange rate per year.
(e)
The fifth one is the infrastructure level, which is calculated as the ratio of the sum of road kilometers and railway kilometers in various places to the area of land in the region and expressed as INFRA. Infrastructure is of great importance for connecting markets, lowering transportation costs, and promoting economic growth [29].
(f)
The sixth one is environmental regulation and is expressed as REG. Strict environmental regulations can drive innovation and the adoption of cleaner production methods, thus affecting GTFP [30]. This article considers the availability and continuity of data and uses the comprehensive indexes of pollutant emissions calculated from SO2 emissions, solid waste generation, wastewater emissions, and regional GDP as specific measurement indicators.
(5) Spatial weight: The spatial weight W includes adjacency weight, distance weight, economic weight, comprehensive weight, etc. Further consideration of the economic distances between regions in spatial weights makes it difficult to ensure that the spatial weights are exogenous and prone to model estimation bias. Therefore, the article chooses both weights of “queen” adjacency and spatial distance to reflect spatial effects.
The queen adjacency weight is as follows:
W i j 0 1 = 1                             I   i s   a d j a c e n t   t o   j                                                             0                           I   a n d   j   a r e   n o t   a d j a c e n t   o r   b e l o n g   t o   t h e   s a m e   a r e a    
The distance weight is
W i j d = 1 d i j             i j 0                   i = j  
Table 3 shows the data sources of all variables. There were some missing data on individual years in some regions. To make up for that, this article adopts the calculation results of linear interpolation. Considering the availability and continuity of data, the article chose the relevant data from 30 provincial regions on the mainland excluding Tibet from 2004 to 2018. To avoid the coefficient of regression result being too small, the unit of IHCA is adjusted to 1000 years. Table 4 shows each variable’s descriptive statistics.

5. Results

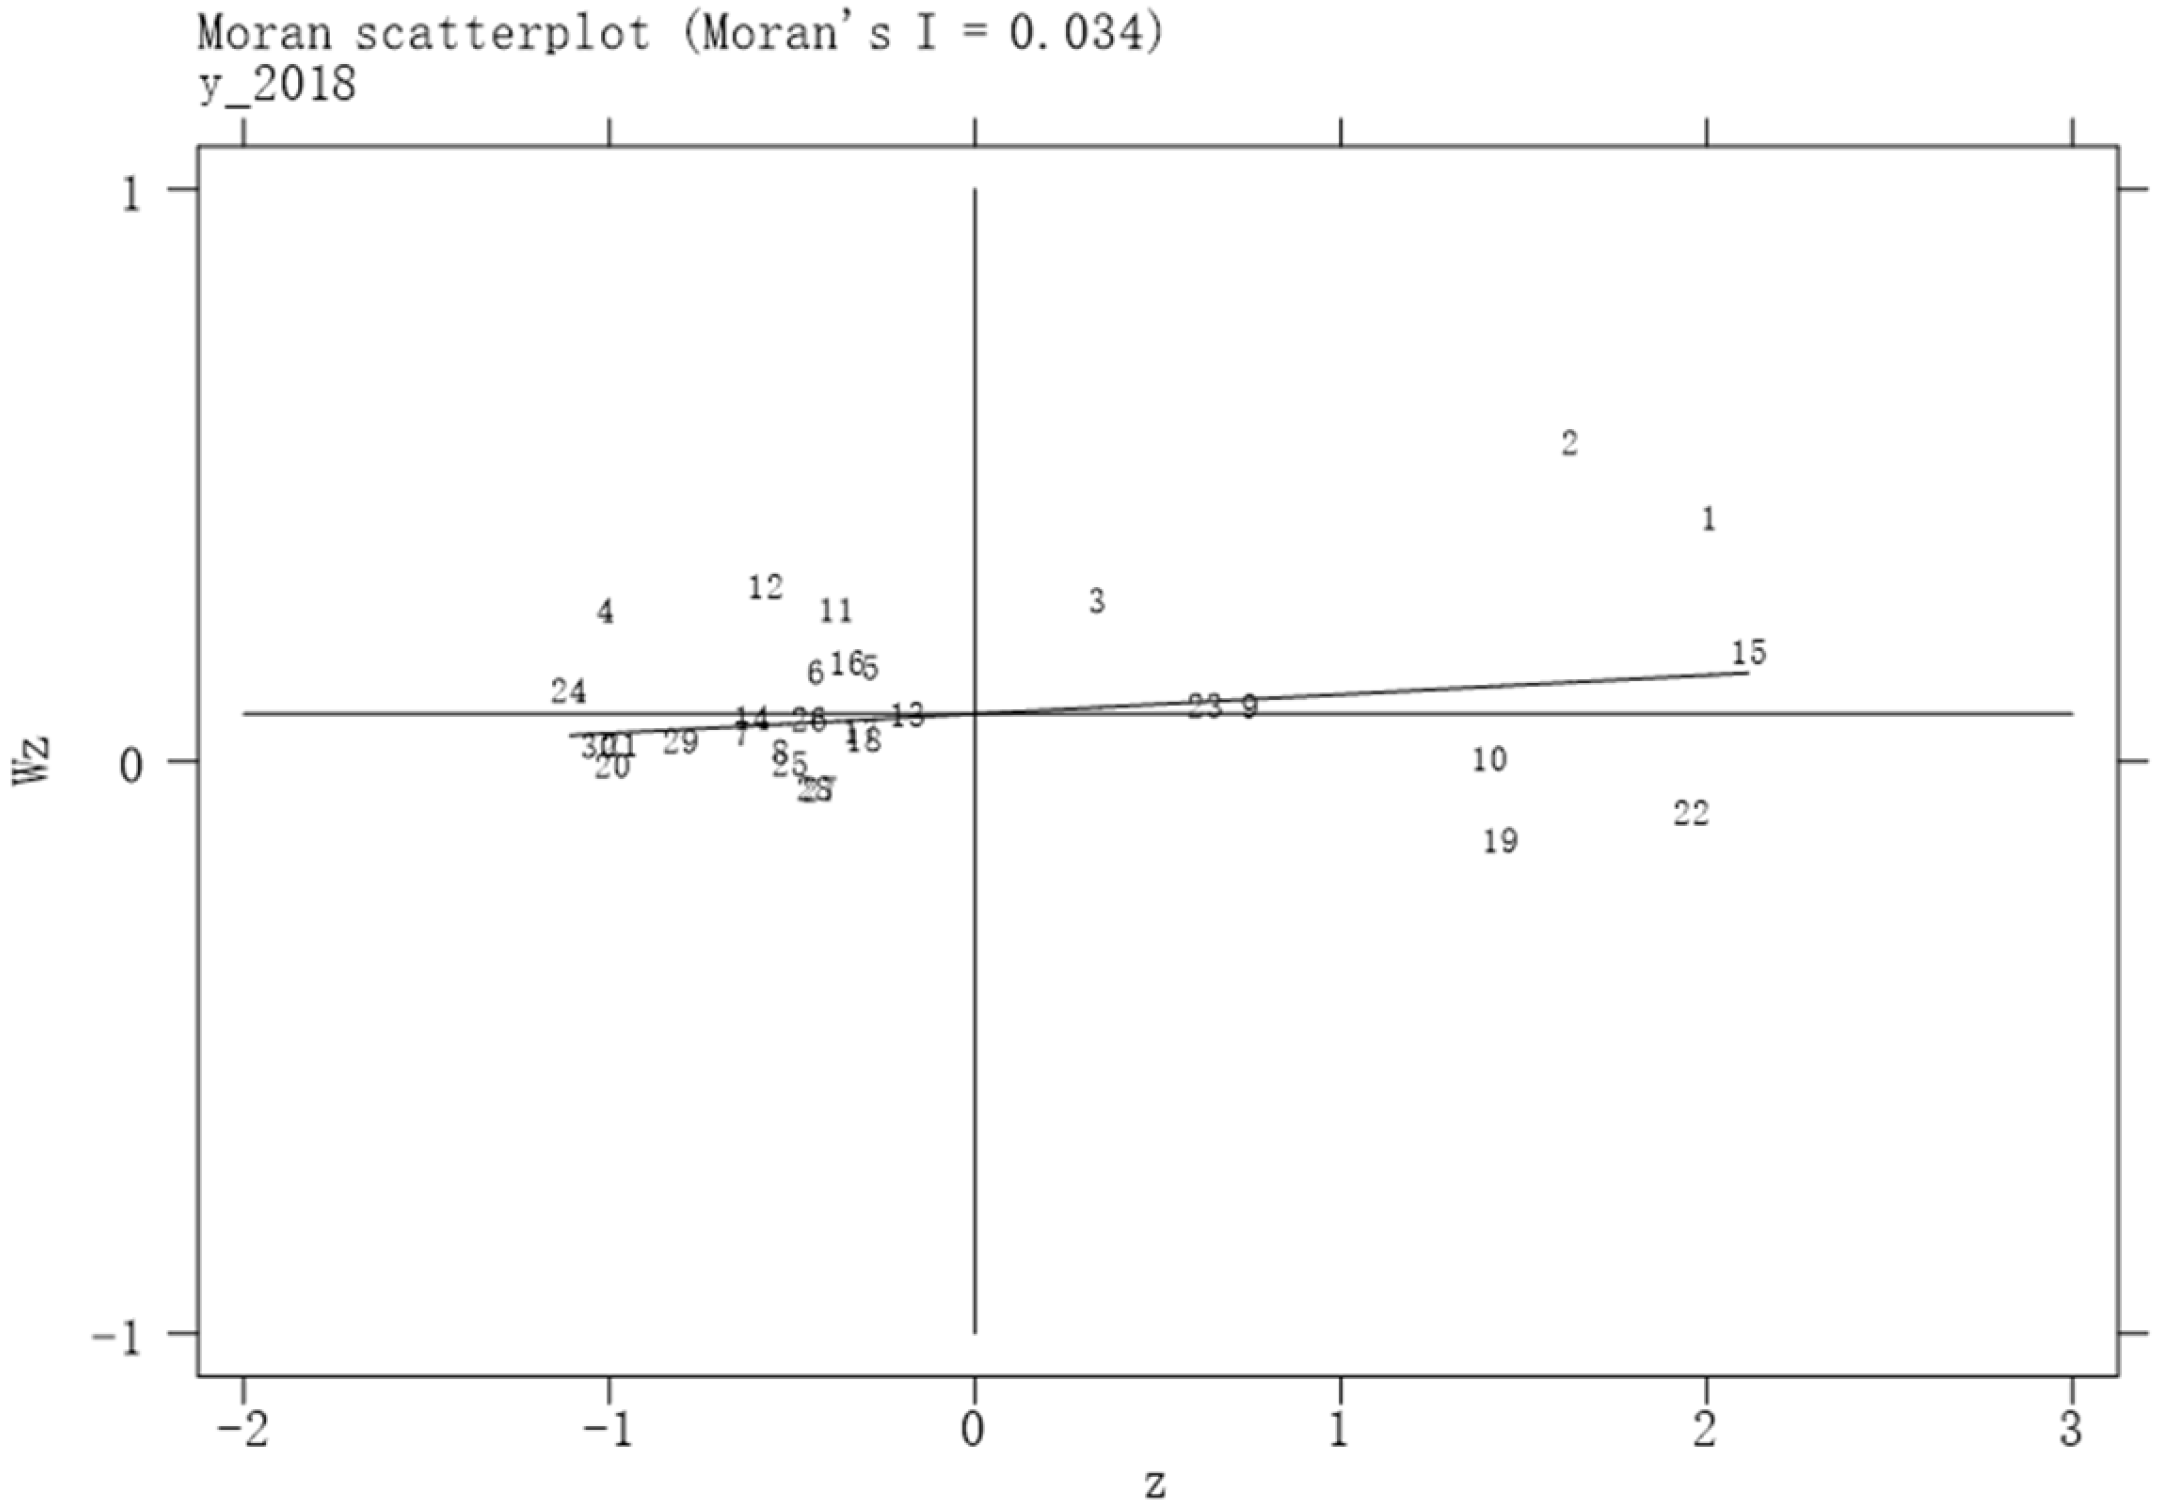
5.1. Spatial Correlation Test

First, GTFP’s global Moran’s I was calculated and the overall spatial correlation of GTFP was analyzed. Table 5 shows the results.
Second, the local Moran’s I of GTFP was measured. This article selects 2018 as a representative year and calculates its local Moran’s I to produce a scatter plot of Moran’s I for GTFP. Figure 2 shows the Moran scatter plot under distance weight, and Figure 3 presents the Moran scatter plot under neighbor weight.
From the quadrants of regional distribution in Figure 2 and Figure 3, it is not difficult to observe the following: (1) The regions in the first quadrant are Beijing, Tianjin, Hebei, Shandong, Shanghai, and Sichuan. It is notable that Sichuan is the center of economic development in the Sichuan–Chongqing region while other regions belong to the eastern regions, and there is an obvious agglomeration nature. (2) Most of the areas in the third quadrant come from the middle-western regions, where GTFP levels are very low. The results further prove that the design of the spatial econometric model in the article is reasonable and can be used for further research.

5.2. Test of the Direct Mechanism of IHC Promoting GTFP

The models are selected by using the Hausman test, and the test results show that the models’ estimation results under fixed effects are better. Models (6) and (7) were estimated under the weights of distance and adjacency to explore the influence of IHCA and IHCQ on GTFP. Table 6 shows the results.
Although the theoretical analysis in the previous text suggests that the spatial Durbin model is more suitable for this study, whether it is statistically valid still needs to be tested. In Table 6, the p-values of the LR test results are all less than 0.05, indicating that the spatial Durbin model will not degenerate. This suggests that the SDM set in this paper is statistically reasonable and can be applied for further research and analysis. Additionally, under both of the weight matrices, both coefficients of IHCA and IHCQ are greater than 0 with 1% and 5% statistical significance, respectively, showing that IHCA and IHCQ have an obvious promoting effect on the improvement of GTFP, and the H1 and H2 hypotheses proposed above are confirmed.

5.3. Test of the Indirect Mechanism of IHC Promoting GTFP

According to the above theoretical analysis, the interaction term is added to the previous spatial Durbin model to further test the path mechanism of IHC improving GTFP through technological innovation. The empirical results are revealed in Table 7. Among them, the measurement index of technological innovation is specifically measured by the total revenue of new products mentioned earlier. The results are exhibited in Table 7.
As per the results of the interaction test, the coefficients of IHCA × inov and IHCQ × inov are both significantly positive. Combined with the previous regional regression results, it exhibits that IHCA and IHCQ promote the efficiency of regional green growth through improving regional technological innovation ability. The hypotheses H2a and H2b proposed above are valid.

5.4. The Mechanism Test of Spatial Spillover Effect

In terms of the regression results of the previous basic model, IHC can both directly affect GTFP and affect regional GTFP through the spatial spillover effect mechanism as well. To further explain the marginal impact of IHC on regional GTFP, this article further decomposed the basic model’s estimated results, and the findings are exhibited in Table 8.
By analyzing the examining results for the spatial spillover effect mechanism in Table 8, we can find that IHCA’s regression coefficient is of negative statistical significance at the 1% level regardless of distance weight or adjacency weight, which indicates that IHCA has negative spatial spillover, and the hypothesis H3a proposed above is valid. Regardless of distance weight or adjacency weight, the regression coefficients of IHCQ are positive but insignificant statistically. This indicates that the spatial spillover effect of IHCQ does not yet exist, and the hypothesis H3b proposed earlier cannot be established. This is related to the present poor level of IHCQ in China and the large gaps in IHCQ between different regions.

5.5. Robustness Test

The article tested the model’s robustness by shortening the time window and reducing the sample size. Samples from 2004 and 2018 were removed, and models (6) and (4) were estimated. The results are shown in Table 9.
The results in Table 9 show that the direction and significance of the estimated coefficients of the core independent variables and their spatial lag terms remain substantially unchanged, indicating that the model set in the article is relatively robust. Thus, the research results are strongly reliable.

5.6. Analyzing Heterogeneity for Both the Eastern and the Middle-Western Regions

Uneven regional development is one of the key issues that need to be addressed at this stage of China’s high-quality economic development. Different levels of economic development, technology, etc., across regions will also cause different effects of IHC on GTFP. In view of this, based on the previous analysis of the influence of IHC on GTFP, the article adopts the three-regional division method to divide China into the eastern and middle-western regions for heterogeneity research, and further tests the heterogeneity effects of the two core variables in these two regions. The model’s estimated results are exhibited in both Table 10 and Table 11.
In the process of heterogeneity analysis, it shows that the main influence of IHCA is significantly positive, while the main influence of IHCQ is negative and not obvious. In the matrix decomposition results, it is found that IHCA’s spatial spillover effect in the eastern region is significantly positive, while IHCQ shows spatial inhibition effect but is not obvious. IHCA in the middle-western region shows a significant spatial inhibition effect, while IHCQ has a spatial spillover effect and is only significant under the distance weight. The influence of the relevant control variables is roughly similar to the results at the national level, but it can be found that the government size and urbanization level in the middle-western region have a significantly positive effect on GTFP. This shows that in areas with slower economic development, government intervention can better conform to development planning, and can allocate resources more equitably. Thus, the urbanization process can be carried out more effectively, which can promote the level of intensification and the ability to deal with environmental pollution.

6. Discussion

The empirical results of this study provide several valuable new perspectives on the relationship between IHC and GTFP in Chinese regions. This section compares the findings of current literature and further delve into the empirical results obtained from this study from the following aspects.

6.1. Direct Influence of IHC on GTFP

The discovery that both IHCA and IHCQ can significantly and directly enhance regional GTFP aligns with previous research underscoring the positive role of human capital on productivity growth (Hang and You, 2021; Feng and Zhang) [9,22]. These studies have demonstrated that human capital, whether measured in terms of educational attainment or other aspects, plays a significant role in driving economic growth and enhancing productivity. This study’s finding of the direct impact of IHC on GTFP further confirms the crucial role of innovative human resources in fostering green development.
The application of spatial econometric methods in this study to examine the direct impact of IHC on GTFP corresponds to the increasing acknowledgment in the literature of the significance of spatial effects in economic analysis. Numerous prior studies have deployed spatial models to capture the spillover effects and interconnectedness of regional economies (Wang et al., 2021; Zhou and Zhang, 2023) [3,4]. Using the spatial Durbin model in this research provides a more comprehensive understanding of how IHC in one region can impact GTFP in neighboring regions, thereby enriching the existing literature on spatial econometrics and regional development.
The observed regional heterogeneity in the immediate influence of IHC on GTFP, where IHCA and IHCQ significantly affect the eastern region while only IHCA has a significant impact in the middle-western region, can be related to disparities in regional development levels and industrial structures. Current literature has noted the uneven distribution of economic development, technology, and human capital across different regions in China (Xu and Li, 2020) [8]. The eastern region typically has more advanced economic and technological foundations, enabling it to adequately leverage both the quantity and quality of IHC to improve GTFP. Conversely, the middle-western region may face obstacles like a lack of complementary factors and a mismatch between IHC and industrial structure, resulting in a diminished effect of IHCQ on GTFP. This finding aligns with studies emphasizing the importance of regional context and the need for tailored policies to address regional imbalances (Mannasoo et al., 2018) [10].

6.2. Indirect Impact of IHC on GTFP Through Technological Progress

The finding that IHC can promote regional GTFP through technological progress is supported by endogenous growth theory, which highlights the role of human capital as a crucial driver of technological innovation and economic growth (Romer, 1990) [6]. This theory postulates that investment in human capital, such as through education and training, cause technological advancements that subsequently boost productivity. In this study, the empirical evidence of the indirect impact of IHC on GTFP via technological progress provides further corroboration of this theoretical framework.
Prior empirical research has also identified similar connections between human capital and technological innovation in the context of GTFP. Liu et al. (2022) emphasized the importance of technological innovation in enhancing GTFP [2], and other studies have examined the mechanisms through which human capital affects technological progress and ultimately GTFP (Jin et al., 2022) [13]. The findings of this study add to this body of research by providing more nuanced evidence regarding the indirect impact of IHC on GTFP through technological progress and its spatial implications.
The results suggest that investment in education, particularly in higher education as a primary origin of IHC, is vital for boosting technological progress and GTFP. This conforms to the literature that stresses the role of education in nurturing employees’ innovative thinking and enhancing practical innovation competencies (McGuirk et al., 2015) [7]. Education equips employees with a wide range of skills and a broad knowledge bank, helping them to innovate and design eco-friendly production technologies. This transformation of knowledge and acquisition of skills is key to enhancing regional GTFP and is further supported by the empirical findings of this study.

6.3. Spatial Spillover Effect of IHC on GTFP

The finding that IHCA generates a spatial spillover effect on regional GTFP, contrasting with the absence of such an effect from IHCQ, has important implications for comprehending the geographical interplay of IHC and GTFP. Spatial spillover effects have been extensively studied in the spatial econometrics literature, and various factors have been found to reveal varying degrees of spatial diffusion (Anselin, 2008; LeSage and Pace, 2009) [31,32]. The study adds to this literature by demonstrating that the quantity and quality of IHC can cause various spatial spillover patterns. The adverse spatial spillover of IHCA implies that the agglomeration of IHC in certain regions may create a “siphon effect” on neighboring areas, as observed in previous studies on the spatial distribution of economic activities (Zhang et al., 2024) [16]. This phenomenon may stem from the competition for resources and the limited diffusion of knowledge and technology in the short term. The absence of spatial spillover effect of IHCQ can be ascribed to multiple factors. First, the present low level of IHCQ in China and the large gaps in IHCQ between different regions may restrict the potential for spatial diffusion. As documented in previous studies on human capital heterogeneity, disparities in human capital quality can substantially influence economic outcomes (Islam et al., 2014) [33]. Second, the nature of knowledge and technology linked to IHCQ may be more challenging to diffuse spatially compared to IHCA. Patents and scientific papers, often used to measure IHCQ, may embody more specialized and context-specific knowledge that is not easily transferable across regions. This finding underscores the significance of considering both the quantity and quality of IHC and their spatial implications when developing policies for regional development.

7. Conclusions and Policies

7.1. Conclusions

After the empirical analysis, this article draws the following conclusions:
1. IHCA and IHCQ can directly and obviously improve the efficiency of regional GTFP. IHC is the main body of regional green technological innovation, and the increase of IHCA and IHCQ is a crucial driving force for boosting regional green innovation and the accumulation of green technology. However, regional heterogeneity exists in the direct impact of IHC upon GTFP. In the eastern region, IHCA and IHCQ can directly and significantly improve GTFP, but in the middle-western region, only IHCA can directly and significantly promote GTFP, while IHCQ does not. The reason may be due to the misalignment or decoupling of high-level talent training and market demand, and the fact that IHC inputs cannot completely fulfill the needs of industrial structure upgrading and green innovation development in the middle-western region.
2. The impact of IHC on regional GTFP has an indirect mechanism, which indirectly increases the efficiency of GTFP through technological advances. This result further indicates that investment in education, especially in higher education, can not only cultivate innovative thinking and improve the innovative practical abilities of workers but also promote the transformation of knowledge. The process of knowledge transformation facilitates the acquisition of diverse skills by workers, enabling them to apply acquired knowledge and skills to the development of practical technologies aimed at promoting green production, thereby augmenting regional GTFP.
3. The impact of IHC on regional GTFP produces a partial spatial spillover influence. More precisely, IHCA produces a significant spatial spillover influence, but IHCQ does not. The spatial spillover influence of IHCA is negative, meaning that the enhancement of IHCQ in surrounding areas will not increase the efficiency of local GTFP, but rather has a significant inhibitory effect. This phenomenon further indicates that the spatial effect of IHC agglomeration in China is manifested as the “siphon effect” and does not exhibit a good spatial diffusion effect. Thus, IHCQ does not have spatial spillover effects, indicating that only by quickly applying knowledge or technology to production can GTFP be improved. The significant gap in human capital quality and technological level between regions makes it difficult for technology diffusion to occur on a large scale and also makes it difficult for spilled technologies to be applied and produced shortly.

7.2. Policies

Based on the previous three conclusions, the article proposes the following policies:
1. In order to realize the commitment of “double carbon” and promote green development comprehensively, China should continue to increase the cultivation and accumulation of IHC. Meanwhile, China should introduce all kinds of high-end talents with outstanding innovative abilities to contribute wisdom and strength to China’s high-quality development. Due to the objective situation of imbalanced regional development in China, different regions need to adopt different policies in developing and accumulating IHC. Eastern China should keep expanding the accumulation of IHC in terms of quantity, while also continuously improving the quality of IHC. In addition to increasing the accumulation of the quantity of IHC, the middle-western region should be centered on increasing the quality of IHC.
2. The Chinese government should continue to increase investment in education, especially in tertiary education, as tertiary education is the most important channel for training and accumulating IHC. In addition to directly contributing to regional GTFP, IHC can transform its own knowledge and technology to promote technological progress, thus indirectly boosting regional GTFP.
3. The large gap in the regional distribution of IHC is a considerable aspect of China’s unbalanced inter-regional development. In terms of the quantity of IHC or the quality of IHC, the eastern region has a clear advantage over the middle-western region. The location and development advantages of the eastern region have a strong attraction for various innovative talents, which is an important reason why the spatial effect of China’s IHC agglomeration is characterized as the “siphon effect” and has not played a good spatial diffusion role. In this context, in order to facilitate the balanced development of various regions, local governments in the east region and the middle-western region should take action to actively break the “siphon effect” that is not conducive to coordinated development.
Certainly, there are still some deficiencies in this study, mainly manifested in the following two aspects. First, when measuring IHCA, the education stock method was used, only considering the years of education of employees in school, not including the hours of training, further education, etc., after they have worked. Unfortunately, official statistical agencies do not count these hours, so as researchers, we cannot obtain these data either. In the future, if the official statistics include these data, we will be able to incorporate these hours. Second, health factors were not included in the measurement of IHC, which is an area for improvement in future research.
In future research, based on the continuous refinement of the measurement methods for IHC, we will further specify the research level, taking prefecture-level cities or county-level cities and counties as well as various industries as research objects, and conduct in-depth research and empirical analysis on the influence of IHC on their green development process and the emergence of new quality productive forces.

Funding

This research was funded by the National Natural Science Foundation of China, Grant No. 72262010.

Institutional Review Board Statement

Not applicable.

Informed Consent Statement

Not applicable.

Data Availability Statement

The data presented in this study are available on request from the corresponding author.

Conflicts of Interest

The author declares no conflict of interest.

References

  1. Luo, Y.; Mensah, C.N.; Lu, Z.; Wu, C. Environmental Regulation and Green Total Factor Productivity in China: A Perspective of Porter’s and Compliance Hypothesis. Ecol. Indic. 2022, 145, 109744. [Google Scholar] [CrossRef]
  2. Liu, S.; Hou, P.; Gao, Y.; Tan, Y. Innovation and Green Total Factor Productivity in China: A Linear and Nonlinear Investigation. Environ. Sci. Pollut. Res. 2022, 29, 12810–12831. [Google Scholar] [CrossRef] [PubMed]
  3. Wang, H.; Cui, H.; Zhao, Q. Effect of Green Technology Innovation on Green Total Factor Productivity in China: Evidence from Spatial Durbin Model Analysis. J. Clean. Prod. 2021, 288, 125624. [Google Scholar] [CrossRef]
  4. Zhou, R.; Zhang, Y. Measurement of Urban Green Total Factor Productivity and Analysis of Its Temporal and Spatial Evolution in China. Sustainability 2023, 15, 9435. [Google Scholar] [CrossRef]
  5. Zhou, Y.; Xu, Y.; Liu, C.; Fang, Z.; Fu, X.; He, M. The Threshold Effect of China’s Financial Development on Green Total Factor Productivity. Sustainability 2019, 11, 3776. [Google Scholar] [CrossRef]
  6. Jiakui, C.; Abbas, J.; Najam, H.; Liu, J.; Abbas, J. Green Technological Innovation, Green Finance, and Financial Development and Their Role in Green Total Factor Productivity: Empirical Insights from China. J. Clean. Prod. 2023, 382, 135131. [Google Scholar] [CrossRef]
  7. McGuirk, H.; Lenihan, H.; Hart, M. Measuring the Impact of Innovative Human Capital on Small Firms’ Propensity to Innovate. Res. Policy 2015, 44, 965–976. [Google Scholar] [CrossRef]
  8. Xu, Y.; Li, A. The Relationship between Innovative Human Capital and Interprovincial Economic Growth Based on Panel Data Model and Spatial Econometrics. J. Comput. Appl. Math. 2020, 365, 112381. [Google Scholar] [CrossRef]
  9. Hang, X.; You, J. The Heterogeneous Impacts of Human Capital on Green Total Factor Productivity: Regional Diversity Perspective. Front. Environ. Sci. 2021, 9, 713562. [Google Scholar] [CrossRef]
  10. Mannasoo, K.; Hein, H.; Ruubel, R. The Contributions of Human Capital, R&D Spending and Convergence to Total Factor Productivity Growth. Reg. Stud. 2018, 52, 1598–1611. [Google Scholar] [CrossRef]
  11. Cheng, C.; Yu, X.; Hu, H.; Su, Z.; Zhang, S. Measurement of China’s Green Total Factor Productivity Introducing Human Capital Composition. Int. J. Environ. Res. Public Health 2022, 19, 13563. [Google Scholar] [CrossRef] [PubMed]
  12. Wang, X.; Sun, C.; Wang, S.; Zhang, Z.; Zou, W. Going Green or Going Away? A Spatial Empirical Examination of the Relationship between Environmental Regulations, Biased Technological Progress, and Green Total Factor Productivity. Int. J. Environ. Res. Public Health 2018, 15, 1917. [Google Scholar] [CrossRef] [PubMed]
  13. Jin, W.; Gao, S.; Pan, S. Research on the Impact Mechanism of Environmental Regulation on Green Total Factor Productivity from the Perspective of Innovative Human Capital. Environ. Sci. Pollut. Res. 2022, 30, 352–370. [Google Scholar] [CrossRef] [PubMed]
  14. Xu, Y.; Deng, H. Green Total Factor Productivity in Chinese Cities: Measurement and Causal Analysis within a New Structural Economics Framework. J. Innov. Knowl. 2022, 7, 100235. [Google Scholar] [CrossRef]
  15. Wang, F.; Wu, M. Does Air Pollution Affect the Accumulation of Technological Innovative Human Capital? Empirical Evidence from China and India. J. Clean. Prod. 2021, 285, 124818. [Google Scholar] [CrossRef]
  16. Zhang, R.; Ying, W.; Wu, K.; Sun, H. The Impact of Innovative Human Capital Agglomeration on Urban Green Development Efficiency: Based on Panel Data of 278 Cities in China. Sustain. Cities Soc. 2024, 111, 105566. [Google Scholar] [CrossRef]
  17. Zhang, G.; Chen, C.; Cao, Y.; Xie, L. An Empirical Study on the Impact of Innovative Human Capital on Economic Growth from the Perspective of Stock and Level. Sci. Technol. Prog. Policy 2010, 27, 137–141. [Google Scholar]
  18. Liu, T.; Mao, Y.; Tian, X. The Role of Human Capital: Evidence from Corporate Innovation. J. Empir. Financ. 2023, 74, 101435. [Google Scholar] [CrossRef]
  19. Huang, S.-Z.; Chien, F.; Sadiq, M. A Gateway towards a Sustainable Environment in Emerging Countries: The Nexus between Green Energy and Human Capital. Ekon. Istraz. 2022, 35, 4159–4176. [Google Scholar] [CrossRef]
  20. Sarkodie, S.A.; Adams, S.; Owusu, P.A.; Leirvik, T.; Ozturk, I. Mitigating Degradation and Emissions in China: The Role of Environmental Sustainability, Human Capital and Renewable Energy. Sci. Total Environ. 2020, 719, 137530. [Google Scholar] [CrossRef]
  21. Yao, H.; Gu, X.; Yu, Q. Impact of Graduate Student Expansion and Innovative Human Capital on Green Total Factor Productivity. Sustainability 2023, 15, 1721. [Google Scholar] [CrossRef]
  22. Feng, F.; Zhang, S. The Measurement of China’s Provincial Green Total Factor Productivity Based on DEA Method: Does the Choice of DEA Model Make Difference. Acta Sci. Nat. Univ. Pekin. 2017, 53, 151–159. [Google Scholar]
  23. Zhang, X.; Li, R.; Zhang, J. Understanding the Green Total Factor Productivity of Manufacturing Industry in China: Analysis Based on the Super-SBM Model with Undesirable Outputs. Sustainability 2022, 14, 9310. [Google Scholar] [CrossRef]
  24. Zhong, S.; Fang, Y. The Impact of Electricity Consumption on Green Total Factor Productivity: Evidence from Chinese Provinces. J. Knowl. Econ. 2024. [Google Scholar] [CrossRef]
  25. Wang, C.; Wang, L. Green Credit and Industrial Green Total Factor Productivity: The Impact Mechanism and Threshold Effect Tests. J. Environ. Manag. 2023, 331, 117266. [Google Scholar] [CrossRef]
  26. Niu, B. Government Environmental Protection Expenditure and National ESG Performance: Global Evidence. Innov. Green Dev. 2024, 3, 100117. [Google Scholar] [CrossRef]
  27. Wang, C.; Wang, J.; Ai, W. Do Urbanization, Environmental Regulation and GDP Affect Agricultural Land Use Efficiency? Implications for Just Transition. Environ. Impact Assess. Rev. 2024, 105, 107421. [Google Scholar] [CrossRef]
  28. Li, L.; Du, F. The Impact of Postgraduate Education on Economic Growth in China: An Empirical Analysis on a Provincial Panel Data from 1996 to 2016. Tsing Hua J. Educ. 2019, 56–65. [Google Scholar]
  29. Tan, R.; Pan, L.; Xu, M.; He, X. Transportation Infrastructure, Economic Agglomeration and Non-Linearities of Green Total Factor Productivity Growth in China: Evidence from Partially Linear Functional Coefficient Model. Transp. Policy 2022, 129, 1–13. [Google Scholar] [CrossRef]
  30. Qiu, S.; Wang, Z.; Geng, S. How Do Environmental Regulation and Foreign Investment Behavior Affect Green Productivity Growth in the Industrial Sector? An Empirical Test Based on Chinese Provincial Panel Data. J. Environ. Manag. 2021, 287, 112282. [Google Scholar] [CrossRef]
  31. Anselin, L.; Le Gallo, J.; Jayet, H. Spatial Panel Econometrics; Springer: Berlin/Heidelberg, Germany, 2008. [Google Scholar]
  32. LeSage, J.P.; Pace, R.K. Introduction to Spatial Econometrics; Chapman & Hall CRC Press: Boca Raton, FL, USA, 2009. [Google Scholar]
  33. Islam, R.; Ang, J.; Madsen, J. Quality-Adjusted Human Capital and Productivity Growth. Econ. Inq. 2014, 52, 757–777. [Google Scholar] [CrossRef]
Figure 1. Theoretical mechanism of IHC affecting GTFP.
Sustainability 16 09358 g001
Figure 2. GTFP local Moran’s I scatter plot under distance weight of 2018.
Sustainability 16 09358 g002
Figure 3. Local Moran’s I scatter of GTFP plot under adjacency weight of 2018.
Sustainability 16 09358 g003
Table 1. GTFP measurement and evaluation system.
ItemsIndexesSpecific IndexesUnitIndicator Attribute
InputLabor
input
Number of employed personnel in each province at the end of the year10,000 personsPositive
Capital inputFixed capital stock100 million YuanPositive
Energy inputEnergy consumption of provinces,
municipalities and autonomous regions
10,000 tons of standard coalPositive
OutputEconomic outputReal GDP100 million YuanPositive
Environmental outputCOD discharge in industrial wastewaterTonsNegative
Industrial SO2 emissions10,000 tonsNegative
Table 2. Descriptive statistics of GTFP measurement variables.
VariablesSample SizeMeanStandard DeviationMinimum ValueMaximum Value
Employed personnel
(10,000 people)
4502610.4501727.572290.4207132.990
Fixed capital stock
(100 million Yuan)
45032,611.80329,295.2641291.540158,047.050
Energy consumption
(10,000 tons of standard coal)
45012,800.5858176.127742.00040,581.000
Real GDP (100 million Yuan)45012,732.28611,910.422460.35064,866.199
COD discharge in industrial wastewater (Tons)450121,042.300114,886.6301463.000975,456.000
Industrial SO2 emission
(10,000 tons)
45055.46839.4130.105171.600
Table 3. Data sources of variables.
Variable NamesData Sources
IHC including
IHCA and IHCQ
China Statistical Yearbook
China Population and Employment Statistical Yearbook
The mechanism variable: TECChina Science and Technology Statistical Yearbook
Statistical yearbooks of various provinces, autonomous regions, and municipalities
Control variable: FDIChina Trade and External Economic Statistical Yearbook
Control variables:
GOV, URB, EX
China Statistical Yearbook
Website of National Bureau of Statistics
Control variable:
INFRA
Statistical yearbooks of various provinces, autonomous regions, and municipalities
EPS database
Control variable:
REG
China Environmental Statistical Yearbook
Table 4. Variables’ descriptive statistics.
VariablesNumber of ObservationsMean ValueStandard DeviationMinimumMaximum
G T F P 4501.4350.8250.3074.757
I H C A 4505.0644.0320.27421.855
I H C Q 4500.9460.8670.05410.314
f d i 4500.4050.5030.0485.705
g o v 4500.2150.0960.0790.627
u r b 4500.5330.1430.2560.896
e x 4500.3130.3820.0171.722
i n f r a 4500.8380.4980.0402.188
r e g 450694.426540.61295.0734930.431
Table 5. Test results of GTFP spatial correlation.
Year W i j d W i j 0 1
M o r a n s   I Z Value M o r a n s   I Z Value
2005−0.04−0.232−0.079−0.551
2006−0.038−0.123−0.08−0.507
2007−0.036−0.056−0.074−0.419
2008−0.0240.403−0.043−0.091
2009−0.0190.523−0.038−0.03
2010−0.0150.609−0.0280.062
2011−0.0140.718−0.0190.167
2012−0.0090.822−0.0050.294
2013−0.0120.747−0.0010.335
2014−0.0120.7410.0130.474
2015−0.0110.7700.0230.563
20160.038 **2.0880.108 *1.534
20170.033 **1.8840.103 *1.660
20180.034 **1.8930.117 *1.662
Note: “*” and “**” mean significance at the 10% and 5% levels, respectively.
Table 6. Basic models’ estimation results.
Variables W i j d W i j 0 1
I H C A 0.051 ***
(0.01)
/0.055 ***
(0.011)
/
I H C Q /0.071 **
(0.029)
/0.061 **
(0.03)
f d i 0.037
(0.044)
0.086 *
(0.045)
0.066
(0.045)
0.107 **
(0.046)
g o v −0.072
(0.573)
−0.833
(0.558)
−0.100
(0.557)
−0.921 *
(0.543)
u r b 0.075
(0.707)
−0.635
(0.738)
0.967
(0.698)
0.692
(0.705)
e x −53.767 ***
(15.618)
−70.708 ***
(15.472)
−60.948 ***
(15.886)
−79.103 ***
(15.545)
i n f r a 0.569 ***
(0.116)
0.717 ***
(0.119)
0.572 ***
(0.11)
0.621 ***
(0.113)
r e g 0.0001 ***
(0.000)
0.0002 ***
(0.000)
0.0002 ***
(0.000)
0.0002 ***
(0.000)
_ c o n s −3.150 ***
(0.716)
−0.751
(0.495)
−0.982 **
(0.387)
−0.787 **
(0.319)
W × I H C A −0.216 ***
(0.041)
/−0.166 ***
(0.066)
/
W × I H C Q /0.076
(0.103)
/0.0211
(0.056)
W × f d i −0.249
(0.214)
0.026
(0.209)
0.057
(0.092)
−0.001
(0.094)
W × g o v −6.873 ***
(2.083)
−4.271 **
(2.060)
−3.459 ***
(0.995)
−2.382 **
(0.981)
W × u r b 14.482 ***
(2.470)
6.497 ***
(1.401)
4.924 **
(1.141)
4.493 ***
(0.907)
W × e x −1.747 ***
(0.604)
−0.441
(0.526)
−0.501
(0.321)
−0.136
(0.288)
W × i n f r a −0.829 ***
(0.204)
−0.812 ***
(0.214)
−0.633 ***
(0.154)
−0.727 ***
(0.163)
W × r e g −0.001 ***
(0.0001)
−0.0001
(0.0002)
−0.0006
(0.0001)
−0.0001
(0.0001)
ρ 0.311 ***
(0.108)
0.177 ***
(0.061)
0.252 **
(0.113)
0.164 ***
(0.061)
S i g m a _ e 0.077 ***
(0.005)
0.083 ***
(0.006)
0.083 ***
(0.006)
0.087 ***
(0.006)
Log-likehood125.438142.542143.234155.815
LR test Spatial lag p Value0.0010.0010.0010.001
LR test Spatial error p Value0.0030.0020.0020.002
Hausman test
p Value
0.0000.0000.0000.000
R20.6210.5930.5960.572
Sample size450450450450
Note: “*”, “**”, and “***” mean significance at the 10%, 5%, and 1% levels, respectively. Standard errors are in parentheses.
Table 7. Test results of the technological innovation mechanism.
Variables W i j d W i j 0 1 W i j d W i j 0 1
I H C A −0.090
(0.062)
−0.084
(0.0629)
//
I H C Q //−1.116 ***
(0.209)
−1.076 ***
(0.216)
I H C A × i n o v 0.011 **
(0.005)
0.011 **
(0.005)
//
I H C Q × i n o v //0.109 ***
(0.020)
0.105 ***
(0.196)
i n o v 0.097 *
(0.005)
0.138 ***
(0.051)
0.007
(0.06)
0.022
(0.055)
f d i 0.046
(0.427)
0.065
(0.044)
0.633
(0.434)
0.088 **
(0.044)
g o v −0.355
(0.0427)
−0.001
(0.560)
−0.05
(0.558)
−0.260
(0.548)
u r b −0.422
(0.752)
0.153
(0.733)
−0.886
(0.741)
0.319
(0.728)
e x −0.447 ***
(0.161)
−0.464 ***
(0.163)
−0.333 **
(0.164)
−0.407 ***
(0.166)
i n f r a 0.491 ***
(0.117)
0.432 ***
(0.113)
0.637 ***
(0.118)
0.538 ***
(0.112)
r e g 0.000 ***
(0.001)
0.000 ***
(0.000)
0.000 ***
(0.000)
0.000 ***
(0.000)
_ c o n s −6.105 ***
(1.110)
−1.647
(0.518)
−0.1735
(1.142)
−0.525
(0.545)
S i g m a _ e 0.723 ***
(0.005)
0.080 ***
(0.006)
0.077 ***
(0.005)
0.082 ***
(0.006)
L o g l i k e h o o d 114.047134.152126.236139.725
Hausman test
p Value
0.0000.0000.0000.000
R20.6400.6080.6250.598
Sample size450450450450
Note: “*”, “**”, and “***” mean significance at the 10%, 5%, and 1% levels, respectively. Standard errors are in parentheses.
Table 8. Test results of the spatial spillover effect mechanism.
EffectVariables W i j d W i j 0 1 W i j d W i j 0 1
Spatial spillover effect I H C A −0.287 ***
(0.071)
−0.065 ***
(0.019)
//
I H C Q //0.136
(0.139)
0.042
(0.065)
f d i −0.326
(0.321)
0.088
(0.105)
0.073
(0.274)
0.025
(0.106)
g o v −9.842 ***
(2.949)
−4.145 ***
(1.144)
−5.962 **
(2.632)
−2.983 ***
(1.11)
u r b 20.798 ***
(3.983)
6.007 ***
(1.27)
8.380 ***
(1.464)
5.370 ***
(0.957)
e x −2.731 ***
(91.13)
−0.718 **
(36.429)
−0.846
(70.38)
−0.322
(33.49)
i n f r a −0.946 ***
(0.293)
−0.631 ***
(0.181)
−0.847 ***
(0.28)
−0.735 ***
(0.19)
r e g −0.001 ***
(0.000)
0.0001
(0.0001)
0.0001
(0.0001)
0.0001
(0.0001)
Note: “**”, and “***” mean significance at the 5%, and 1% levels, respectively. Standard errors are in parentheses.
Table 9. Results of the robustness test.
Variables(1)(2)(3)(4)
W i j d W i j 0 1 W i j d W i j 0 1
I H C A 0.030 ***
(0.008)
0.031 ***
(0.008)
//
I H C Q //0.032 *
(0.020)
0.026
(0.021)
f d i 0.0257
(0.030)
0.046
(0.031)
0.615 *
(0.031)
0.069 **
(0.031)
g o v −0.091
(0.426)
−0.078
(0.427)
−0.585
(0.420)
−0.613
(0.409)
u r b 1.368 **
(0.598)
2.038 ***
(0.597)
0.623
(0.616)
1.863 ***
(0.585)
e x −0.562 ***
(0.115)
−0.642 ***
(0.119)
−0.637 ***
(0.116)
−0.741 ***
(0.116)
i n f r a 0.199 *
(0.103)
0.303 ***
(0.097)
0.344 ***
(0.105)
0.335 **
(0.099)
r e g 0.000 *
(0.000)
0.000 **
(0.000)
0.000 ***
(0.000)
0.000 **
(0.000)
W × I H C A −0.200 ***
(−0.031)
−0.038 ***
(−0.014)
//
W × I H C Q //−0.032
(−0.072)
−0.024
(−0.039)
W × f d i −0.017
(−0.143)
0.066
(−0.063)
0.240
(−0.148)
0.037
(−0.066)
W × g o v −3.864 ***
(−1.457)
−2.053 ***
(−0.791)
−0.851
(−1.499)
−1.356 *
(−0.753)
W × u r b 13.63 ***
(−2.026)
3.516 ***
(−1.029)
4.234 ***
(−1.202)
2.820 ***
(−0.752)
W × e x −80.43 *
(−41.780)
−4.853
(−24.190)
33.160
(−39.820)
15.260
(−21.320)
W × i n f r a −0.615 ***
(−0.160)
−0.584 ***
(−0.133)
−0.611 ***
(−0.173)
−0.583 ***
(−0.138)
W × r e g −0.0005 ***
(0.000)
0.000
(0.000)
0.000
(0.000)
0.000
(0.000)
ρ 0.311 ***
(0.107)
0.177 ***
(0.061)
0.252 **
(0.113)
0.164 ***
(0.061)
_ c o n s −3.616 ***
(0.615)
−0.827 ***
(0.343)
−1.128 ***
(0.398)
−0.737 ***
(0.268)
S i g m a _ e 0.033 ***
(0.002)
0.037 ***
(0.003)
0.036 **
(0.003)
0.038 ***
(0.003)
L o g l i k e h o o d 35.13012.10814.8434.9045
Hausman test
p Value
0.0000.0000.0000.000
R20.6680.6220.63290.6094
Sample size390390390390
Note: “*”, “**”, and “***” mean significance at the 10%, 5%, and 1% levels, respectively. Standard errors are in parentheses.
Table 10. Estimation results for the eastern region.
Variables(1)(2)(3)(4)
W i j d W i j 0 1 W i j d W i j 0 1
I H C A 0.057 ***
(2.82)
0.045 *
(2.01)
//
I H C Q //0.054
(1.23)
0.087 *
(1.92)
f d i 0.048
(0.74)
0.052
(0.76)
0.072
(1.13)
0.063
(0.95)
g o v −1.691
(−0.81)
−4.283
(−1.64)
−3.819 *
(−1.88)
−6.666 ***
(−2.87)
u r b −1.155
(−0.80)
−1.482
(−0.99)
−0.881
(−0.59)
−1.066
(−0.75)
e x −0.392
(−1.25)
−0.396
(−1.29)
−0.482
(−1.52)
−0.446
(−1.53)
i n f r a 0.301
(0.98)
0.368
(1.28)
0.306
(0.98)
0.204
(0.71)
r e g 0.0001
(1.46)
0.0002 *
(1.94)
0.0002 *
(−0.11)
0.0002 **
(2.24)
W × I H C A 0.135 **
(0.056)
0.0666 *
(0.037)
//
W × I H C Q //−0.110
(0.087)
−0.116
(0.074)
W × f d i 0.326 *
(0.173)
0.188
(0.147)
0.340 *
(0.178)
0.244
(0.151)
W × g o v 6.576
(6.316)
4.616
(4.373)
12.39 *
(6.421)
3.937
(3.910)
W × u r b −13.23 ***
(4.568)
−5.230 **
(2.362)
−0.635
(2.873)
3.201 *
(1.760)
W × e x 100.2
(67.36)
8.537
(45.00)
47.22
(59.81)
−75.61 *
(39.99)
W × i n f r a 0.663
(0.495)
0.322
(0.405)
0.136
(0.467)
0.545
(0.395)
W × r e g 0.0002
(0.0001)
0.0001
(0.0001)
−0.0001
(0.0001)
−0.0002
(0.0001)
ρ 0.395 ***
(0.101)
0.200 ***
(0.075)
0.413 **
(0.098)
0.258 ***
(0.073)
_ c o n s 2.504
(1.30)
0.879
(0.94)
−0.153
(−0.11)
0.145
(0.22)
S i g m a _ e 0.150 ***
(8.49)
0.169 ***
(8.19)
0.156 ***
(8.56)
0.169 ***
(8.44)
L o g l i k e h o o d −100.4409−106.9532−104.3168−106.9758
Hausman test
p Value
0.0000.0000.0000.000
R20.58660.55560.54270.5369
Sample size165165165165
Note: “*”, “**”, and “***” mean significance at the 10%, 5%, and 1% levels, respectively. Standard errors are in parentheses.
Table 11. Estimation results for the middle-western region.
Variables(1)(2)(3)(4)
W i j d W i j 0 1 W i j d W i j 0 1
I H C A 0.027 **
(0.011)
0.038 ***
(0.000)
//
I H C Q //−0.013
(0.069)
−0.0375
(0.069)
f d i −0.305 *
(0.186)
−0.098
(0.170)
−0.225
(0.187)
−0.419
(0.177)
g o v 0.955 **
(0.475)
1.115 **
(0.454)
0.359
(0.449)
0.367
(0.441)
u r b 1.823 ***
(0.694)
2.204 ***
(0.642)
1.762 **
(0.702)
2.019 ***
(0.664)
e x 0.948 ***
(0.348)
0.931 ***
(0.325)
1.152 ***
(0.352)
1.222 ***
(0.345)
i n f r a 0.352 ***
(0.096)
0.266 ***
(0.000)
0.392 ***
(0.097)
0.352 ***
(0.092)
r e g 0.001 ***
(0.000)
0.001 ***
(0.000)
0.001 **
(0.000)
0.001 ***
(0.000)
W × I H C A −0.086 **
(−0.037)
−0.067 ***
(−0.018)
//
W × I H C Q //0.441 **
(−0.203)
0.086
(−0.134)
W × f d i −0.199
(−0.491)
0.419
(−0.274)
−0.307
(−0.498)
0.291
(−0.286)
W × g o v −3.84 ***
(−1.325)
−1.725 **
(−0.741)
−3.468 **
(−1.348)
−1.401 *
(−0.756)
W × u r b 5.586 ***
(−1.988)
1.058
(−0.982)
2.759 **
(−1.257)
0.834
(−0.829)
W × e x −188.1 *
(−108.000)
−17.330
(−52.280)
−224.7 **
(−112.500)
−95.92 *
(−55.100)
W × i n f r a −0.798 ***
(−0.198)
−0.497 ***
(−0.119)
−0.806 ***
(−0.187)
−0.548 ***
(−0.126)
W × r e g 0.000
(0.000)
−0.0004 *
(0.000)
0.000
(0.000)
0.000
(0.000)
ρ 0.220 *
(0.129)
0.352 ***
(0.063)
0.129
(0.137)
0.271 ***
(0.067)
_ c o n s −0.981 **
(0.446)
−0.655 ***
(0.245)
−0.062
(0.240)
−0.334 *
(0.192)
S i g m a _ e 0.030 ***
(0.003)
0.027 ***
(0.002)
0.030 ***
(0.003)
0.030 ***
(0.003)
L o g l i k e h o o d 57.82763.75754.71153.974
Hausman test
p Value
0.0000.0000.0000.000
R20.6790.6710.6740.656
Sample size285285285285
Note: “*”, “**”, and “ ***” mean significance at the 10%, 5%, and 1% levels, respectively. Standard errors are in parentheses.
Disclaimer/Publisher’s Note: The statements, opinions and data contained in all publications are solely those of the individual author(s) and contributor(s) and not of MDPI and/or the editor(s). MDPI and/or the editor(s) disclaim responsibility for any injury to people or property resulting from any ideas, methods, instructions or products referred to in the content.

