Abstract
In the context of population aging, the study of the impact of the pension insurance system on the savings behavior of urban residents can help reduce preventive savings, increase current consumption, and promote the healthy development of the economy. This study constructs a two-period OLG model of the pension insurance system based on the preventive saving perspective using urban panel data of 31 provinces from 2002 to 2021 and conducts empirical analysis through the systematic generalized method of moments. The results show that the pension insurance participation rate was positively correlated with the savings rate, while the pension replacement rate was negatively correlated with the savings rate, and this effect varied significantly across income levels and different levels of aging. Increased participation in high-income areas promoted savings, while increased pension replacement rates in low-income areas reduced savings. The positive correlation between participation rates and savings rates was more pronounced in regions with higher levels of aging, while the opposite was true in regions with lower levels of aging. In addition, the negative correlation between pension replacement ratios and savings rates was particularly pronounced in high-aging regions.
1. Introduction
Since the 1990s, China’s savings rate has continued to rise and has remained at a high level for a long time. An excessively high savings rate may result in a lack of consumer demand, which, in turn, affects the smoothness of the economy’s internal cycle and has a dampening effect on economic growth. Many studies have analyzed the reasons for China’s high savings rate from different perspectives. For example, China’s social security system is not yet perfect, and many people tend to save to cope with future risks and uncertainties, thus increasing precautionary savings [1]. Longer life expectancy means longer survival after retirement, so more savings are needed during the working period to cope with the decline in income after retirement, which leads to an increase in the savings rate of the population [2]. In order to ensure their children’s social status, fathers increase their investment in human capital and bequests to their children, which increases the household savings rate [3]. In addition, factors such as the traditional Chinese culture’s emphasis on thrift and savings also contribute to high savings rates [4,5]. In view of this, reducing residents’ savings, stimulating consumption potential, and increasing consumption willingness and ability have become priorities of the central government’s macro-control efforts. In the process of promoting consumption, the pension insurance system has been highly anticipated. By establishing an income-linked pension system, the economic risks faced by the elderly in old age will be reduced, and precautionary savings will be minimized [6].
However, as the population ages, the problems of the pension system become more pronounced [7]. The interactions among the aging problem, the pension insurance system, and the savings rate are increasingly complex [8,9]. According to the 2022 China Statistical Yearbook, by the end of 2021, China’s elderly population aged 65 and above had reached 200 million, accounting for 14.2% of the total population. Faced with the intensifying trend of population aging, the National Development and Reform Commission and 21 other ministries jointly issued the “14th Five-Year Plan for Public Services” in early 2022, which explicitly stated that the coverage rate of basic old-age insurance is expected to reach 95% by 2025. Adjustments are also being made to pension insurance contribution rates and benefit levels. What is the impact of the pension insurance system on the high savings rate of the population? It has been the focus of academic research.
Some scholars believe that the improvement of the pension insurance system promotes residents’ saving behavior. This is because the development of pension insurance improves residents’ awareness of old-age risks, which increases their precautionary savings [10]. Chamon et al. (2013) used a buffer savings model for quantitative estimation, and the calculations showed that the increase in income uncertainty and pension reform led to a significant increase in the savings rate of young and old households, respectively [11]. The American economist Feldstein (1974), on the other hand, argued that the effect of the pension system on savings depends on the combination of the “asset substitution effect” and the “retirement-inducing effect” [12]. Kim and Klump (2010) used a simple life-cycle model to conclude that the benefits of a public pension system should replace the equivalent private retirement accumulation, but the offsetting effect was much lower than expected from pure life-cycle theory [13]
Other scholars have put forward a different viewpoint. Empirical results from Li and Zhang (2013) and Creedy et al. (2015) showed that pension insurance could substitute for private savings in the absence of loan constraints and uncertainty factors, and that pension insurance was negatively correlated with the savings rate [14,15]. Meguire (2003) and Lachowska and Myck (2018) conducted empirical studies using time-series data and came to the same conclusion [16,17]. Feng et al. (2011) explicitly estimated the effect of pension wealth on household savings using exogenous policy-induced changes in pension wealth and found that pension wealth had a significant offsetting effect on household savings [18].
Other scholars have argued that the effect of the pension system on saving behavior varies from situation to situation. Attanasio and Brugiavini (2003), using a double-difference methodology, found that the substitutability between the Italian pension system and the savings rate was particularly high for workers between the ages of 35 and 45 [19]. Bottazzi et al. (2006) argued that workers adjusted their expectations to the direction of pension reforms and that there was a substantial offset between private wealth (savings) and pension wealth, especially for those workers who had a better understanding of their pension wealth [20]. Attanasio and Rohwedder (2003), through the analysis of time-series and cross-sectional data, identified behavioral responses. In the U.K., income-linked pension plans negatively affected private savings with relatively high elasticity of substitution, while fixed-rate plans had no significant effect [21]. In addition, the effect of pension systems on saving varies significantly across countries, between urban and rural areas, and across education levels. For example, an increase in expected pension benefits tended to discourage household savings in China, but the opposite was true in India [22]. In the same country, different social pension policies implemented in urban and rural areas affected the investment decisions of urban and rural households, leading to urban–rural differences in savings [23]. Education level is also an important factor influencing residents’ savings. Alessie et al. (2013) found that for residents with higher education levels, the pension insurance system had a negative correlation with the savings rate, but for residents with relatively low education levels, the effect of the pension insurance system on savings rates was almost negligible [24].
The present study draws on a wealth of lessons learned and logical frameworks based on the existing literature. However, the current research area focuses mainly on empirical studies of the impact of pension insurance systems on individual saving behavior, while the in-depth construction of theoretical models is lacking. Most of the existing theoretical models are based on a relatively strict assumption that all individuals will tend to spend a certain percentage of their wage income on pension insurance contributions. This assumption deviates from the actual situation and may make the research findings deviate from the real situation. In addition, there is a lack of research in the existing literature on the heterogeneity of regions with different levels of economic development and aging when exploring the impact of the pension insurance system on the savings rate of residents.
To address the above research gaps, this study adopts urban panel data from 31 provinces in China between 2002 and 2021 and constructs an extended overlapping generations model (OLG model) from the perspective of precautionary savings, separately for the groups that participate and do not participate in old-age insurance, in order to analyze the specific impact of the old-age insurance system on the savings behavior of urban residents, and applies the systematic generalized method of moments estimation to conduct empirical tests. In addition, this study further explores the variability of the impact of the pension insurance system on the savings rate of urban residents in regions with different levels of economic development and aging. This study aims to provide policymakers with more precise and refined policy recommendations and to open up new perspectives and theoretical support for future academic research.
The contribution of this paper is mainly reflected in the following three aspects: First, in terms of theoretical model construction, this paper constructs an extended two-period intergenerational overlapping model based on the actual differences in whether individuals participate in pension insurance or not, and empirically verifies it using panel data. Secondly, in the setting of theoretical assumptions, this paper divides residents into two groups, those who participate in pension insurance and those who do not, in which individuals who participate in pension insurance will pay premiums according to a certain percentage, and this setting is closer to the reality. Finally, in terms of heterogeneity analysis, this paper thoroughly investigates the differences in the impact of the pension insurance system on urban residents’ savings rate in regions with different levels of economic development and aging, which provides new insights into the understanding of the regional effects of the pension insurance system.
The rest of the paper is organized as follows. Section 2 is the theoretical analysis and research hypotheses, in which a theoretical model is constructed and based on which an in-depth theoretical analysis is carried out, and then the corresponding research hypotheses are formulated. Section 3 outlines the research design, including variable selection, model setting, data sources, and statistical characteristics. Section 4 is the analysis of empirical results, which tests the validity of the theoretical analysis and research hypotheses proposed in Section 2 through empirical methods. Section 5 is the heterogeneity analysis, including two parts of regional heterogeneity analysis based on income level and regional heterogeneity analysis based on aging degree. Section 6 contains the discussion and conclusions.
2. Theoretical Analysis and Research Hypothesis
Based on the life-cycle theory, this paper constructs the two-period overlapping generations OLG model of the extension under the pension insurance system and the two-period OLG model of the unenrolled pension insurance actors, respectively, to analyze the mechanism of the pension insurance system’s influence on the urban residents’ saving rate in the context of the aging population in the individual’s life-cycle decision-making. In the period of , it is assumed that the total urban population is , the proportion of labor force population is , the proportion of elderly population is , the number of labor force population is , and the number of elderly population is . Assuming that the coverage rate of old-age insurance is , the number of labor force participating in old-age insurance is , and the number of labor force not participating in old-age insurance is .
2.1. Two-Period OLG Model Construction for Extension Under the Pension System
2.1.1. Model Assumptions
- (1)
- It is assumed that a person’s life is divided into two periods, youth and old age. In youth, production is undertaken, and labor income is used for consumption, the purchase of pension insurance, and savings. In old age, only consumption (negative savings) is practiced, and the perpetrator leaves no inheritance to future generations and has zero savings at the end of life.
- (2)
- Assume that the consumer utility function is:
2.1.2. Behavioral Analysis of Urban Residents Participating in Pension Insurance
At present, the pension insurance system implements a combination of social integration and the individual account model; the actor’s pension insurance pension income in old age consists of two parts: the social integration and the accumulation of individual account. The actor’s pension insurance premiums paid during the working period in accordance with the state-specified contribution ratio of his own salary, which is credited to the individual account, and the pension insurance premiums paid by the employer in accordance with the state-specified percentage of the actor’s (unit employee’s) salary are credited to the social coordination account, based on which this paper adds such a constraint to the OLG model.
The first period works at a young age, earns a wage, and then consumes, buys insurance, and saves. Insurance is purchased, and savings are made for future retirement needs. Wages are distributed as follows:
In this case, represents the actor’s salary at the moment of ; represents the proportion of the actor’s own pension insurance premiums to his salary, which is credited to his personal account at . represents the actor’s consumption at a young age, and represents the savings at a young age, which form the capital fund at an old age.
In the second period, the elderly provide capital funds and receive interest on the one hand and receive pension insurance funds and consume on the other. Assuming that the rate of return on savings and the rate of return on the pension insurance individual and pooled account funds are , the composition of the sources of funds for consumption in old age is:
where is the ratio of the income from the basic pension in the integrated account to wages. From Equations (2) and (3), we obtain the following Equation (4):
2.1.3. Consumer Utility Maximization Analysis
Based on the fact that the actor maximizes his utility under the budget constraint, he makes the optimal planning of current consumption and future consumption and then calculates the optimal savings of the actor when he is young.
First establish a system of utility function equations under budget constraints as shown in (5).
Then, by constructing a Lagrangian function, the optimal current consumption and future consumption planning of the actors enrolled in pension insurance in period t is calculated, which, in turn, leads to the optimal amount of savings at a young age.
2.2. Construction of Two-Period OLG Model for Urban Residents Without Pension Insurance
2.2.1. Model Assumptions
- (1)
- It is assumed that the life of an urban resident who is not insured for old age is divided into two periods: youth and old age. In youth, they are engaged in production, and their labor income is used for consumption and savings. In old age, there is only consumption (negative savings), and the actor does not leave an inheritance to his descendants, so that savings are zero at the end of his life.
- (2)
- The risk aversion coefficient for urban residents without pension insurance remains , and the expected discount rate for consumption in old age remains .
- (3)
- Assume that the utility function of urban residents without pension insurance is:
In particular, and represent the consumption of an uninsured urban resident at the time of when he is young and old, respectively. U’ represents consumer utility, which is a function of and , and the consumer makes a decision-making arrangement between current and future consumption to maximize utility.
2.2.2. Behavioral Analysis of Urban Residents
The first period is to labor when young and receive labor income, then consume and save, and save to meet the needs of old age later. Since there is no relationship between labor income and whether or not one participates in the urban workers’ pension insurance, assuming that it remains , the distribution of labor income is as follows:
In particular, represents the consumption of an uninsured urban resident in his youth at the time of , and represents the savings in his youth, which form the capital fund for his old age.
In the second period, the elderly provide capital funds, earn interest, and then age comfortably, consume daily, and eventually die. Assuming that the rate of return on savings remains , the expression for the source of consumption in old age is:
From Equations (10) and (11), we obtain the following Equation (12):
2.2.3. Utility Maximization Analysis
Based on the fact that actors without pension insurance maximize their utility under the budget constraint, they make optimal plans for immediate consumption, future consumption, and thus calculate the optimal savings of the actors when they are young.
First, we established a system of equations for the utility function under the budget constraint, as shown in (13).
Then, a Lagrangian function was constructed to find the optimal current consumption and future consumption planning for the actor who is not insured for old age in period . The optimal amount of savings at a young age was then calculated.
2.3. Analysis of the Impact of the Pension System on the Savings Rate Under the Two-Period OLG Model
In period , the optimal amount of savings at a young age for each pension-insured actor multiplied by the number of participants plus the optimal amount of savings at a young age for each non-participating actor multiplied by the number of non-participants yields the total level of savings of urban residents as:
The savings per urban resident is obtained by dividing the total savings of urban residents by the total number of urban residents. The savings rate for urban residents is obtained by dividing the per capita savings of urban residents by the total income (wage income):
The impact of the pension system on the savings rate of the population is analyzed below.
When first examining the effect of the pension insurance participation rate on the savings rate of the population, there is:
According to the analysis of Formula (19), we can draw an important conclusion: there is a certain correlation between the pension insurance participation rate and the urban residents’ saving rate.
In the case of a sound pension insurance system, residents have confidence in the future pension they can receive, believe that these pensions can meet their financial needs in old age, and thus are more willing to purchase insurance to transfer risk; the demand for preventive savings will be reduced accordingly, which will lead to a decline in the savings rate of residents. At this time, the coefficient of pension risk avoidance through the purchase of insurance is greater than the coefficient of pension risk avoidance through savings, . On the other hand, if the pension insurance system is not yet sound, residents may have doubts about the adequacy of their pensions or may be dissatisfied with the current level of benefits and may increase their savings in order to ensure that their quality of life does not deteriorate in old age. This case may lead to , . Based on this analysis, we put forward the following research hypothesis:
Hypothesis 0 (H0):
In the environment of a sound pension insurance system, there is a negative correlation between the pension insurance participation rate and the urban residents’ savings rate. That is, the increase of pension insurance participation rate will lead to the decrease of urban residents’ saving rate.
Hypothesis 1 (H1):
In an environment where the pension insurance system is not sound, there is a positive correlation between the pension insurance participation rate and the urban residents’ saving rate. That is, an increase in the pension insurance participation rate may lead to an increase in the urban residents’ savings rate.
We further analyzed the impact of pension insurance pension replacement rates on the savings rate of the population.
According to , it can be seen that the pension fund of the personal account of the pension insurance will inhibit the behavioral savings, and there is a crowding-out effect on savings.
According to , it can be seen that the pension fund of the pension insurance pooling account inhibits actors from saving and has a crowding out effect on saving.
In the future pension system, the pension income of the retired elderly will depend mainly on the accumulation of funds in the individual account and the integrated account. The more funds there are in the individual and integrated accounts, the higher the pension income the retired elderly will naturally receive, which will, in turn, increase the pension replacement rate (i.e., the ratio of pension income to the same year’s wage level). As the pension replacement rate increases, residents feel more financially secure about their future retirement, thus reducing the amount of precautionary savings they make to cope with old age, leading to a lower overall savings rate. Based on the above analysis, we propose the following research hypothesis:
Hypothesis 2 (H2):
There is a negative correlation between the pension replacement rate of old-age insurance and the savings rate of urban residents. In other words, an increase in the pension replacement rate will lead to a decrease in the savings rate of urban residents.
3. Indicator Selection and Model Construction
3.1. Indicator Selection
- (1)
- Explained Variables
Urban residents’ savings rate (URSR) was chosen as the explained variable, which is expressed as the ratio of urban residents’ per capita annual savings to urban residents’ per capita annual disposable income. The annual per capita savings of urban residents was obtained by subtracting the annual per capita disposable income of urban residents from the annual per capita consumption expenditure of urban residents.
- (2)
- Core explanatory variables
The pension insurance participation rate (NPS) is the proportion of the population enrolled in pension insurance as a percentage of the working population and represents the coverage of the pension insurance system. The higher the NPS participation rate is, the more people have realized the risk of old age pension and participate in the pension insurance system. If the pension insurance system is relatively well developed, the ability to receive a higher pension income after retirement will reduce current savings, and conversely, it will increase savings, leading to a higher savings rate [25].
The pension replacement rate (RRI) is the ratio between the level of pension received by a worker when he or she retires and the level of his or her pre-retirement wage income, which represents the degree of maturity of the pension insurance system and is the core variable of the pension insurance system. In the pension insurance system, the pension replacement rate is directly related to the level of pension fund income of residents when they are old. The higher the pension replacement ratio is, the more pension people receive when they retire at old age, so they will reduce their current savings when they are young, and the savings rate of residents decreases [26,27]. The exact value of the pension replacement rate is usually obtained by dividing the average pension of new retirees in a given year by the average wage income of active workers in the same year.
- (3)
- Control variables
First, demographic indicators, including the proportion of elderly people (OADR) and the proportion of children (CPP), were considered. The elderly population ratio is the number of elderly people aged 65 and above as a proportion of the total urban population. If the elderly population share is high, on the one hand, the labor force decreases, income decreases, and savings decrease [28]; on the other hand, based on the consideration of one’s own future old age problem, one will reduce immediate consumption and increase savings, and the saving effect of aging depends on the combination of these two effects. The child and adolescent population share is expressed as the share of the number of children aged 14 years and under in the total urban population. If the proportion of children in the population is relatively high, on the one hand, the immediate consumption of children will increase, leading to a decrease in household savings [29]. On the other hand, the increase in future expenses for raising and educating children will lead to an increase in current savings. The impact of the proportion of children on the savings rate depends on the combined effect of these two aspects.
Second, the income indicator is expressed in terms of the real growth rate of disposable income per urban resident (RUDIGR). A higher real growth rate of disposable income per capita means that the income level of residents is increasing, and their disposable income is increasing accordingly. As income increases, residents may tend to increase their consumption expenditure to meet more consumption needs rather than saving more of their income, which leads to a decrease in the savings rate. Taking the previous year as the base period, the nominal growth rate of urban per capita disposable income was obtained by subtracting the difference between the current urban per capita disposable income and the previous period’s urban per capita disposable income and dividing by the previous period’s urban per capita disposable income. Considering the influence of inflation, this paper also took the previous period as the base period and calculated the real growth rate of per capita disposable income of urban residents from 2002 to 2021 according to the consumer price index of residents in each province.
Third, the interest rate indicator is expressed as the real interest rate (RIR) on one-year deposits. The real interest rate is directly related to the return on residents’ savings and residents’ expectations and influences residents’ savings behavior. The real interest rate is based on the previous year and was obtained by converting the 1-year benchmark deposit rate published by the Central Bank and the inflation rate, which is measured by the consumer price index of each province.
3.2. Model Construction
According to the previous theoretical analysis and research hypotheses, the benchmark static panel econometric model and dynamic panel econometric model were constructed to explore the impact of the pension insurance system on urban residents’ savings rate in the context of population aging, and the benchmark static panel econometric model is as follows:
where denotes the province, taking the value of 1–31; denotes the year, taking the value of 2002–2021; , , , , , , and represent the urban residents’ saving rate, the pension insurance participation rate, the pension substitution rate, the proportion of the elderly population, the proportion of the child population, the real growth rate of the per capita disposable income of urban residents, and the real interest rate in the t-th year of the i-th province, respectively; is a constant term; and are the dummy variables for the regional individual effect and time effect, respectively; and is the random perturbation term. In this paper, the static panel econometric model was first estimated using a mixture of ordinary least-squares (OLS) and fixed-effects (FE) methods. However, the static panel model ignores the dynamic impact of the explanatory variables of urban residents’ saving rate in the previous period on the current period, and the statistical results will produce a large bias. In order to overcome this shortcoming, a dynamic panel econometric model was established, which is expressed as:
where is the savings rate in the lagged period, which is used to capture the inertia of savings. The introduction of the lagged term of the explanatory variable as an explanatory variable may cause the explanatory variable to be correlated with the random disturbance term, thus creating an endogeneity problem. In this scenario, regression analysis using the traditional fixed-effects or random-effects models can result in biased estimates of the explanatory variables. Therefore, this paper employed the System Generalized Method of Moments (SYS-GMM) to estimate the dynamic panel data model.
3.3. Data Sources and Statistical Characteristics
Since the 1980s, China’s urban workers’ pension insurance system has gone through a transition from self-financing by enterprises to social coordination and has gradually established a pension insurance system that combines social coordination with individual accounts. The reform began in 1984, and the basic system framework was established in 1997, when the State Council’s Decision on the Establishment of a Unified Basic Pension Insurance System for Enterprises and Employees (Guo Fa (1997) No. 26) began to be implemented. The coverage of urban employee pension insurance has been further expanded nationwide, and the distribution rate for retired personnel has gradually increased. But with the restructuring of China’s economy and reforms of state-owned enterprises, the pension insurance system has been beset with new problems. In December 2001, the Ministry of Labor and Social Security issued the ‘Notice on Issues Concerning the Improvement of the Urban Employee Basic Pension Insurance Policy’. In order to avoid the influence of the transition period of pension insurance system reform on the research results, and considering the availability and completeness of the data, the sample of this paper was selected as the data of 31 inter-provincial urban panels in China from 2002–2021. The raw data of per capita disposable income, per capita consumption expenditure, and consumer price index of inter-provincial urban residents come from the ‘China Statistical Yearbook‘ and the Wind database from 2003 to 2022; the raw data of total population of inter-provincial urban residents, the number of people aged 65 and above, and the number of people aged 14 and below come from the ‘China Population and Employment Statistical Yearbook‘ and the Wind database; the raw data of pension insurance raw data on pension insurance expenditure, the number of retired persons participating in pension insurance, and the average wage of active employees are from the ‘China Labor Statistics Yearbook‘ and the Wind database; the benchmark interest rate for 1-year deposits announced by the Central Bank is from the ‘China Financial Statistics Yearbook‘ and the Wind database. The real growth rate of real disposable income per capita of urban residents and the real interest rate were converted, and adjusted using the base year method to eliminate the influence of price factors. The data statistical characteristics of the variables are shown in Table 1. The marked difference between the minimum and maximum values of the urban residents’ savings rate (URSR) is largely attributable to the far-reaching impact of population aging. In the face of increasingly severe pension risks, residents have increased their savings in order to cope with the uncertainties of their future lives, with a view of maintaining a certain quality of life after retirement, a behavior that has led to a year-on-year increase in the savings rate. As for the significant gap between the minimum and maximum values of the replacement rate for pensions (RRI), it is due to the rapid growth in the number of retirees as a result of the aging of the population, while the proportion of the working-age population continues to decline. This demographic change means that while the number of pension contributors is decreasing, the number of pensioners is increasing, putting unprecedented pressure on the country’s pension system, thus leading to a continuous decrease in the pension replacement rate. As for the large difference between the minimum and maximum values of the NPS (pension insurance participation rate), it reflects the process of continuous improvement and adjustment of the pension insurance system. For example, the policy of lowering the corporate contribution rate implemented in 2018 has not only reduced the burden on enterprises but also contributed to the year-on-year increase in the pension insurance participation rate. The minimum value here represents the participation situation in the early years of the system, while the maximum value demonstrates the participation situation after a series of reforms.

Table 1.
Basic statistical characteristics of the variables.
4. Analysis of Empirical Results
4.1. Empirical Analysis of Benchmark Models
In order to test the impact of the pension insurance system on urban residents’ savings rate, the urban residents’ savings rate (URSR) was used as the explained variable; the pension insurance participation rate (NPS) and the pension replacement rate (RRI) as the core explanatory variables; and the proportion of the elderly population (OADR), the proportion of the pediatric population (CPP), the real growth rate of urban residents’ per capita income (RUDIGR), and real interest rate (RIR) as the control variables for the empirical study, and the static empirical results are shown in models (1)–(2) in Table 2. Considering the dynamic impact of the explanatory variables of urban residents’ saving rate in the previous period on the current period, the first-order lag term of urban residents’ saving rate was added into the model for empirical testing, and the dynamic empirical results are shown in models (3)–(5) in Table 2.
Table 2.
Benchmark model regression results.
The empirical method used in model (1) is the ordinary least-squares (OLS) method, which leads to a large bias in the estimation results because this method does not take into account the individual differences in the provinces. Model (2) uses a fixed-effects model, which takes into account the heterogeneity among the 31 provinces, and the estimation results were better than the ordinary least-squares method. The static model results are presented because the static model provides a benchmark for comparison, which helps us understand how the model performs without accounting for time dynamics. This comparison can reveal the importance of time dynamics to model estimation. Models (3)–(5) consider the dynamic impact of the prior period’s residents’ saving rate on the current period and introduce the lagged term of the explained variables as the explanatory variables, which may have caused the explanatory variables to be correlated with the random perturbation term, thus causing endogeneity problems. In order to overcome the above problem, the lagged per capita savings rate was used as an endogenous variable, while other related variables were treated as exogenous variables, and the dynamic system Generalized Method of Moments (GMM) estimation was employed using model (5).
The regression results of the dynamic ordinary least-squares model (3) and the dynamic fixed-effects model (4) are listed for comparison. From the test results of model (5), the p-value of AR (1) was 0.000, which indicates that there was a first-order serial correlation in the disturbance term, and the p-value of AR (2) was 0.539, which indicates that there was no serial correlation of the residual term of the second-order or higher. The p-value of Hansen’s test was 0.585, which indicates that there was no over-identification, i.e., the instrumental variables were valid. Comparing the estimation results of the three models of dynamics, L.URSR passed the test at the 1% significance level, but there were significant differences in the estimates. The OLS estimate was the highest at 0.866. The fixed-effects model FE had the lowest estimate at 0.699. The systematic GMM had an estimate of 0.778, which was situated in between the OLS and FE estimates. This is consistent with the phenomenon that for dynamic panel models, OLS estimates and EF estimates were upwardly and downwardly biased from their true values, respectively. In this paper, we analyzed the estimation results of model (5) dynamic system GMM. The specific results were analyzed as follows:
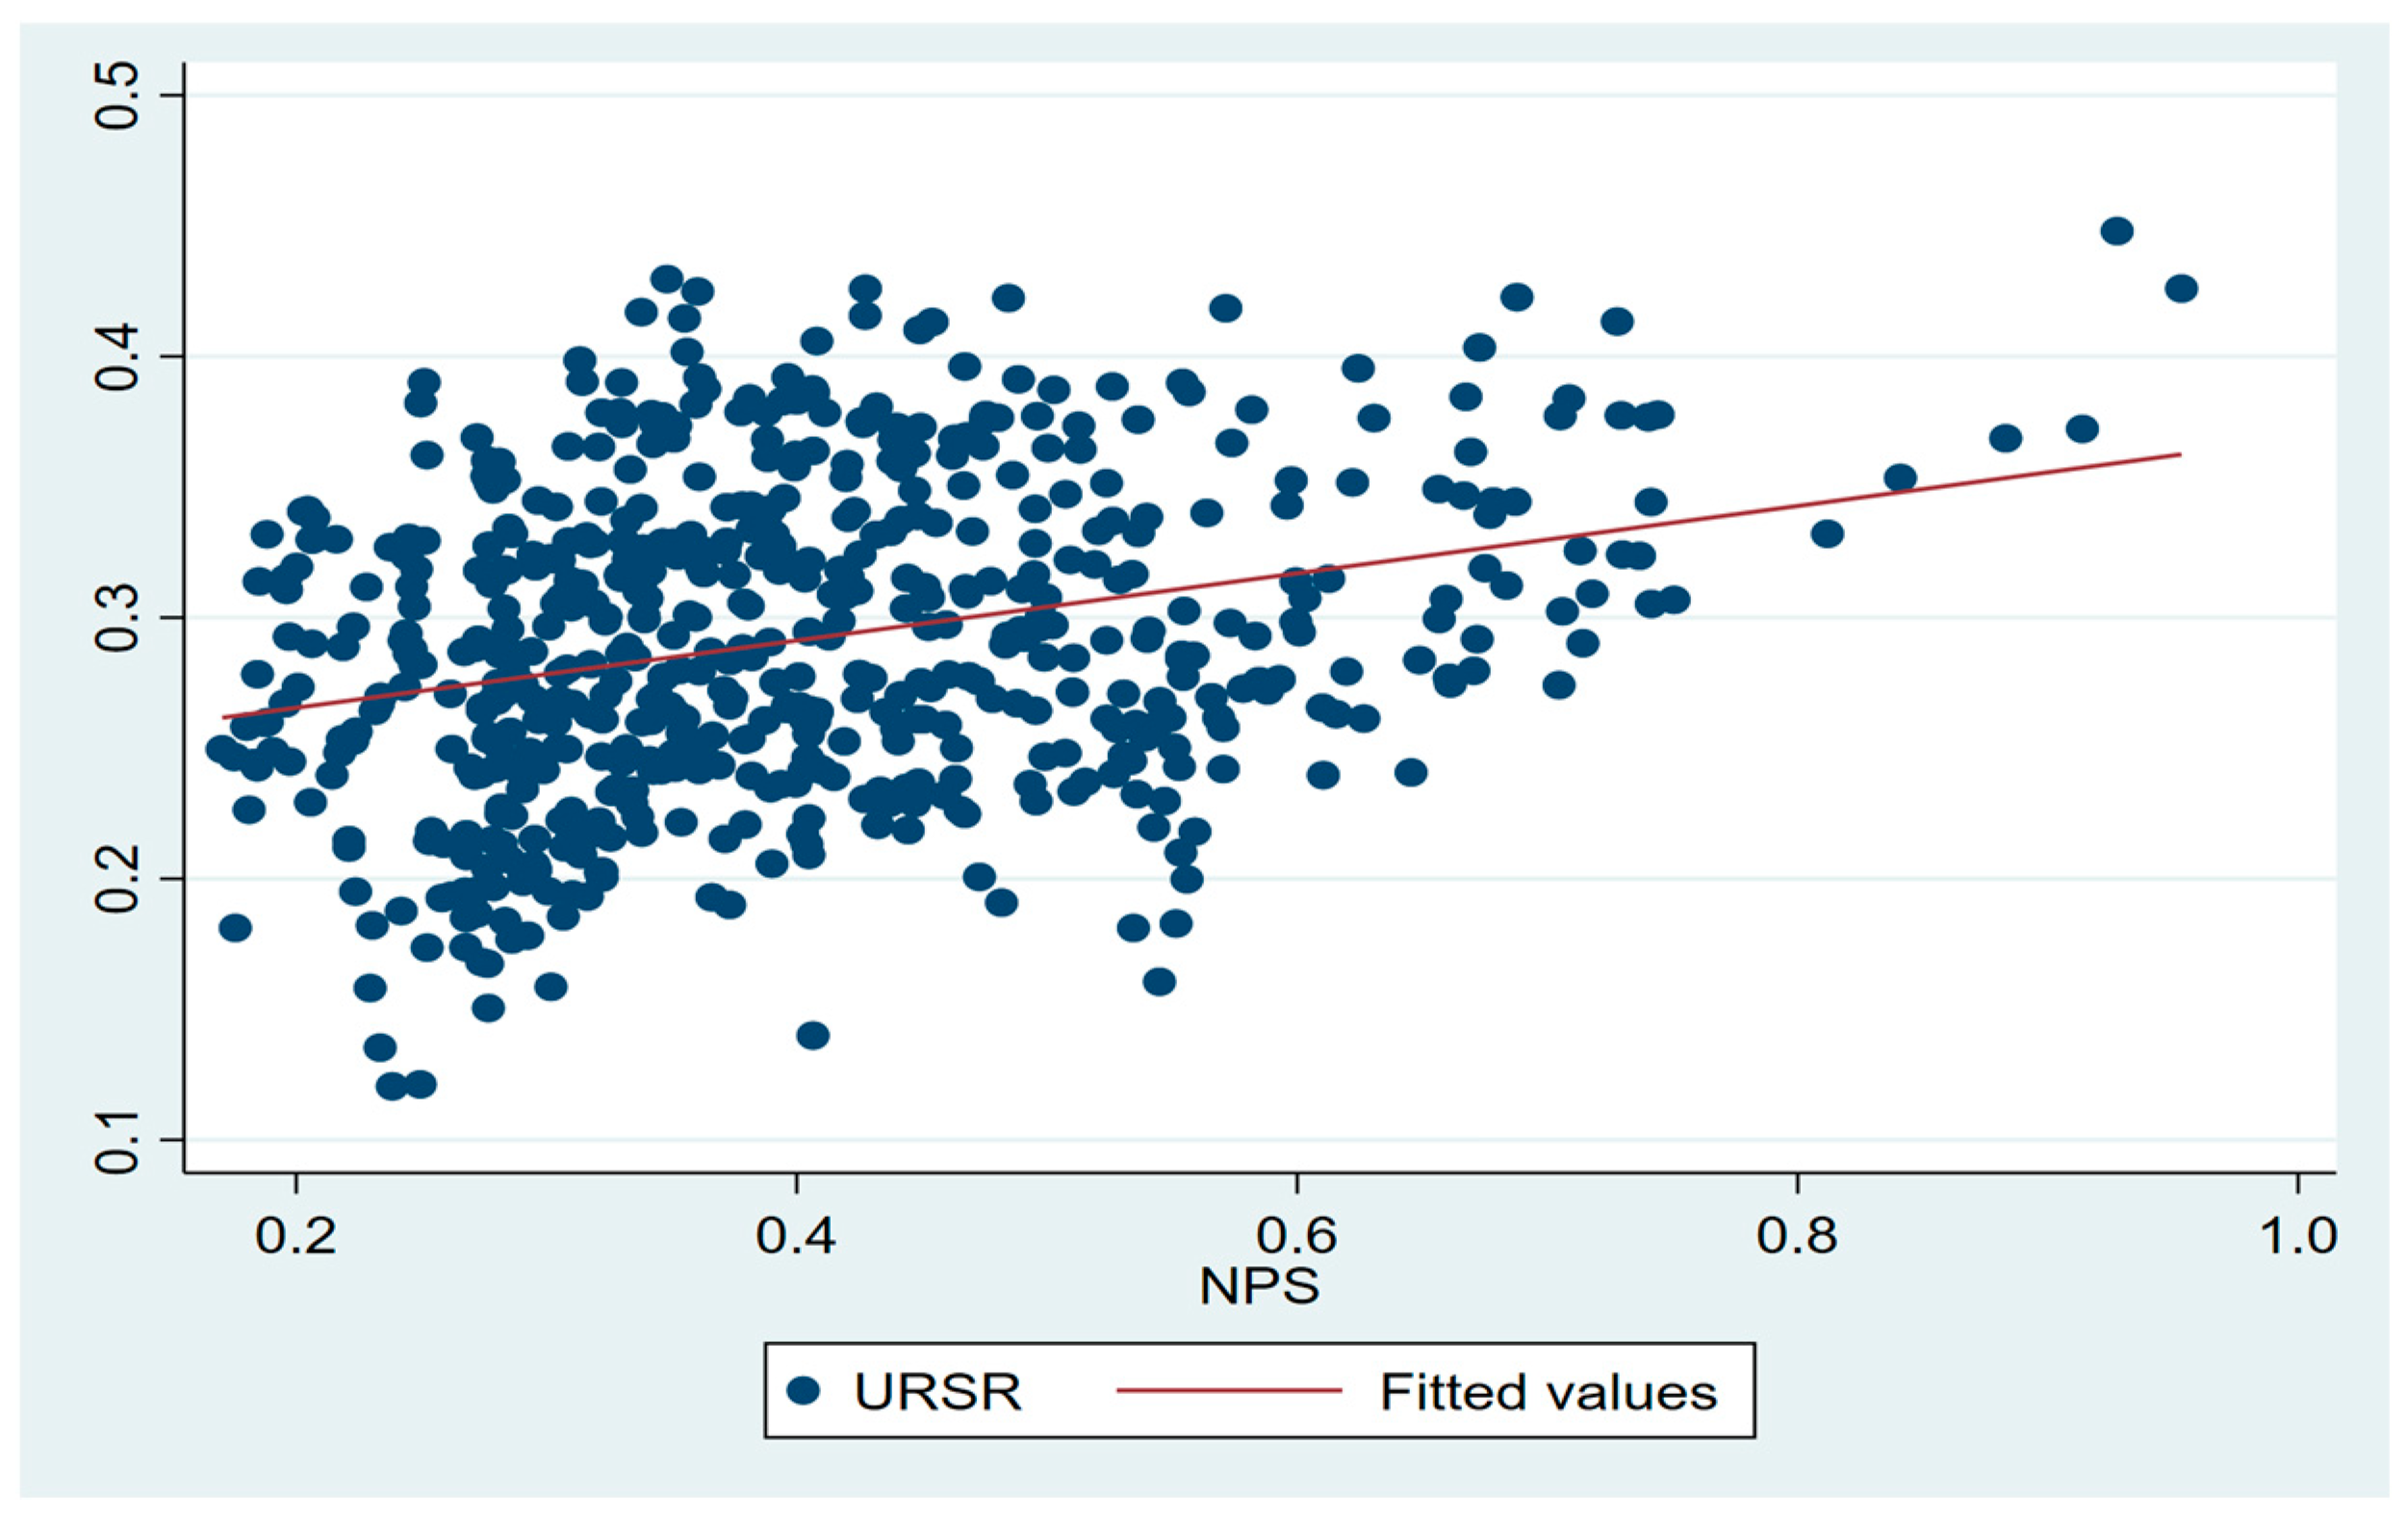
First, the core explanatory variable, the pension insurance participation rate, showed a positive correlation with the household savings rate, as illustrated in Figure 1. For every percentage point increase in the pension insurance participation rate, the current residents’ savings rate increased by 0.064 percentage points, and was significant at the 1% significance level, which verifies alternative hypothesis to hypothesis 1. With the increase in the participation rate, more and more people are beginning to realize the risk of old age in old age. However, since the pension insurance system is not yet mature, the pension income that residents can rely on after retirement is relatively limited. Under such circumstances, residents are more inclined to increase their savings during employment to ensure that they can maintain their original standard of living after retirement. In addition, as the elderly age, various diseases will continue to emerge and medical costs will continue to escalate, and residents will have to increase their precautionary savings in order to cope with possible health risks in the future, so as to ensure that they can receive timely and adequate financial support when their medical needs arise. Therefore, the positive correlation between the pension insurance participation rate and the savings rate of residents is actually a special phenomenon in the development of China’s pension insurance system.
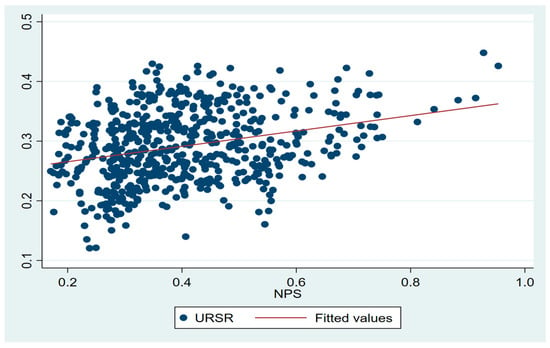
Figure 1.
Relationship between pension insurance participation rate and household savings rate.
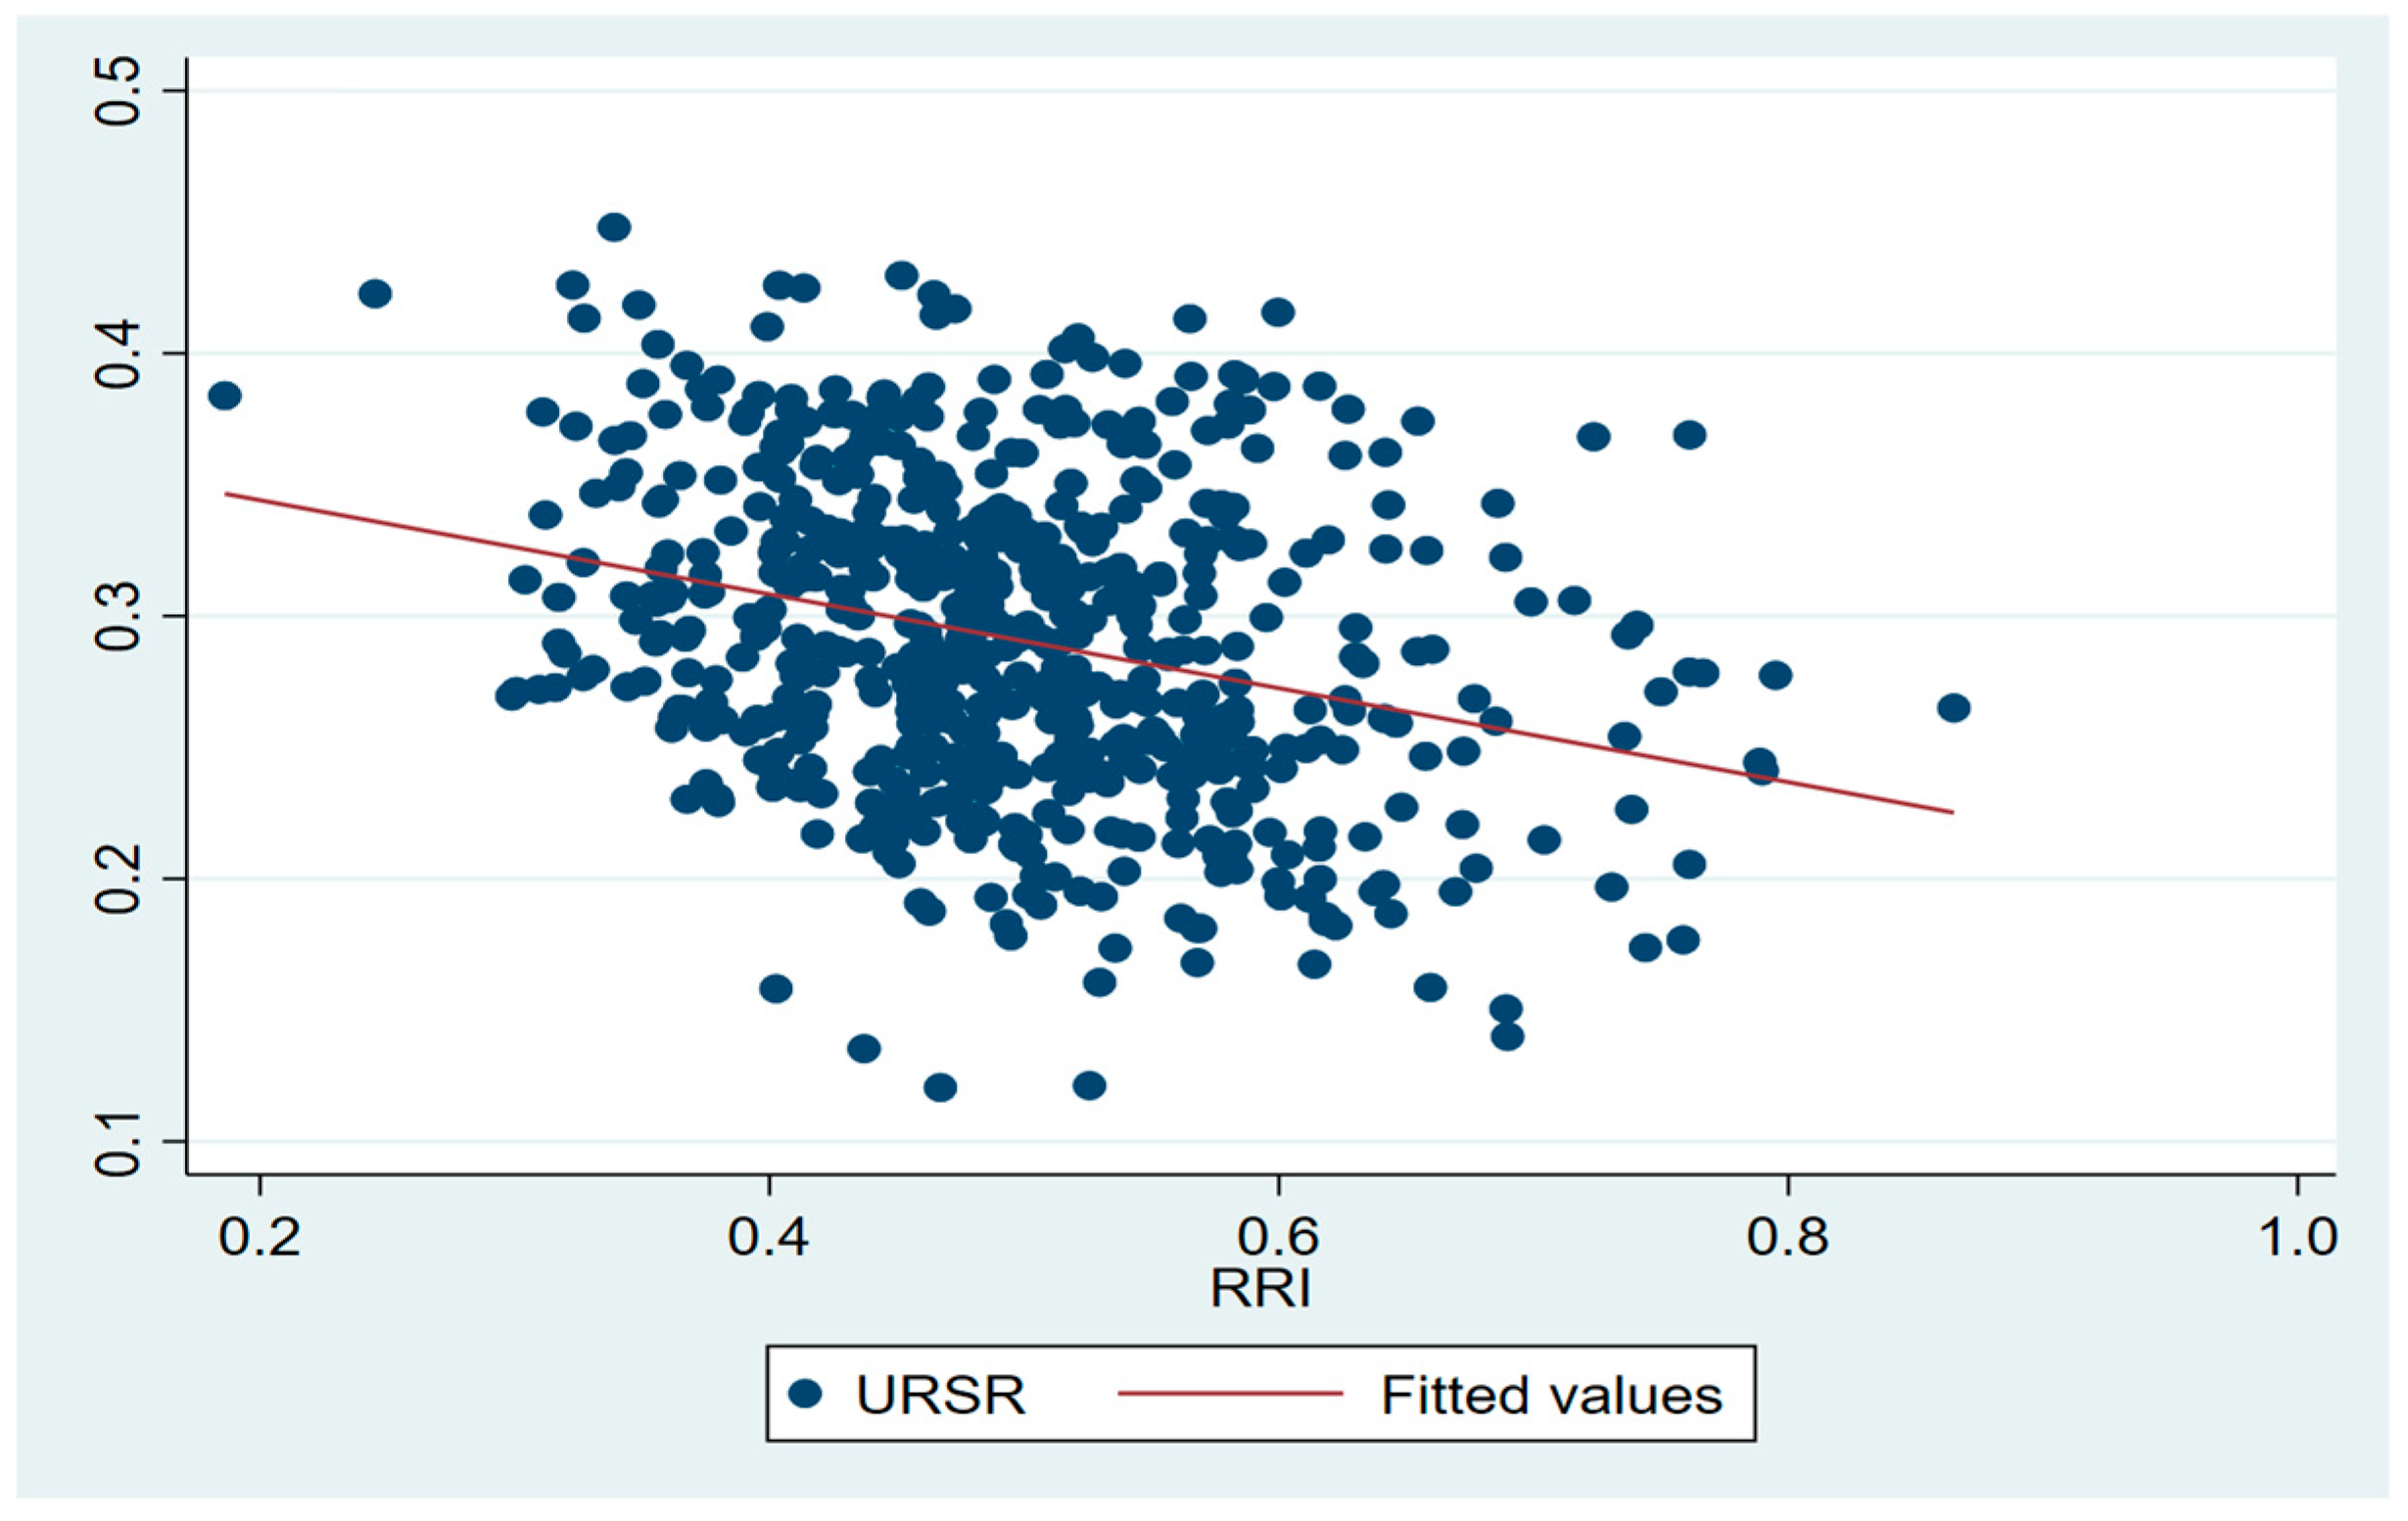
Second, the core explanatory variable, the pension replacement rate, was negatively correlated with the residential savings rate, as illustrated in Figure 2. For every percentage point increase in the pension replacement rate, the current residents’ savings rate was correspondingly reduced by 0.049 percentage points and was significant at the 1% significance level. It shows that the higher the pension replacement rate was, the more the residents’ savings were suppressed, which is consistent with the conclusions deduced from the previous theoretical model and verifies hypothesis 2. This is because the higher the pension replacement rate is, the closer the pension received by the employees after retirement is to their pre-retirement salary, the easier it is to get protection for their post-retirement life, and therefore the preventive savings can be lowered when they are young, and thus the pension replacement rate is negatively correlated with the residents’ savings rate.
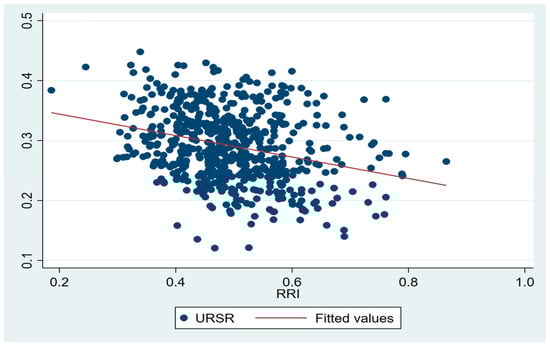
Figure 2.
Relationship between the pension replacement rate and household savings rate.
Third, the lagged one-period effect of the control variable residents’ savings rate on residents’ savings rate in the current period was positive and passed the test at the 1% significance level, indicating that residents’ choice of savings in the current period would be affected by the previous period’s saving behavioral habits. The proportion of the elderly population showed a negative correlation with the savings rate of the residents, which indicates that the negative effect of income of the aging population was higher than the positive precautionary effect and thus shows a negative relationship. The proportion of children in the population was positively correlated with the savings rate of residents, which was because as the proportion of children in the total urban population increased, future expenses for raising and education increased; thus, residents would increase savings, and the savings rate would increase. There was a significant negative correlation between the real growth rate of per capita disposable income and the savings rate of residents in urban areas. The reason for this phenomenon is that when the real growth rate of per capita disposable income of residents reached a high level, their consumption capacity increased significantly, thus making residents capable of purchasing more goods and services, which undoubtedly stimulated the growth of consumption demand. With such income growth, residents generally tended to allocate more of their increased income to consumer spending in order to improve their quality of life. Although the amount of savings has risen in tandem with income growth, its growth has failed to keep pace with the growth rate of disposable income, and the result has been a relative decline in the savings rate. In other words, as incomes rose, residents preferred to enjoy the moment rather than put all their money in savings, which led to a lower savings rate. There was a negative correlation between the real interest rate and the savings rate of the population. The reason for this is that a rise in real interest rates had a double effect. On the one hand, residents may have been inclined to save more as the return on their savings increased; on the other hand, the rise in investment costs may have dampened economic growth, leading to a slowdown in employment and income growth, which, in turn, weakened residents’ ability to save. The results of the empirical study showed that the real interest rate was negatively correlated with the savings rate of residents, which suggests that raising the real interest rate had a more significant dampening effect on the economy, possibly outweighing its positive impact on savings incentives.
4.2. Robustness Tests
In order to test the robustness of the model results, this paper adopted three methods for testing. First, the endogeneity test was adopted. In order to avoid the endogeneity problem caused by the possible reverse causality between the core explanatory variables and the explained variables, these two indicators in the current period were replaced by the lagged one-period pension insurance participation rate (L.NPS) and the pension replacement rate (L.RRI), respectively, and the dynamic system GMM regression was conducted. Second, we shortened the length of time. With the aging of the population becoming more and more serious, the problems of the current basic pension insurance system for enterprise employees were highlighted, and the State Council issued the ‘Decision on Improving the Basic Pension Insurance System for Enterprise Employees‘ in 2005. Considering the impact of sample duration selection on the regression results, the sample time window was shortened from 2002–2021 to 2005–2021, and the dynamic system GMM regression was re-conducted. Third, the shrinking-tail test was conducted. In order to avoid the influence of outliers on the regression results, all variables were subjected to bilateral tailing at the 1% quantile. Specifically, the observations falling outside (1%, 99%) in the sample values of variables such as urban residents’ saving rate in the current period and lagged period, pension insurance participation rate, pension replacement rate, proportion of elderly population, proportion of child population, real growth rate of urban residents’ per capita income, and real interest rate, respectively, were replaced with the values on the 1% and 99% deciles to re-regress. The results of the robustness tests of the three methods are shown in Table 3. The positive and negative signs of the coefficients, the degree of impact, and the significance of the empirical results did not change significantly, so the estimation results in this paper are highly robust, and the conclusions are not coincidental and have a high degree of confidence.
Table 3.
Robustness test.
5. Heterogeneity Analysis
5.1. Analysis of Regional Heterogeneity Based on Income Level
In order to deeply explore the regional differences in the impact of the pension insurance system on residents’ saving rate in different income provinces, this study was based on the data of per capita disposable income of urban residents in 31 provinces in China during the period of 2002–2021. This study divided the provinces into two sub-samples, namely the low-income group and the higher-income group, with the average residents’ saving rate, the average residents’ participation rate, and the average pension substitution rate in the low-income group as 28.34%, 36.05%, and 53.63%, while the average resident savings rate, average resident participation rate, and average pension replacement rate of the higher income group were 29.83%, 42.39%, and 46.66%, respectively. Using the panel dynamic system generalized moment estimation (GMM) model, a regression analysis was conducted to analyze how these two major income groups’ residents’ saving rates were affected by the pension insurance system, and the regression results are shown in Table 4.
Table 4.
Sub-sample regression results based on income level.
The empirical results in Table 4 show that the impact of the pension insurance system on residents’ saving behavior was significantly different in regions with different income levels. In high-income areas, there was a positive correlation between the participation rate of pension insurance and the saving rate of residents: specifically, for every 1 percentage point increase in the participation rate of pension insurance, the saving rate of residents in high-income areas will increase by 0.073 percentage points. In contrast, this relationship was not significant in low-income areas. A possible explanation for this phenomenon is that in high-income areas, even if residents are already enrolled in old-age insurance, they may still engage in precautionary savings in pursuit of a high-quality old-age life, resulting in a positive correlation between enrollment rate and savings rate. Given the stronger savings capacity of residents in the eastern region, policymakers can pay more attention to guiding residents to make a reasonable allocation between savings and consumption in order to achieve a balance between economic development and residents’ well-being. In the low-income level areas, due to the generally low average income level of residents, even if they participate in the insurance, residents can pay relatively limited premiums, so the impact on the savings rate is not significant. To address this situation, the government should take effective measures to promote the economic development of these areas, raise the income level of residents, enhance their ability to contribute, and thus increase the participation rate of pension insurance.
In addition, the study also found that in low-income areas, there was a significant negative correlation between the pension replacement rate and the residents’ savings rate: for every 1 percentage point increase in the pension replacement rate, the current residents’ savings rate will fall by 0.038 percentage points. In contrast, this relationship was not significant in areas with high income levels. This may have been due to the weaker saving ability of low-income groups. When expecting an increase in future pension income, residents tended to reduce their current savings, which led to a lower savings rate. Therefore, the government should increase its support for the pension insurance system, especially by increasing the replacement rate of pensions, in order to reduce the financial pressure on residents and encourage them to save less and consume more. In regions with high income levels, even if the pension replacement rate is increased, residents may still increase their precautionary savings due to the pursuit of a high-quality old age life, resulting in a non-significant negative correlation between the pension replacement rate and residents’ savings rate. Therefore, in the eastern region, the government should emphasize the synergistic effects of the pension system and other social security measures in order to meet the diverse pension needs of the population and promote harmonious economic and social development.
5.2. Heterogeneity Analysis Based on Degree of Aging
In order to examine the heterogeneity of the impact of the pension insurance system on residents’ saving rate in provinces with different aging degrees, this study classified the provinces into three groups of low, medium, and high aging degree based on the data of the elderly population dependency ratio of 31 provinces in 2021. The following are the main data performance of each group: In the group of provinces with a low degree of aging, the average saving rate of residents reached 29.36%, the average participation rate was 34.54%, and the pension replacement rate was 53.24%. In the group of provinces with a medium degree of aging, the average savings rate of residents was 29.85%, the average participation rate was 35.13%, and the pension replacement rate was 53.47%. In the group of provinces with a high degree of aging, on the other hand, the average savings rate of the population decreased to 28.05%, the participation rate increased significantly to 48.72%, and the pension replacement rate decreased to 43.05%. Next, we conducted a regression analysis on these sub-samples classified based on the aging degree to explore the differences in the impact of the pension insurance system on the residents’ saving rate among the provinces with different aging degrees, and the regression results of the panel dynamic system GMM model are show in Table 5.
Table 5.
Sub-sample regression results segmented by regional aging levels.
The empirical results in Table 5 show that in regions with different degrees of aging, the impact of the pension insurance system on the saving behavior of residents exhibited significant differences. There was a positive correlation between the pension insurance participation rate and the residents’ saving rate in regions with medium and high aging levels, and this relationship was more significant in regions with medium aging levels. Specifically, for every percentage point increase in the pension insurance participation rate, the current savings rate of residents in regions with medium and high levels of aging increased by 0.122 and 0.117 percentage points, respectively, with regions with medium levels of aging 0.005 percentage points higher than regions with high levels of aging. In contrast, in regions with a low degree of aging, there was a negative correlation between the participation rate and the savings rate; for every percentage point increase in the pension insurance participation rate, the current savings rate in regions with a low degree of aging decreased by 0.036 percentage points. The reason for this difference is that in medium- and high-aging areas, the government usually invests more resources in the construction of the welfare system and the promotion of social security, which enhances the residents’ awareness of risk prevention. As a result, even if residents participate in old-age insurance, they will still make precautionary savings in pursuit of a high-quality old-age life, leading to a positive correlation between the participation rate and the savings rate. Especially in areas with a medium degree of aging, the positive correlation was more pronounced due to the larger labor force population and higher income level, and the residents’ preventive saving ability was stronger. On the contrary, in regions with a low degree of aging, due to a smaller elderly population and a larger young population, the degree of reliance on pension insurance was lower, and the savings substitution effect of pension insurance was significant, making the participation rate negatively correlated with the savings rate.
In addition, there was a significant negative correlation between the pension substitution rate and the savings rate of residents in regions with high aging, with a corresponding decrease of 0.088 percentage points in the current residents’ savings rate for every percentage point increase in the pension insurance replacement rate. While it was not obvious in other regions, in high-aging regions, residents were highly dependent on pensions due to the high proportion of elderly population and the low proportion of working population. When the pension replacement rate increased, residents’ expected increase in income after retirement may have reduced their personal savings, thus leading to a lower savings rate. Therefore, in high-aging regions, policies should focus on increasing the pension replacement rate and reducing residents’ dependence on personal savings through diversified social security measures. In regions with a low degree of aging, on the other hand, where the impact of the pension replacement rate on the savings rate was not significant, owing to the high proportion of young people and their weak dependence on pensions, policies should focus on improving the pension insurance system, increasing residents’ trust in and reliance on pension insurance, and at the same time, inducing residents to plan their personal savings and consumption rationally through education, so as to achieve an effective link between pension insurance and personal savings.
6. Discussion and Conclusions
6.1. Discussion
With improved medical care and health awareness, people are living longer, and the elderly population is increasing. In order to cope with living needs and medical expenses in old age, people are more inclined to save to meet possible future expenses. But an excessively high savings rate may lead to insufficient consumer demand, thus inhibiting economic growth. Improving the pension insurance system, increasing the enrollment rate of pension insurance, and enhancing the level of pension benefits have become an important strategy to reduce residents’ precautionary savings, promote consumption, and drive economic growth. Based on whether the actors are insured or not, this paper constructed the two-period overlapping generations extended OLG model, respectively, to analyze the influence mechanism of the pension insurance system on urban residents’ saving rate in the context of population aging and put forward the research hypotheses. Then, by selecting provincial urban panel data, an empirical test was conducted on the impact of the pension insurance system on the urban residents’ savings rate, and it was found that the full sample pension insurance participation rate had a significant positive relationship with the savings rate of residents, which verified the alternative hypothesis to h1 of the theoretical analysis, which is consistent with the findings of García and Vila (2020) [30]. This was mainly because with the increase in the rate of pension insurance participation, residents began to realize the economic challenges they may face in the future, but because the pension insurance system was not perfect, the level of pension benefits was relatively low; even if they were insured, their future retirement was still not adequately guaranteed. In addition, with age, a variety of diseases will continue to appear and medical costs continue increasing, impacting the financial ability of the actors more inclined to use part of the income for savings in case of emergency. Therefore, the full sample of pension insurance participation rate and the savings rate of the population was positively correlated. Van (2019), using survey data from Dutch households, also found that even though they participated in pension insurance, the uncertainty of pension income also led to a significant increase in household savings [31]. In order to reduce the incentive for residents to save precautionarily, we must deepen and improve the pension insurance system to ensure its stability and sustainability. Through such reforms, we can enhance residents’ confidence in their future old age and convince them that they will be able to enjoy stable and sufficient pension support in their twilight years, so that they can organize their current consumption with greater confidence and promote balanced economic development. Another finding of the empirical study is that the full-sample pension replacement rate was negatively correlated with the residential savings rate, implying that an increase in the pension replacement rate led to a decrease in the residential savings rate, verifying Hypothesis 2 of the theoretical analysis and consistent with the findings of Blau (2016) [32]. Increasing the pension replacement rate can reduce residents’ precautionary savings, promote current consumption, and boost economic growth.
In addition, this paper further empirically demonstrates the impact of pension insurance participation rate and pension replacement rate on residents’ savings rate in regions with different income levels and different degrees of aging. The effects were significantly different in different income levels. In high-income regions, the pension insurance participation rate was positively related to the savings rate, reflecting that residents increased preventive savings due to concerns about old age and health risks. In low-income regions, due to economic constraints, the effect of pension insurance participation rate on savings rate was also not significant, but an increase in pension replacement rate would lead to a decrease in savings rate. Based on this, high-income regions should guide residents to rationally allocate savings and consumption to balance economic development and residents’ well-being. Low-income regions need to promote economic development, raise residents’ income and enhance their ability to contribute while increasing the pension replacement rate to reduce residents’ economic pressure and promote consumption. Overall, the government should optimize pension insurance policies for the characteristics of different regions in order to promote economic growth and residents’ well-being.
The impact of pension insurance on residents’ savings varied greatly in regions with different levels of aging. In regions with heavy and very heavy aging, the higher the participation rate was, the more residents tended to save, especially in regions with moderate aging. This was because residents in these areas were more concerned about future risk prevention and tended to continue saving to secure a quality old age even after participating in old-age insurance. On the contrary, in less-aging regions, the participation rate was inversely related to the savings rate. Residents here relied less on pension insurance, which may have instead reduced their savings. In addition, the pension replacement rate was negatively related to the savings rate in very heavily aging regions, implying that raising pensions reduced residents’ savings. In these regions, policies should aim to raise the pension replacement rate and reduce residents’ reliance on savings. In less-aging regions, where the pension replacement rate has little effect on savings, policies should focus more on enhancing the sophistication of the pension system and residents’ trust and guiding them to plan their savings and consumption rationally. In short, policies should be tailored to local conditions and adopt different pension insurance strategies for regions with different levels of aging in order to promote a balance between residents’ savings and consumption.
This paper is concerned with the relationship between the pension insurance system and the savings rate of urban residents in the context of China’s increasing population aging. However, the data in this context may be affected by factors such as economic policies and social systems in a particular historical period. With policy adjustments and social development, these factors may change, thus affecting the applicability of the research results. In the future, the impact of different policy adjustments on the pension insurance system and urban residents’ savings rate can be further explored based on the current research results, so as to provide useful references for policy makers. In addition, the experience of other countries in the pension insurance system can be utilized in the subsequent research to compare with the actual situation in China and explore the reform path of the pension insurance system that is applicable to China’s national conditions.
6.2. Conclusions
Against the background of increasing population aging in China, based on the preventive savings perspective, a two-period overlapping generations OLG model under the pension insurance system was constructed to analyze the impact of the pension insurance system on urban residents’ savings rate. And an empirical test was carried out using the system generalized moments dynamic panel model with urban panel data of 31 provinces from 2002 to 2021. Based on the empirical results, the following conclusions were obtained: First, the pension insurance participation rate was significantly positively related to the urban residents’ saving rate, and the pension replacement rate was significantly negatively related to the urban residents’ saving rate. Second, there were significant differences in the degree of impact in regions divided by income level. In high-income areas, the pension insurance participation rate had a significant positive correlation with the savings rate of urban residents, while it was not significant in low-income areas; the pension replacement rate had a significant negative correlation with the savings rate of urban residents in low-income areas, while it was not significant in high-income areas. Third, based on the aging degree divided into three categories of low, medium, and high regions, the degree of influence was also significantly heterogeneous. In regions with medium and high levels of aging, the pension insurance participation rate had a significant positive correlation with the savings rate of urban residents, while in regions with low levels of aging, it had a significant negative correlation; the pension replacement rate had a significant negative correlation with the savings rate of urban residents in regions with a high level of aging, while in other regions, it was not significant.
Based on the findings of the study, this paper proposes the following countermeasures:
First, the pension insurance system should be strengthened. Improving the pension insurance system will enhance public confidence and thus reduce precautionary savings. Specific measures are as follows: Firstly, expand the scope of pension insurance coverage. More groups, such as flexibly employed persons and migrant workers, should be included in the pension insurance system, so as to increase the coverage of pension insurance and reduce the precautionary savings of these groups. Secondly, comprehensively improve the popularization rate of insurance knowledge. Through a variety of channels and forms, such as community lectures, online courses, and publicity brochures, insurance concepts have been popularized, so that residents can better understand and trust the pension insurance system and be guided to reasonably plan their retirement lives and reduce unnecessary preventive savings. Thirdly, optimize the pension treatment adjustment mechanism. It is recommended to establish a pension benefit adjustment mechanism linked to factors such as the price level and wage growth to ensure that the real purchasing power of pensions does not decline, thereby reducing the savings that residents make due to concerns about future increases in the cost of living.
Second, the pension replacement rate should be increased. The pension replacement rate was significantly negatively correlated with the savings rate of residents, particularly in the western regions and areas with a higher degree of aging. Therefore, in order to reduce the savings rate, measures should be taken to appropriately increase the pension replacement rate, ensure that older persons have access to adequate pensions, and reduce their reliance on personal savings. Specific measures should be taken: Firstly, extend the working life and increase the income of pension funds. Delayed retirement has led to an increase in the labor force population, an increase in pension insurance personal account funds, an increase in post-retirement pension income, and a higher pension replacement rate. Secondly, appropriately relax investment channels. Pension funds can purchase municipal bonds, financial bonds, corporate bonds, etc., can also be entrusted to professional organizations for investment management, so as to realize the preservation and appreciation of the insurance fund and really solve people’s worries about old age, thus reducing the preventive pension savings of urban residents.
Third, the policy of regional differentiation should be strengthened. Given the significant differences in income levels and the degree of population aging in various regions of China, the impact of pension insurance participation rates and pension replacement rates on the savings behavior of the population varies. For this reason, differentiated pension insurance policies must be formulated according to local conditions. High-income regions should guide residents to rationally allocate savings and consumption, balancing economic development and residents’ well-being. Low-income regions need to promote economic development, raise residents’ incomes, and enhance their ability to contribute while increasing the pension replacement rate to reduce residents’ economic pressure and promote consumption. In regions with a medium degree of aging, we should optimize pension treatment policies and fine-tune pension levels to ensure that they match the cost of living of local residents, in order to enhance the actual protection capacity of pensions. Then, through a full range of publicity work, we should popularize the knowledge of pension insurance, enhance the residents’ awareness of and trust in the pension insurance system, and then reduce the residents’ preventive savings. And for regions with a high degree of aging, the focus should be on improving the pension replacement rate, and through increasing financial input and optimizing pension investment management, the pension replacement rate should be improved to reduce the economic pressure on residents after retirement, thus reducing preventive savings.
Author Contributions
Conceptualization, G.Z., Y.F. and D.Z.; methodology, G.Z. and Y.F.; software, D.Z.; validation, G.Z., Y.F. and D.Z.; formal analysis, G.Z. and Y.F.; investigation, G.Z. and D.Z.; resources, G.Z. and D.Z.; data curation, D.Z.; writing—original draft preparation, G.Z., Y.F. and D.Z.; writing—review and editing, G.Z. and D.Z.; visualization, G.Z., Y.F. and D.Z.; supervision, G.Z., Y.F. and D.Z.; project administration, G.Z. and D.Z.; funding acquisition, G.Z. All authors have read and agreed to the published version of the manuscript.
Funding
This research was funded by the National Social Science Fund of China, grant number 24BRK003.
Institutional Review Board Statement
Not applicable.
Informed Consent Statement
Not applicable.
Data Availability Statement
The data used in our study are from the China Statistical Yearbook, the China Population and Employment Statistical Yearbook, the China Labor Statistics Yearbook, the China Financial Statistics Yearbook, and the Wind database.
Conflicts of Interest
The authors declare no conflicts of interest.
References
- Deng, X.Y.; Tian, J.; Chen, R. Effect of social security system on consumption through income and uncertainty: Evidence from China. Sustainability 2019, 11, 1828. [Google Scholar] [CrossRef]
- Chao, C.C.; Laffargue, J.P.; Yu, E. The Chinese saving puzzle and the life-cycle hypothesis: A revaluation. China Econ. Rev. 2011, 22, 108–120. [Google Scholar] [CrossRef]
- Mason, A.; Lee, R.; Jiang, J.X. Demographic dividends, human capital, and saving. J. Econ. Ageing 2016, 7, 106–122. [Google Scholar] [CrossRef] [PubMed]
- Pan, L.S.; Pezzuti, T.; Lu, W.; Pechmann, C.C. Hyperopia and frugality: Different motivational drivers and yet similar effects on consumer spending. J. Bus. Res. 2019, 95, 347–356. [Google Scholar] [CrossRef]
- Fuchs-Schündeln, N.; Masella, P.; Paule-Paludkiewicz, H. Cultural determinants of household saving behavior. J. Money Credit. Bank. 2020, 52, 1035–1070. [Google Scholar] [CrossRef]
- Baiardi, D.; Magnani, M.; Menegatti, M. The theory of precautionary saving: An overview of recent developments. Rev. Econ. Househ. 2020, 18, 513–542. [Google Scholar] [CrossRef]
- Qu, S.; Feng, C.; Jiang, S.; Wei, J.; Xu, Y. Data-driven robust dea models for measuring operational efficiency of endowment insurance system of different provinces in China. Sustainability 2022, 14, 9954. [Google Scholar] [CrossRef]
- Yu, W.; Li, B.; Zhu, X. Income redistribution effect of raising the overall planning level of basic endowment insurance for urban employees in China. Sustainability 2021, 13, 709. [Google Scholar] [CrossRef]
- Chen, Q.; Chi, Q.; Chen, Y.; Lyulyov, O.; Pimonenko, T. Does population aging impact China’s economic growth? Int. J. Environ. Res. Public Health 2022, 19, 12171. [Google Scholar] [CrossRef]
- Cagan, P. The Effect of Pension Plans on Aggregate Saving: Evidence from a Sample Survey; Nation Bureau of Economic Research: New York, NY, USA, 1965; pp. 9–26. [Google Scholar]
- Chamon, M.; Liu, K.; Prasad, E. Income uncertainty and household savings in China. J. Dev. Econ. 2013, 105, 164–177. [Google Scholar] [CrossRef]
- Feldstein, M. Social security, induced retirement and aggregate capital accumulation. J. Political Econ. 1974, 82, 905–926. [Google Scholar] [CrossRef]
- Kim, S.; Klump, R. The effects of public pensions on private wealth: Evidence on the German savings puzzle. Appl. Econ. 2010, 42, 1917–1926. [Google Scholar] [CrossRef]
- Li, H.; Zhang, J. Effects of longevity and dependency rates on saving and growth: Evidence from a panel of cross countries. J. Dev. Econ. 2013, 84, 138–154. [Google Scholar] [CrossRef]
- Creedy, J.; Gemmell, N.; Scobie, G. Pensions, savings, and housing: A life-cycle framework with policy simulations. Econ. Model. 2015, 46, 346–357. [Google Scholar] [CrossRef]
- Maguire, P. Social security and personal saving: 1971 and beyond. Empir. Econ. 2003, 28, 115–139. [Google Scholar] [CrossRef]
- Lachowska, M.; Myck, M. The effect of public pension wealth on saving and expenditure. Am. Econ. J. Econ. Policy 2018, 10, 284–308. [Google Scholar] [CrossRef]
- Feng, J.; He, L.; Sato, H. Public pension and household saving: Evidence from urban China. J. Comp. Econ. 2011, 39, 470–485. [Google Scholar] [CrossRef]
- Attanasio, O.P.; Brugiavini, A. Social security and households’ saving. Q. J. Econ. 2003, 118, 1075–1119. [Google Scholar] [CrossRef]
- Bottazzi, R.; Jappelli, T.; Padula, M. Retirement expectations, pension reforms, and their impact on private wealth accumulation. J. Public Econ. 2006, 90, 2187–2212. [Google Scholar] [CrossRef]
- Attanasio, O.P.; Rohwedder, S. Pension wealth and household saving: Evidence from pension reforms in the United Kingdom. Am. Econ. Rev. 2003, 93, 1499–1521. [Google Scholar] [CrossRef]
- Ang, J. Household saving behaviour in an extended life cycle model: A Comparative study of China and India. J. Dev. Stud. 2009, 45, 1344–1359. [Google Scholar] [CrossRef]
- Li, R.; Wu, J.; Zhang, S.; Zhang, S.; Wu, Y. Social endowment insurance and inequality of the household portfolio choice: The moderating effect of financial literacy. SAGE Open 2023, 13, 21582440231152399. [Google Scholar] [CrossRef]
- Alessia, R.; Angelini, V.; Santen, P. Pension wealth and household savings in Europe: Evidence from SHARELIFE. Eur. Econ. Rev. 2013, 63, 308–328. [Google Scholar] [CrossRef]
- Ertuğrul, H.M.; Gebeşoğlu, P.F. The effect of private pension scheme on savings: A case study for Turkey. Borsa Istanb. Rev. 2020, 20, 172–177. [Google Scholar] [CrossRef]
- Yang, T.T. The effect of workplace pensions on household saving: Evidence from a natural experiment in Taiwan. J. Risk Insur. 2020, 87, 173–194. [Google Scholar] [CrossRef]
- Madeira, C. The impact of the Chilean pension withdrawals during the Covid pandemic on the future savings rate. J. Int. Money Financ. 2022, 126, 102650. [Google Scholar] [CrossRef]
- Pascual-Saez, M.; Cantarero-Prieto, D.; Manso, J.R.P. Does population ageing affect savings in Europe? J. Policy Model. 2020, 42, 291–306. [Google Scholar] [CrossRef]
- Lugauer, S.; Ni, J.; Yin, Z. Chinese household saving and dependent children: Theory and evidence. China Econ. Rev. 2019, 57, 101091. [Google Scholar] [CrossRef]
- García, J.M.; Vila, J. Financial literacy is not enough: The role of nudging toward adequate long-term saving behavior. J. Bus. Res. 2020, 112, 472–477. [Google Scholar] [CrossRef]
- Van, S.P. Uncertain pension income and household saving. Rev. Income Wealth 2019, 65, 908–929. [Google Scholar] [CrossRef]
- Blau, D.M. Pensions, household saving, and welfare: A dynamic analysis of crowed out. Quant. Econ. 2016, 7, 193–224. [Google Scholar] [CrossRef]
Disclaimer/Publisher’s Note: The statements, opinions and data contained in all publications are solely those of the individual author(s) and contributor(s) and not of MDPI and/or the editor(s). MDPI and/or the editor(s) disclaim responsibility for any injury to people or property resulting from any ideas, methods, instructions or products referred to in the content. |
© 2024 by the authors. Licensee MDPI, Basel, Switzerland. This article is an open access article distributed under the terms and conditions of the Creative Commons Attribution (CC BY) license (https://creativecommons.org/licenses/by/4.0/).