
The Spatiotemporal Dynamics of Temperature Variability Across Mts. Qinling: A Comparative Study from 1971 to 2022


Abstract
1. Introduction
2. Materials and Methods
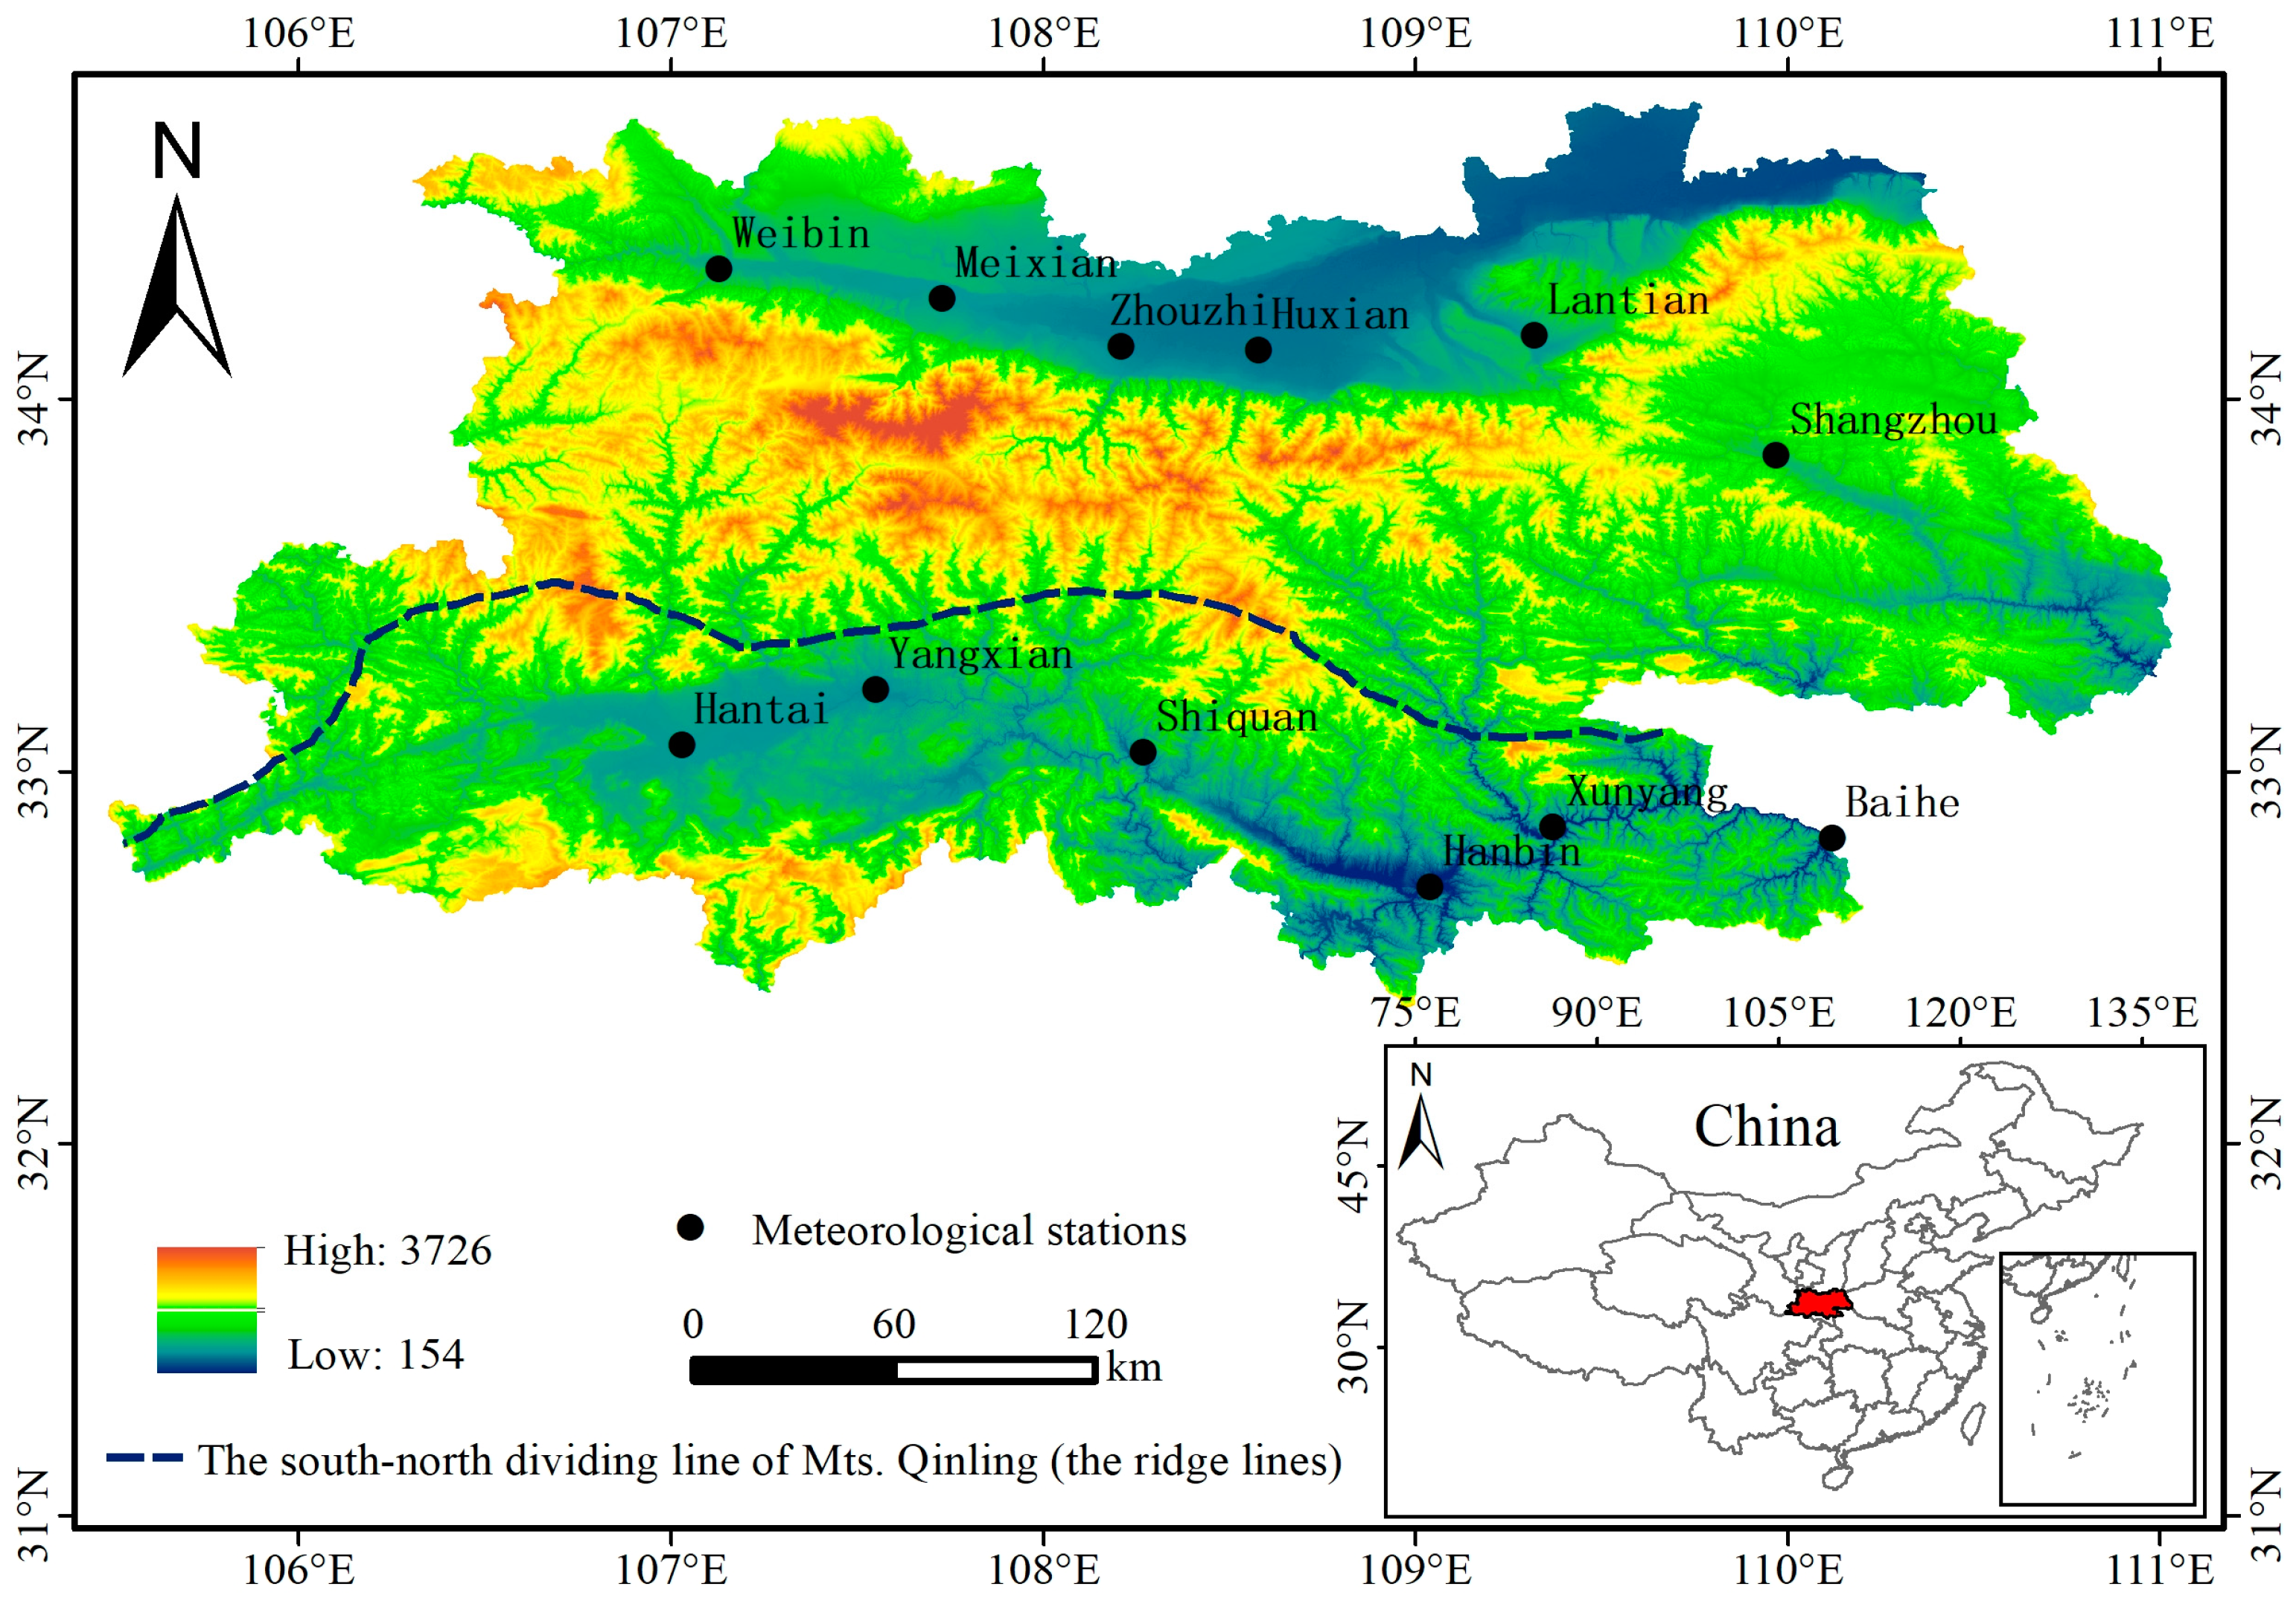
2.1. Study Area
2.2. Data Sources and Processing
2.3. Research Methods
2.3.1. Trend Analysis Method
2.3.2. Mann–Kendall Mutation Test
2.3.3. Morlet Wavelet Analysis
3. Results and Analysis
3.1. Temperature Change Based on Daily Mean Values
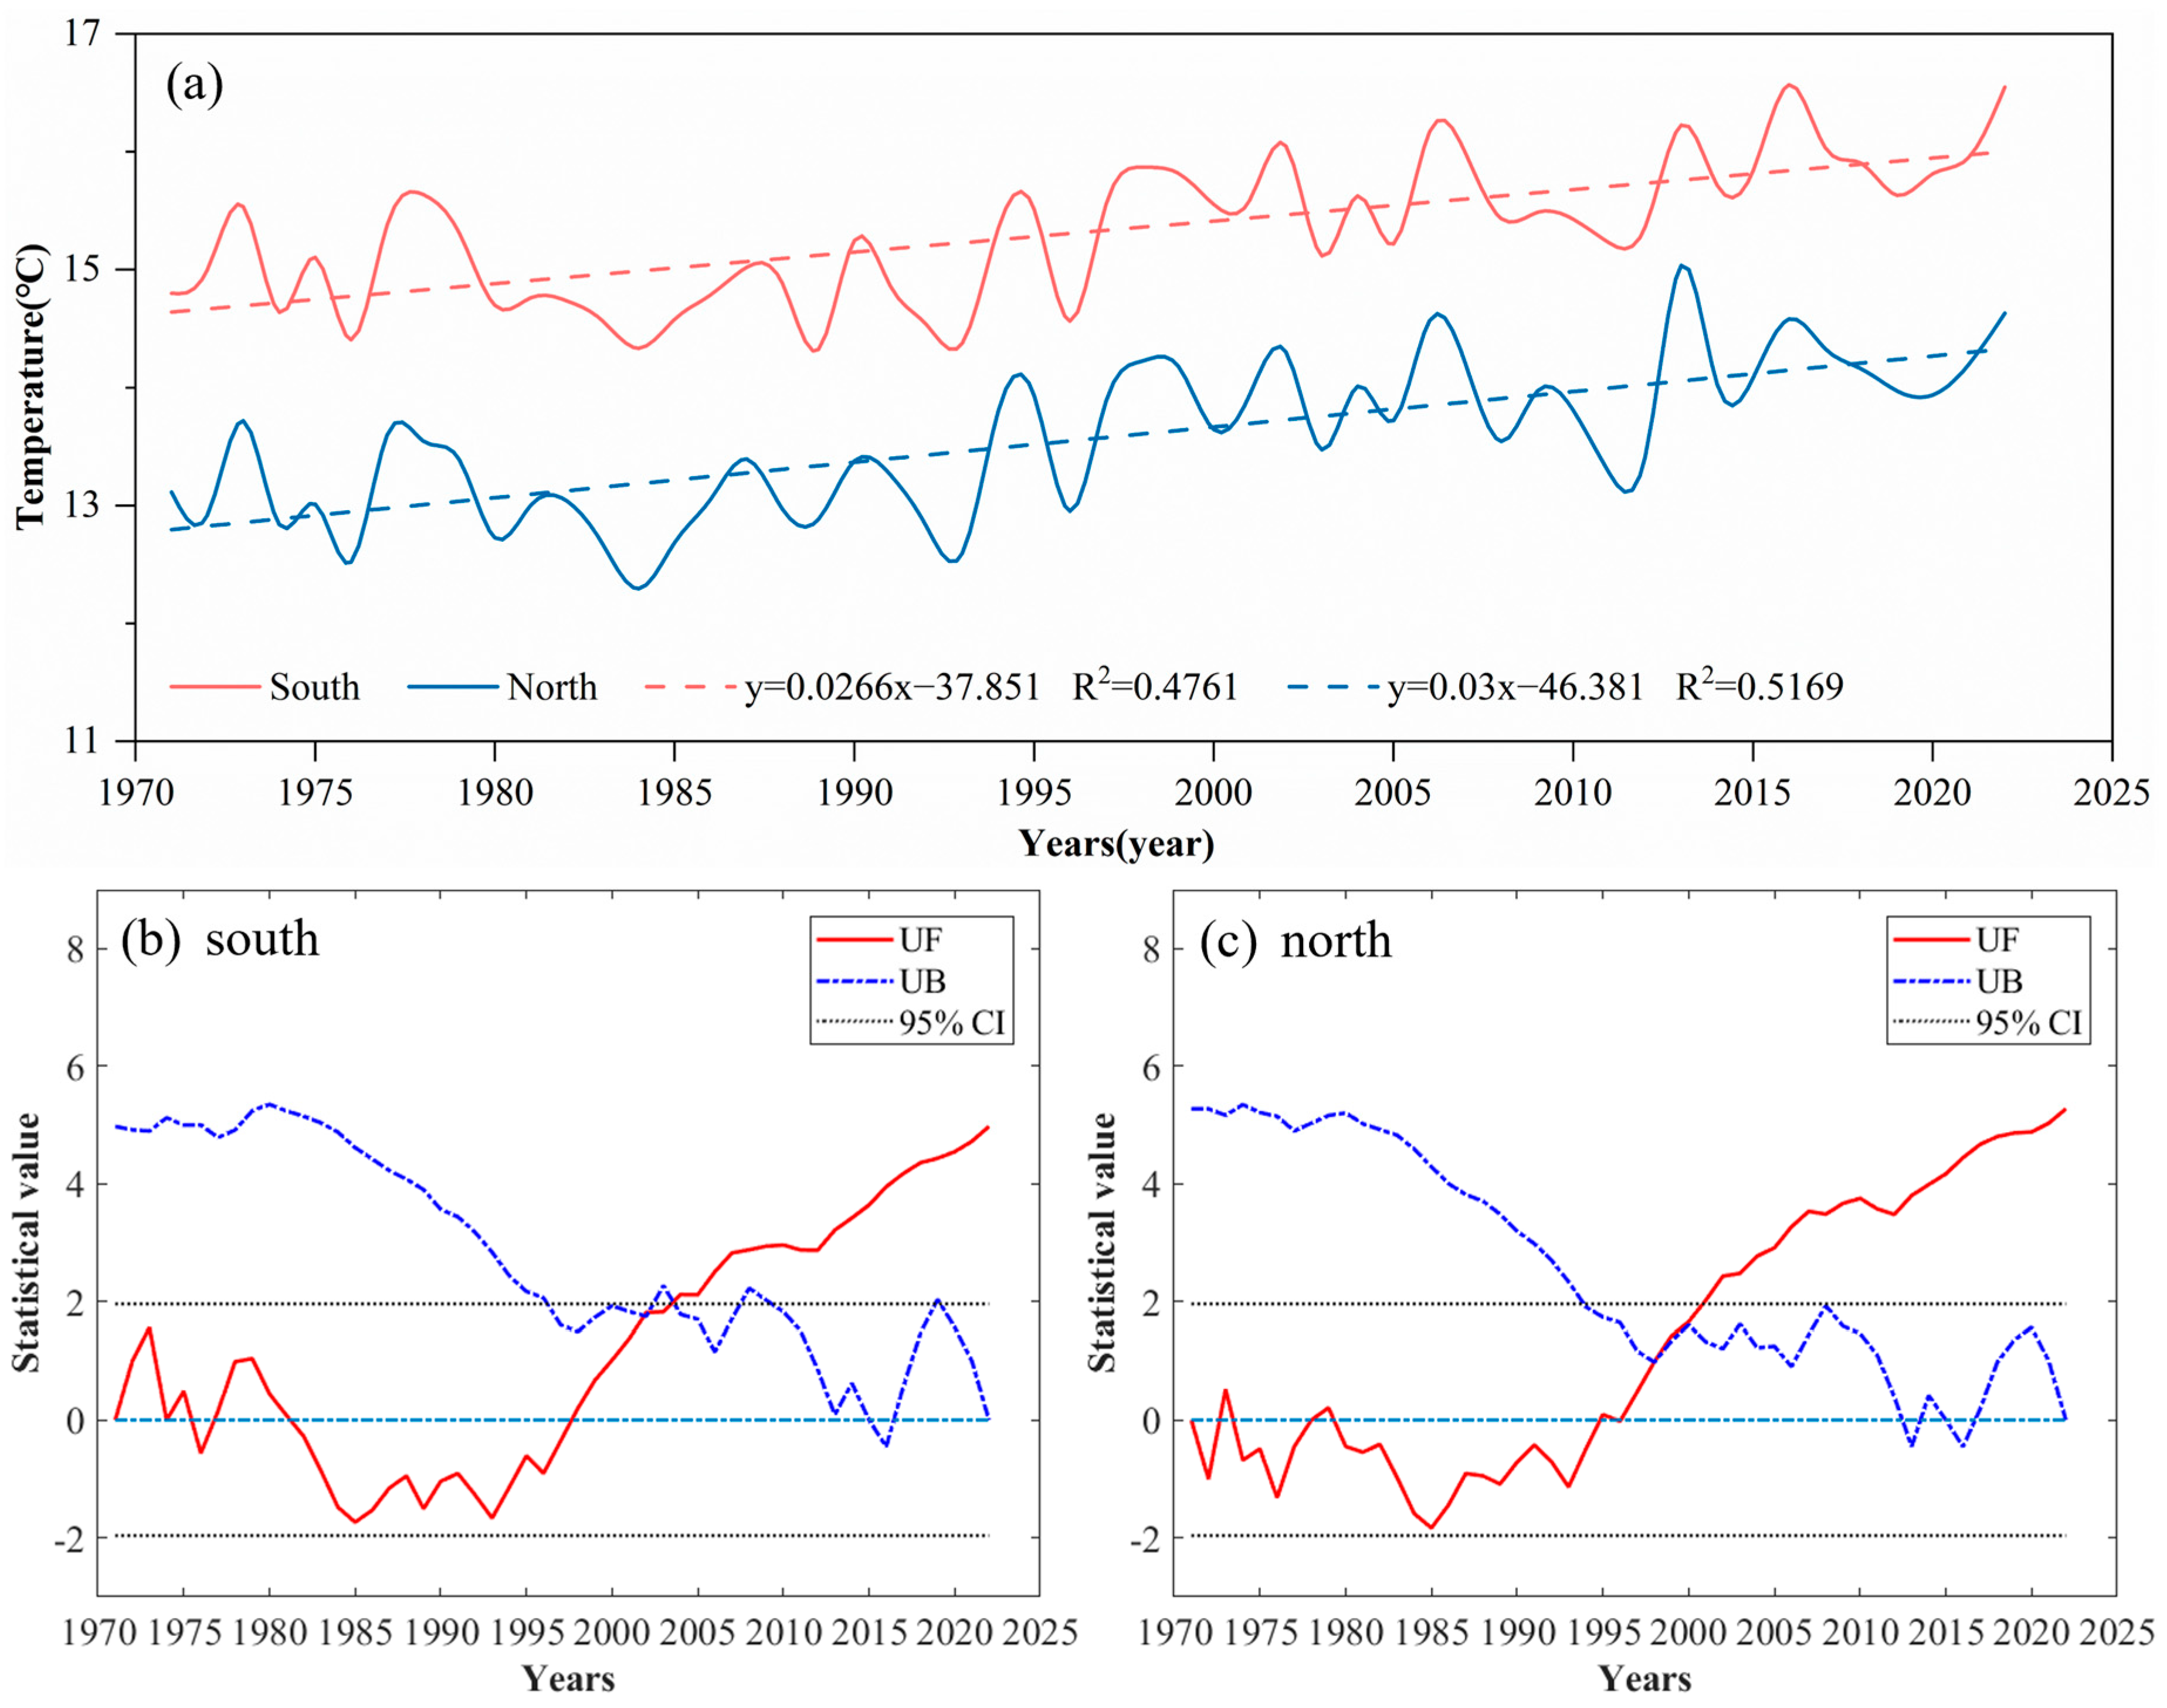
3.1.1. Inter-Annual Temperature Changes
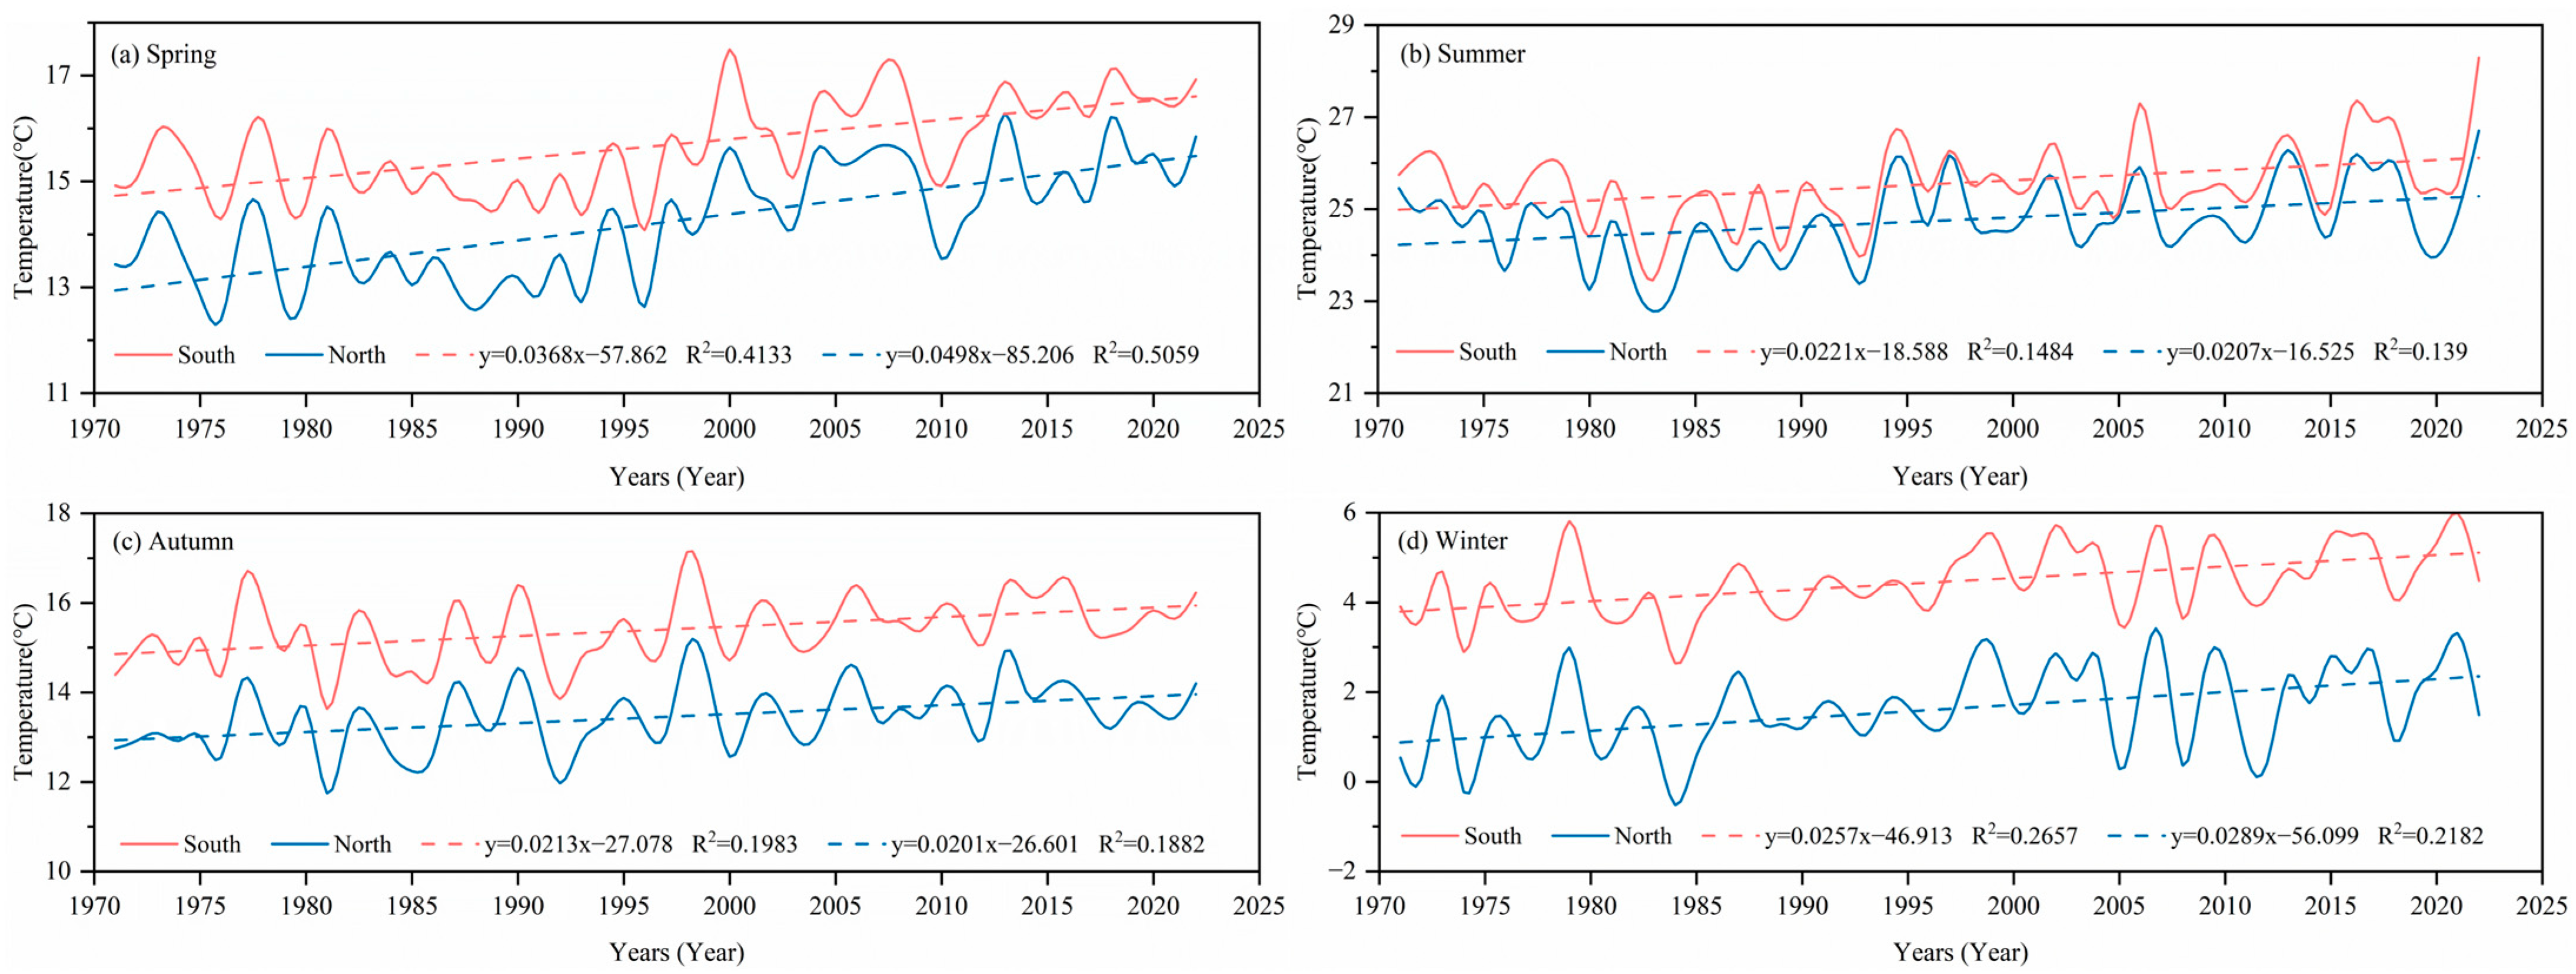
3.1.2. Inter-Seasonal Temperature Changes
3.1.3. Inter-Monthly Temperature Changes
3.1.4. Analysis of the 0 °C Isotherm in January for Mts. Qinling
3.2. Temperature Change Based on Daily Maximum Values
3.2.1. Inter-Annual Temperature Changes
3.2.2. Inter-Seasonal Temperature Changes
3.2.3. Inter-Monthly Temperature Changes
3.3. Temperature Change Based on Daily Minimum Values
3.3.1. Inter-Annual Temperature Changes
3.3.2. Inter-Seasonal Temperature Changes
3.3.3. Inter-Monthly Temperature Changes
4. Discussion
5. Conclusions
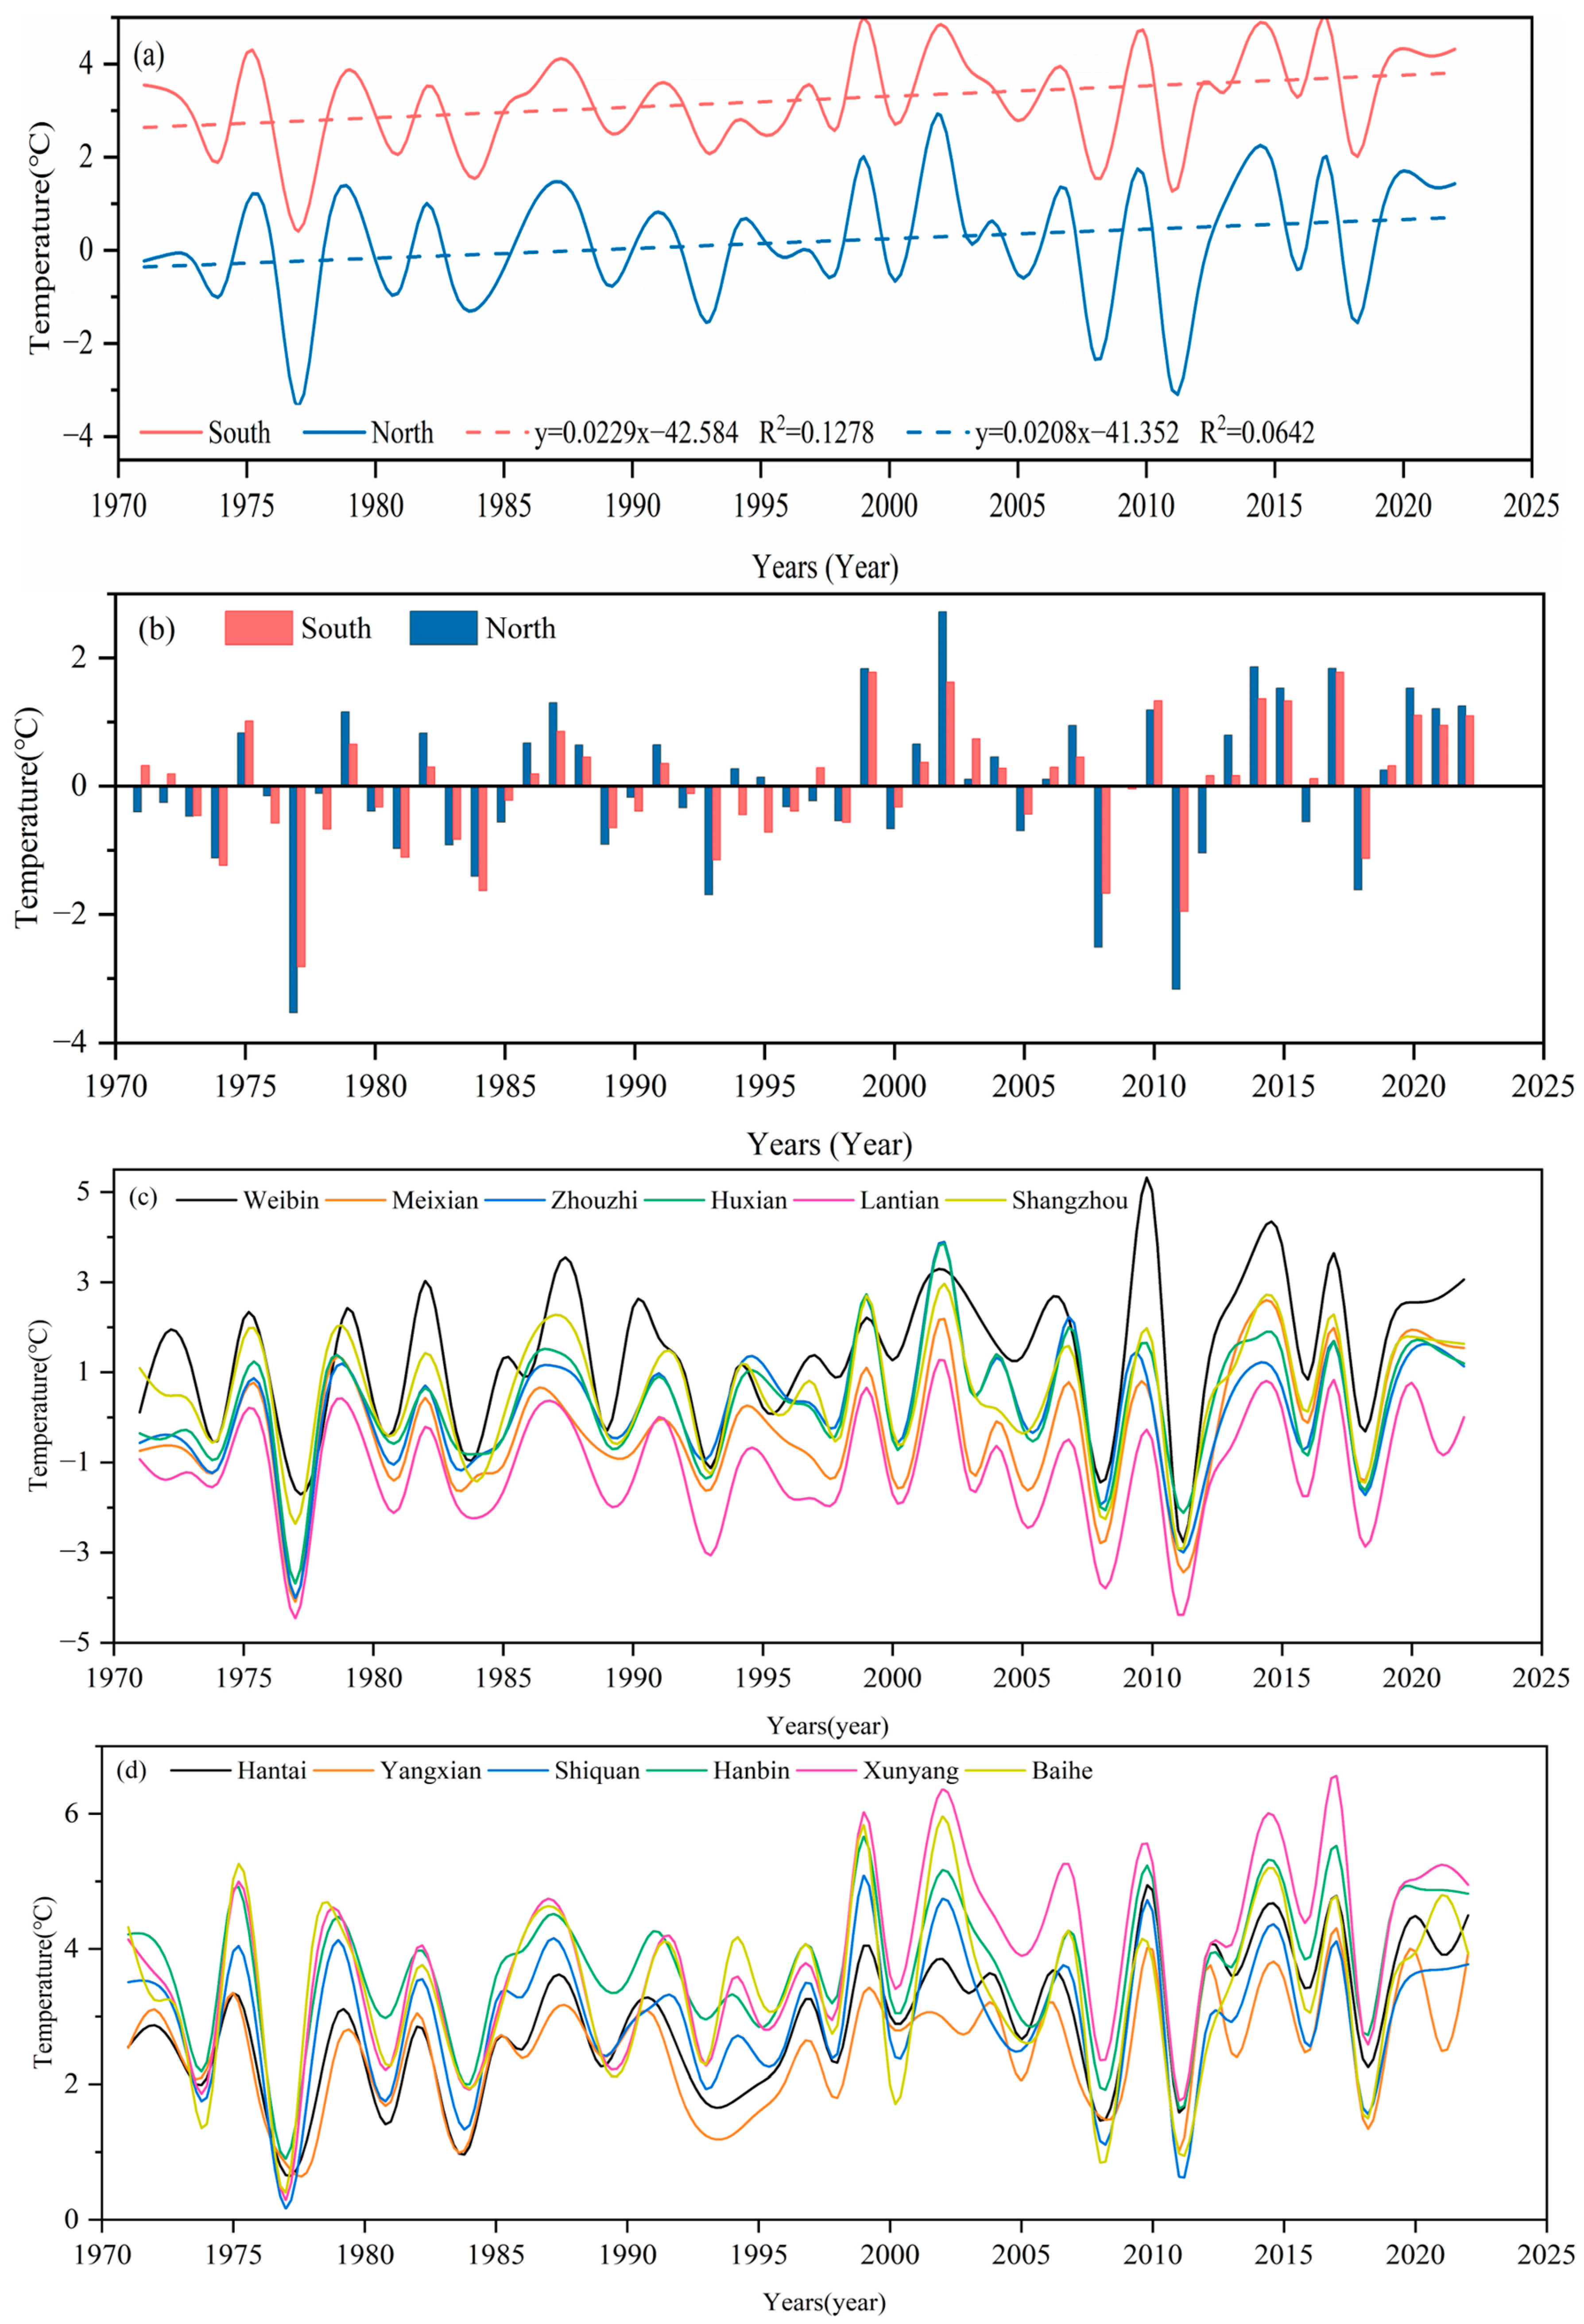
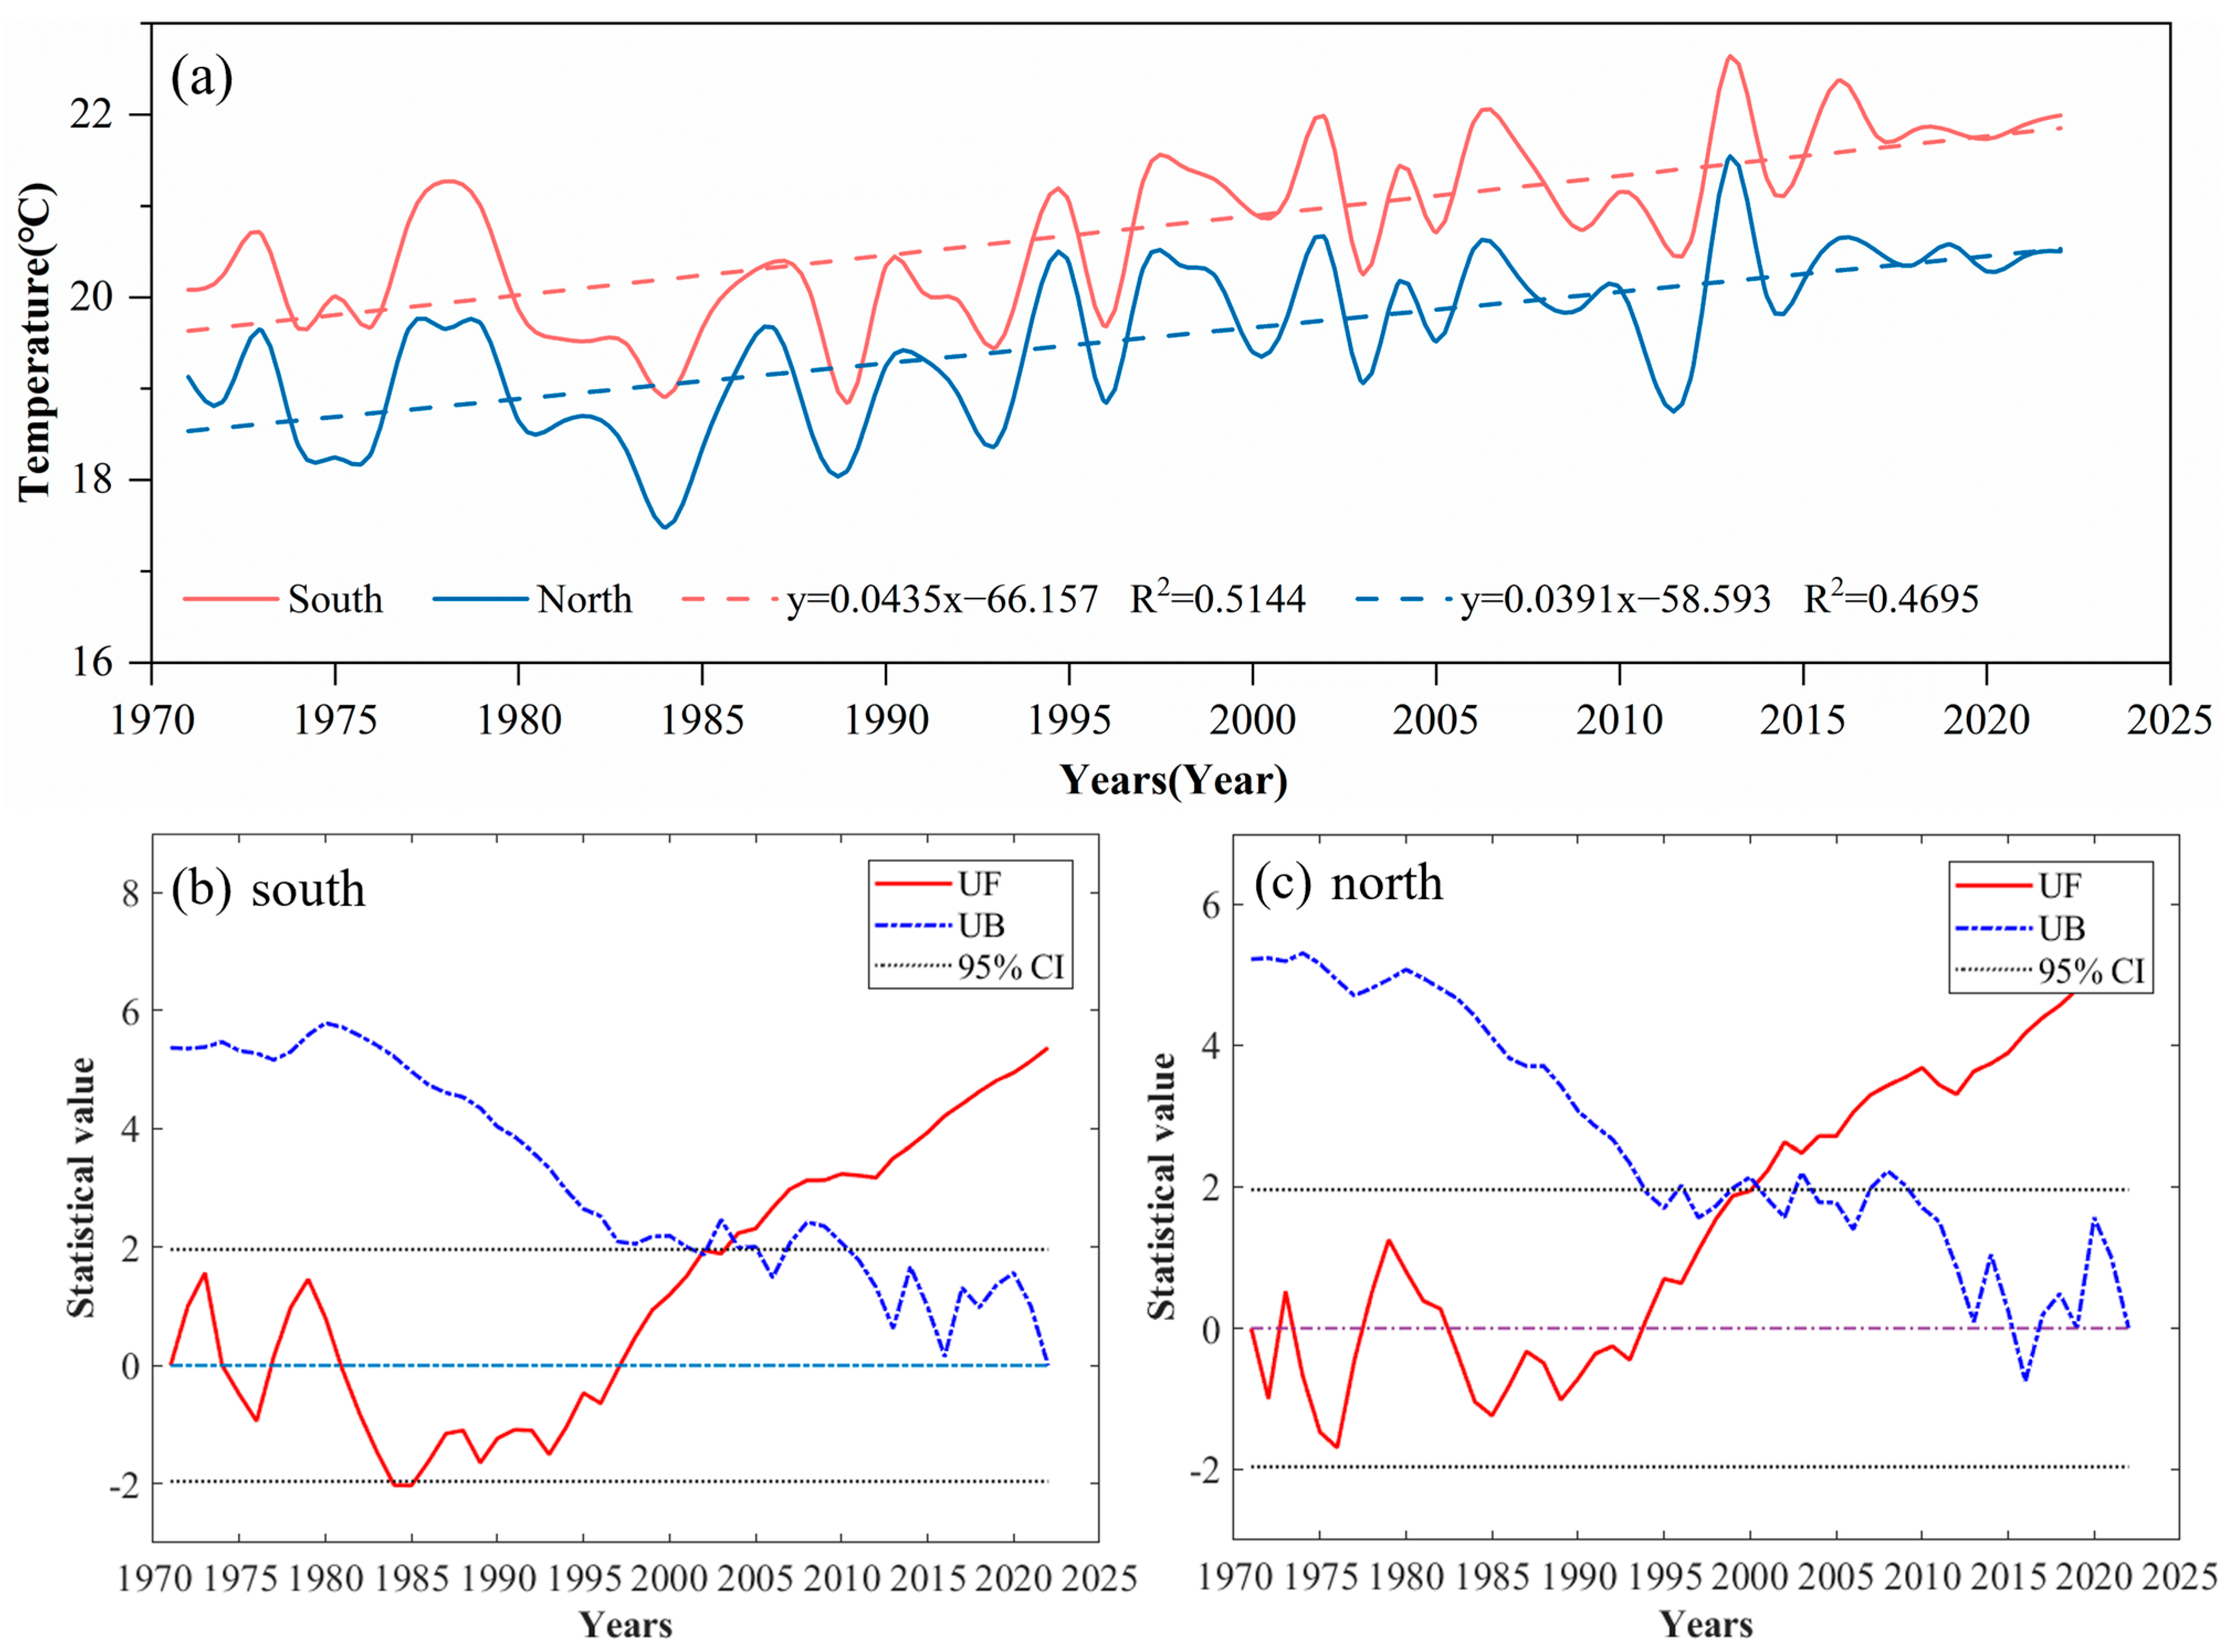
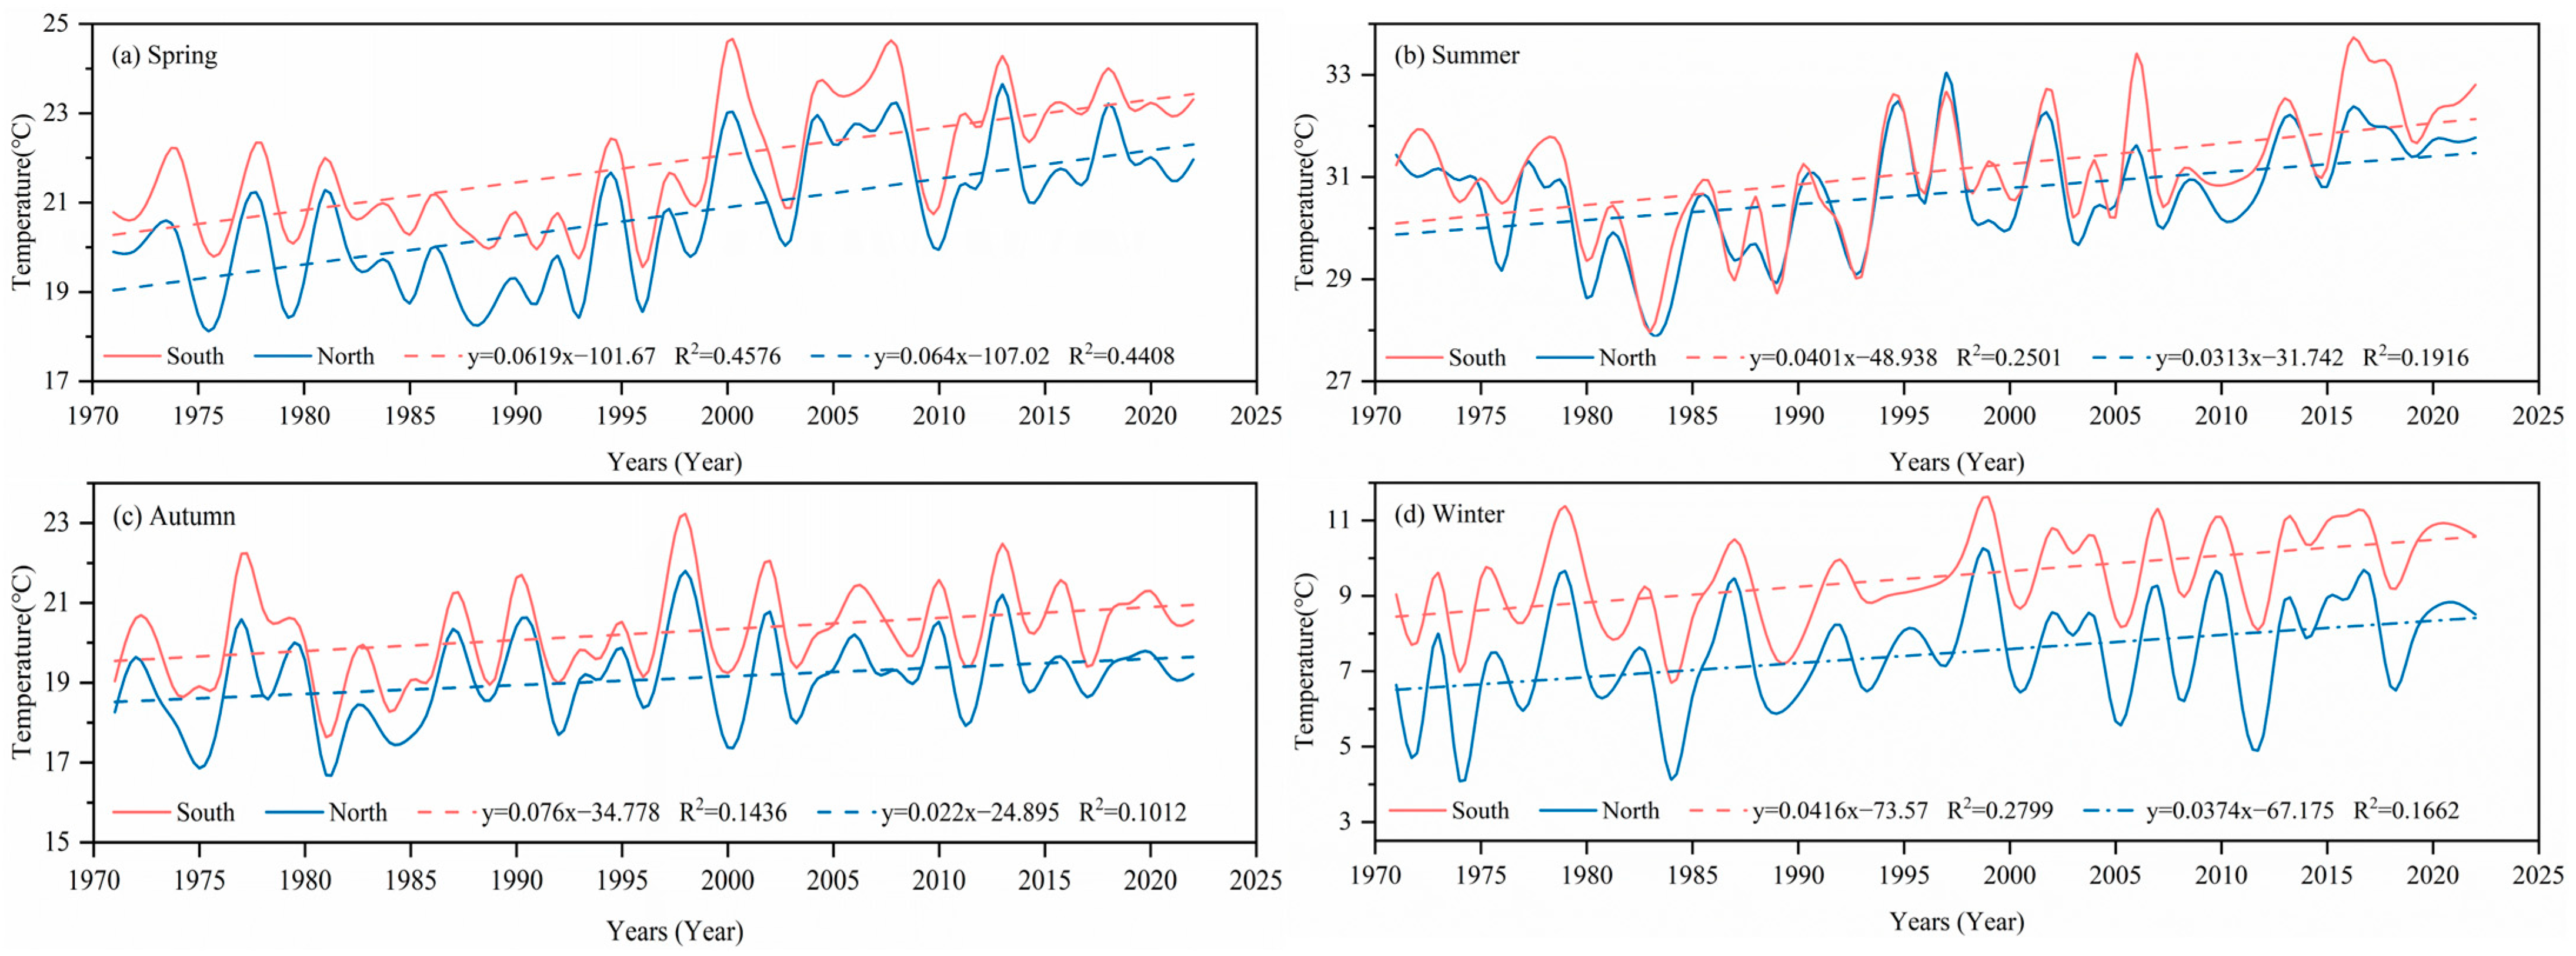
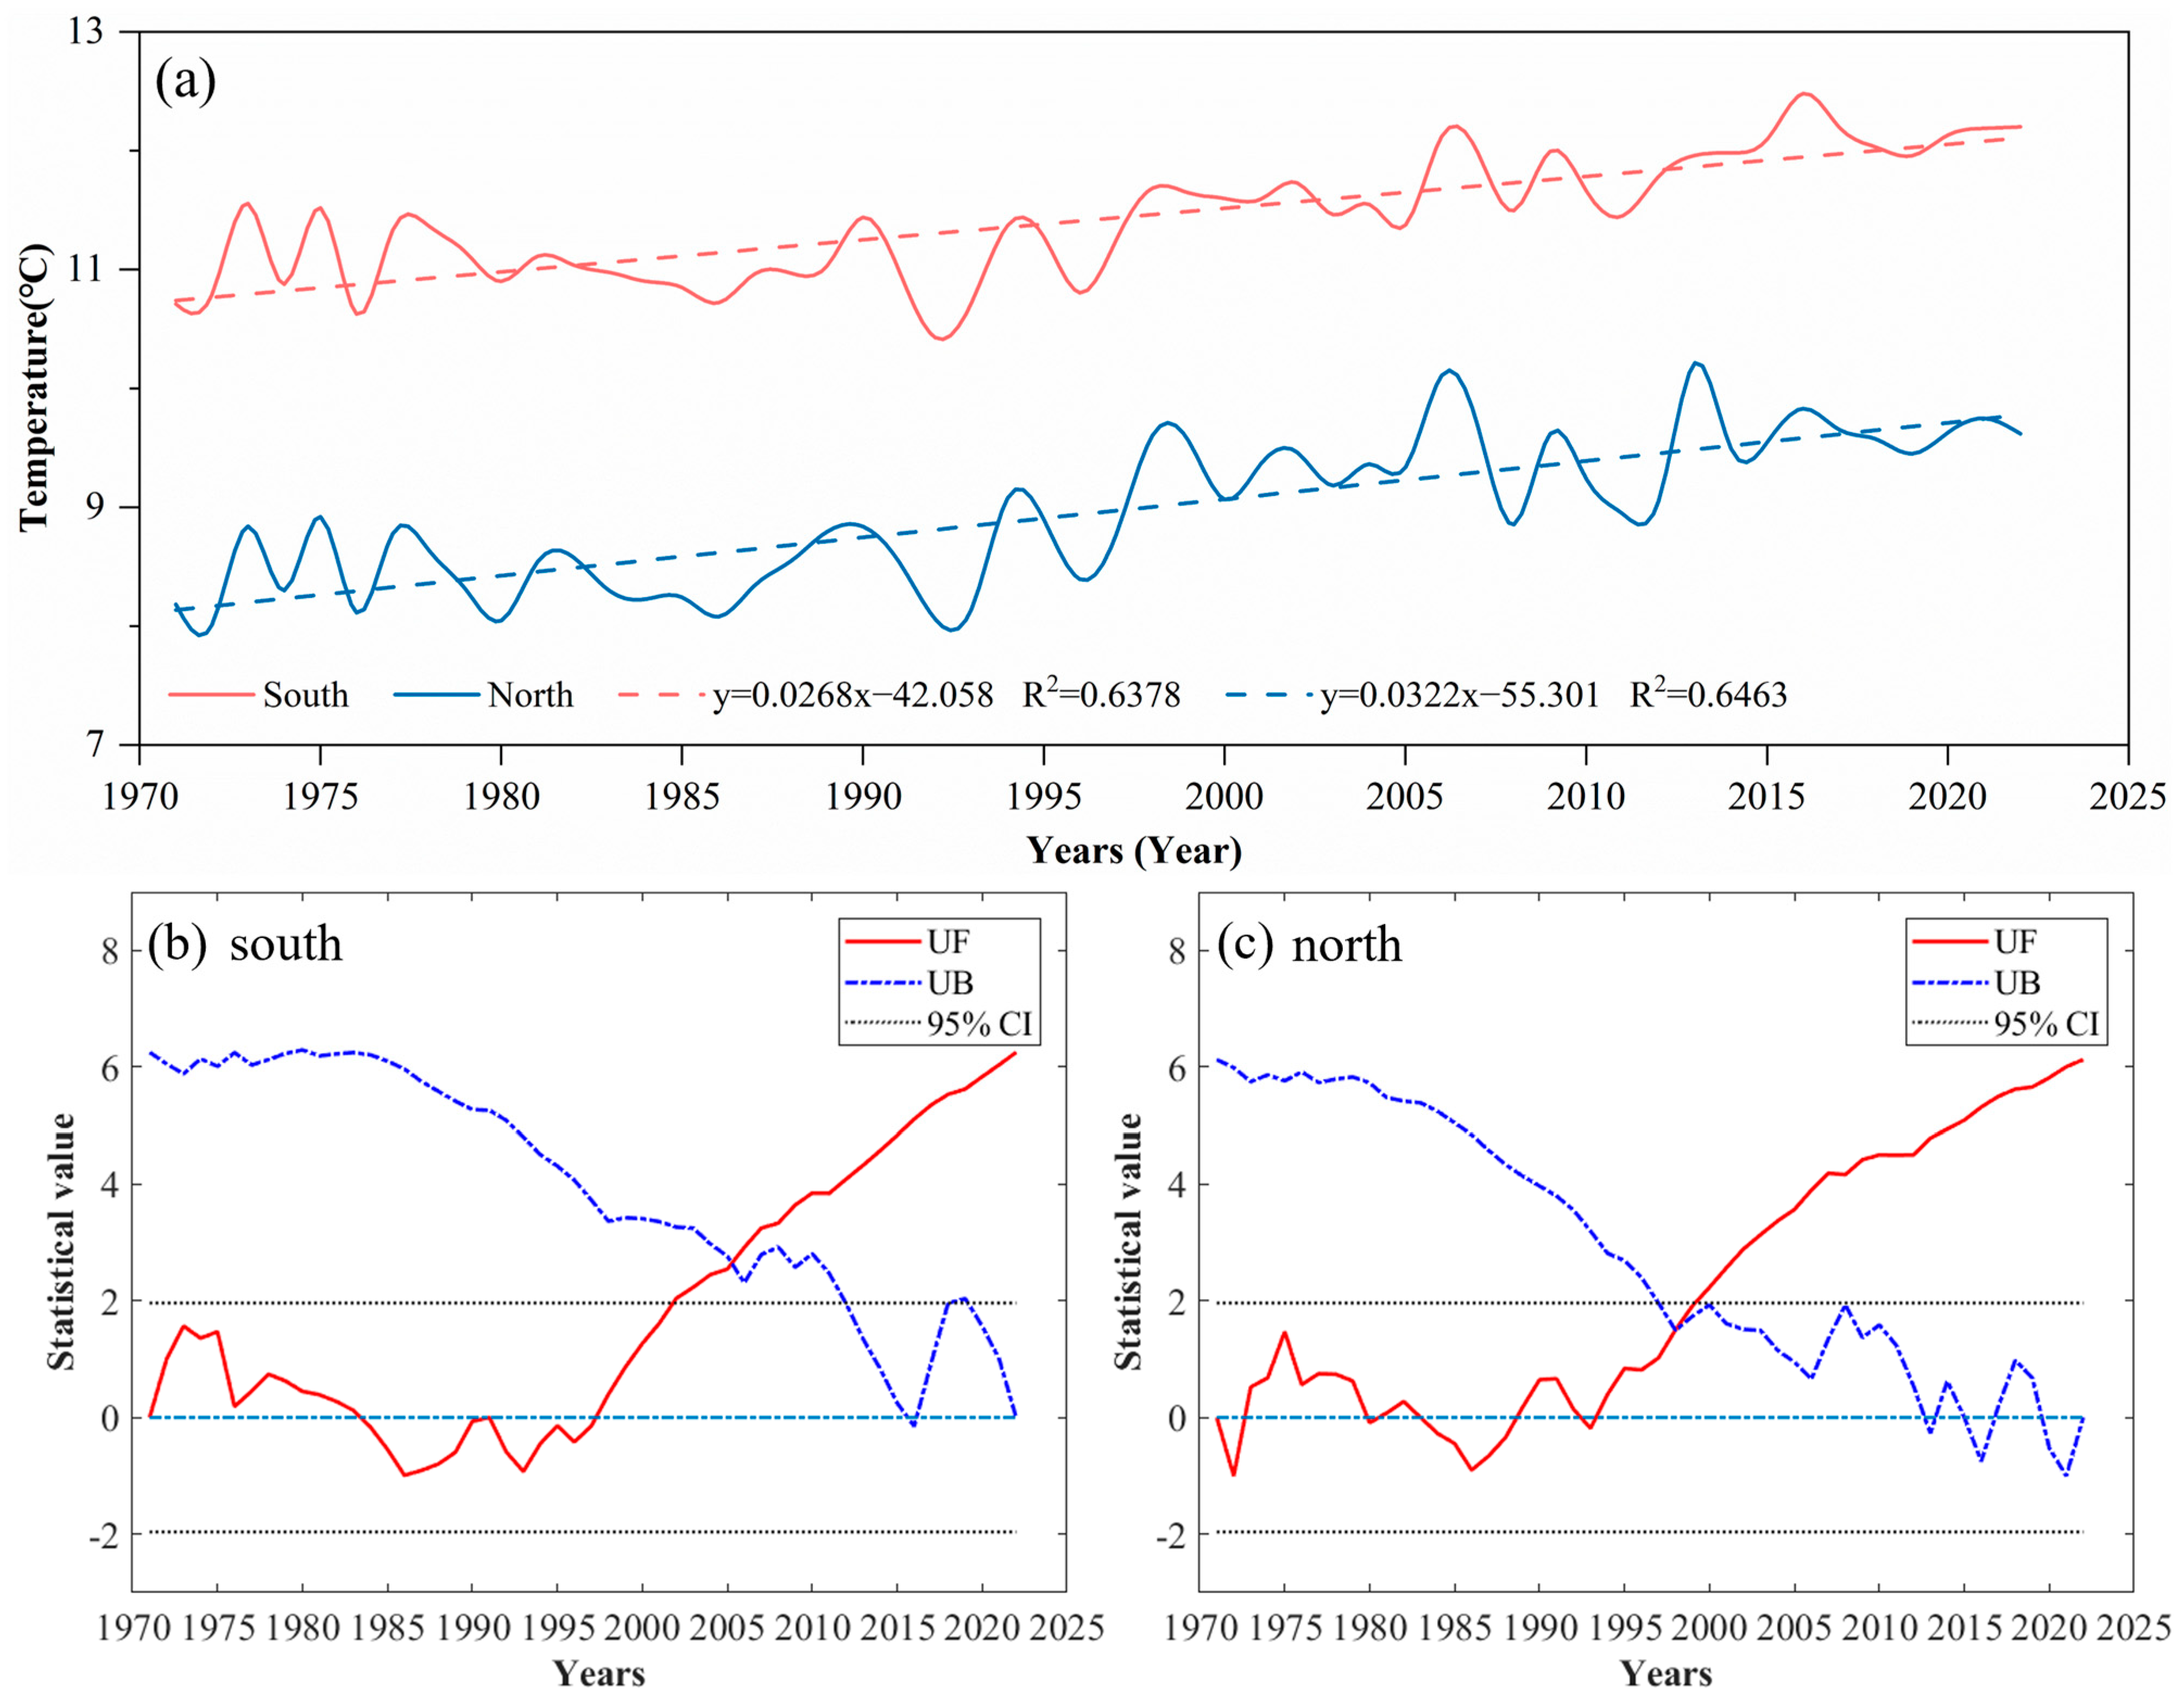
- Based on the daily mean temperatures, the mean annual temperature in the North exhibited a higher variation tendency rate than that in the South. The southern slope experienced a significant change in 2002, while the northern slope underwent a mutation in 1998. Seasonally, temperature trend rates were higher in spring and winter in the North, while they were lower in summer and autumn. This indicates that temperature increases in spring and winter significantly weaken the boundary mountain effect, particularly in spring. Future research could investigate how alterations in the watershed effect influence regional biodiversity and ecological balance.
- In the southern regions, the variation tendency rates of average temperature based on the daily maximum temperatures were consistently higher than in the North, except during spring. The warming effects in spring and winter were more pronounced, whereas fluctuations were more significant in summer and autumn.
- The trend rates for average temperatures based on daily minimums were higher in the North, with another abrupt change noted in 1998. Spring exhibited the highest trend rates in both regions, highlighting its major contribution to regional warming.
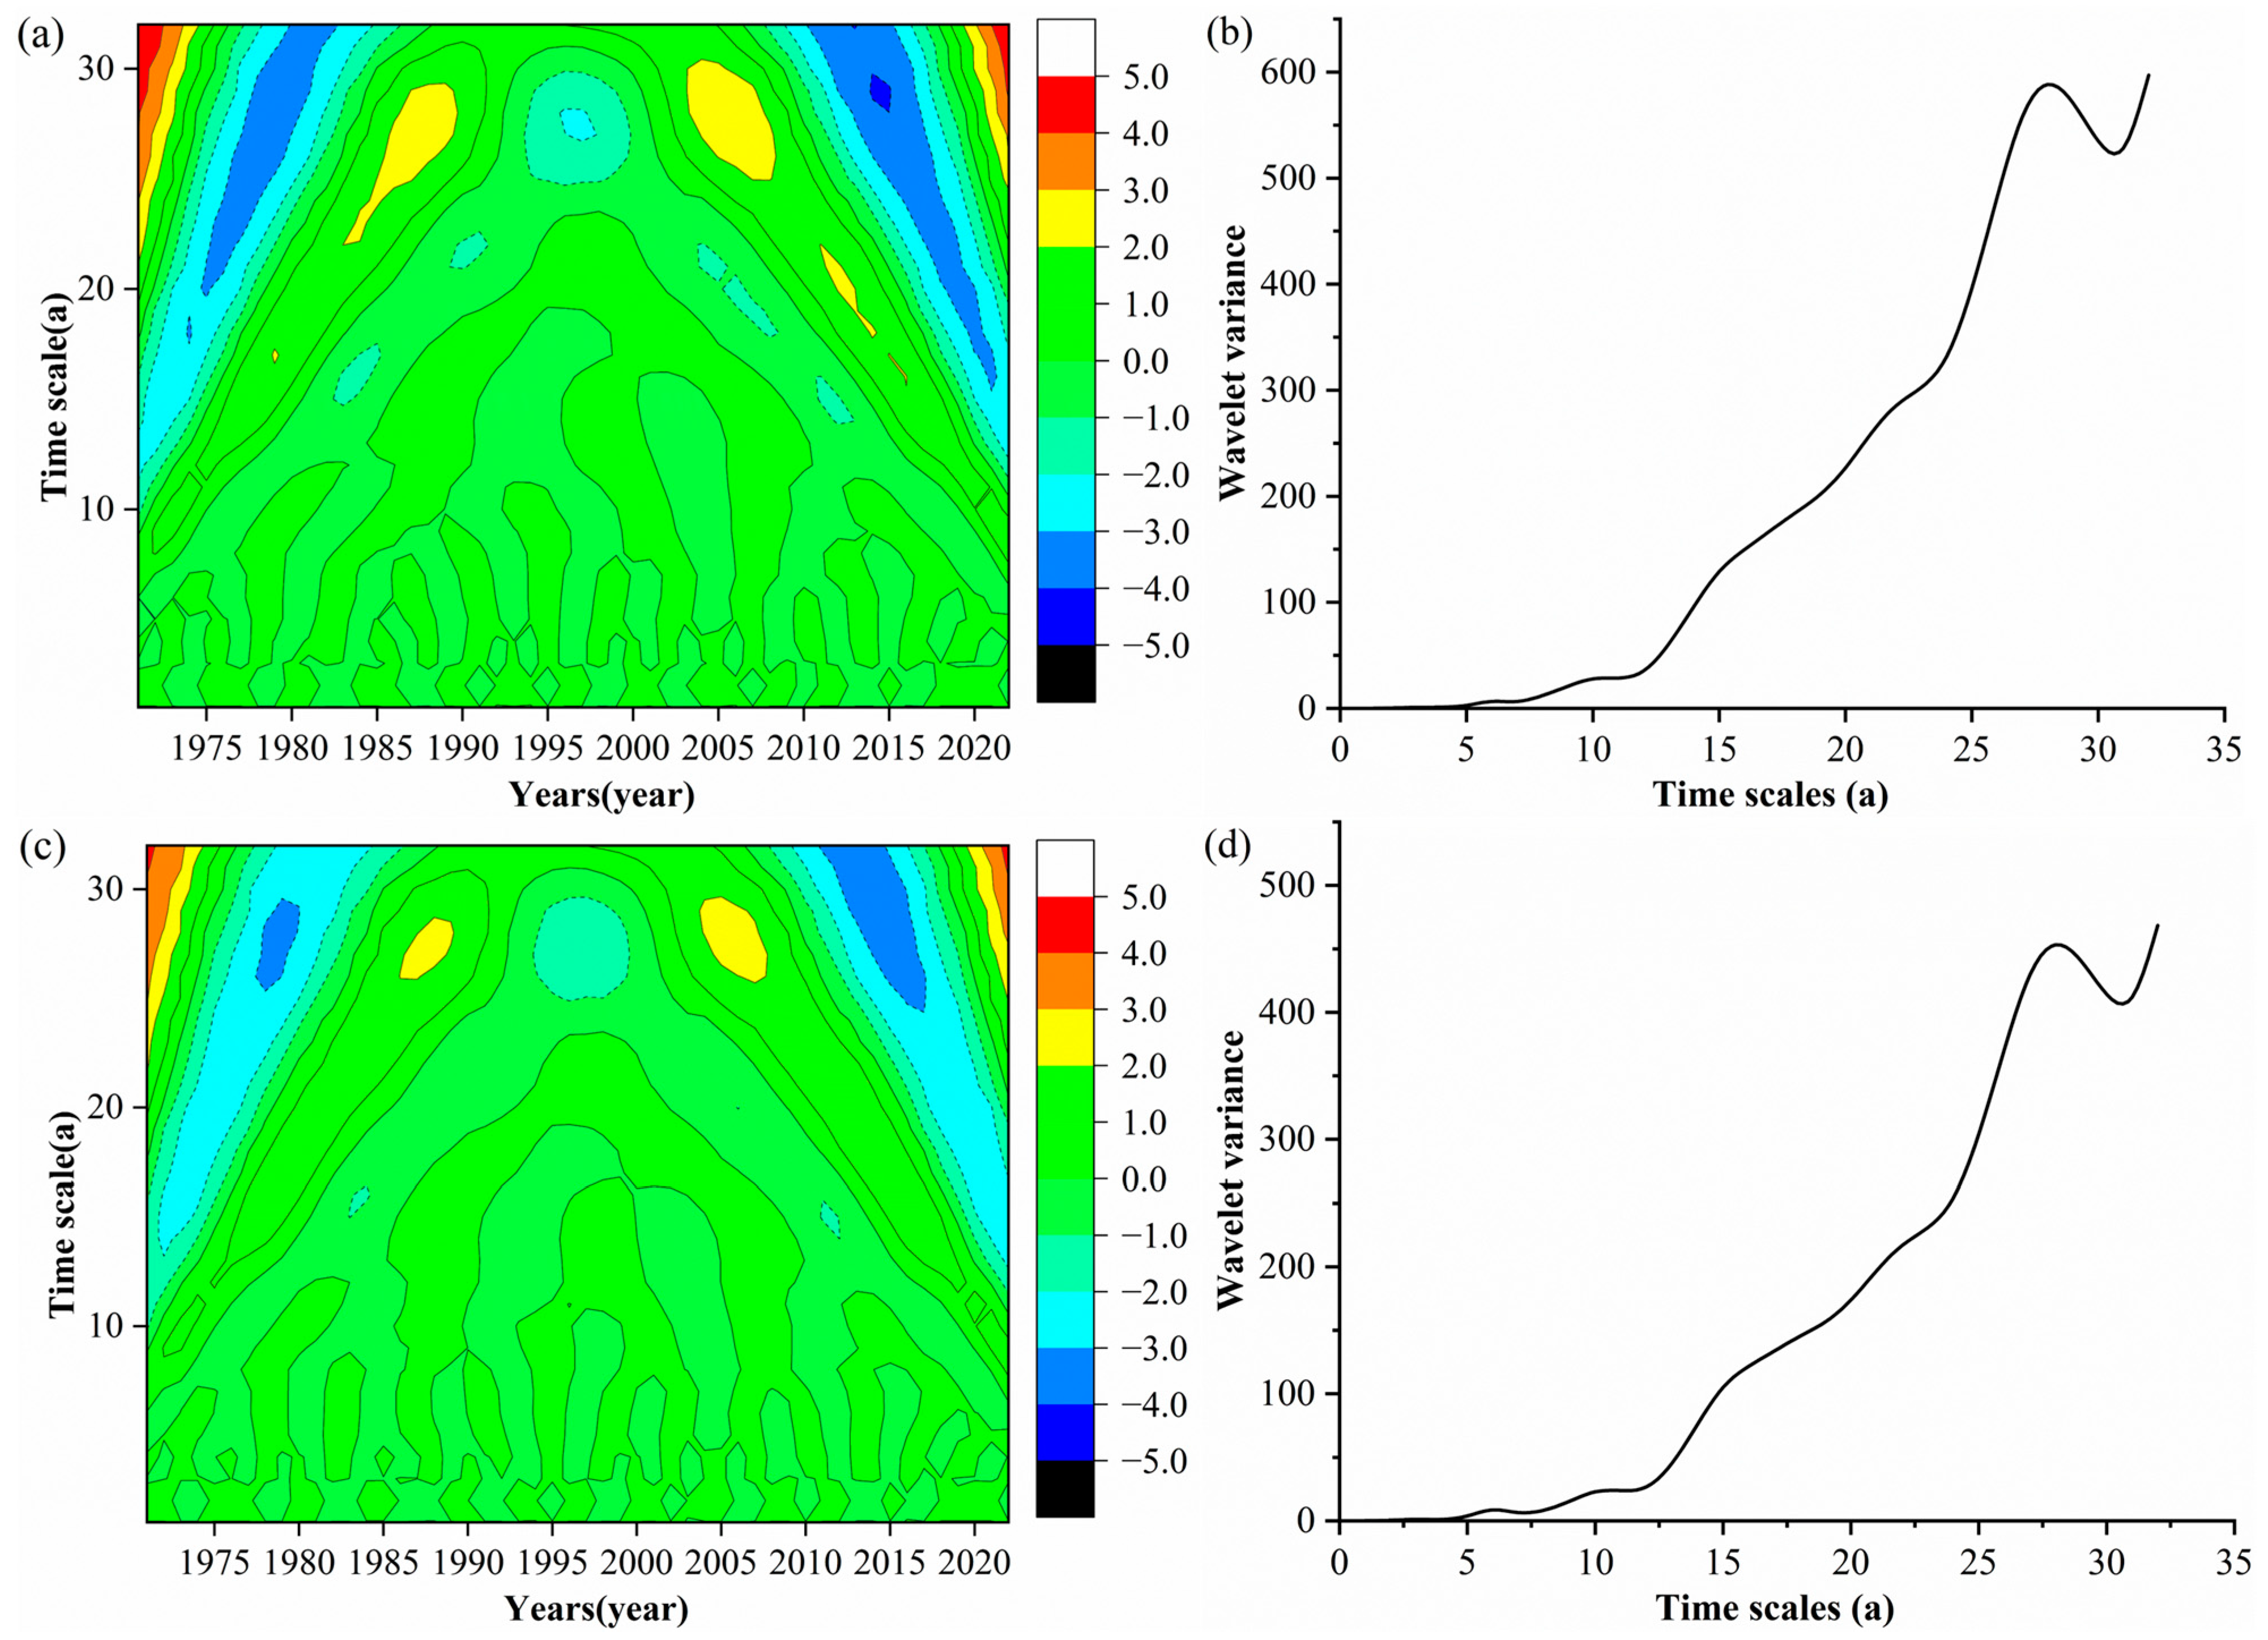
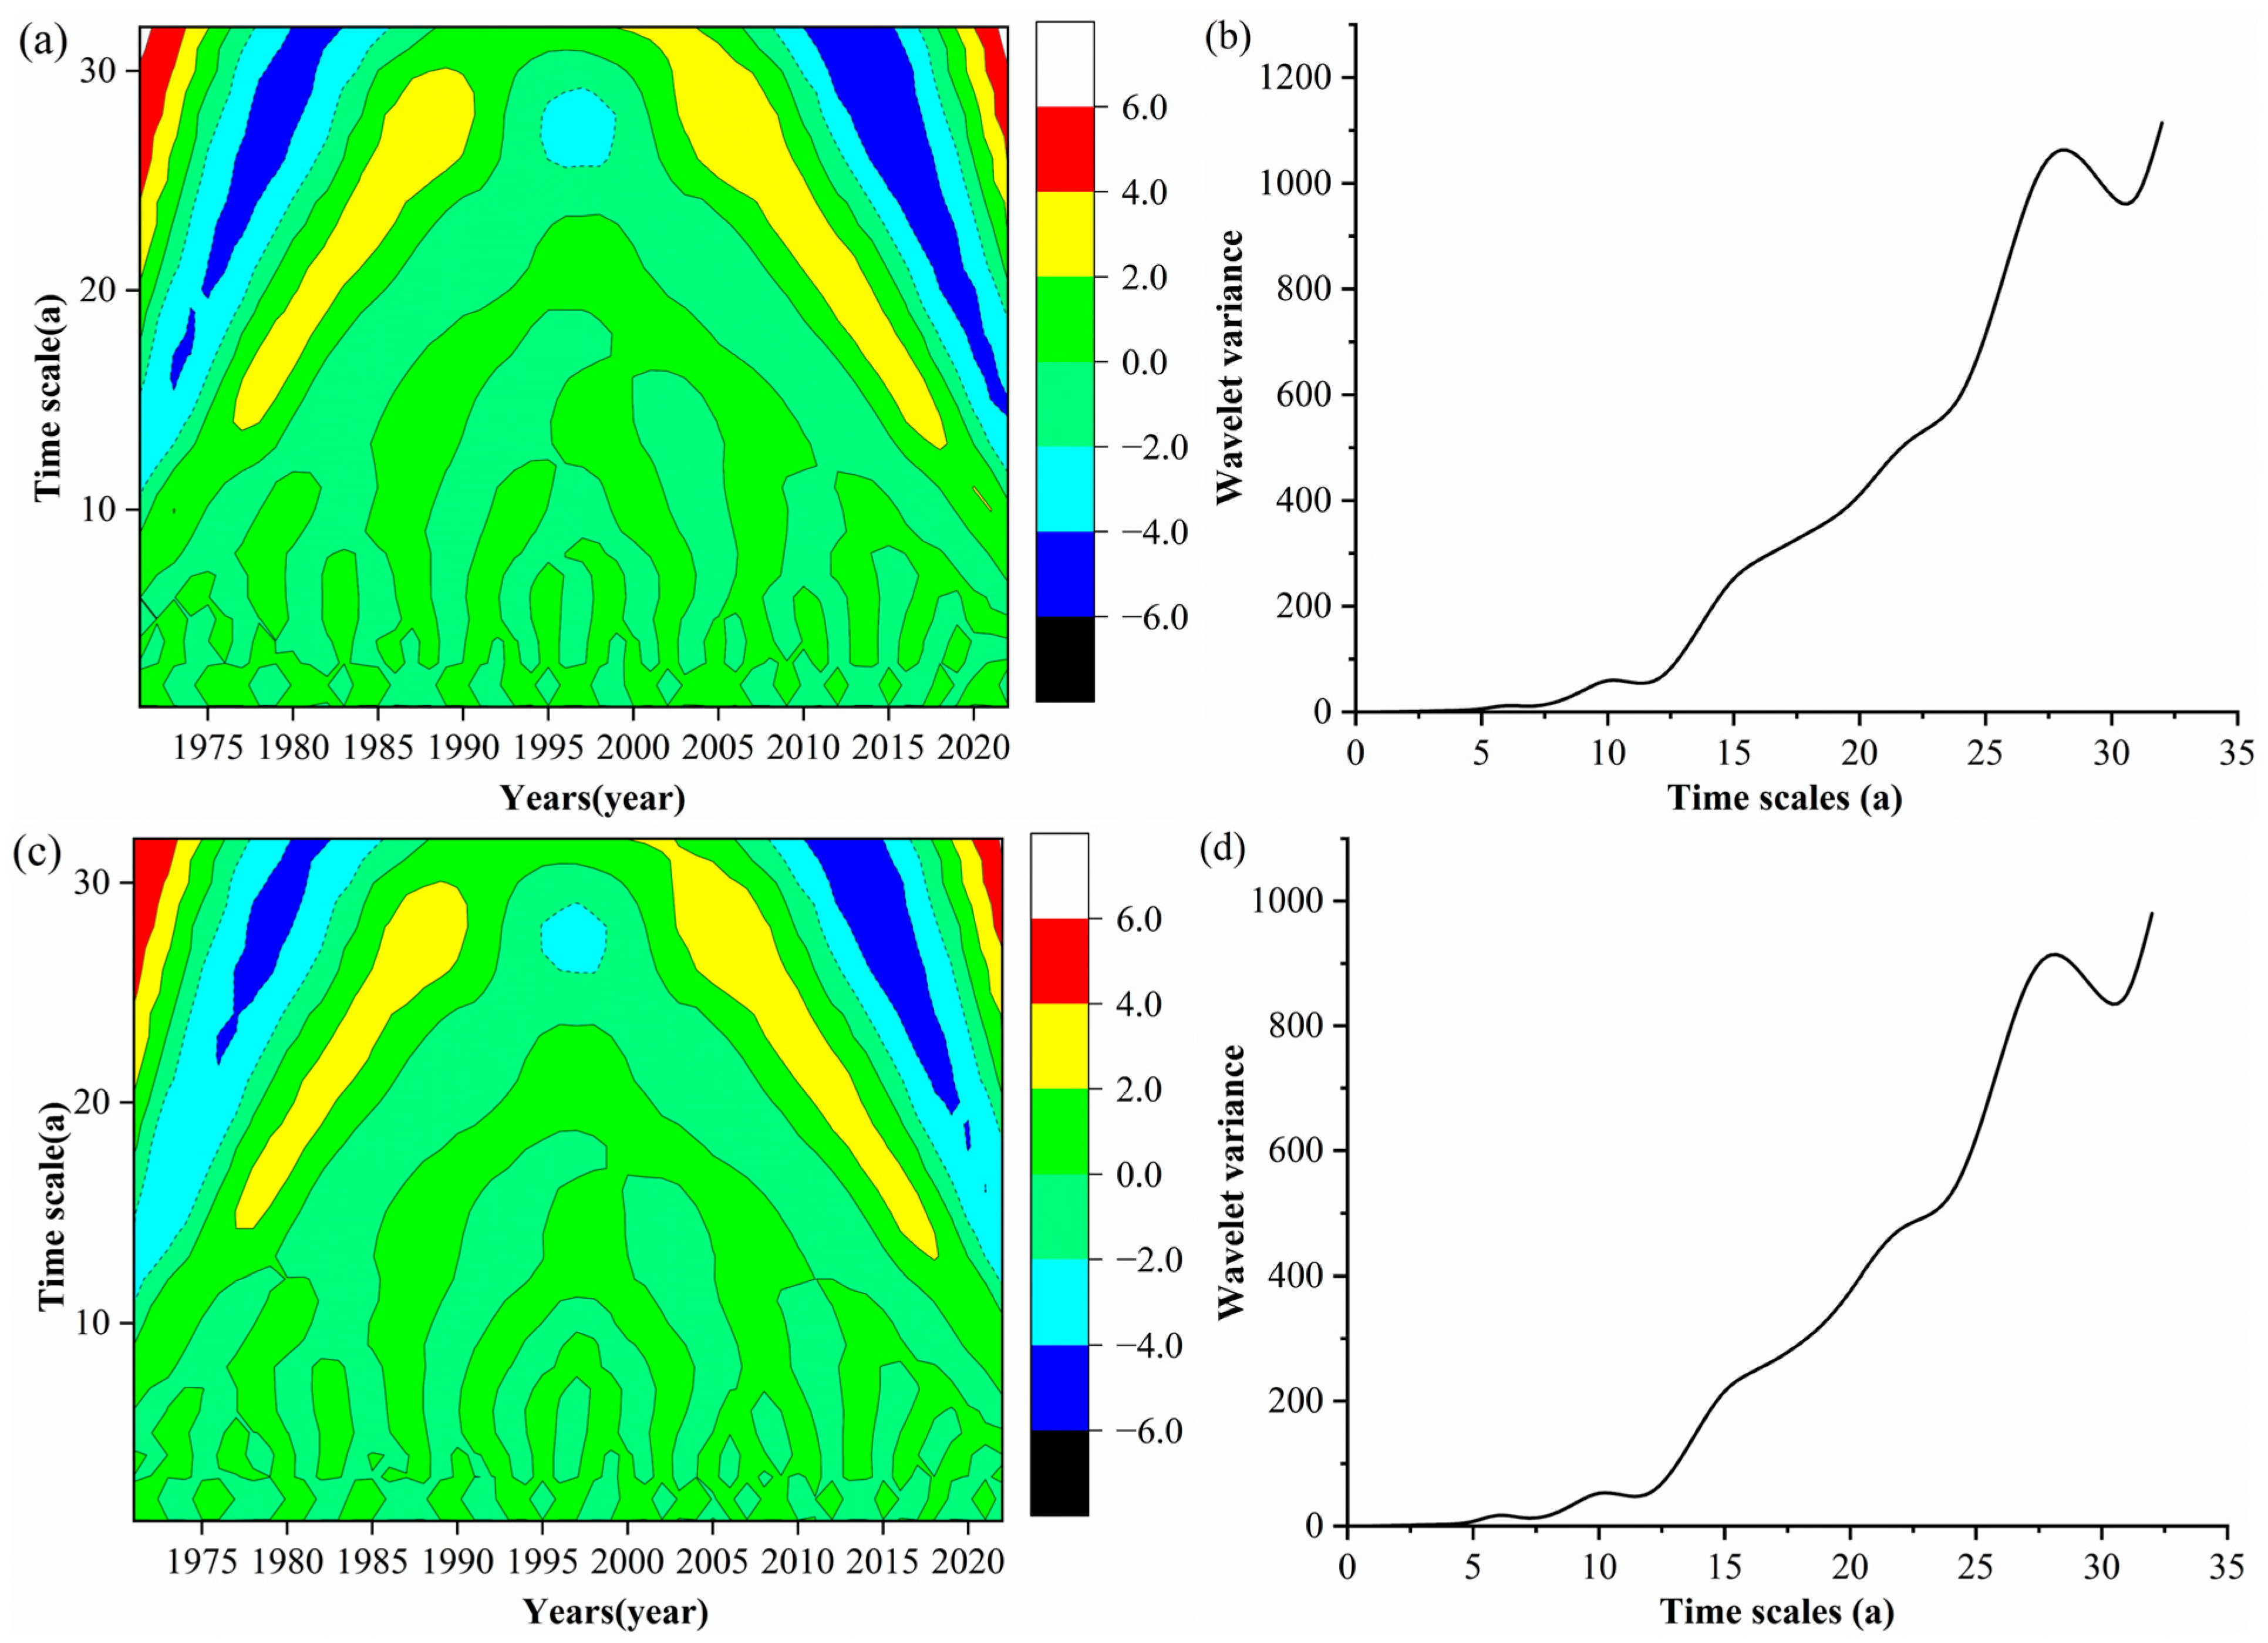
- The periodic changes in daily mean, maximum, and minimum temperatures were generally similar across both regions, with a primary periodicity of 28 years. The cycle of temperature oscillations between warm and cold phases was longer in the South than in the North. In-depth research on this periodic variation will enhance our understanding of the long-term effects of climate change on regional climate patterns.
- The temperature-boundary effect was predominantly observed at lower temperatures, with spring being the most affected season. As global climate change intensifies, the mountain effect is expected to strengthen in the North and weaken in the South. Future studies could examine how changes in minimum temperatures affect soil and aquatic ecosystems, particularly in spring.
- After 1998, both regions experienced stronger warming trends in January, with greater fluctuation ranges than previously observed. Given the ongoing global warming trend, Mts. Qinling is projected to soon become the dividing line of the 1 °C isotherm in January between the northern and southern parts of the Chinese Mainland, replacing the current 0 °C isotherm. Future studies could investigate the impact of changes in minimum temperatures on soil and aquatic ecosystems, especially in spring.
Author Contributions
Funding
Institutional Review Board Statement
Informed Consent Statement
Data Availability Statement
Acknowledgments
Conflicts of Interest
References
- Li, B.Y.; Liu, D.W.; Yu, E.T.; Wang, L.X. Warming-and-wetting trend over China’s drylands: Observational evidence and future projection. Glob. Environ. Chang. 2024, 86, 102826. [Google Scholar] [CrossRef]
- Wang, S.R.; Zhang, Z.Q. Effects of climate change on water resources in China. Clim. Res. 2011, 47, 77–82. [Google Scholar] [CrossRef]
- Chen, Y.Y.; Ding, Y.J.; She, Z.X.; Lin, E.D. Climate and Environment Changes in China (Volume II: The Impacts, Adapting and Mitigating of Climate and Environmental Change in China); Science Press: Beijing, China, 2005. (In Chinese) [Google Scholar]
- Qian, W.H. Global Climate System; Peking University Press: Beijing, China, 2009. (In Chinese) [Google Scholar]
- IPCC. Meeting Report of the Intergovernmental Panel on Climate Change Expert Meeting on Climate Change, Food, and Agriculture; World Meteorological Organization: Geneva, Switzerland, 2015. [Google Scholar]
- Han, Y.; Zhao, G.Y.; Wang, Y.M.; Pan, X.L.; Jiang, L.L.; Xiang, M. New opinion about temperature rising for the recent 150 years. J. Xinyang Normal Univ. (Nat. Sci.) 2016, 29, 67–70. (In Chinese) [Google Scholar]
- Li, F.M.; Yin, S.Y.; Yin, T.Y. The spatial-temporal variations of extreme temperatures in the Qinling Daba Mountains and adjacent areas during 1960–2017. Acta Sci. Nat. Univ. Sunyatseni 2020, 59, 80–92. (In Chinese) [Google Scholar]
- Jia, L.; Zeng, B.; Yang, T.B.; Liu, K.Q. Temperature and precipitation changes in the Chinese monsoon region during the recent half century and the spatio-temporal differences thereof. J. Lanzhou Univ. (Nat. Sci.) 2015, 51, 186–192+201. (In Chinese) [Google Scholar]
- Yan, Z.W.; Ding, Y.H.; Zhai, P.M.; Song, L.C.; Cao, L.J.; Li, Z. Re-assessing climatic warming in China since the last century. Acta Meteor. Sin. 2020, 78, 370–378. (In Chinese) [Google Scholar]
- Liu, N.; Liu, Y.; Zhou, Q.; Bao, G. Droughts and broad-scale climate variability reflected by temperature-sensitive tree growth in the Qinling Mountains, central China. Int. J. Biometeorol. 2013, 57, 169–177. [Google Scholar] [CrossRef]
- Deng, C.H.; Bai, H.Y.; Ma, X.P.; Zhao, T.; Gao, S.; Huang, X.Y. Spatiotemporal differences in the climatic growing season in the Qinling Mountains of China under the influence of global warming from 1964 to 2015. Theor. Appl. Climatol. 2019, 138, 1899–1911. [Google Scholar] [CrossRef]
- Hu, Y.F.; Yao, Y.H.; Kou, Z.X. Exploring on the climate regionalization of Qinling-Daba mountains based on Geodetector-SVM model. PLoS ONE 2020, 16, e246774. [Google Scholar] [CrossRef]
- Wang, T.; Yang, M.H.; Yan, S.J.; Geng, G.P.; Li, Q.H.; Wang, F. Effects of temperature and precipitation on spatiotemporal variations of Net primary productivity in the Qinling Mountains, China. Pol. J. Environ. Stud. 2021, 30, 409–422. [Google Scholar] [CrossRef]
- Qin, Z.; Zhao, J.F.; Cheng, W.X.; Wang, J.; Su, H.L.; He, Y.L. Change of subtropical northern boundary in Qinling-Huai region in the context of climate change. Clim. Chang. Res. 2023, 19, 38–48. (In Chinese) [Google Scholar]
- Zhu, H.; Ashton, P. Ecotones in the tropical-subtropical vegetation transition at the tropical margin of southern China. Chin. Sci. Bull. 2021, 66, 3732–3743. (In Chinese) [Google Scholar] [CrossRef]
- Xu, Z.Y.; Li, J.W.; Ding, Y.Y. Analysis on temperature change characteristics of the Qinling region from 1961 to 2015. Sci. Technol. Vis. 2017, 9, 37–38+46. (In Chinese) [Google Scholar]
- Li, S.S.; Yan, J.P.; Wan, J. The characteristics of temperature change in Qinling Mountains. Sci. Geogr. Sin. 2012, 32, 853–858. (In Chinese) [Google Scholar]
- Li, Z.M.; Li, B.B.; Wei, Z.D.; Wei, X.Q.; Wang, T. Climate Change and Human Society; China Meteorological Press: Beijing, China, 2020. (In Chinese) [Google Scholar]
- Bai, H.Y.; Ma, X.P.; Gao, X.; Hou, Q.L. Variations in January temperature and 0 °C isothermal curve in Qinling Mountains based on DEM. Acta Geogr. Sin. 2012, 67, 1443–1450. (In Chinese) [Google Scholar]
- Li, S.S.; Lu, J.Y.; Yan, J.P.; Liu, X.F.; Kong, F.; Wang, J. Spatiotemporal variability of temperature in northern and southern Qinling Mountains and its influence on climatic boundary. Acta Geogr. Sin. 2018, 73, 13–24. (In Chinese) [Google Scholar]
- Zhang, S.H.; Bai, H.Y.; Qi, G.Z.; Liang, J.; Zhao, T.; Meng, Q. Changes of climate zone boundary of the Qinling Mountains from 1960 to 2019. J. Nat. Res. 2021, 36, 2491–2506. (In Chinese) [Google Scholar] [CrossRef]
- Karl, T.R.; Trenberth, K.E. Modern global climate change. Science 2003, 302, 1719–1723. [Google Scholar] [CrossRef]
- Spracklen, D.V. China’s contribution to climate change. Nature 2016, 531, 310–311. [Google Scholar] [CrossRef]
- Miao, Q.L.; Ding, Y.Y.; Wang, Y. Impact of climatic warming on the northern boundary of sub-tropical zone of China. Geogr. Res. 2009, 28, 634–642. (In Chinese) [Google Scholar]
- Su, K.H.; Yan, J.P.; Bai, J.; Zhang, L.W.; Wang, X.Z.; Li, J.S.; Tian, Q.X. Comparative studies on degree of adaption of wheat under climatic change between areas south and north of Huaihe River in Henan Province. Prog. Geogr. 2012, 31, 63–71. (In Chinese) [Google Scholar]
- Deng, C.H.; Bai, H.Y.; Zhao, T.; Ma, X.P.; Li, W.Z.; Xie, M.L. The shift in temperature zone boundaries in China based on the changes of the climate growing season in the Qinling Mountains from 1964 to 2015. Theor. Appl. Climatol. 2022, 148, 131–143. [Google Scholar] [CrossRef]
- Li, J.; Zhao, Y.D.; Yang, D.; Tanoli, J. Variations in extreme precipitation and relation to the Asia summer monsoon over the Qinling-Dabashan Mountains, China. Terr. Atmos. Ocean. Sci. 2021, 32, 1271–1288. [Google Scholar] [CrossRef]
- Hao, C.Y.; Feng, H.H. China’s north-south regional differentiation of ecological environment, production activities and individual living under the influence of climate factors. J. Xinyang Normal Univ. (Nat. Sci.) 2023, 36, 356–361. (In Chinese) [Google Scholar]
- Song, L.L.; Hao, C.Y.; He, S.N. Study on spatial differentiation of precipitation between north and south of Qinling Mountains. Earth. Environ. 2021, 49, 615–622. (In Chinese) [Google Scholar]
- Cheng, D.D.; Qi, G.Z.; Song, J.X.; Zhang, Y.X.; Bai, H.Y.; Gao, X.Y. Quantitative assessment of the contributions of climate change and human activities to vegetation variation in the Qinling Mountains. Front. Earth Sci. 2021, 9, 782287. [Google Scholar] [CrossRef]
- Huang, C.L.; Yang, Q.K.; Zhang, H. Temporal and spatial variation of NDVI and its driving factors in Qinling Mountain. Water 2021, 13, 3154. [Google Scholar] [CrossRef]
- Kou, Z.X.; Yao, Y.H.; Hu, Y.F.; Zhang, B.P. Discussion on position of China’s north-south transitional zone by comparative analysis of mountain altitudinal belts. J. Mt. Sci. 2020, 17, 1901–1915. [Google Scholar] [CrossRef]
- Zhang, S.H.; Qi, G.Z.; Su, K.; Zhou, L.Y.; Bai, H.Y. Research on sequence construction and characteristics diagnosis of droughts and floods in the Qinling Mountains of China from 1850 to 1959. Front. Earth Sci. 2022, 10, 860750. [Google Scholar] [CrossRef]
- Zhang, J.; Liu, X.N.; Tan, Z.H.; Chen, Q.G. Mapping of the north-south demarcation zone in China based on GIS. J. Lanzhou Univ. (Nat. Sci.) 2012, 48, 28–33. (In Chinese) [Google Scholar]
- Bodini, N.; Optis, M.; Perr-Sauer, J.; Simley, E.; Fields, M.J. Lowering post-construction yield assessment uncertainty through better wind plant power curves. Wind Energy 2022, 25, 5–22. [Google Scholar] [CrossRef]
- Delgado-Aguilar, M.; Valverde-Som, L.; Cuadros-Rodriguez, L. Solver, an Excel application to solve the difficulty in applying different univariate linear regression methods. Chemometr. Intell. Lab. 2018, 178, 39–46. [Google Scholar] [CrossRef]
- Huang, W.; Liu, S. Research on time series modeling based on long-term linear trend. Stat. Decis. 2021, 37, 30–33. (In Chinese) [Google Scholar]
- Wu, X.Q.; Zhang, G. Research on the estimation method of residual auto-regressive model with linear trend. Stat. Decis. 2016, 11, 74–77. (In Chinese) [Google Scholar]
- Ali, R.; Kuriqi, A.; Abubaker, S.; Kisi, O. Long-term trends and seasonality detection of the observed flow in Yangtze River using Mann-Kendall and Sen’s innovative trend method. Water 2019, 11, 1855. [Google Scholar] [CrossRef]
- He, S.N.; Hao, C.Y. Analysis on spatial-temporal variation characteristics of climate in Qinling-Huaihe demarcation zone since 1961. Ecol. Indic. 2024, 158, 111345. [Google Scholar] [CrossRef]
- Sun, S.; Fang, C.L. Water use trend analysis: A non-parametric method for the environmental Kuznets curve detection. J. Clean. Prod. 2018, 172, 497–507. [Google Scholar] [CrossRef]
- Wang, J.S. Determining the most accurate program for the Mann-Kendall method in detecting climate mutation. Theor. Appl. Climatol. 2020, 142, 847–854. [Google Scholar] [CrossRef]
- Guo, E.L.; Zhang, J.Q.; Wang, Y.F.; Quan, L.; Zhang, R.J.; Zhang, F.; Zhou, M. Spatiotemporal variations of extreme climate events in Northeast China during 1960–2014. Ecol. Indic. 2019, 96, 669–683. [Google Scholar] [CrossRef]
- Guo, W.X.; He, N.; Ban, X.; Wang, H.X. Multi-scale variability of hydrothermal regime based on wavelet analysis-The middle reaches of the Yangtze River, China. Sci. Total Environ. 2022, 841, 156598. [Google Scholar] [CrossRef]
- Shao, W.W.; Chen, X.D.; Zhou, Z.H.; Liu, J.H.; Yan, Z.Q.; Chen, S.L.; Wang, J.H. Analysis of river runoff in the Poyang Lake Basin of China: Long-term changes and influencing factors. Hydrol. Sci. J. 2017, 62, 575–587. [Google Scholar] [CrossRef]
- Wen, S.Y.; Liu, Z.H.; Han, Y.; Chen, Y.Y.; Xu, L.S.; Li, Q.S. Spatiotemporal variation characteristics of reference evapotranspiration and relative moisture index in Heilongjiang investigated through remote sensing tools. Remote Sens. 2023, 15, 2582. [Google Scholar] [CrossRef]
- Liu, Z.; Liu, Y.; Li, Y. Anthropogenic contributions dominate trends of vegetation cover change over the farming-pastoral ecotone of northern China. Ecol. Indic. 2018, 95, 370–378. [Google Scholar] [CrossRef]
- Qin, X.; Liu, W.; Mao, R.; Song, J.; Chen, Y.; Ma, C.; Li, M. Quantitative assessment of driving factors affecting human appropriation of net primary production (HANPP) in the Qilian Mountains, China. Ecol. Indic. 2021, 121, 106997. [Google Scholar] [CrossRef]
- Li, S.S.; Hu, J.L.; He, J.P.; Ren, T.T.; Yan, J.P. Variation of summertime compound hot extremes over the north and south of Qinling Mountains and its influencing factors during 1970–2020. Geogr. Res. 2023, 42, 1410–1424. (In Chinese) [Google Scholar]
- Su, J.Z.; Wen, M.; Ding, Y.H. Hiatus of global warming: A review. Chin. J. Atmos. Sci. 2016, 40, 1143–1153. (In Chinese) [Google Scholar]
- Ren, J.C.; Gu, S.Q.; Feng, C.E.; Lu, X.N. Analysis of the temporal and spatial variation characteristics of temperature and precipitation in Shandong Province under the background of climate change. Water Resour. Hydropower Eng. 2023, 54, 27–37. (In Chinese) [Google Scholar]


| Zone | Number | Name | Longitude/°E | Latitude/°N | Elevation/m |
|---|---|---|---|---|---|
| South Mts. Qinling | 1 | Hantai | 107.03 | 33.07 | 509.5 |
| 2 | Yangxian | 107.55 | 33.22 | 468.6 | |
| 3 | Shiquan | 108.27 | 33.05 | 484.9 | |
| 4 | Hanbin | 109.03 | 32.72 | 290.8 | |
| 5 | Xunyang | 109.37 | 32.85 | 285.5 | |
| 6 | Baihe | 109.15 | 33.43 | 693.70 | |
| North Mts. Qinling | 7 | Weibin | 107.13 | 34.35 | 612.4 |
| 8 | Meixian | 107.73 | 34.27 | 517.6 | |
| 9 | Zhouzhi | 108.20 | 34.13 | 436.0 | |
| 10 | Huxian | 108.58 | 34.13 | 411.0 | |
| 11 | Lantian | 109.32 | 34.17 | 540.2 | |
| 12 | Shangzhou | 109.97 | 33.87 | 742.2 |
| Month | Daily Mean Temperatures | Daily Maximum Temperatures | Daily Minimum Temperatures | |||||||||
|---|---|---|---|---|---|---|---|---|---|---|---|---|
| South | North | South | North | South | North | |||||||
| Rates* | R2 | Rates* | R2 | Rates* | R2 | Rates* | R2 | Rates* | R2 | Rates* | R2 | |
| January | 0.229 | 0.1278 | 0.208 | 0.0642 | 0.373 | 0.1279 | 0.269 | 0.0439 | 0.177 | 0.0979 | 0.108 | 0.0282 |
| February | 0.405 | 0.1885 | 0.490 | 0.2005 | 0.498 | 0.1531 | 0.511 | 0.1267 | 0.303 | 0.1358 | 0.380 | 0.1566 |
| March | 0.594 | 0.3204 | 0.715 | 0.3642 | 0.880 | 0.3426 | 0.850 | 0.3098 | 0.388 | 0.2238 | 0.526 | 0.3302 |
| April | 0.302 | 0.1658 | 0.425 | 0.2701 | 0.661 | 0.2948 | 0.629 | 0.2846 | 0.261 | 0.2117 | 0.425 | 0.3950 |
| May | 0.207 | 0.0925 | 0.351 | 0.2102 | 0.304 | 0.0826 | 0.437 | 0.1489 | 0.182 | 0.1441 | 0.373 | 0.3531 |
| June | 0.209 | 0.1255 | 0.243 | 0.1174 | 0.310 | 0.1195 | 0.255 | 0.0667 | 0.213 | 0.3399 | 0.347 | 0.4256 |
| July | 0.283 | 0.0162 | 0.234 | 0.1006 | 0.536 | 0.2666 | 0.448 | 0.18070 | 0.281 | 0.2869 | 0.336 | 0.3214 |
| August | 0.171 | 0.0379 | 0.145 | 0.0321 | 0.283 | 0.0590 | 0.203 | 0.0341 | 0.146 | 0.0676 | 0.207 | 0.1198 |
| September | 0.278 | 0.1660 | 0.271 | 0.1762 | 0.347 | 0.1088 | 0.250 | 0.0614 | 0.322 | 0.2904 | 0.381 | 0.3388 |
| October | 0.154 | 0.0489 | 0.113 | 0.0260 | 0.347 | 0.0993 | 0.238 | 0.0479 | 0.359 | 0.2415 | 0.320 | 0.1669 |
| November | 0.210 | 0.0803 | 0.222 | 0.0848 | 0.143 | 0.0214 | 0.182 | 0.0296 | 0.326 | 0.1516 | 0.264 | 0.0974 |
| December | 0.152 | 0.0732 | 0.187 | 0.0663 | 0.334 | 0.1440 | 0.268 | 0.0550 | 0.165 | 0.0608 | 0.196 | 0.0842 |
Disclaimer/Publisher’s Note: The statements, opinions and data contained in all publications are solely those of the individual author(s) and contributor(s) and not of MDPI and/or the editor(s). MDPI and/or the editor(s) disclaim responsibility for any injury to people or property resulting from any ideas, methods, instructions or products referred to in the content. |
© 2024 by the authors. Licensee MDPI, Basel, Switzerland. This article is an open access article distributed under the terms and conditions of the Creative Commons Attribution (CC BY) license (https://creativecommons.org/licenses/by/4.0/).
Share and Cite
Hao, C.; He, S. The Spatiotemporal Dynamics of Temperature Variability Across Mts. Qinling: A Comparative Study from 1971 to 2022. Sustainability 2024, 16, 9327. https://doi.org/10.3390/su16219327
Hao C, He S. The Spatiotemporal Dynamics of Temperature Variability Across Mts. Qinling: A Comparative Study from 1971 to 2022. Sustainability. 2024; 16(21):9327. https://doi.org/10.3390/su16219327
Chicago/Turabian StyleHao, Chengyuan, and Sunan He. 2024. "The Spatiotemporal Dynamics of Temperature Variability Across Mts. Qinling: A Comparative Study from 1971 to 2022" Sustainability 16, no. 21: 9327. https://doi.org/10.3390/su16219327
APA StyleHao, C., & He, S. (2024). The Spatiotemporal Dynamics of Temperature Variability Across Mts. Qinling: A Comparative Study from 1971 to 2022. Sustainability, 16(21), 9327. https://doi.org/10.3390/su16219327