Abstract
Areas covered with vegetation play a key role in life on Earth and should be inventoried in a clear and complete manner in order to improve the process of their protection and development. Data showing the amount of greenery in areas most deformed by humans, i.e., urbanized areas, are particularly important. Local governments need to know how to invest their limited resources in the quality of life of residents by supplementing the urban fabric with additional vegetation. Unfortunately, there are currently few proposals in the scientific literature that would allow us to uniformly determine the amount of greenery resources in different cities. This article presents a proposal for how to calculate the degree of greenness of cities based on remote sensing data. Additionally, a novel method, including 3 new spatial indicators, was proposed to help in planning the development of areas covered with vegetation, taking into account the spatial distribution of the local population. Results were calculated for the city of Lodz (Poland) using a comprehensive method, which employs original formulas based on satellite and LiDAR data to present the actual natural situation in a specific city. In consequence, the results showed a similar area of green areas as the official repositories, but these areas were much more dispersed than these public databases would suggest.
1. Introduction
Vegetation is a very important element of urban space that performs many key functions, such as protecting against air pollution, maintaining air humidity, mitigating extreme temperatures, and reducing noise levels, while also creating a positive esthetic impression [1,2,3]. Research shows that having green areas nearby increases the level of satisfaction with living in a given area [4]. Currently, over half of Poland’s population lives in cities, with forecasts indicating a further increase in the share of the urban population. Therefore, the issue of the presence and functioning of vegetation in urbanized areas is extremely important. Its size and diversity directly shape the esthetics of cities [5].
Despite the above-mentioned aspects, a trend of reducing areas with high-quality greenery in urbanized areas is currently being observed [6,7]. It turns out, however, that despite the inflated prices of space in cities, some local governments are more aware of the need to provide appropriate open space for public use [8]. These areas should be covered with vegetation and an appropriate greenery protection system should be implemented.
The topic of urban green spaces is becoming more and more important every year, which is reflected in the constantly growing number of studies and scientific articles on this topic (Figure 1) [9].
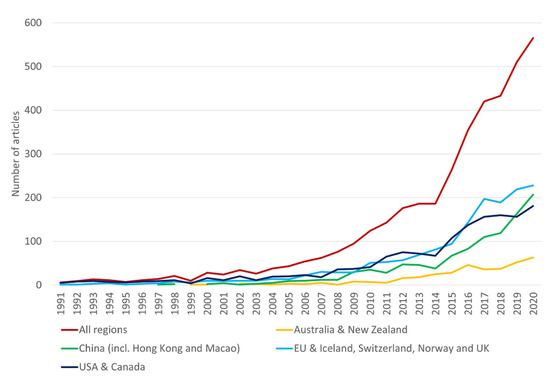
Figure 1.
The annual growth of articles dealing with UGS research by region.
Currently, it is difficult to pursue standardization in assessing the degree of greenness of cities within one country, let alone compare cities in different countries. However, a relatively new concept regarding urban greenery can be found in the literature. This which is the 3–30–300 rule, which specifies the minimum number of trees that should grow in residential areas. According to the author of the concept, there should be at least 3 trees for each residential building, an estate should be covered with at least 30% of tree crowns, and the distance from the nearest park or other green area to the place of residence should not exceed 300 m [10]. This concept, however, does not define what a green area is and what it is not. Moreover, there are several equivalent databases in Poland, differing both in terms of their classification of greenery itself and the estimation of its surface area [11].
An excellent example of a diverse approach to defining green areas is the summary developed by Taylor and Hochuli [12], which shows different ways of defining green areas (Table 1).

Table 1.
Six types of definition identified from the literature were used to describe ‘greenspace’.
Establishing a method for measuring the size of greenery is also problematic. According to the official repositories, urban green areas, usually presented in two-dimensional rather than three-dimensional units, only include green spaces that serve public functions, such as parks, lawns, and promenades [13]. However, it appears that this method of presenting the level of greenery in urban areas does not show the real situation since there are many areas with vegetation that are not included even though they perform very important functions [14]. Greenery located in developed plots, industrial and post-industrial spaces [15], and along roads and watercourses can be taken as an example. Additionally, the official reports use various aspects of greenery during classification (e.g., function, majority land cover).
The specific areas included in the official statistics are only measured by taking into consideration their planar surface. The important fact is that not only should the surface area covered by vegetation be taken into account, but so should the entire volume of such areas [16]. The density and condition of vegetation in a given area should also be taken into account [17]. These data can be obtained from remote sensing sources operating at low, medium, and high altitudes. In addition, there are IT systems (Geographic Information Systems, known as GIS) that enable the management and use of spatial data for multiple studies and analyses [18]. Another aspect of this is the fact that the size of green spaces in cities is not the only thing that matters. Their location and the ratio of their size to the number of city inhabitants also play big roles.
Lodz (51°36′25.79″ N, 19°25′15.59″ E) has both one of the largest percentages of areas covered with vegetation in terms of the total area of the city and one of the largest areas covered per inhabitant in Poland [19,20]. The green area per 1 person amounts to almost 50 m2. This is an impressive figure, but it does not take into account the actual possibility of staying in areas covered with vegetation and is limited to characterizing them using only one indicator, namely the surface area they occupy. For a city resident, an area of land occupied by tall, well-developed trees that provide shade and significantly influence the esthetics of the neighborhood means more than the same area consisting of low grass, meadows, or shrubs.
In cities, we most often deal with the uneven spatial distribution of inhabitants and greenery—the population tends to be concentrated in city centers, while greenery is more often found on the outskirts. A significant number of residents have dense buildings in their immediate surroundings, and often live without even the smallest patch of greenery. On the other hand, on the outskirts of cities, there are often urban forests, which count towards the overall balance of green areas, but at the same time few people live there. As a result, access to greenery is very uneven [21]. The important fact is that local citizens are much more likely to go to developing city regions which might be located near their place of residence [22]. The proportion of the population that has access to certain green resources in their place of residence can say a lot about the conditions and quality of life in individual cities [23].
One example of an attempt to create an indicator referring to the amount of green space in the vicinity of the place of residence of a local community is the Urban Neighborhood Green Index (UNGI) [24]. The developers of this indicator show uneven access to green spaces and they take into account publicly accessible areas equipped with anthropological objects such as parking lots, city furniture, playing fields, and water facilities. However, it does not take into account areas covered with vegetation to a no less significant degree than those officially recognized as green spaces, but which lack appropriate infrastructure.
A technical approach to the subject of urban green areas was presented by Jia et al. [25], who used mathematical formulas to present green spaces in relation to four aspects: its accessibility, divided into connectivity and walking distance, and its usability, divided into space enclosure and space availability. As a result, the division of urban green spaces was performed according to the different values of individual aspects.
Many spectral indices are used to analyze vegetation, among which the NDVI is the most popular [26,27,28]. It is used to analyze both aerial photos and satellite images in order to assess the size of plant biomass at various spatial scales, from single arable fields to global vegetation zones [29]; to recognize vegetation [30] and its condition [31]; to analyze the size of the projection area of leaves, or LAI—leaf area index [32]; to determine the amount of radiation absorbed by plants during photosynthesis [33]; to assess biomass [34]; and to establish many other factors.
An important feature of NDVI is its relationship with the “quantity” and “quality” of greenery present in a given area [35,36]. If the image pixel includes various objects (e.g., buildings, roadways with asphalt or concrete surfaces, tree crowns, or gardens and lawns), then the NDVI is the result of the NDVI coefficients of individual objects, weighted by their share in the pixel area [37].
In many studies, the topic of the urban greenery inventory, based on data from airborne laser scanning (ALS), has also been discussed [38,39]. Airborne laser scanning is a photogrammetric measurement method based on laser scanning, allowing us to record a given surface in the form of a point cloud representing the terrain. This measurement results in a very accurate surface model. The idea of airborne laser scanning is based on measuring the distance between the measuring equipment located onboard an aircraft or helicopter and the terrain points [40]. ALS has many advantages, such as independence from weather conditions (the cloud base is higher than flight altitude, with only heavy rain and fog having a negative impact) and lighting conditions (scanning at night), penetration through vegetation layers, a high density of spatial points, high accuracy when determining the Z coordinate, a short time to obtain the final product, and a relatively low cost when used for large areas [41].
In our review of the scientific literature, we focus on projects carried out mainly in Poland, as they relate to our natural conditions. An example of conducting an inventory of greenery was the research performed in Wrocław, where authors collected and processed, among others, aerial digital photos (10 cm resolution) and aerial laser scanning data (with a density of 15 points m−2) [42]. They used these data to prepare a Digital Terrain Model (DTM), a Digital Surface Model (DSM), a normalized Digital Surface Model (nDSM), and a so-called true orthophotomap. The final classification was obtained by applying a threshold of the minimum value of the Normalized Differential Vegetation Index (NDVI) ≥ 0.1, calculated from the pixels of the infrared orthophotomap (CIR—color infrared), and then integrating the resulting areas with the spatially corresponding elevation data. Based on the results obtained, the authors were able to classify urban greenery into three height classes, which provide better interpretative values than studies limited to the analysis of surface area.
A similar approach to the classification of two different types of urban objects—buildings and vegetation—was adopted by Grigillo and Kanjir [43]. They used digital aerial photography and laser scanning data to produce a DSM, and employed multispectral photogrammetric images to obtain a DTM. The second step was the automatic extraction of vegetation using object-oriented analysis, which they performed on orthoimages with three spectral channels—infrared, red, and green—with an added fourth channel known as the nDSM layer. Carefully selected segmentation parameters made it possible to isolate objects that were classified as “visible vegetation” or “shaded” areas using the NDVI. Then, the segmentation procedure was repeated separately for the shaded zones to isolate the vegetation hidden in them. The combined urban vegetation elements were further divided into high and low vegetation (above and below 1 m) based on the height attribute read from the nDSM.
Myeong et al. [44] also used high-resolution digital infrared images to divide urban space into trees and shrubs, lawns, bare soil, water, and impervious surfaces. Here, too, the challenges for the authors were the shaded areas, but also the large spectral similarities between the distinguished classes. Only repeated attempts at selecting and applying textures, masks, and majority filters allowed the accuracy of their classification to be increased.
Krukowski et al. [45] used high-resolution IKONOS 2 satellite images with a level of detail allowing for the precise allocation of individual pixels to land cover classes. They decided to distinguish two classes of urban greenery: high and low. The first step was to adopt an NDVI > 0.2 threshold to separate vegetation. Then, training fields for the two previously mentioned classes were determined and the supervised classification of areas covered with vegetation was performed. Taking into account the higher values of the indicator for tall vegetation observed after the field verification of the resulting fields, the authors used an additional discriminatory threshold of NDVI = 0.35. The two classes of vegetation obtained in this way—high and low—were the final result of the categorization.
The lower threshold of NDVI value = 0.3, classifying a given area as being covered with vegetation, was determined by researchers based on data from the city of Saint Petersburg, Russia, in the years 2002–2018 [46]. In their analysis, they showed a constantly decreasing green area due to the increase in the built-up area. The main goal of the analysis was to use the data produced in the spatial planning process in the city.
The original concept of using NDVI to assess the availability of vegetation in cities was presented by Będkowski and Bielecki [21]. They used this indicator as a measure of the size of vegetation resources and determined, using the Lorenz concentration curve, their accessibility to the inhabitants of Lodz. They stated that, due to the uneven distribution of the population and vegetation, access is very difficult, which is reflected in the fact that almost 80% of residents have only about 25% of urban vegetation resources near their places of residence.
The authors of works on forest areas [47,48] unanimously point out that while monitoring vegetation in terms of surface cover or their biophysical condition is undertaken in many different ways, remote research on processes and characteristics of forest stands is still a challenge. However, geomatic techniques are increasingly replacing traditionally used terrestrial methods.
Mu et al. [49] focused on the dimidiate pixel model (DPM), which is a crucial tool for estimating fractional vegetation cover (FVC) via remote sensing. Traditional DPMs, which include vegetation and soil, do not fully consider the influence of shaded vegetation and shaded soil. The authors aimed to address this by processing shaded components separately. The improved DPMs outperformed traditional models, with the FVC value estimated using the improved models ranging from 0.04 to 0.13. The decrease in uncertainty by using the improved DPMs was over 50% compared to that seen using traditional models. The proposed DPM was more accurate and was expected to improve FVC estimation from satellite data.
An approach that was independent of function or cadastral division was demonstrated by Pouya and Majid [50]. They distinguished the share of UGS per capita for each district in the Battalgazi district in Turkey. They designated green areas based on satellite data, which were used to determine as many as 5 different plant indices—NDVI, EVI, PSSR, GNDVI, and NDWI—and then performed unsupervised land classification. As a result of this process, an indicator of the share of actual areas covered with vegetation per capita was obtained for each district.
The popular NDVI is used to develop other indices which, according to their authors, are intended to better characterize the features of urban greenery. The Greenness Index (GI), or simply the Green Index, has been defined many times in the literature. Shekhar and Kumar [51] calculated it based on the NDVI value, where a positive value was taken to indicate a green class and a negative value was taken to indicate a non-green class. Then, a grid layer (20 m × 20 m) was overlaid onto a binary image of NDVI and the percentage of the area where NDVI > 0 was calculated. Yang et al. [52] calculated a Green Index for a whole city based on the manual classification of low-altitude images. Abudaleb et al. [28] calculated the Greenness Index as the percentage of each study region’s area divided by the area of the green classes. Area coverage for every land cover class was determined subsequent to Random Forest image classification, which is based on a machine learning algorithm.
One way to assess the size of greenery resources in a given location is to obtain information about the amount of biomass in a given location. To conduct this, Costa Ribeiro et al. [53] used high-resolution satellite data to examine the potential for CO2 absorption in the ecological parks of the campus of the Brazilian University in Planatina. However, these activities only make sense in a limited area due to more demanding data and necessary sampling, on the basis of which the data obtained can only be interpreted.
A completely different method of estimating urban greenery was used by Lu et al. [54], who conducted a review of the possibilities of using Street View (SV) images for this purpose. After an in-depth analysis of the available literature, the authors distinguished 3 basic methods of estimating urban greenery: manual analysis, unsupervised classification, and supervised deep learning. While the first two are very time-consuming, the third requires high computer processing power and a very large number of images.
In addition, the very idea of estimating urban greenery using SV images is only a generalization of the actual state of affairs and, as the authors themselves explain, cannot replace traditional remote sensing methods, including the use of the NDVI.
In the scientific literature, there are also works that, in addition to assessing the current state of affairs, also try to analyze trends from recent years and, on this basis, predict changes that may occur in the near future. An example of this is the research carried out in Saint Petersburg, Russia, using Markov chains, thanks to which the authors forecasted further changes in the city’s coverage, including greenery, until 2028 [55].
The aim of this work is therefore to develop measures that enable a clear presentation, both qualitatively and quantitatively, of the amount of greenery in a large city (over 100 km2) and, consequently, to demonstrate its spatial diversity and prioritize places for potential investments in greenery, taking into account the uneven distribution of the population. Measurement methods should be reflected in the form of indicators that can be used in different locations. Due to the fact that this issue, according to the authors’ best knowledge, has not been previously described in such a broad scope in the scientific literature, the authors decided that it was necessary to consider this topic and develop an appropriate methodology.
2. Materials and Methods
2.1. Study Area
Lodz is a city located in central Poland covering an area of 293 km2, which makes it the fourth largest city in Poland. The city has a population of 658,000 inhabitants, which also ranks 4th in Poland regarding the number of inhabitants [19].
Despite 600 years of city rights, it has had a typical urban character for only 200 years. For the first 400 years, Lodz was an agricultural town, and only developed after 1820 as a large industrial center [56]. The current urban layout of the city center is a consequence of the economic changes in the first half of the 19th century. The basis for the construction of the New Town was an octagonal market square with perpendicular urban axes [57]. Many factories were located around the center, along with residential buildings for their employees. Despite the dense and unfriendly development, many parks were built based on the presence of watercourses, which were a source of energy to power machines in the factories [58].
Currently, Lodz is a city with a developed network of green infrastructure and continues to create new places for rest and recreation, including 8 new parks in the 21st century alone [59]. The issue is that a lot of green areas are located away from the housing estates.
2.2. Research Time Frame
All data necessary for this study were collected in 2011–2020. LiDAR point cloud data were the first type of data obtained in this study. These were generated as part of the IT system project for the Country’s Protection Against Extreme Hazards (Informatyczny System Osłony Kraju, ISOK) in 2011. These were the latest publicly available laser scanning data when work on the described method began in 2018. Satellite images of Lodz were taken from 2015. The reason for selecting these images was the fact they showed the last available cloudless scenes for the entire area of Lodz in the middle of the growing season when the research began. In 2018, the latest vector data were obtained from the BDOT, EGiB, and ŁOG spatial databases. Demographic data also came from 2018. The last field inventory was performed in August 2020. As a result, the results obtained in this work present the actual state of urban greenery in 2018.
2.3. Data Sources
This work used a number of spatial data sources whose purpose was to provide information on land cover along with numerical demographic data.
The basic sources presenting data related to the presence of vegetation in a given area were multispectral satellite images. The research used a Landsat 8 satellite scene from July 3, 2015 (track p189, line r024), downloaded from the US Geological Survey (EarthExplorer).
The next component involved airborne laser scanning data from the state ISOK project. These data were obtained from the Main Center for Geodetic and Cartographic Documentation (Centralny Ośrodek Dokumentacji Geodezyjnej i Kartograficznej, CODGiK). The airborne laser scanning (ALS) point cloud had a density of 12 points m−2. The materials for the study area were up to date in 2011. LiDAR data provided information on the volume of vegetation in the given area, including Vegetation Height Model (VHM) calculations.
The main repositories providing geographical data on the topography of Poland are the Land and Property Register (Ewidencja Gruntów i Budynków, EGiB) (Figure 2), the Topographic Objects Database (Baza Danych Obiektów Topograficznych, BDOT10k), the General Geographic Objects Database (Baza Danych Obiektów Ogólnogeograficznych, BDOO), and thematic maps produced by local geodesy centers (e.g., Green Space Map by Lodz Geodesy Center (Łódzki Ośrodek Geodezji, ŁOG). The databases are public resources that describe land use types in terms of their functionality. In order to properly refer to the currently applicable standards related to the determination of the degree of greenness of individual cities, these official spatial databases were taken into consideration and carefully analyzed. The process included the verification of the definition of the main areas, which were classified as greenery, and the checking of their borders.
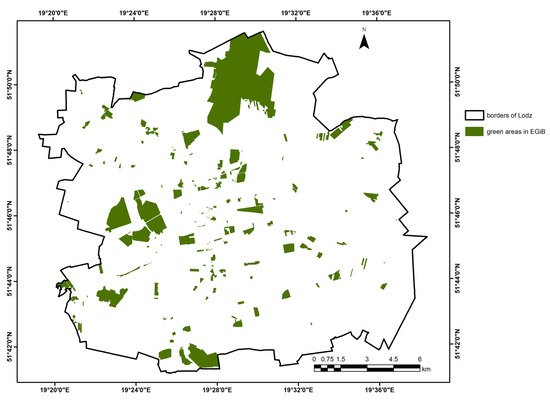
Figure 2.
The arrangement of green areas in Lodz according to EGiB.
Unfortunately, these databases are inconsistent. To address these imperfections of current greenery inventory systems, our proposal (detailed below) describes a different way of assessing the size of greenery resources, regardless of their origin and assigned functions. Data from specific sources use different classification systems and are spatially inconsistent (e.g., EGiB-based recreation areas, BDOT10k-based forest or shrub areas, and parks in the Urban Green Map ŁOG cover the same topographical part but have different terminology for the individual boundaries—Figure 3). For example, a part of a park in the ŁOG database is not classified as a recreational area in EGiB.
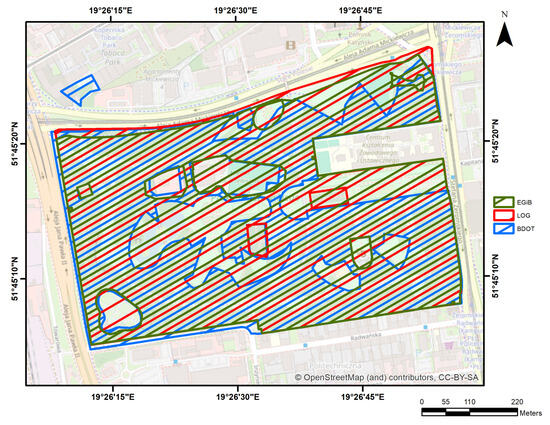
Figure 3.
A comparison of the boundaries of green areas according to different databases.
Data were created by the Lodz Geodesy Centre (ŁOG) as part of the center’s mission, which involves producing cartographic studies showing green areas within the administrative boundaries of the city of Lodz. Those geodetic data form the basis of the statistics on the size of green spaces reported in state statistics, i.e., in the yearbooks of the Central Statistical Office and in the local database (Figure 4).
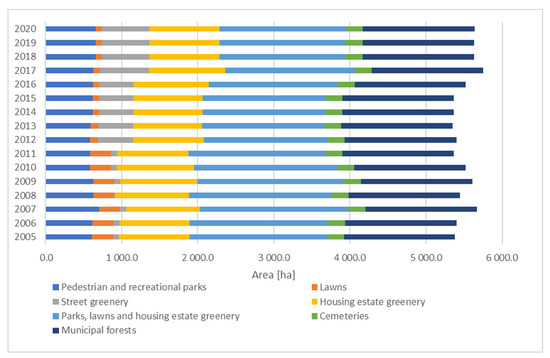
Figure 4.
Greenery in Lodz in 2005–2019.
The Land and Property Register (EGiB) database primarily contains information about properties assessed using field or photogrammetric surveys [60]. It is used to perform tasks in the areas of economic planning, spatial planning, tax and benefit determination, the identification of assets in land and mortgage registers, official statistics, and asset management. EGiB data are used, inter alia, by tax authorities and local authorities (municipalities) for the purpose of creating spatial inventories of target areas [61].
The land and property register includes information on the location, boundaries, areas, and types of land use (Table 2).

Table 2.
Types of land use according to EGiB, with corresponding acronyms, and their share in the entire area of the city of Lodz in 2021.
Demographic data were obtained from the voter database and assigned to locations based on the distribution of residential buildings in individual housing estates. We deliberately did not use the Universal Electronic System for Registration of the Population (Powszechny Elektroniczny System Ewidencji Ludności, PESEL) and geolocation was performed based on address points. The reasons for such actions were the inconsistency of data in the PESEL register and carelessness when entering data manually (e.g., many errors, entering full street names, using the initials of the name or entering data without a name, using Polish characters or not, as shown in Figure 5). After several attempts to combine demographic data and address points, it was possible to connect only 70% of the entries from the PESEL register. Due to the time-consuming nature of this activity, which would contradict the purpose of developing the method, the PESEL database was abandoned in favor of estimating the population distribution based on voter registries in individual city estates.
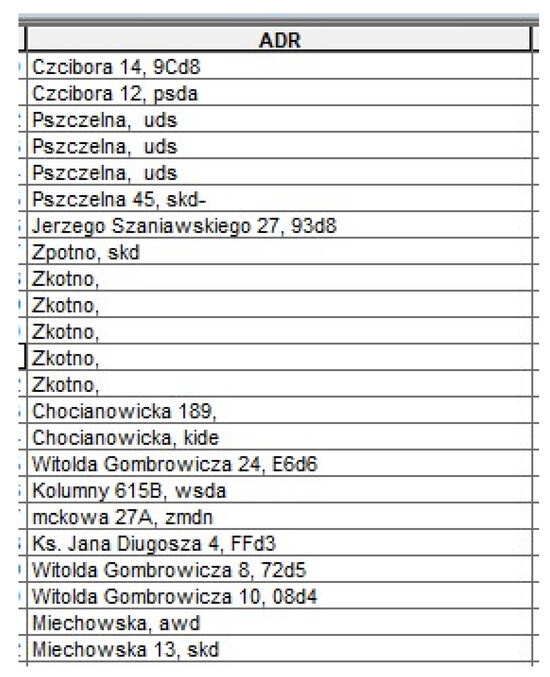
Figure 5.
An example of data negligence in the PESEL register (e.g., missing letters, different replacement for polish letters).
The field inventory was intended to provide data that could not be obtained using remote sensing. The purpose of the inventory was to calculate the actual height (thickness) of the greenery involved in the photosynthesis process. The research included trees that were located directly at street junctions. In this case, the height of the bottom of the tree crowns was measured. The location of these trees was deliberately selected so that the height of the bottom of the crown was, on average, as high as possible (e.g., we pruned tree crowns at intersections to improve visibility and safety [62]). This procedure was employed to guarantee that the final results obtained with this method would be no worse than the real ones (assuming that tree crowns are pruned everywhere) and at the same time to provide a common basis for comparative calculations between cities or different parts of one city.
3. Indices
To determine the amount of greenery resources available in the place of residence, we developed three indicators: the Greenness Index (GI), Greenery Deficiency Index (GDI) and Greenery Participation Index (GPI). Below, we present the basic assumptions relating to the construction of these indicators. The starting point for their determination is the Normalized Difference Vegetation Index, NDVI, which is commonly used in remote sensing [24,63]:
NIR—near-infrared band;
RED—red band.
The NDVI value for individual land cover forms depends on their spectral properties, i.e., their ability to reflect, absorb, and transmit incoming electromagnetic radiation [64]. In the case of vegetation, a simple model of the relationship between radiation and the vegetation layer is presented in Figure 6 below: the incoming light flux Φ is initially divided into three fluxes, ΦRi, ΦAi, and ΦTi, (i = 1). The mutual relations of these streams depend on the properties of the green layer. It should be noted that their normalized values, φri = ΦRi/(ΦRi + ΦAi + ΦTi), φai = ΦAi/(ΦRi + ΦAi + ΦTi), and φti = ΦTi/(ΦRi + ΦAi + ΦTi), satisfy the condition φri + φai + φti = 1.
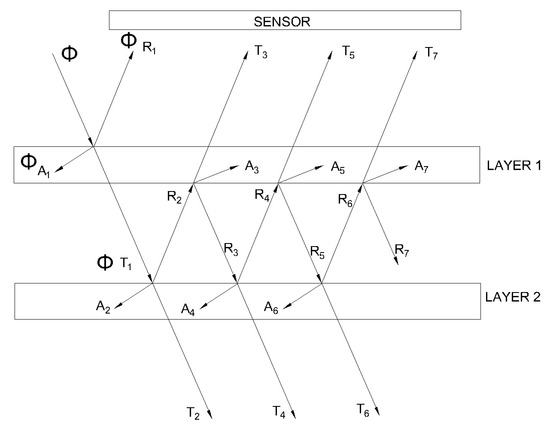
Figure 6.
Reflection, transmission, and absorption of radiation by the vegetation layer. For better drawing readability, the symbols of light fluxes were changed, i.e., ΦRi = Ri, ΦAi = Ai, and ΦTi = Ti. Refraction angles are not taken into account.
Any increase in the thickness of the vegetation layer may be considered as the addition of subsequent layers (layer 2 in Figure 5). This is known because basic research has shown that vegetation has a multi-layered structure, which is expressed by the well-known LAI index used in remote sensing [65]:
FA—total foliage area;
TA—the projection area of the tree crown on the horizontal plane (terrain).
The LAI index reaches a value of up to 19, with a typical average range of 6 to 8 for forests and from 2 to 4 for cereal crops [32].
Increasing the thickness of the plant layer, i.e., the number of layers, will cause the course of radiation fluxes to change: the transmitted flux ΦT1 is now the flux incident on the second layer of vegetation and can be divided into the fluxes of radiation that is reflected (ΦR2), absorbed (ΦA2), or penetrates further (ΦT2). Let us also note that the radiation reflected from the lower layer (ΦR2 flux) now encounters the upper layer, where it is again divided into reflected (ΦR3), absorbed (ΦA3), and transmitted (ΦT3) radiation streams. This process takes place many times between both layers, as a result of which a sensor placed above the vegetation can register the resulting sum of radiation from several streams: ΦR1 + ΦT3 + ΦT5 + ΦT7 + …
If we assume that the vegetation block is composed of a larger number of layers, then the presented model becomes somewhat complicated, the streams considered here become fractional parts of other streams, and a significant part of the radiation remains ‘trapped’ in the vegetation layer. For example, assuming constant values φr = 0.5, φa = 0.25, and φt = 0.25, according to our simple model, we obtain the following values of fluxes using the sensor for the model presented in Figure 6:
ΦR1 = 0.5Φ
ΦT3 = (0.25 × 0.5 × 0.25) Φ = 0.0313 Φ
ΦT5 = (0.25 × 0.5 × 0.5 × 0.5 × 0.25) Φ = 0.0078 Φ
ΦT7 = (0.25 × 0.5 × 0.5 × 0.5 × 0.5 × 0.5 × 0.25) Φ = 0.0020 Φ
Therefore, the reflected radiation ΦR1 reaches the sensor, while the remaining fluxes constitute a small part of the received radiation. It is easy to see that the total radiation flux ΦR1 + ΦT3 + ΦT5 + ΦT7 + … reaching the sensor is not directly proportional to the number of layers. Moreover, the proportions of reflected, absorbed, and transmitted radiation vary depending on the wavelength of light.
It may also be interesting to note that in the case of herbaceous plants their surface areas may be twice or at most three times higher than the surface areas of the soil they occupy. For shrubs, the LAI coefficient is already 5 to 7; for trees, it can reach a value of 10 and more [66].
The presented model may provide a partial explanation of the phenomenon of saturation of the NDVI, which means that the NDVI calculated on the basis of satellite images increases slightly or even does not increase at all when an appropriate green layer thickness is achieved [67,68,69].
3.1. Greenness Index
The purpose of our proposed Greenness Index is to express the amount of greenery resources in the basic fields analyzed. When constructing it, we gave special importance to the NDVI saturation point (NDVIsat). We assumed that up to this point, the indicator of the amount of greenery is the NDVI value itself, and that the measure of the amount of greenery is the thickness of the vegetation layer.
The mathematical notation of the Greenness Index is as follows:
—height of vegetation in the i-th basic field;
—average height of the crown base;
—value for the saturation point;
—height of the highest greenery (trees) in the given area (in the city);
—NDVI value in the i-th basic field;
—NDVI value for the saturation point.
Due to the fact that the values in the above formula decrease, Formula (4) may be simplified to the following form:
Thanks to this structure, the Greenness Index can reach a value of 0 ≤ GI ≤ 1, with GI = 0.5 at the saturation point. The importance of individual components of Equation (4) depends on the height of the greenery. For areas with low greenery height values, the value of the NDVI is crucial, but as the green height increases, the average green height in terms of the Vegetation Height Model [70] becomes more and more important, while NDVI becomes less important (in accordance with the description of the problem of saturating the NDVI value).
As a result of limiting the flow of light energy to the zones under the tree crowns, resulting from the screening properties of the layer of the assimilation apparatus contained mainly in the crown layer, a zone without active greenery is formed under the trees (Figure 7). This does not participate in the regulation of light fluxes (apart from their reflection) from a few branches and trunks and thus does not significantly affect the NDVI value. It turns out that the height of vegetation above the NDVI saturation point does not indicate the actual height of assimilating greenery, and so only the length of the tree crown should be taken into account.
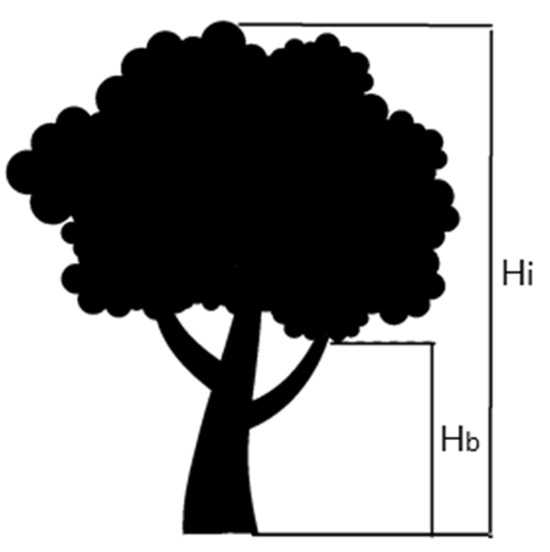
Figure 7.
Measures describing the components of the GI formula.
The phenomenon of tree branches dying due to a lack of adequate light is well known to occur in tree communities forming stands in forest areas [71]. Unfortunately, we did not have the appropriate dimensions for urban conditions, and so we proposed a certain simplification, assuming that the height of the crown base is the height to which urban trees are de-branched in order to ensure visibility and passage for pedestrian and mechanizedtraffic. Thus, the value of the green height hi determined from the VHM should be reduced by the average height of the crown base hb.
We determined the value of hb on the basis of the measurement of 237 trees located in the area of 69 street intersections. These intersections were selected from all 1418 road intersections of main, local, and collector roads in Lodz. Overall, 336 of them had exactly 4 outlets. In the next step, 20% of the places where the field inventory was carried out were randomly selected. On streets leading to intersections, at least one tree closest to the intersection was selected. It should also be noted that the value of 0 was used for negative NDVI values. In such cases, we did not take this value into consideration since it would be reduced when calculated in the formula. In our study, the value of hb was set to 2.9 m and the average value of Hi (the height of a tree) was set to 11.7 m.
3.2. Greenery Deficiency Index
The Greenness Index GI can be easily transformed into a value we call the Greenery Deficiency Index or GDI (5). Its purpose is to express the size of the greenery deficiency in the analyzed i-th basic field, and thus signal the need to supplement it:
—the value of the Greenness Index in a i-th field.
In the form proposed in (6), the GDI indicator meets the condition 1 ≤ GDIi ≤ 0, with a value of 1 in areas without greenery and 0 where there is fully developed vegetation. The GDIi index therefore expresses the postulate (expectation) that, in a given i-th area, the ‘amount’ of greenery corresponds to the location of the hmax point (Figure 8), which may be considered optimal so that, at least theoretically, it may also be associated with NDVImax, i.e., the highest values of vegetation height and NDVI in the study area. In this approach, GDIi = 0 would correspond to the areas of urban parks or forests, but it is difficult to expect these areas to be inhabited, as dense buildings exclude the existence of richly developed vegetation. Therefore, for inhabited areas, a different limiting, empirically determined optimal value of the GIopt index may be adopted. To determine it, NDVI measurements should be performed in areas where the process of shaping the buildings and the accompanying greenery has been completed, and so it can be assumed that the observed condition is an expression of a certain permanent balance and, additionally, can be accepted by the local community. Bielecki and Będkowski [72] showed that certain characteristic areas of the city of Lodz have specific, non-normal distributions of NDVI values and suggest that the most typical values for them should not be average values, but modal ones, as these are the most frequently occurring values. Assuming GIopt in a model generated by incorporating the modal value of NDVI in inhabited areas instead of NDVIsat, the quotient GIi/GIopt should be introduced into Equation (6) instead of GIi, so that it takes the following form:
where 1 ≤ GDIi ≤ 0.
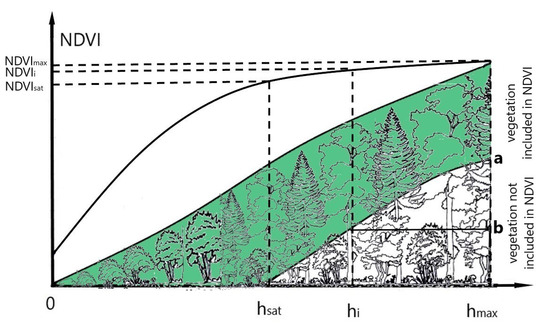
Figure 8.
Interrelationships of the NDVI and the height of vegetation: after exceeding the saturation point (hsat, NDVIsat), the NDVI indicator does not increase in proportion to the increase in the height of the vegetation layer; line a indicates the limit of dying of the tree branches due to the lack of light energy; line b indicates the height to which the trees are stripped of their branches in urban settings to ensure visibility and communication.
The GDI is directly proportional to the size of the greenery deficit in a given area, but the nature of this relationship, due to the assumptions made (Formula (5)), is not linear. However, GDI has an ordering nature, i.e., it ranks the regions (basic fields) according to the increasing size of the greenery deficit.
3.3. Greenery Participation Index
For the determination of the distribution of places with a shortage of greenery, assessed using the GDI, to be complete, i.e., to correspond to real needs, it is also necessary to take into account parameters characterizing the population distribution. We proposed the establishment of a Greenery Participation Index (GPI) for this purpose. The division of green areas in cities should be determined on the basis of population size, population density, and the usability of urban districts [73].
To calculate GPI (9), two auxiliary indices were used—the Greenery Deficiency Index GDI (6) and (7) and the Local Population Index LPI (8):
is the number of inhabitants in a given field.
is the highest value of the number of inhabitants in one basic field.
In this approach, LPIi becomes a weight, i.e., an indicator determining the rank of the i-th basic field, because we assume that the urgency of expanding greenery is also directly proportional to the number of inhabitants. It is worth noting that, as in the case of calculating the GDI (6) and (7) another value can be used instead of Pmax as the optimal reference level for population density (Popt). However, additional studies are necessary to determine this. It is possible that this number would be set at different levels depending on the nature of the current development, but it would always express the best (optimal) condition in a given area, i.e., one corresponding to the desired (or socially accepted) population density.
Ultimately, the GPI should therefore be calculated as follows:
The calculated indicator takes into account both the vegetation already existing in a given field, its adjacent basic fields, and the number of inhabitants in a specific field. This indicator is, again, of an ordering nature, i.e., it ranks basic fields (30 m × 30 m), determining the order regarding the places which experience the lowest quality of life in terms of the participation of residents in the surrounding greenery. The lower the value, the better the situation.
The presented concept of determining indicators with which to calculate the Greenery Participation Index (GPI) must also take into account corrections resulting from the heterogeneity of urban space. In the simplest terms, these consist of three forms of coverage: vegetation, impervious, and soil + water. This is described using the VIS Model [74]. However, we believe that in the conditions of the Central European temperate climate, i.e., with relatively abundant precipitation, it is difficult to expect that areas of soil not covered with vegetation will be significant in terms of size in cities. Rather, as we observe, these are transitional states—any exposed surface becomes green very quickly, first with herbaceous vegetation, and then with shrubs and trees. This is a process of natural succession and is so intense that owners of temporarily unused plots must clean them regularly to prevent the excessive development of shrubs and woody vegetation. This is mainly dictated by legal concerns, because the removal of large trees, if they exceed certain size limits, involves significant costs in environmental fees. So, in our cities, apart from vegetation, we basically only find impervious surfaces and water, the latter of which, as they are uninhabited, are excluded from our considerations.
In urban conditions, any image pixel or base field is most often a mixture of the above-mentioned land cover forms. The NDVI determined for them is related by a linear function to the fractional cover of vegetation f and its specific NDVI, which we will now denote as NDVIV, and the specific NDVII value for impervious areas, i.e., built-up areas—roofs of buildings, sidewalks, communication areas [75,76,77]:
An NDVI value close to zero is appropriate for impervious land cover (NDVII ≈ 0), while high positive values denote various types of vegetation cover. In the literature for our conditions, different threshold values are assumed between NDVII and NDVIV, from 0.1 to 0.3 or even 0.6, depending on the type of remote sensing data used, the image properties, and the season [78]. If, for example, NDVIV = 0.8, NDVII = 0.1 and vegetation fractional cover f = 0.5, then the resulting value of NDVI = 0.45 will be recorded in a basic field. We obtain the same value for a basic field in which NDVIV = 0.45 and f = 1. Therefore, the lack of vegetation in part of such a basic field may result in a given region being classified, based on its total NDVI, as an area with a significant greenery deficit, while in fact there may be no greenery in the built-up part, while the remaining part of the area may be covered with sufficiently well-developed vegetation.
In order to avoid false classification, the value of the NDVI calculated using Formula (1) in a given basic field should be corrected, taking into account the surface share of vegetation f and the NDVII of the part of the area not covered with vegetation. For this purpose, we transform Formula (10) accordingly:
NDVIcor—corrected index value;
NDVI—index value calculated using Formula (1);
NDVII—index value for the impervious area;
f—surface share of the area covered with vegetation.
Because it can mostly be assumed that NDVII = 0, we obtain the following:
In practice, determining fractional cover f may prove difficult because it requires the processing of data on land cover with infrastructural elements, such as buildings, streets, sidewalks, concrete squares, etc., coming from geometric databases, e.g., BDOT. One solution may be to use classified LiDAR laser scanning point clouds for this purpose. Both solutions, however, are computationally very complex.
The assumptions and dependencies discussed above are presented schematically in Figure 7.
4. Results (Lodz Case Study) and Discussion
4.1. Spatial Data Arrangement
The city of Lodz was chosen as the study area because the authors of this work focus their research on this city. The fact that the authors live in Lodz, and thus know the research area very well and had the opportunity to empirically verify all results, was not without significance.
All basic spatial indicators were calculated based on defined basic fields in the shape of a square of 30 × 30 m, consistent with the pixel arrangement of the satellite image. It was decided that this size would be appropriate for calculations for cities with large areas over 100 km2. Within the city limits of Lodz, 325,691 basic fields were designated. This is a demanding number for a personal computer to process, especially considering the fact that one of the stages involved the development of LiDAR data, which can also be resource-intensive [79]. This is the main reason why the size of the basic field should not be too small and why the data should not be more detailed. Then, the vegetation deficiency index was calculated based on 90 × 90 m squares in order to show the situation in the pixel itself but also in the adjacent basic fields, giving an average value for them.
Utilizing the Landsat 8 satellite scene with a resolution of 30 m and bands 4 (red range, known as RED) and 5 (near infrared, known as NIR) were used to calculate the NDVI in pixels corresponding to the resolution of the original image, i.e., 30 m × 30 m.
4.2. NDVI Values and Saturation Point
The NDVI vegetation index was the basis for calculating the indices. Since the entire image of the city of Lodz was covered by one satellite scene, neither solar nor atmospheric correction of the images was performed. The index values ranged from −0.18 to 0.63.
To determine the relationship between NDVI and vegetation height in our study area, basic fields of 30 m × 30 m were designated. Out of 325,691, we only selected those basic fields that were covered with greenery completely, based on LiDAR data, as we wanted to focus solely on the thickness of the vegetation layer [40,80]. Then, the average height of greenery was determined by using an LAS to Raster function built into the ESRI ArcMap application [81]. The next task was to create a chart showing the dependence of the NDVI on the height of greenery.
The phenomenon of NDVI ‘saturation’ in our data is clearly visible in Figure 9, which shows the moving average plot of NDVI values versus vegetation height. A threshold was determined on the graph for which the value of the function f(x) increases rapidly and the amplitude of the NDVI value becomes smaller and smaller. This value was clearly visible and was adopted arbitrarily and this was how we determined the location of the saturation point (hsat = 1.2 m; NDVIsat = 0.3).
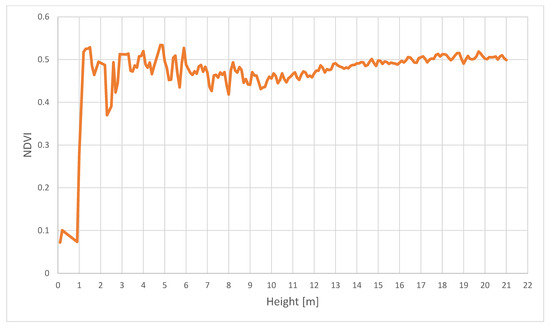
Figure 9.
NDVI values in relation to the average height of greenery in the basic fields, where greenery covered the fields 100%.
4.3. Greeness Index Values
By calculating the Greenness Index, a map was obtained of the degree of vegetation development in individual places in Lodz, which can be interpreted as the amount of greenery in a given location. The spatial distribution of this indicator is presented in Figure 10. The average value of the greenness indicator for Lodz is 0.58.
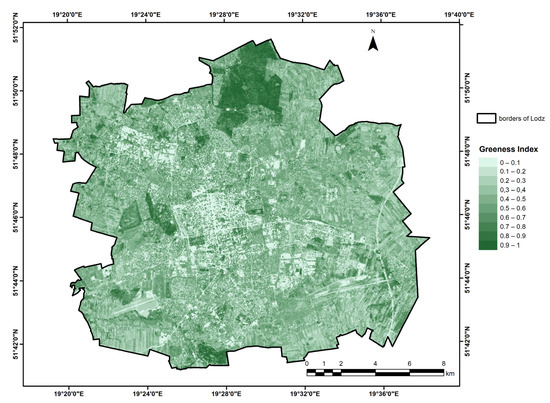
Figure 10.
The spatial distribution of Greenness Index values in Lodz.
Based on the designated formula, it was determined which areas of Lodz could be classified as green. This was achieved by determining the average value of the Greenness Index for official green areas according to data from ŁOG. This was equal to 0.68 (corresponding to 0.67% of all basic fields). Then, those basic fields were selected for the entire city of Lodz, in which the Greenness Index value was at least 0.68. As a result, it was found that the designated green areas in Lodz covered an area of 32.20 km2, which constituted 10.99% of the total surface area of Lodz (Figure 11).
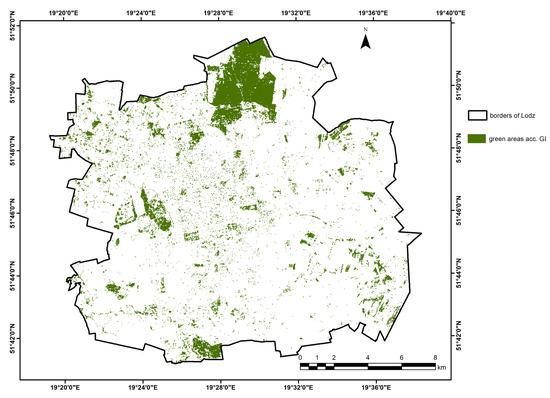
Figure 11.
Designated green areas when using the Greenness Index method.
4.4. Greenery Participation Index Distribiution in Lodz
The next goal was to designate green areas in the place of residence. The immediate vicinity of the place of residence was designated as a basic field of 30 m × 30 m along with the adjacent fields (Figure 12).
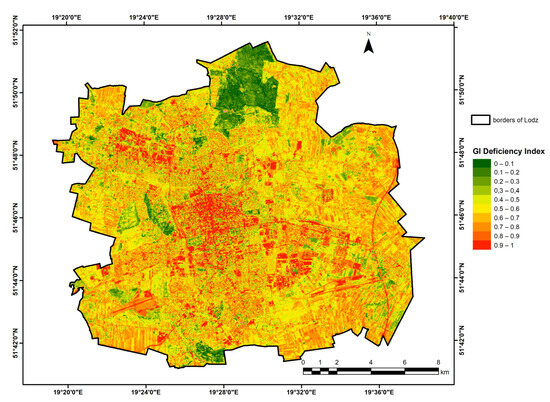
Figure 12.
The spatial distribution of the Greenery Deficiency Index in Lodz.
It is recommended that parks not be located more than 500 m from residential buildings (or to locate buildings at such distance from parks), which means a 10–15 min walk [82]. A study of the availability of green areas in large German cities with more than 100,000 inhabitants confirmed that almost 93% of the German population has access to green areas within a radius of 500 m from their home [83]. However, the quality of life of the city’s inhabitants is mostly determined by the size and condition of green areas in their places of residence. It was assumed that the immediate surrounding means a space contained within a radius of approximately 50 m, which is approximately equivalent to a square of 90 m × 90 m.
After the analysis, based on the Local Population Index (Figure 13), it turned out that approximately 157,000 inhabitants of Lodz had greenery in their place of residence, with a Greenness Index of 0.771 or more. This constitutes 24.1% of the total population (Figure 14).
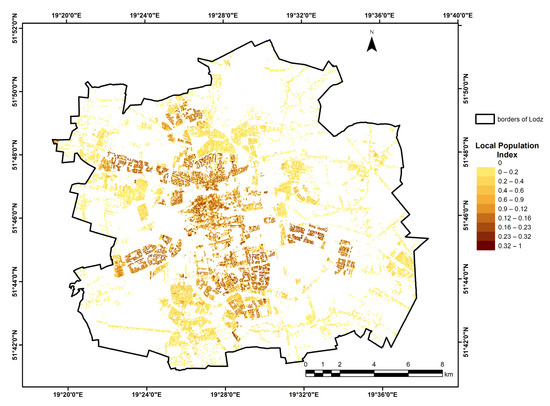
Figure 13.
Local Population Index (LPI) in pixels: 30 m × 30 m.
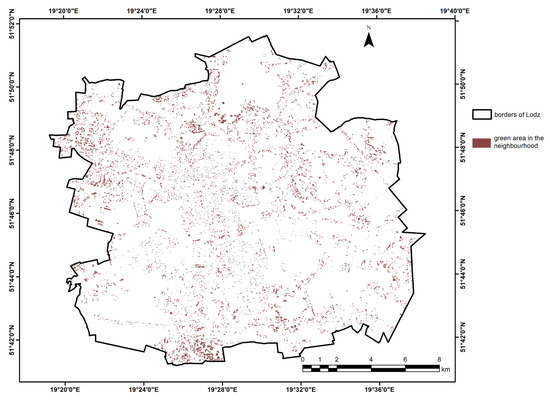
Figure 14.
The inhabited pixels 30 m × 30 m adjacent to a pixel with a GI > 0.68.
As a result, the Greenery Participation Index for replenishing greenery in a given place was also calculated for each basic field. The spatial distribution of the GPI is presented in Figure 15.
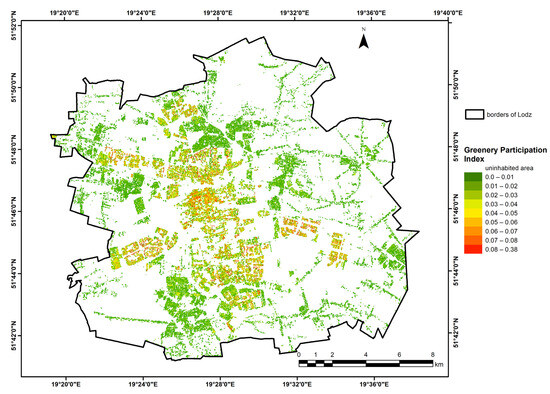
Figure 15.
The Greenery Participation Index (GPI) in Lodz.
The GPI values in Lodz range from 0 to 0.38. A value of zero in most cases means an uninhabited area. However, it is possible to achieve the maximum value of the Greenness Index for a given city in a residential area—in such a case, the GPI value will also tend to the lowest possible value, i.e., to 0. At the opposite extreme, the maximum values, i.e., above 0.30, indicate areas with a high concentration of population and at the same time little greenery.
For better readability, the entire methodology is presented graphically in Figure 16, which shows the source data, the overall workflow, and the final indicators.
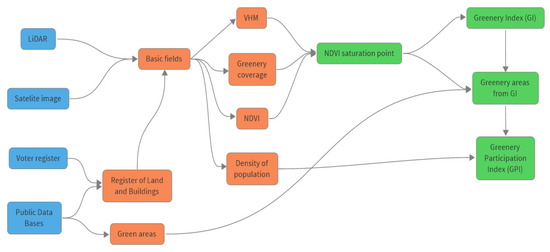
Figure 16.
Workflow and data flow between source data and output indicators.
5. Conclusions
The presented results (Figure 17) show that the actual amount of greenery does not differ significantly from that presented in official reports. The area of 30.77 km2, determined according to public data (Figure 18), is almost the same as that of green areas designated based on the Greenness Index (32.20 km2).
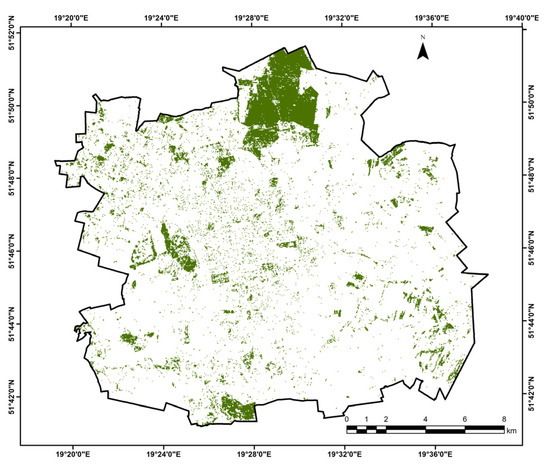
Figure 17.
Designated green areas as determined using the Greenness Index method.
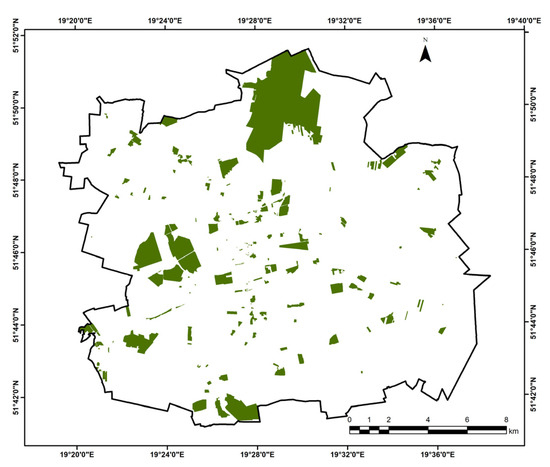
Figure 18.
The arrangement of green areas in Lodz according to EGiB.
The uneven distribution of green areas throughout the city is very visible. Taking into account the distribution of inhabitants, the rule is that the more people there are in a given area, the less vegetation there is.
This has direct consequences on the distribution of the Greenery Participation Index values in Lodz, with the highest values being recorded in the city center, where there is dense residential development, while green areas constitute only a small part of the city. It is also suggested to use the method described for planning purposes, especially those relating to the development of green areas in the city. The results clearly show that there are still many places in Lodz that require additional investment in urban greenery.
The proposed indicators combine satellite data with demographic data, allowing us to obtain additional information resulting from various sources.
Instead of relying on data that are not entirely clearly defined, a uniform method should be used, which allows for the definition of land cover in a more realistic and objective way and enables an indisputable comparison of the quality of life in different parts of the city, as well as among different cities.
The results obtained by using individual indicators, although they constitute a method for organizing individual places in terms of vegetation abundance, are not free from flaws. First of all, the method is based on simplified data. The resolution of 30 × 30 m presents general values. For particularly important areas, satellite or even aerial data should be used. Additionally, the automatic classification of the LiDAR point cloud may cause certain errors. The independent classification of smaller parts of the city would affect the certainty of the reliability of these data.
The great advantage of the method is that it uses only free and publicly available input data. This method does not require specialized knowledge, needing only the basics of GIS. However, one should initially become used to the process of obtaining data and attaching them. Moreover, the method does not require specialized equipment or large computing units. The average computer used for managing spatial data in city halls and offices has sufficient processing power. This method is also independent of the legal status, functions, and accessibility of a given area. It can help with decision-making processes regarding spatial changes in a city.
The method itself should be used in the process of spatial planning and management as well as in the implementation of activities aimed at nature protection.
Author Contributions
Conceptualization, A.B. and K.B.; methodology, A.B. and K.B.; software, A.B.; validation, A.B. and K.B.; formal analysis, A.B.; investigation, A.B. and K.B.; resources, A.B.; data curation, A.B.; writing—original draft preparation, A.B. and K.B.; writing—review and editing, A.B. and K.B.; visualization, A.B.; supervision, K.B.; project administration, K.B.; funding acquisition, K.B. All authors have read and agreed to the published version of the manuscript.
Funding
This research received no external funding.
Institutional Review Board Statement
Not applicable.
Informed Consent Statement
Not applicable.
Data Availability Statement
All data used in this study are publicly available online.
Conflicts of Interest
The authors declare no conflicts of interest. The funders had no role in the design of the study; in the collection, analyses, or interpretation of data; in the writing of the manuscript; or in the decision to publish the results.
References
- Białobok, S. Ochrona zadrzewień i roślin w najbliższym otoczeniu człowieka. In Ochrona Przyrodniczego Środowiska Człowieka; Michajłow, W., Ed.; PWN: Warszawa, Poland, 1976; pp. 223–245. [Google Scholar]
- Haber, Z.; Urbański, P. Kształtowanie Terenów Zieleni z Elementami Ekologii; Wydawnictwo Akademii Rolniczej im. Augusta Cieszkowskiego: Poznań, Poland, 2005. [Google Scholar]
- Łukasiewicz, A.; Łukasiewicz, S. Rola i Kształtowanie Zieleni Miejskiej: Skrypt dla Studentów Ochrony Środowiska; Wydawnictwo Naukowe Uniwersytetu im. Adama Mickiewicza: Poznań, Poland, 2022. [Google Scholar]
- Wu, W.; Wang, M.X.; Zhu, N.; Zhang, W.; Sun, H. Residential satisfaction about urban greenness: Heterogeneous effects across social and spatial gradients. Urban For. Urban Green. 2019, 38, 133–144. [Google Scholar] [CrossRef]
- Wysocki, C. Miasto jako specyficzne środowisko życia roślinności. Nauka Przyr. Technol. 2008, 2, 1–10. [Google Scholar]
- DeFries, R.S.; Rudel, T.; Uriarte, M.; Hansen, M. Deforestation driven by urban population growth and agricultural trade in the twenty-first century. Nat. Geosci. 2010, 3, 178–181. [Google Scholar] [CrossRef]
- Konijnendijk, C.C. A decade of urban forestry in Europe. For. Policy Econ. 2003, 5, 173–186. [Google Scholar] [CrossRef]
- Sdg, U. Sustainable development goals. In The Energy Progress Report; Tracking SDG; International Renewable Energy Agency: New York, NY, USA, 2019; Volume 7, pp. 805–814. [Google Scholar]
- Konijnendijk, C.C. Evidence-based guidelines for greener, healthier, more resilient neighbourhoods: Introducing the 3–30–300 rule. J. For. Res. 2022, 34, 821–830. [Google Scholar] [CrossRef]
- Farkas, J.Z.; Hoyk, E.; de Morais, M.B.; Csomós, G. A systematic review of urban green space research over the last 30 years: A bibliometric analysis. Heliyon 2023, 9, e13406. [Google Scholar] [CrossRef]
- Bielecki, A. Pluralizm Definicji Zieleni Miejskiej w Literaturze. Standardy, Aspekty Przyrodnicze i Techniczne. Konwersatorium Wiedzy Mieście, 2024; accepted, awaiting for the publication. [Google Scholar]
- Ustawa 2004: Ustawa z dnia 16 kwietnia 2004 r. o ochronie przyrody [Act 2004: Law of 16 April 2004 on the Protection of Nature] (c.t. Journal of Law of 20.10.2015 item 1651). Available online: https://isap.sejm.gov.pl/isap.nsf/DocDetails.xsp?id=wdu20040920880 (accessed on 19 October 2024).
- Taylor, L.; Hochuli, D.F. Defining greenspace: Multiple uses across multiple disciplines. Landsc. Urban Plan. 2017, 158, 25–38. [Google Scholar] [CrossRef]
- Cudny, W. Model przemian miasta postsocjalistycznego–przykład Łodzi. Stud. Miej. 2011, 4, 153–159. [Google Scholar]
- Archiciński, P.; Sikorski, P.; Sikorska, D.; Przybysz, A. Roślinność wieloletnich nieużytków miejskich–systematyka zbiorowisk, ich struktura i pełnione usługi ekosystemowe. Vegetation of perennial urban wastelands–syntaxonomy, structure and ecosystem services. Przegląd Geogr. 2021, 93, 341–363. [Google Scholar] [CrossRef]
- Batala, E.; Thekla, T. Street tree health assessment system: A tool for study of urban greenery. Int. J. Sustain. Dev. Plan. 2009, 4, 345–356. [Google Scholar] [CrossRef]
- Wężyk, P.; Bajorek-Zydroń, K.; Cisło-Lesicka, U. Monitoring teledetekcyjny zieleni miejskiej z pułapu BSP oraz satelitarnego. In Drzewa w Zieleni Miejskiej; Szwałko, P., Wężyk, P., Eds.; ProGea 4D sp. z o.o., Zarząd Zieleni Miejskiej w Krakowie: Kraków, Poland, 2021. [Google Scholar]
- Zarzecki, M.; Pasierbiński, A. Zastosowanie GIS i teledetekcji w badaniach szaty roślinnej. Wiadomości Bot. 2009, 53, 53–56. [Google Scholar]
- Niewiadomski, A. Struktura i znaczenie terenów zieleni w Łodzi na tle dużych ośrodków miejskich w Polsce. Acta Univ. Lodz. Folia Geogr. Phys. 2013, 12, 33–47. [Google Scholar] [CrossRef]
- Central Statistical Office. Available online: www.stat.gov.pl (accessed on 9 January 2024).
- Krzywnicka, I.; Jankowska, P. The accessibility of public urban green space. A case study of Białystok city. Acta Sci. Pol. Adm. Locorum. 2021, 20, 203–214. [Google Scholar] [CrossRef]
- Będkowski, K.; Bielecki, A. Ocena dostępności zieleni w miejscu zamieszkania w miastach z wykorzystaniem NDVI oraz krzywej koncentracji Lorenza. Teledetekcja Sr. 2017, 57, 5–14. [Google Scholar]
- Rouse, J.W., Jr.; Haas, R.H.; Deering, D.W.; Schell, J.A.; Harlan, J.C. Monitoring the vernal advancement and retrogradation (green wave effect) of natural vegetation. NASA Tech. Rep. Serv. 1974. E75-10354. Available online: https://ntrs.nasa.gov/citations/19750020419 (accessed on 19 October 2024).
- Bolkaner, M.K.; Asilsoy, B. Reinventing the Urban Neighborhood Green Index in the Context of Urban Ecology as a Conceptual Framework in Northern Nicosia, Cyprus. Sustainability 2023, 15, 13880. [Google Scholar] [CrossRef]
- Jia, J.; Zlatanova, S.; Liu, H.; Aleksandrov, M.; Zhang, K. A design-support framework to assess urban green spaces for human wellbeing. Sustain. Cities Soc. 2023, 98, 104779. [Google Scholar] [CrossRef]
- Jackson, R.D.; Huete, A.R. Interpreting vegetation indices. Prev. Vet. Med. 1991, 11, 185–200. [Google Scholar] [CrossRef]
- Tucker, C.J. Red and photographic infrared linear combinations for monitoring vegetation. Remote Sens. Environ. 1979, 8, 127–150. [Google Scholar] [CrossRef]
- Abutaleb, K.; Mudede, M.F.; Nkongolo, N.; Newete, S.W. Estimating urban greenness index using remote sensing data: A case study of an affluent vs poor suburbs in the city of Johannesburg. Egypt. J. Remote Sens. Space Sci. 2021, 24, 343–351. [Google Scholar] [CrossRef]
- Wang, T.; Skidmore, A.K.; Toxopeus, A.G.; Liu, X. Understory bamboo discrimination using a winter image. Photogramm. Eng. Remote Sens. 2009, 75, 37–47. [Google Scholar] [CrossRef]
- Lhermitte, S.; Verbesselt, J.; Verstraeten, W.W.; Coppin, P. A pixel based regeneration index using time series similarity and spatial context. Photogramm. Eng. Remote Sens. 2010, 76, 673–682. [Google Scholar] [CrossRef]
- Olpenda, A.S.; Paringit, E.C. Utilizing spectral reflectance and vegetation indices of Bougainvillea spectabilis for monitoring particulate air pollution in Metro Manila. In Proceedings of the 32nd Asian Conference on Remote Sensing, Taipei, Taiwan, 3–7 October 2011. [Google Scholar]
- Colombo, R.; Bellingeri, D.; Fasolini, D.; Marino, C.M. Retrieval of leaf area index in different vegetation types using high resolution satellite data. Remote Sens. Environ. 2003, 86, 120–131. [Google Scholar] [CrossRef]
- Badgley, G.; Field, C.B.; Berry, J.A. Canopy near-infrared reflectance and terrestrial photosynthesis. Sci. Adv. 2017, 3, 1–5. [Google Scholar] [CrossRef] [PubMed]
- Wang, L.; Hunt, E.R., Jr.; Qu, J.J.; Hao, X.; Daughtry, C.S. Towards estimation of canopy foliar biomass with spectral reflectance measurements. Remote Sens. Environ. 2011, 115, 836–840. [Google Scholar] [CrossRef]
- Jarocińska, A.; Zagajewski, B. Korelacje naziemnych i lotniczych teledetekcyjnych wskaźników roślinności dla zlewni Bystrzanki. Teledetekcja Sr. 2008, 40, 100–124. [Google Scholar]
- Skachkova, M.; Guryeva, O. Monitoring of the State of Saint Petersburg Green Spaces by Remote Sensing Data. Ecol. Ind. Russ. 2023, 27, 51–57. (In Russian) [Google Scholar] [CrossRef]
- Worm, A.; Będkowski, K.; Bielecki, A. Wykorzystanie wskaźników powierzchniowych i objętościowych z wysokorozdzielczych danych teledetekcyjnych do oceny wypełnienia roślinnością kwartałów miejskich w centrum miasta Łodzi. Teledetekcja Sr. 2019, 60, 5–20. [Google Scholar]
- Matasci, G.; Coops, N.C.; Williams, D.A.; Page, N. Mapping tree canopies in urban environments using airborne laser scanning (ALS): A Vancouver case study. For. Ecosyst. 2018, 5, 1–9. [Google Scholar] [CrossRef]
- Wehr, A.; Lohr, U. Airborne laser scanning—An introduction and overview. ISPRS J. Photogramm. Remote Sens. 1999, 54, 68–82. [Google Scholar] [CrossRef]
- Wirth, H.; Schilbach, G.; Wirth, A. Beitrag zur Analyse von Fernerkundungsdaten im SUB-PIXEL-Bereich. Vermessungstechnik 1987, 33, 56–59. [Google Scholar]
- Borowiecki, I.; Michalik, A. Klasyfikacja chmury punktów lotniczego skaningu laserowego z zastosowaniem programów Tiltan Tlid, Terrascan VRMesh. Infrastrukt. Ekol. Teren. Wiej. 2012, 1/III, 219–230. [Google Scholar]
- Kubalska, J.; Preuss, R. Wykorzystanie danych fotogrametrycznych do inwentaryzacji zieleni na terenach zurbanizowanych. Arch. Fotogram. Kartogr. Teledetekcji 2014, 26, 75–86. [Google Scholar]
- Grigillo, D.; Kanjir, U. Urban object extraction from digital surface model and digital aerial images. ISPRS Ann. Photogramm. Remote Sens. Spat. Inf. Sci. 2012, 1, 215–220. [Google Scholar] [CrossRef]
- Myeong, S.; Nowak, D.J.; Hopkins, P.F.; Brock, R.H. Urban cover mapping using digital, high-spatial resolution aerial imagery. Urban Ecosyst. 2001, 5, 243–256. [Google Scholar] [CrossRef]
- Krukowski, M.; Cebrykow, P.; Płusa, J. Klasyfikacja terenów zieleni w Lublinie na podstawie zdjęcia satelitarnego IKONOS 2. Reg. Barometer. Anal. Progn. 2016, 14, 35–44. [Google Scholar] [CrossRef]
- Alekseev, D.K.; Primak, E.A.; Kanukhina, A.Y.; Vinogradov, F.V. Dynamics of green areas in Saint Petersburg and climate risks. Adv. Curr. Nat. Sci. 2024, 8, 6–11. [Google Scholar] [CrossRef]
- Strzeliński, P.; Wencel, A.; Zawiła-Niedźwiecki, T.; Zasada, M.; Jagodziński, A.; Chirrek, M. Wybrane zdalne metody szacowania biomasy roślinnej w ekosystemach leśnych jako podstawa systemu raportowania bilansu węgla. Roczniki Geomatyki Ann. Geomat. 2007, 5, 7–16. [Google Scholar]
- Stereńczak, K. Lotniczy skaning laserowy (LiDAR) w badaniach na rzecz ochrony przyrody. Stud. Mater. Cent. Edukac. Przyr.-Leśnej 2009, 11, 135–143. [Google Scholar]
- Mu, X.; Yang, Y.; Xu, H.; Guo, Y.; Lai, Y.; McVicar, T.R.; Xie, D.; Yan, G. Improvement of NDVI mixture model for fractional vegetation cover estimation with consideration of shaded vegetation and soil components. Remote Sens. Environ. 2024, 314, 114409. [Google Scholar] [CrossRef]
- Pouya, S.; Aghlmand, M. Evaluation of urban green space per capita with new remote sensing and geographic information system techniques and the importance of urban green space during the COVID-19 pandemic. Environ. Monit. Assess. 2022, 194, 633. [Google Scholar] [CrossRef]
- Shekhar, S.; Kumar, S. Assessing the quality of urban environment through urban neighbourhood green index. In Proceedings of the ISPRS TC VIII International Symposium on “Operational Remote Sensing Applications: Opportunities, Progress and Challenges”, Hyderabad, India, 9 December 2014. [Google Scholar]
- Yang, J.; Zhao, L.; McBride, J.; Gong, P. Can you see green? Assessing the visibility of urban forests in cities. Landsc. Urban Plan. 2009, 91, 97–104. [Google Scholar] [CrossRef]
- da Costa Ribeiro, R.J.; Goulart, F.F.; Jacobson, T.K.B.; da Rocha, D.M.S.; Jaloretto, D.; Gonçalves, B.E.F.; Gerber, D. Beyond climate villains: Estimating carbon storage in urban parks using high-resolution imagery combined with field sampling. preprint 2024. [Google Scholar] [CrossRef]
- Lu, Y.; Ferranti, E.J.S.; Chapman, L.; Pfrang, C. Assessing urban greenery by harvesting street view data: A review. Urban For. Urban Green. 2023, 83, 127917. [Google Scholar] [CrossRef]
- Ionova, M.N. Application of Remote Sensing of the Earth for Monitoring Green Spaces in the City of Yakutsk. Vestn. Sev. Vostochnogo Fed. Univ. Im. M.K. Ammosova. Ser. Nauki Zemle 2020, 4, 57–64. [Google Scholar] [CrossRef]
- Liszewski, S. Lodz: Monografia Miasta; Łódzkie Towarzystwo Naukowe: Lodz, Poland, 2009. [Google Scholar]
- Koter, M. Geneza Układu Przestrzennego Łodzi Przemysłowej; Państwowe Wydawnictwo Naukowe: Warszawa, Poland, 1969. [Google Scholar]
- Wycichowska, B. Przegląd działań w zakresie ochrony i kształtowania zieleni zabytkowej miasta Łodzi. Probl. Ekol. Kraj. 2008, 22, 65–78. [Google Scholar]
- Durecka, I. Parki Jako Element Struktury Przestrzennej Miast Łódzkiego Obszaru Metropolitalnego. Ph.D. Thesis, University of Lodz, Lodz, Poland, 2017. [Google Scholar]
- Borsa, D.; Piot, B.; Munos, R.; Pietquin, O. Observational learning by reinforcement learning. arXiv 2017, arXiv:1706.06617. [Google Scholar]
- Obwieszczenie Ministra Inwestycji i Rozwoju z dnia 3 stycznia 2019 r. w sprawie ogłoszenia jednolitego tekstu rozporządzenia Ministra Rozwoju Regionalnego i Budownictwa w sprawie ewidencji gruntów i budynków (Dz.U. 2019 poz. 393). Available online: https://isap.sejm.gov.pl/isap.nsf/download.xsp/WDU20190000393/O/D20190393.pdf (accessed on 19 October 2024).
- Rozporządzenie Ministra Infrastruktury z dnia 24 czerwca 2022 r. w sprawie przepisów techniczno-budowlanych dotyczących dróg publicznych (Dz.U. 2022 poz. 1518). Available online: https://isap.sejm.gov.pl/isap.nsf/download.xsp/WDU20220001518/O/D20221518.pdf (accessed on 19 October 2024).
- Bannari, A.; Morin, D.; Bonn, F.; Huete, A.R. A Review of Vegetation Indices. Remote Sens. Rev. 1995, 13, 95–120. [Google Scholar] [CrossRef]
- Carlson, T.N.; Ripley, D.A. On the Relation between NDVI, Fractional Vegetation Cover, and Leaf Area Index. Remote Sens. Environ. 1997, 62, 241–252. [Google Scholar] [CrossRef]
- Curran, P.J. Multispectral remote sensing for the estimation of green leaf area index. Philos. Trans. R. Soc. Lond. Ser. A Math. Phys. Sci. 1983, 309, 257–270. [Google Scholar]
- Klosinska, T. Wykorzystanie roślin drzewiastych w remediacji terenów zurbanizowanych. Sylwan 2021, 165, 725–737. [Google Scholar]
- Cunliffe, A.M.; Assmann, J.J.; Daskalova, G.N.; Kerby, J.T.; Myers-Smith, I.H. Aboveground biomass corresponds strongly with drone-derived canopy height but weakly with greenness (NDVI) in a shrub tundra landscape. Environ. Res. Lett. 2020, 15, 125004. [Google Scholar] [CrossRef]
- Jiang, Z.; Huete, A.R. Linearization of NDVI Based on its Relationship with Vegetation Fraction. Photogramm. Eng. Remote Sens. 2010, 76, 965–975. [Google Scholar] [CrossRef]
- Terekhin, E.A. Spatial analysis of tree vegetation of abandoned arable lands using their spectral response in forest-steppe zone of Central Chernozem Region. Sovrem. Probl. Distantsionnogo Zondirovaniya Zemli Kosmosa 2020, 17, 142–156. [Google Scholar] [CrossRef]
- Nelson, R. Modelling forest canopy heights: The effects of canopy shape. Remote Sens. Environ. 1997, 60, 327–334. [Google Scholar] [CrossRef]
- Żybura, H. Długość koron drzew w drzewostanach sosnowych. Sylwan 1977, 121, 13–20. [Google Scholar]
- Bielecki, A.; Będkowski, K. The degree of greenery in Lodz city, Poland—Clearing up discrepancies between official statistics and satellite data. Acta Sci. Pol. Adm. Locorum. 2022, 21, 489–512. [Google Scholar] [CrossRef]
- Dai, L.; Xu, Q.; Fan, X.; Chang, M.; Yang, Q.; Yang, F.; Ren, J. A preliminary study on spatial distribution patterns of landslides triggered by Jiuzhaigou earthquake in Sichuan on August 8th, 2017 and their susceptibility assessment. Gongchengdizhixuebao 2017, 25, 1151–1164. [Google Scholar]
- Gluch, R.M.; Ridd, M.K. The VIS model: Quantifying the urban environment. In Remote Sensing of Urban and Suburban Areas; Springer: Dordrecht, The Netherlands, 2010; pp. 85–116. [Google Scholar]
- Gutman, G.; Ignatov, A. The derivation of the green vegetation fraction from NOAA/AVHRR data for use in numerical weather prediction models. Int. J. Remote Sens. 1998, 19, 1533–1543. [Google Scholar] [CrossRef]
- Jiang, Z.; Huete, A.R.; Chen, J.; Chen, Y.; Li, J.; Yan, G.; Zhang, X. Analysis of NDVI and scaled difference vegetation index retrievals of vegetation fraction. Remote Sens. Environ. 2006, 101, 366–378. [Google Scholar] [CrossRef]
- Gao, L.; Wang, X.; Johnson, B.A.; Tian, Q.; Wang, Y.; Verrelst, J.; Mu, X.; Gu, X. Remote sensing algorithms for estimation of fractional vegetation cover using pure vegetation index values: A review. ISPRS J. Photogramm. Remote Sens. 2020, 159, 364–377. [Google Scholar] [CrossRef]
- Adamiak, M.; Będkowski, K.; Bielecki, A. Generative adversarial approach to urban areas NDVI estimation: A case study of Lodz, Poland. Quaest. Geogr. 2023, 42, 87–106. [Google Scholar] [CrossRef]
- Bielecki, A. Porównanie oprogramowania do przetwarzania danych LiDAR w zakresie generowania NMT i NMPT. Teledetekcja Sr. 2018, 58, 5–11. [Google Scholar]
- Kressler, F.; Mucher, C.A.; Steinnocher, K.; Thunnissen, H.A.M. Evaluation of medium-resolution satellite images for land use monitoring using spectral mixture analysis. Int. Arch. Photogramm. Remote Sens. 2000, 33, 709–716. [Google Scholar]
- LAS to Raster Function. Available online: https://desktop.arcgis.com/en/arcmap/latest/manage-data/raster-and-images/las-to-raster-function.htm (accessed on 2 April 2024).
- Czarnecki, W. Planowanie Miast i Osiedli. Vol. 1.; Państwowe Wydawnictwo Naukowe: Warszawa, Poland, 1965. [Google Scholar]
- Wüstemann, H.; Kalisch, D.; Kolbe, J. Access to urban green space and environmental inequalities in Germany. Landsc. Urban Plan. 2017, 164, 124–131. [Google Scholar] [CrossRef]
Disclaimer/Publisher’s Note: The statements, opinions and data contained in all publications are solely those of the individual author(s) and contributor(s) and not of MDPI and/or the editor(s). MDPI and/or the editor(s) disclaim responsibility for any injury to people or property resulting from any ideas, methods, instructions or products referred to in the content. |
© 2024 by the authors. Licensee MDPI, Basel, Switzerland. This article is an open access article distributed under the terms and conditions of the Creative Commons Attribution (CC BY) license (https://creativecommons.org/licenses/by/4.0/).