Article

Spatiotemporal Variation Characteristics of Extreme Precipitation in the Mid–Lower Reaches of the Yangtze River Basin Based on Precipitation Events

1
State Key Laboratory of Eco-Hydraulic in Northwest Arid Region, Xi’an University of Technology, Xi’an 710048, China
2
State Key Laboratory of Soil Erosion and Dryland Farming on the Loess Plateau, Chinese Academy of Sciences and Ministry of Water Resources, Yangling 712100, China
3
Key Laboratory of National Forestry and Grassland Administration on Ecological Hydrology and Disaster Prevention in Arid Regions, Northwest Survey and Planning Institute of National Forestry and Grassland Administration, Xi’an 710048, China
4
School of Economics and Management, Xi’an University of Technology, Xi’an 710048, China
*
Author to whom correspondence should be addressed.
Sustainability 2024, 16(21), 9197; https://doi.org/10.3390/su16219197
Submission received: 1 September 2024 / Revised: 16 October 2024 / Accepted: 18 October 2024 / Published: 23 October 2024
(This article belongs to the Topic Advances in Hydrogeological Research)

Abstract

:
In addition to greater precipitation on extreme days of precipitation, preceding and succeeding precipitation (PSP) is often an objective component of flooding in the mid–lower reaches of the Yangtze River Basin (MLRYRB). In this study, focused on the temporal distribution pattern of precipitation, the concept of an extreme precipitation event (EPE), defined as a consecutive precipitation event having at least one daily precipitation extreme, is proposed to consider PSP in an extreme event. We analyzed the spatiotemporal variation of four types of EPEs based on daily data obtained from 130 monitoring stations covering 1960–2019. Extreme precipitation increased significantly over the last 60 years (p < 0.01). The frequency and precipitation amount of single-day EPEs accounted for only 13% and 21%, respectively, while multi-day continuous EPE types that are associated with PSP accounted for 87% and 79%, respectively, confirming the connotations of EPEs. The front and late EPEs under the 100-year return level reached 250 mm and 230 mm, respectively. Furthermore, climate warming could lead to significant increases in the frequency of single-day and late EPEs, particularly in the southern region. The EPE concept may be helpful in exploring disaster-causing processes under extreme weather, and it provides a theoretical basis for deriving the precipitation hazard chain, which is more applicable to basins with long precipitation durations.

Graphical Abstract

1. Introduction

1.1. Impact of Climate Change on Extreme Precipitation

In the context of global warming, as estimated by the Clausius–Clapeyron equation under future climate change scenarios, extreme precipitation will increase by approximately 7% for every 1 °C increase in the temperature [1,2]. Studies have demonstrated that the mid-latitudes are more susceptible to climate change [3]. Heavy precipitation (>50 mm) at the mid-latitudes increased by 20% during the late 20th century, and extreme precipitation exhibited an increasing trend even in areas with insignificant or decreased average precipitation [4,5,6,7,8].
As a mid-latitude region with high precipitation, the mid–lower reaches of the Yangtze River Basin (MLRYRB) have been the most flood-prone areas across various geological and historical periods so far and represent a critical area for flood investigations [9,10,11]. The annual extreme precipitation in the MLRYRB is affected by meteorological factors, and the primary modes of water vapor transport fluxes exhibited marked and abrupt chronological oscillations after the 1970s [12]. Over the recent decades, an increasing number of studies have been conducted on the trends and spatial distribution of extreme precipitation in the Yangtze River Basin in response to climate change [13,14]. Zhang et al. (2023) analyzed the extreme precipitation index in the Yangtze River Basin for nearly 120 years and found that most extreme precipitation indices showed a downward trend in the first 60 years, which turned to slightly increasing trends after 1961, except for the continuous drought in the MLRYRB during 1901–2020 [15]. Extreme precipitation indicators in the MLRYRB have generally exhibited an upward trend over the last 50 years; however, strong regional features have led to inconsistent trends in different subbasins [16,17].
Previous studies of extreme precipitation, whether on an hourly or a daily scale, were conducted at “fixed time intervals”. However, precipitation in nature usually occurs in the form of “events”, and each event varies in duration and peak location. Consequently, focusing on the time process of extreme precipitation events (EPEs), some scholars have further subdivided the types of EPEs to compensate for the shortage of adopting absolute or relative thresholds in the estimation of the characteristics of extreme precipitation while neglecting the precipitation process, which serves as a new perspective for understanding variations in precipitation events at different spatial scales [18,19,20]. A process-oriented study of the EPEs in the eastern Himalayas of India and the Qinling region of China found that multi-day EPEs were much more common than single-day EPEs [21,22]. However, the temporal distribution pattern, also known as the temporal profile of EPEs in the Yangtze River Basin, is still highly uncertain and intractable. Therefore, in this study, extreme precipitation is regarded as a continuous event scale, and the different temporal distribution patterns of EPEs are further characterized in the MLRYRB.

1.2. Research Perspective on the Time Process of Extreme Precipitation Event

A precipitation event is a dynamic process of precipitation initiation, persistence, and attenuation, and the duration of an event ranges from a few minutes to tens of days [23]. The amount of precipitation corresponding to any moment of a precipitation event, the duration of the event, and the peak value of the event constitute various characteristic patterns of precipitation processes, which lead to varying storage patterns in underlying surfaces and runoff generation and concentration processes in the hydrographic network [24,25,26]. The conventional statistical analysis of extreme precipitation is performed based on indices related to thresholds or quartiles, such as R99p (sum of precipitation for thresholds higher than the 99th percentile) [27,28,29]. However, preceding and succeeding precipitation (PSP) is often ignored in the statistical analysis of EPEs using the extreme precipitation index, as the PSP is immediately adjacent to the extreme precipitation days in time, but it may not reach the threshold regarding the precipitation amount, and therefore cannot be included in the total precipitation from an EPE [30,31,32,33]. Notably, the superposition of PSP and precipitation on extreme days in some basins with high multi-year average precipitation may exacerbate localized flow production and prolong flooding, especially during the flood season [34,35,36]. For example, the multi-day EPE that struck the Yangtze River Basin in mid-July 1998 was a 13-day-long precipitation event, with a total precipitation of 437.8 mm being recorded based on data obtained from Station 58506. If the statistics are based on the extreme precipitation threshold index (daily precipitation > 50 mm), only four days meet the criteria for extreme values. However, the precipitation on the PSP days (the other nine days) that did not exceed the threshold was 49.7% of the total EPE, which is quite a large precipitation percentage in an EPE. According to reports on this flood, both the multiple days of sustained PSP and the precipitation on extreme days were important factors that exacerbated the flood hazard [37]. Consequently, some regions affected by special weather systems, such as southeastern China, which is influenced by both subtropical high pressure and a special convective system on the Tibetan Plateau, are subject to long-lasting precipitation in the summer [38,39,40]. Therefore, it is hypothesized that EPEs in areas with frequent multi-day continuous precipitation may contain more PSP. Furthermore, the categorization of event types based on the location of extreme precipitation days in the EPE is consistent with the basic connotations of natural precipitation events.
In this study, we analyzed the spatial and temporal characteristics of seven extreme precipitation indices from 1960 to 2019 in the MLRYRB. Four types of EPEs (single-day, balanced, front, and late) were defined based on the temporal distribution pattern of the precipitation. In addition to a detailed analysis of the spatial heterogeneity of EPEs, we estimated the return levels of the EPEs and discussed the relationship between regional warming and EPE variations. The results of this paper could provide more targeted assessment and theoretical support for regional hydrological hazard events.

2. Materials and Methods

2.1. Study Area

The MLRYRB is located at 103°30′–122°30′ E and 23°45′–34°15′ N (Figure 1). The area of the MLRYRB is approximately 915,000 km2. The study area has a typical subtropical monsoon climate and is divided into the northern subtropical (Zone I) and central subtropical climate (Zone II) zones. The terrain gradually decreases from northwest to southeast, with an average elevation of 377.5 m. The study area has mild precipitation in the winter and abundant precipitation in the summer. The annual average precipitation is 1370.8 mm, and the annual average temperature is 16.0 °C. The summer monsoon rainfall and the influence of cold air from the north result in a long plum rain season in June and July. Subsequently, a summer drought occurs in response to subtropical high pressure in the western Pacific Ocean [41].

2.2. Data Sources

Daily precipitation and temperature datasets for 130 meteorological stations in and around the MLRYRB were obtained from the China National Meteorological Data Sharing Service Center (http://data.cma.cn, accessed on 10 January 2022). To ensure data completeness and continuity, data collected over the 1960–2019 period were used. For measurements missing in the short term, the average precipitation from neighboring stations was used for interpolation. The data passed the extreme value, time consistency, and homogenization tests.

2.3. Data Analysis

2.3.1. Extreme Precipitation Indices

Seven extreme precipitation indices recommended by the Expert Team on Climate Change Detection and Indicators were selected for this study: PRCPTOT, R99p, R95p, Rday, R95day, SDII, and SDIIq95 (Table 1) [42,43].

2.3.2. Definition and Classification of EPEs

Variations in peak locations during EPEs and peak precipitation amounts lead to varying disastrous effects of their ephemeral processes [18,20]. This study drew on existing studies to define and categorize EPEs (Figure 2). First, continuous effective precipitation was extracted depending on whether the daily precipitation was constantly no less than 1 mm, and then effective precipitation events were further extracted by determining whether they had extreme precipitation days. Finally, each EPE was categorized based on the positional attributes of the extreme precipitation days in the event, which mainly consisted of the following four types: a front EPE, a late EPE, a balanced EPE, and a single-day EPE (Table 2).

2.3.3. Analysis Methods

(1)
Trend Analysis
For the time series xt = (x1, x2, x3, …, xn), the slope of extreme precipitation and EPE over the MLRYRB were analyzed using Sen’s slope estimator test [44].
S = M E D x j x i j i , j > i
where S represents the robust estimate of the monotonic trend in the time series. MED is the median function. S > 0 indicates an increasing trend and S = 0 denotes no significant trend, while S < 0 indicates a decreasing trend.
The modified Mann–Kendall (MMK) test has been widely used to detect climate trends to eliminate the effects of serial autocorrelation and improve the accuracy of trend analyses [45]. Under the null hypothesis that xt = (x1, x2, x3, …, xn) satisfies independence and randomness, and the statistic S for the MK test is approximately normally distributed when n ≥ 8 [46],
S = p = 1 n 1 q = p + 1 n s i g n ( x q x p )
where x represents the values at times p and q, sign(θ) is a judgment function, and the variance (σ2) is calculated as follows [47]:
s i g n θ =   1 ,   θ > 0   0 ,   θ = 0 1 ,   θ < 0
σ 2 = n 2 n + 5 n 1 18
where Z is the standard normalization statistic for the MK test [44]. A positive Z value indicates an increasing trend, while a negative Z value indicates a decreasing trend.
Z = S 1 σ , S > 0 0 ,   S = 0 S + 1 σ , S < 0
The corrected variance Var*(S) of the MMK statistic is used to limit the impact of sequence autocorrelation on the MK test, where n* is the valid sample, as follows:
V a r * S = ( n / n * ) V a r ( S )
where Z* is the modified standardized MMK statistic, calculated as follows:
Z * = Z n S  
(2)
ANUSPLIN Spatial Interpolation
ANUSPLIN spatial interpolation is based on the interpolation theory of ordinary thin plate and local thin plate spline functions and is able to introduce multiple influencing factors as covariates for the spatial interpolation of meteorological factors, which improves the interpolation accuracy [48]. The spatial resolution used was 30 m × 30 m. The accuracy of the interpolated results for the 13 precipitation parameters was tested using the cross-validation method (Table 3). These parameters included the signal-to-noise ratio (SNR), the fitting spline degrees of freedom (Signal), the root mean square error (RMSE), and the estimation of noise standard deviation (RTVAR), in which a value of the SNR close to 0.00 indicated a better interpolation effect. Similarly, if the RMSE value was less than the response time variability, it indicated a relatively high interpolation accuracy. The interpolation of the 13 precipitation elements met the accuracy requirements.
(3)
Cross-Wavelet Analysis
Cross-wavelet analysis is an effective method for studying multi-scale and non-stationary signal sequences [49], which can effectively reflect the correlation and consistency between the variations of two time series, especially the strength of the common period between the sequences [50]. Assuming that the two sequences were X = {x1, x2, …, xn} and Y = {y1, y2, …, yn}, we defined their cross wavelets as WX(S) and WY(S) and calculated them as follows:
W n X Y s = W n X s W n Y * s
where W n Y * s is the complex conjugate of W n Y s . A larger value of W n X Y s corresponds to stronger cross-wavelet power, indicating a higher correlation between the two sequences.
(4)
Estimation of EPE Return Level
The return level of EPEs in hydrological engineering design can be used to assess the potential risk to projects under extreme climate events [51]. Most basic hydro structures and urban storm drain systems have a design level exceeding 20, 50, and 100 years [52]. Therefore, it is necessary to analyze EPEs with 20-, 50-, and 100-year return periods [53]. EPEs occur multiple times per year in the MLRYRB. The generalized Pareto distribution (GPD) is a model that is commonly used to capture the extreme tail signatures of hydrological random variables, which can be used to estimate the annual probability of EPEs occurring in the region [54,55]. Therefore, the GPD was used to estimate the EPE return level as follows:
F ( ξ , μ , σ ) x = 1 1 + ξ x μ σ 1 ξ , ξ 0 1 e ( x μ ) σ , ξ = 0
where ξ , μ, and σ are shape, location, and scale parameters, respectively. XT is the return level for the T-year return period, calculated as follows:
X T = μ ^ + σ ^ 1 1 T ξ ^ k ^ , ξ ^ 0 μ ^ σ ^ log 1 1 T , ξ ^ = 0
To reduce the effect of sample capacities, a bootstrapped EPE series was performed, which generated 1000 guide samples each to return the points before level estimation [56,57].

3. Results

3.1. Spatiotemporal Variation of Extreme Precipitation

3.1.1. Variations in Temporal and Spatial Extreme Precipitation

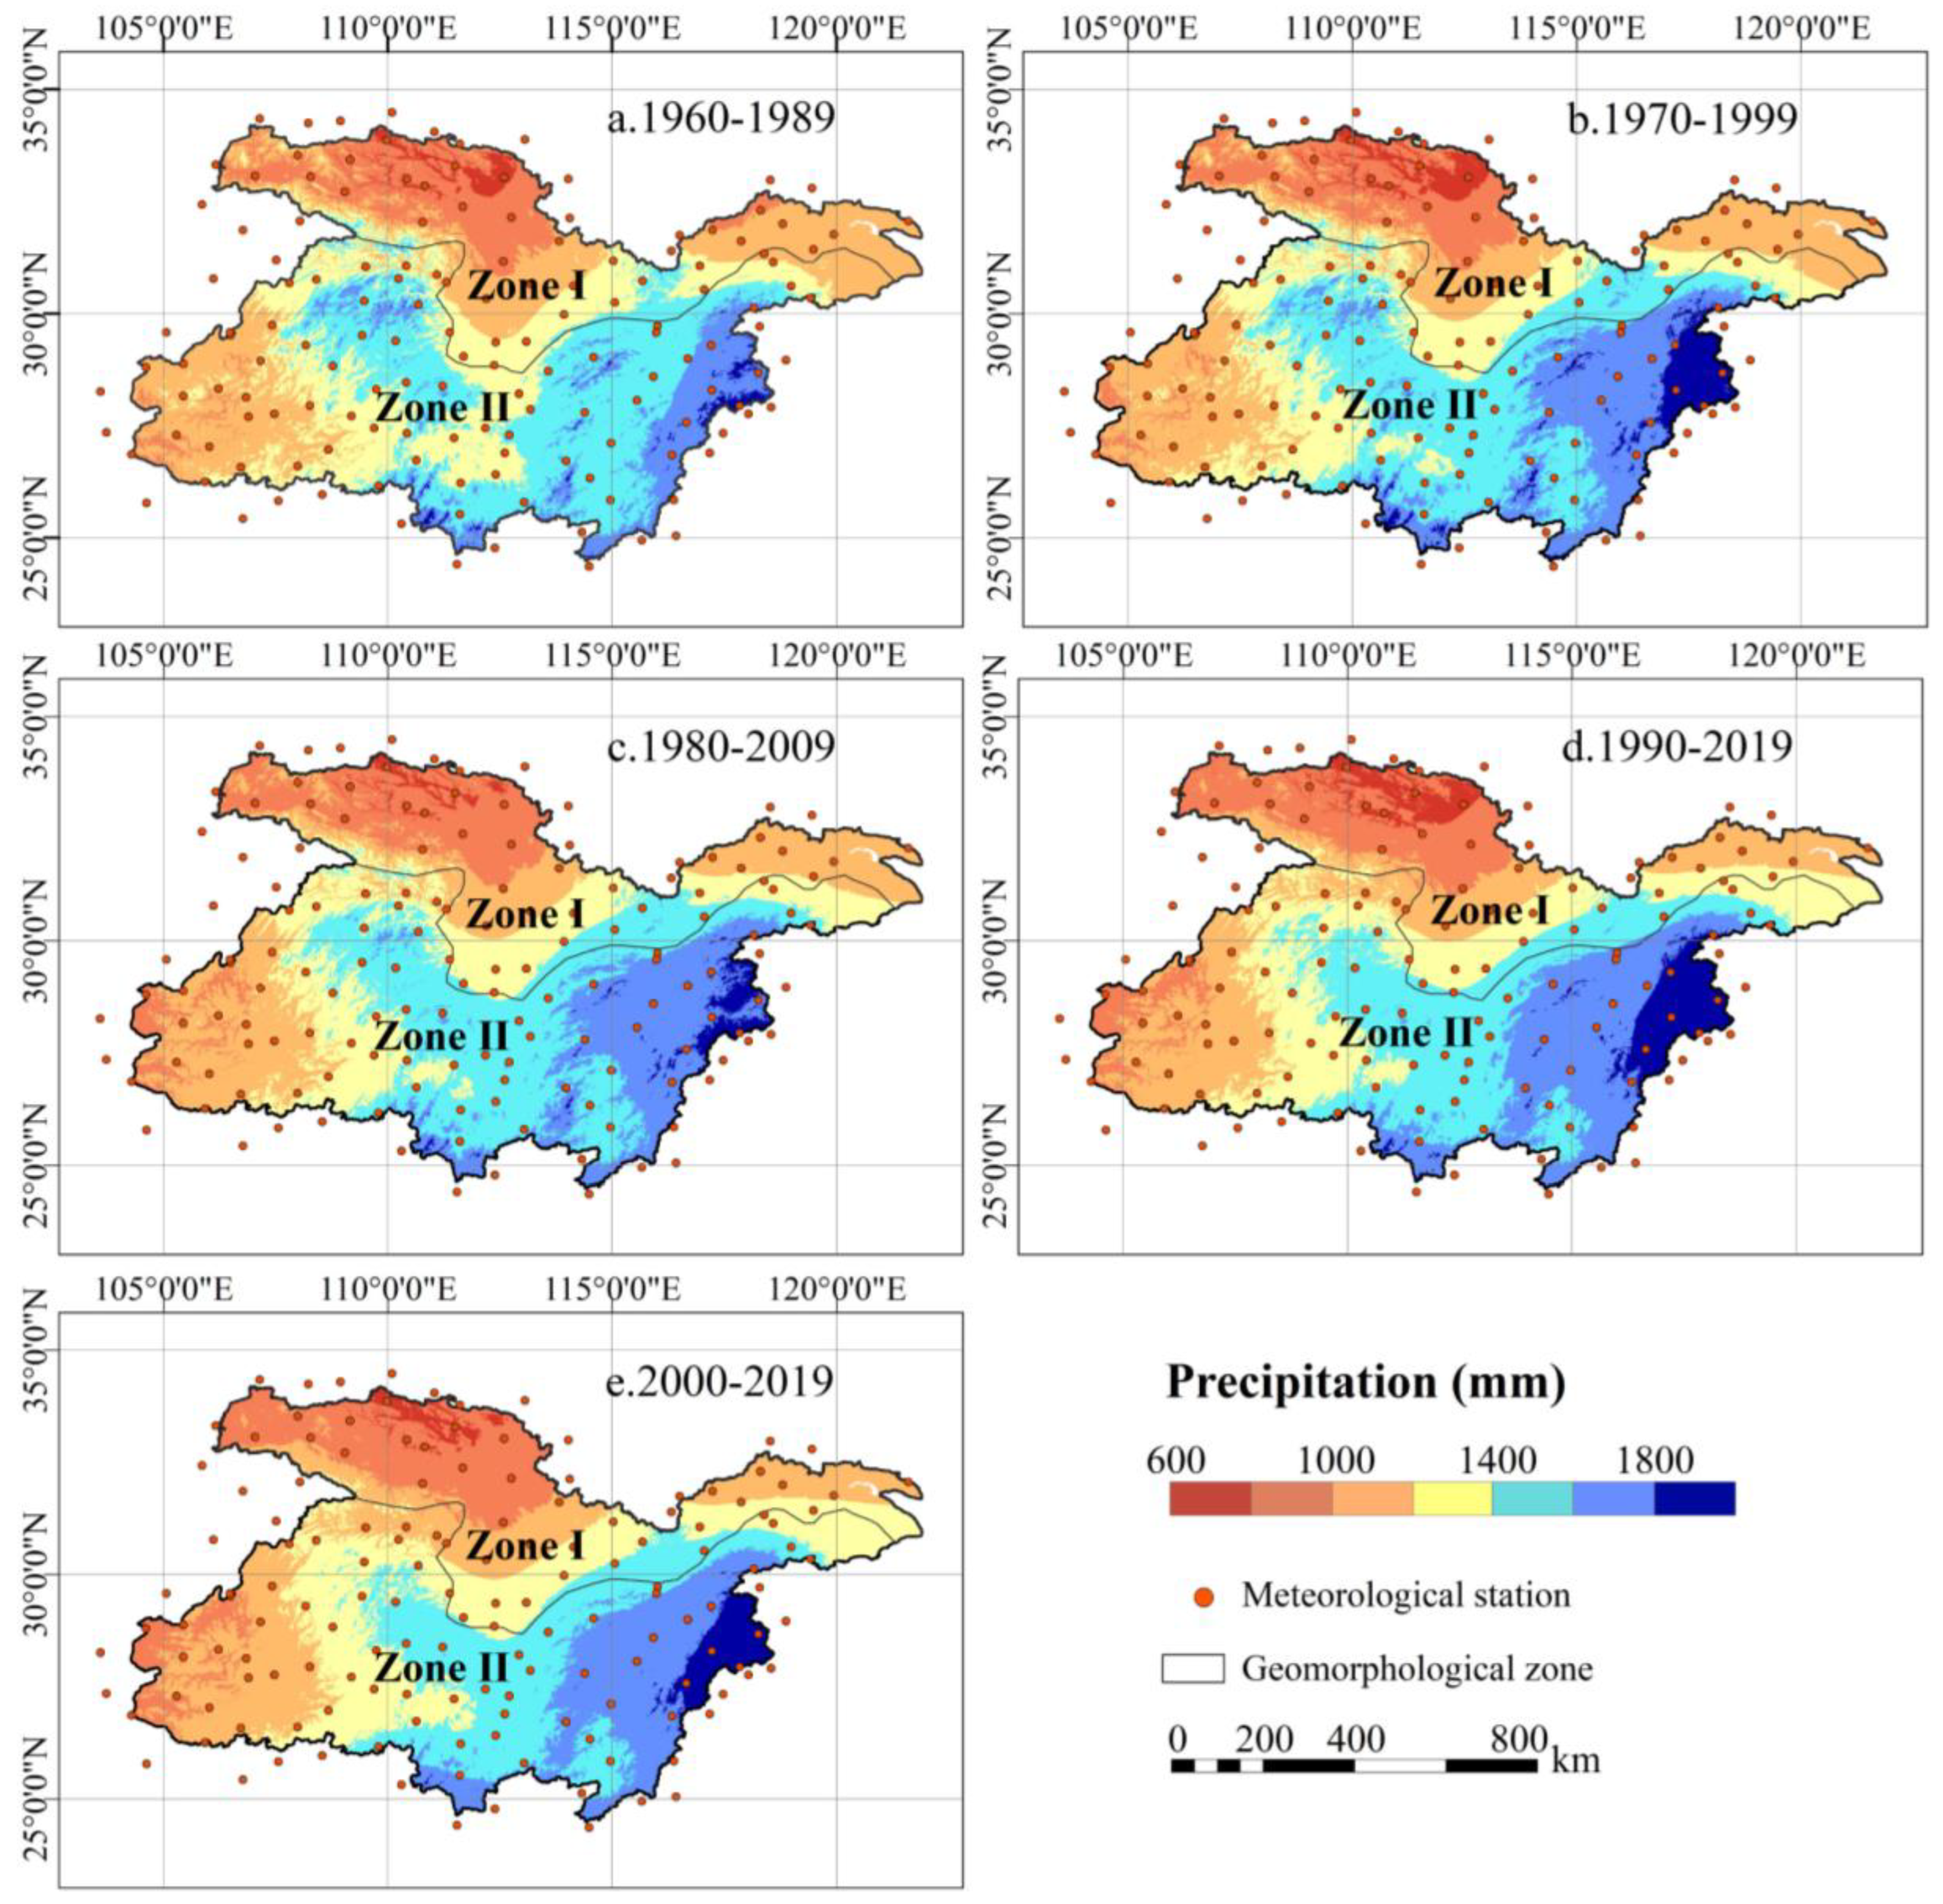
The spatial distribution of annual precipitation in the MLRYRB was stable, decreasing gradually from the southeast to the northwest. The multi-year average precipitation was 1307 mm. The floating yellow isoprecipitation zone effectively indicated the general variation direction of regional precipitation (Figure 3). The variation in the spatial distribution of the area of the multi-year average precipitation zone is shown in Table 2. The extent of the high-precipitation–magnitude area (>1600 mm) has expanded, especially over the last 30 years (1990–2019) when compared to the initial period (1960–1980), where the high-precipitation area of 1600–1800 mm and >1800 mm expanded by 61% and 370%, respectively, while the moderate-precipitation area of 1000–1600 mm decreased, indicating the polarization of precipitation to a certain extent.
Regarding the spatial distribution of annual extreme precipitation within the MLRYRB (Table 4), areas with low extreme precipitation (<600 mm) and high extreme precipitation (>800 mm) expanded significantly during the later period when compared to the 1960–1980 period, whereas areas with an extreme precipitation of 600–800 mm reduced. The area with an extreme precipitation of 700–800 mm, which had the largest initial area, shrank by 54% in 1990–2019, while the area with extreme precipitation >800 mm expanded by 250% to become the largest area. Overall, a trend in transformation from moderate to extreme precipitation was observed over the 60 years.

3.1.2. Variations in the Trends in Extreme Precipitation Indices

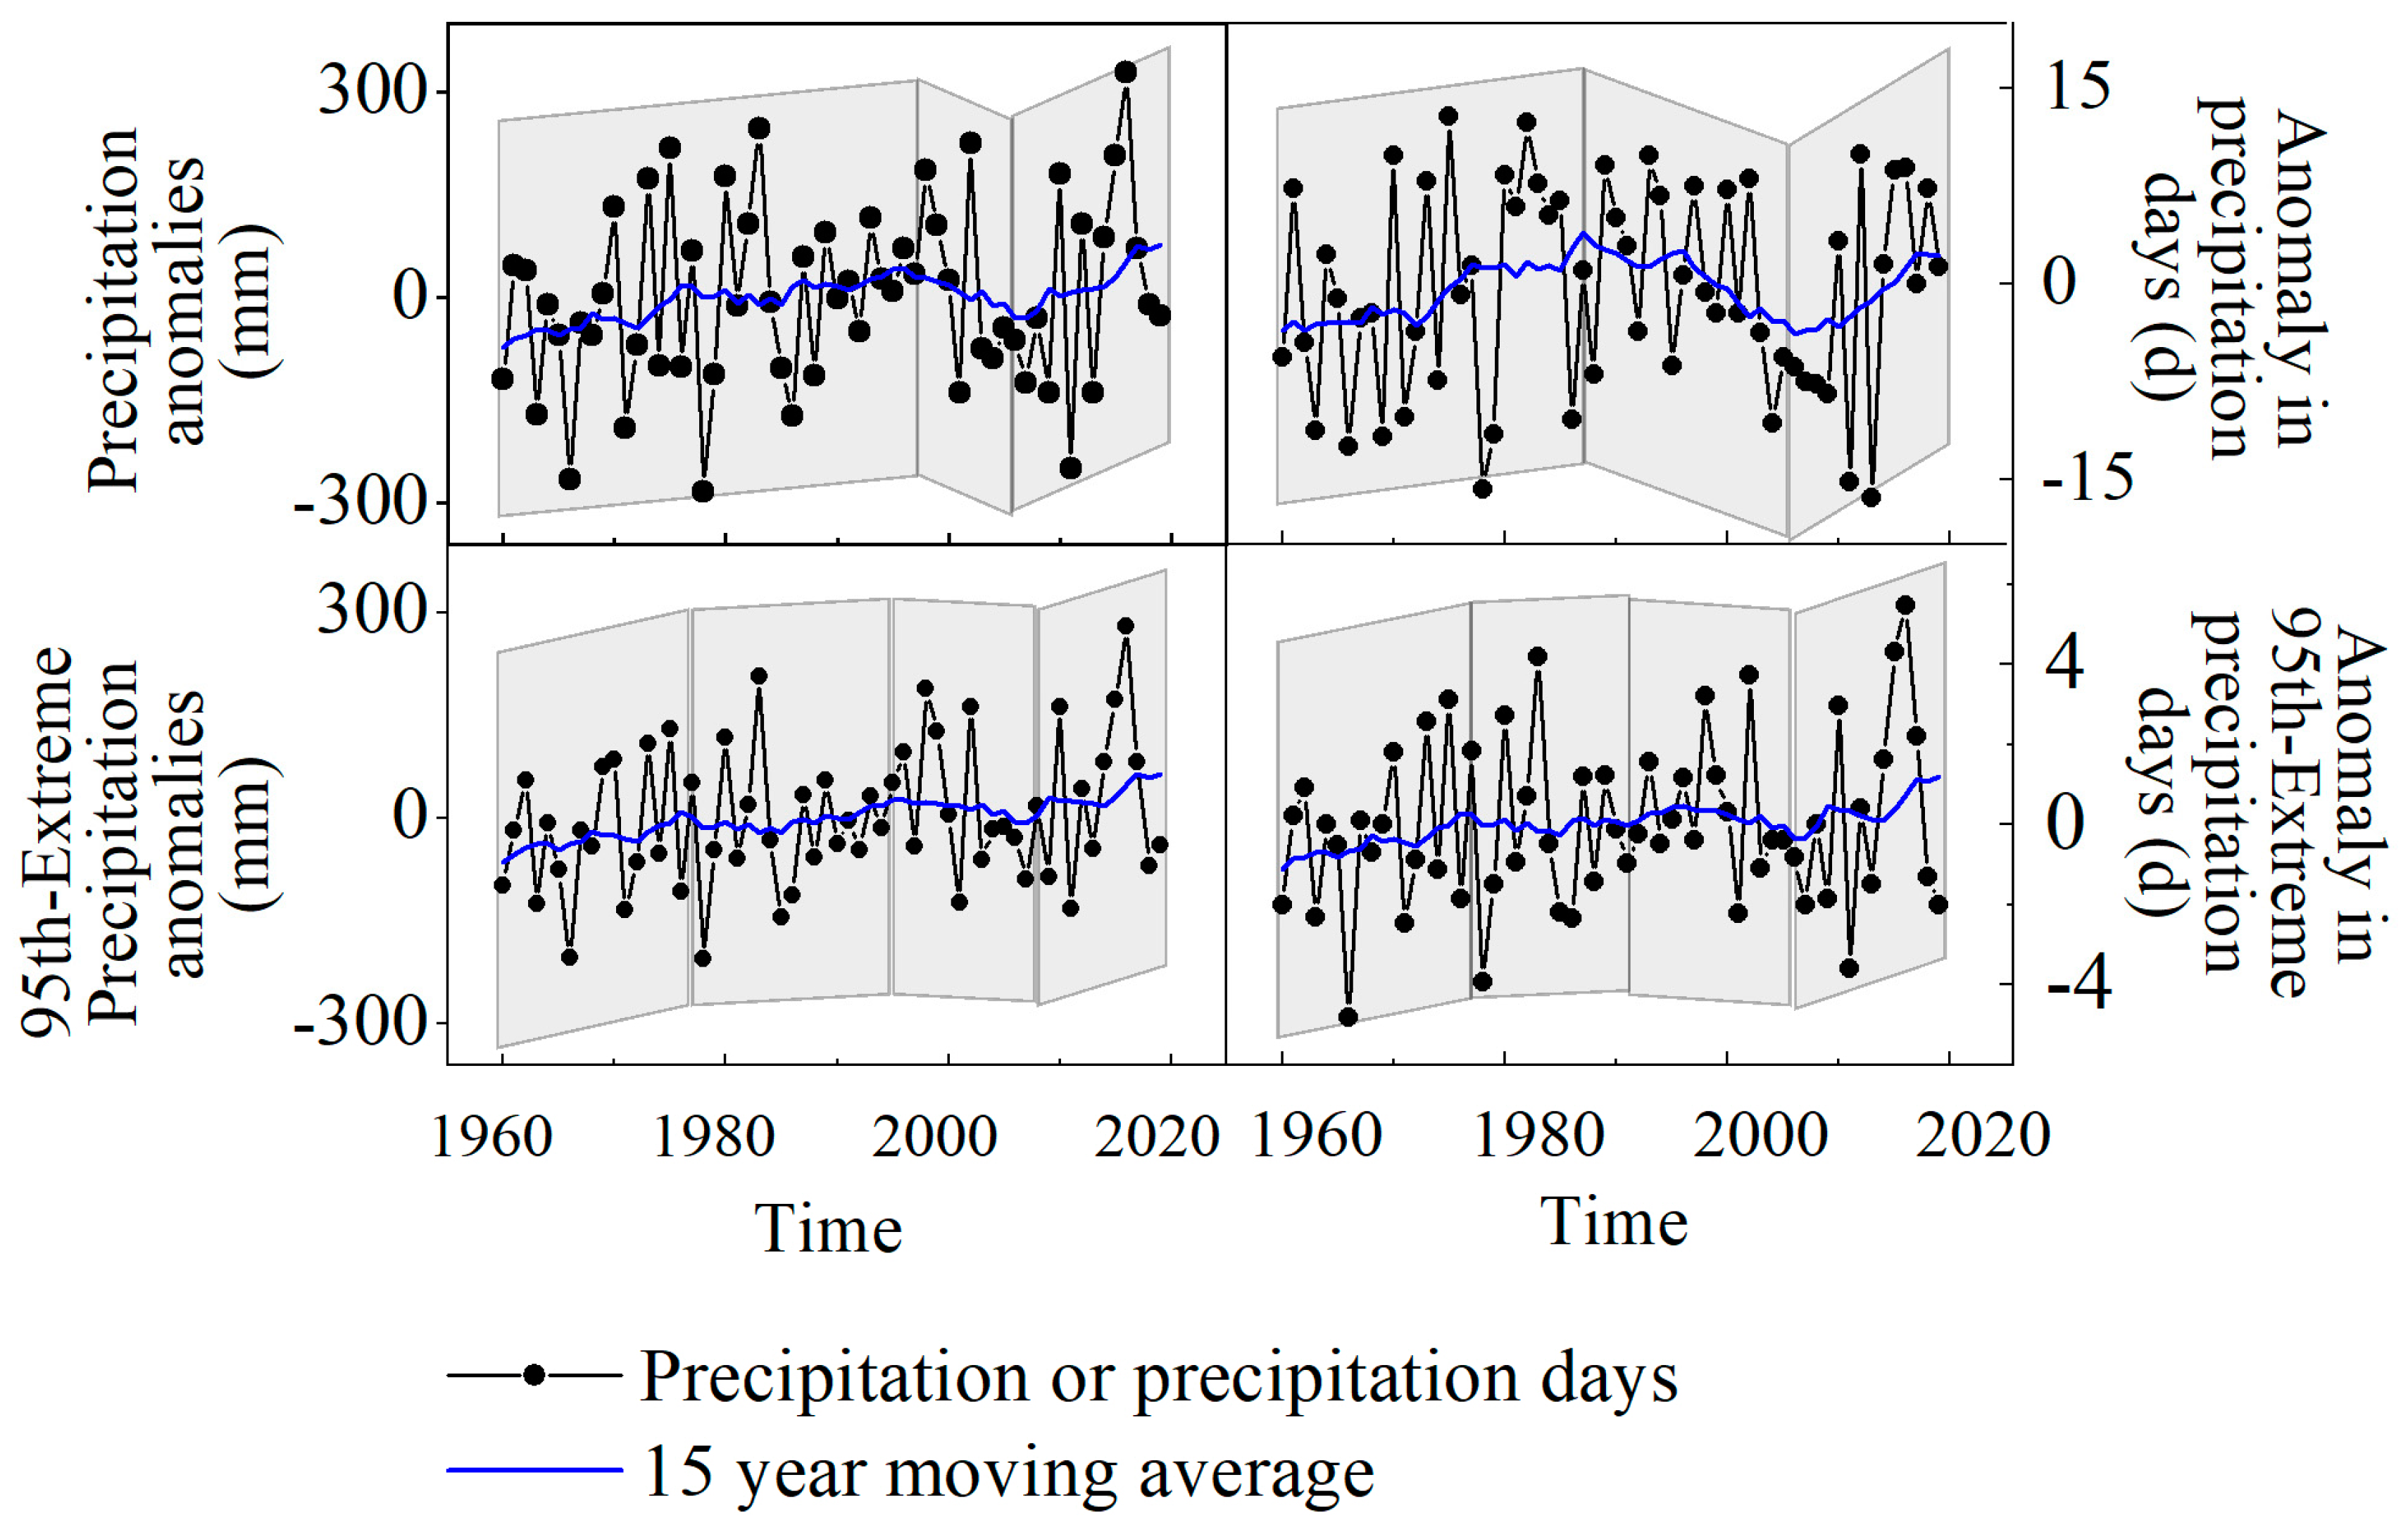
According to the trends in extreme precipitation indices (Table 5), PRCPTOT and Rday did not increase significantly over the past 60 years in the basin. However, R99p and R95p, which define the extreme precipitation threshold, increased significantly (p < 0.01). During the 1980–2009 period, a sudden change occurred, and the trends in most indices shifted from increasing to decreasing, with PRCPTOT and Rday decreasing significantly (Figure 4). Notably, the SDIIq95 increased steadily and significantly during the entire study period (p < 0.001).

3.2. Variation Characteristics of EPE Types

3.2.1. Annual Distribution of EPEs

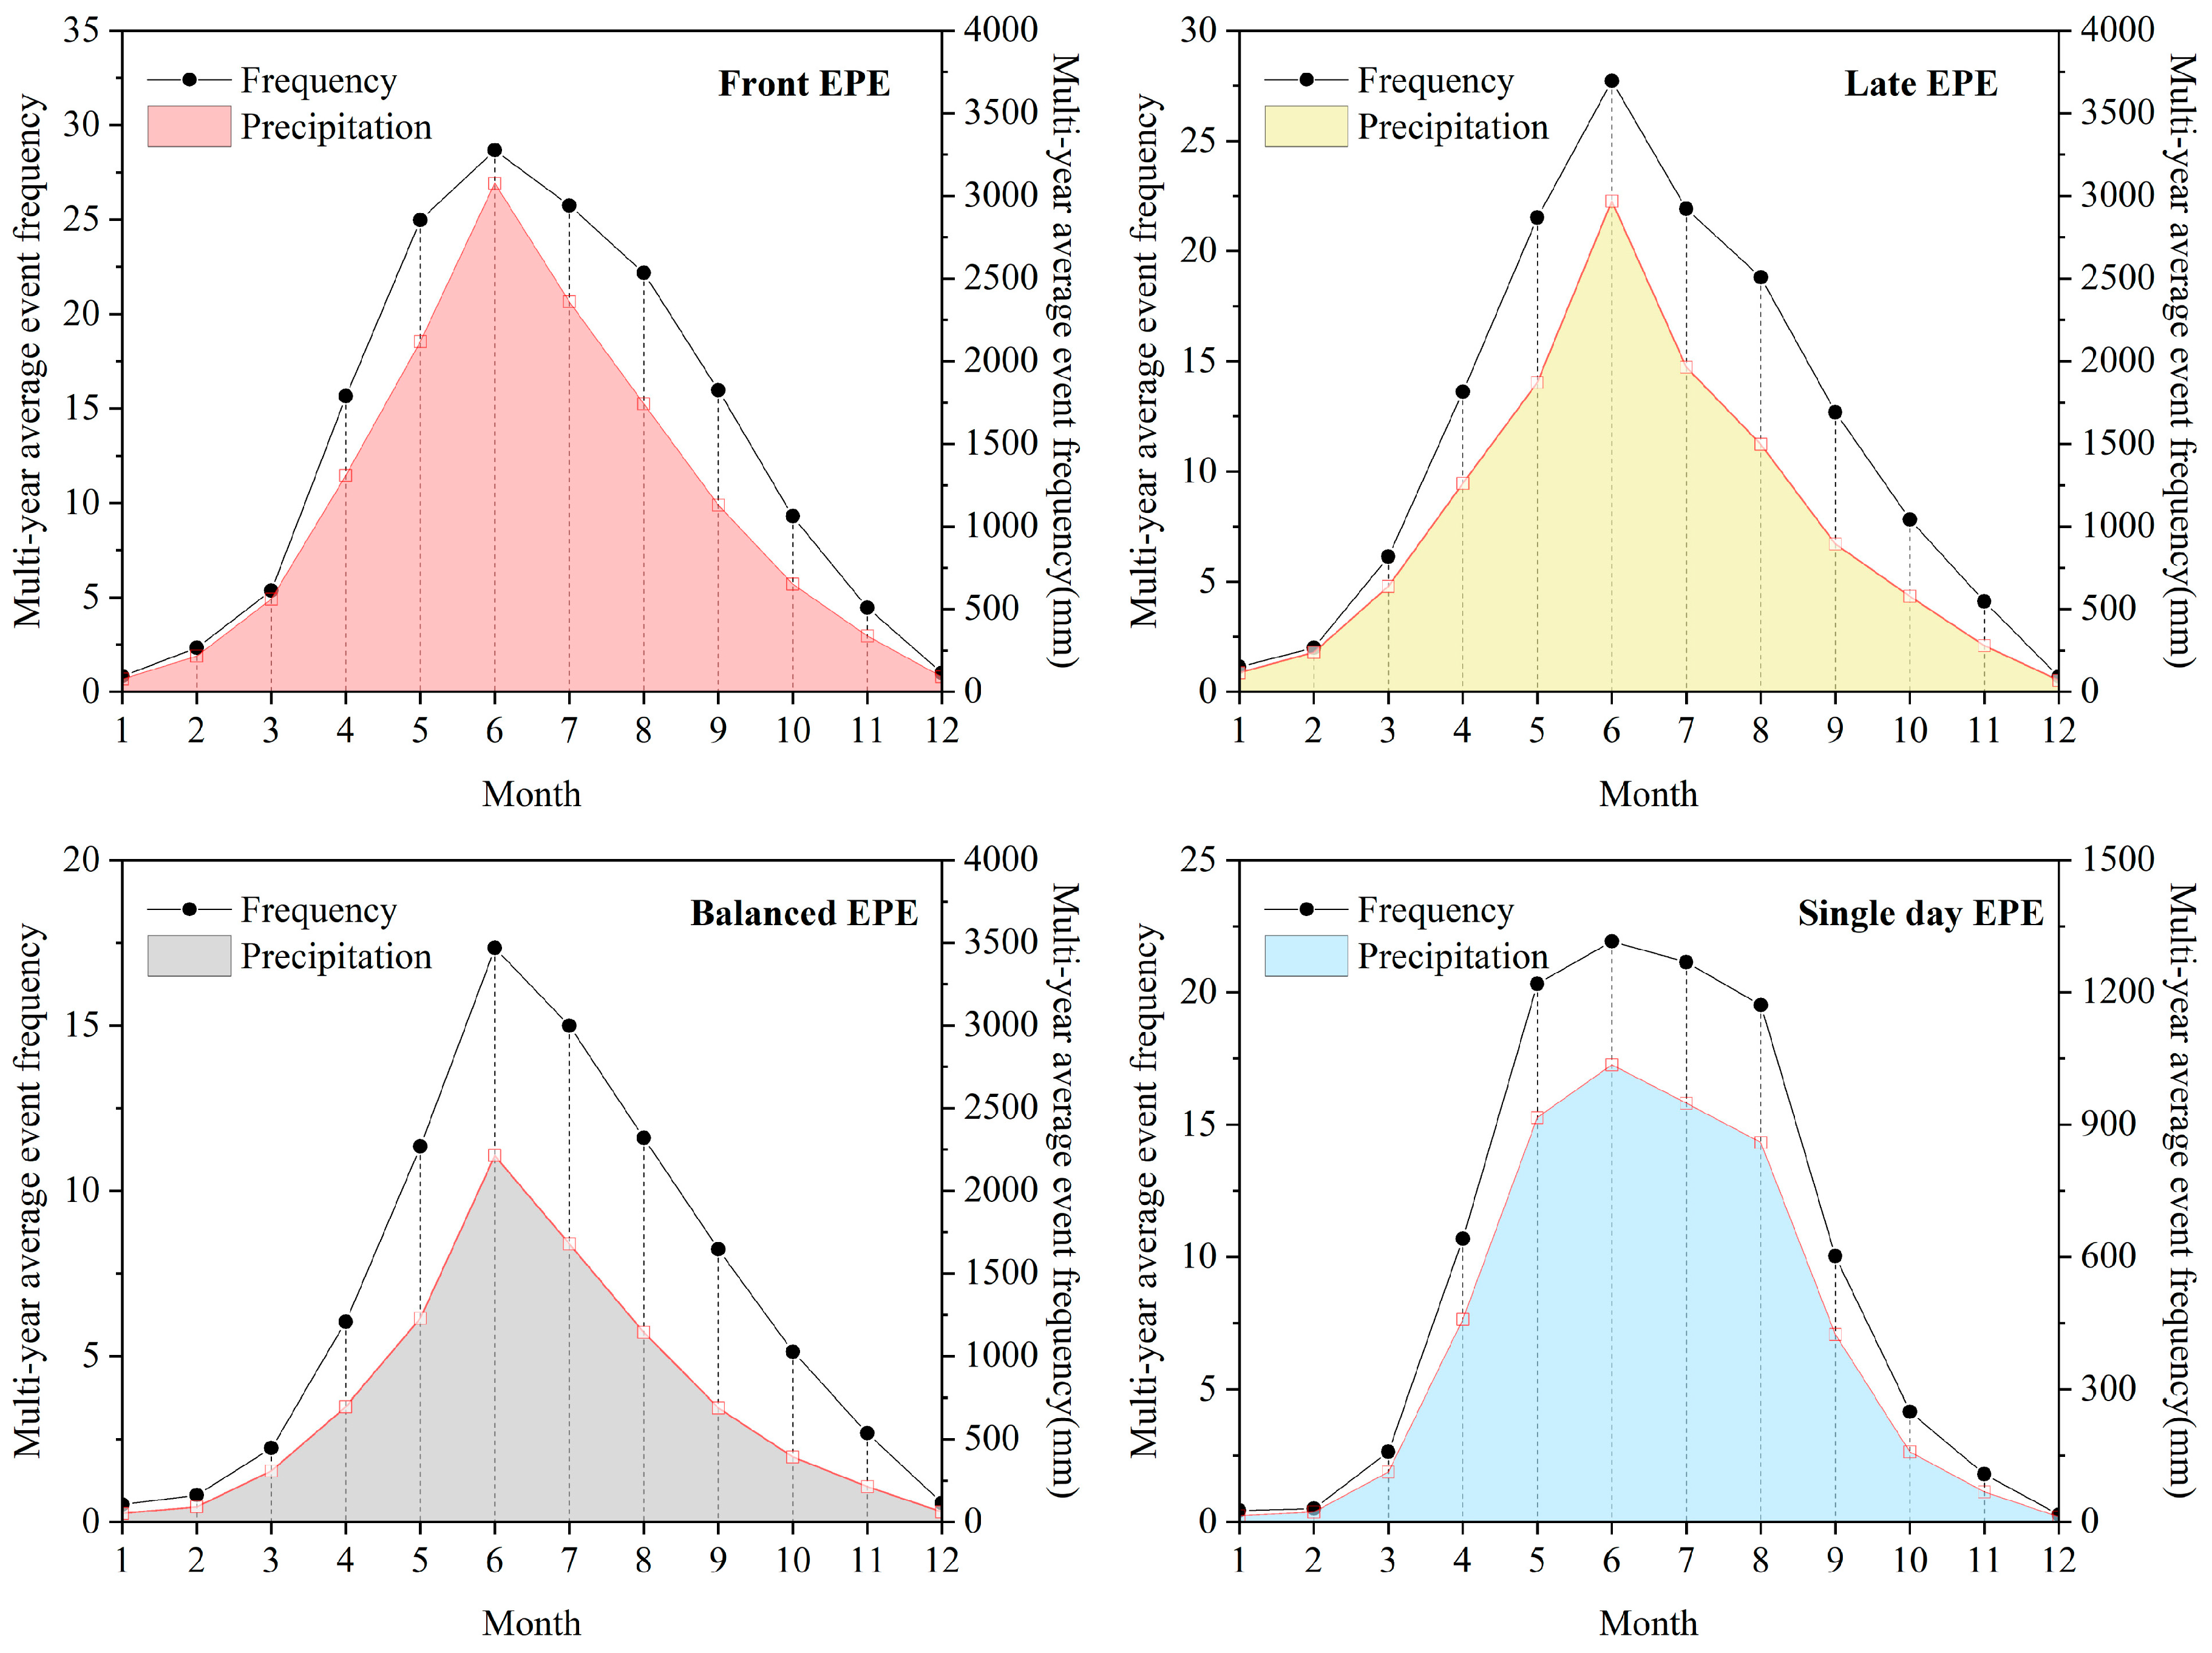
The four types of EPEs in the MLRYRB predominantly occurred from May to October. The proportions of single-day and multi-day continuous EPEs, which occurred from May to October, were >91% and 85%, respectively (Figure 5). The three continuous types of EPEs had high kurtosis values (>3.5), with both front and late EPEs having the highest values. The kurtosis value of the single-day EPEs was close to the normal distribution.

3.2.2. Dominant Types of EPEs

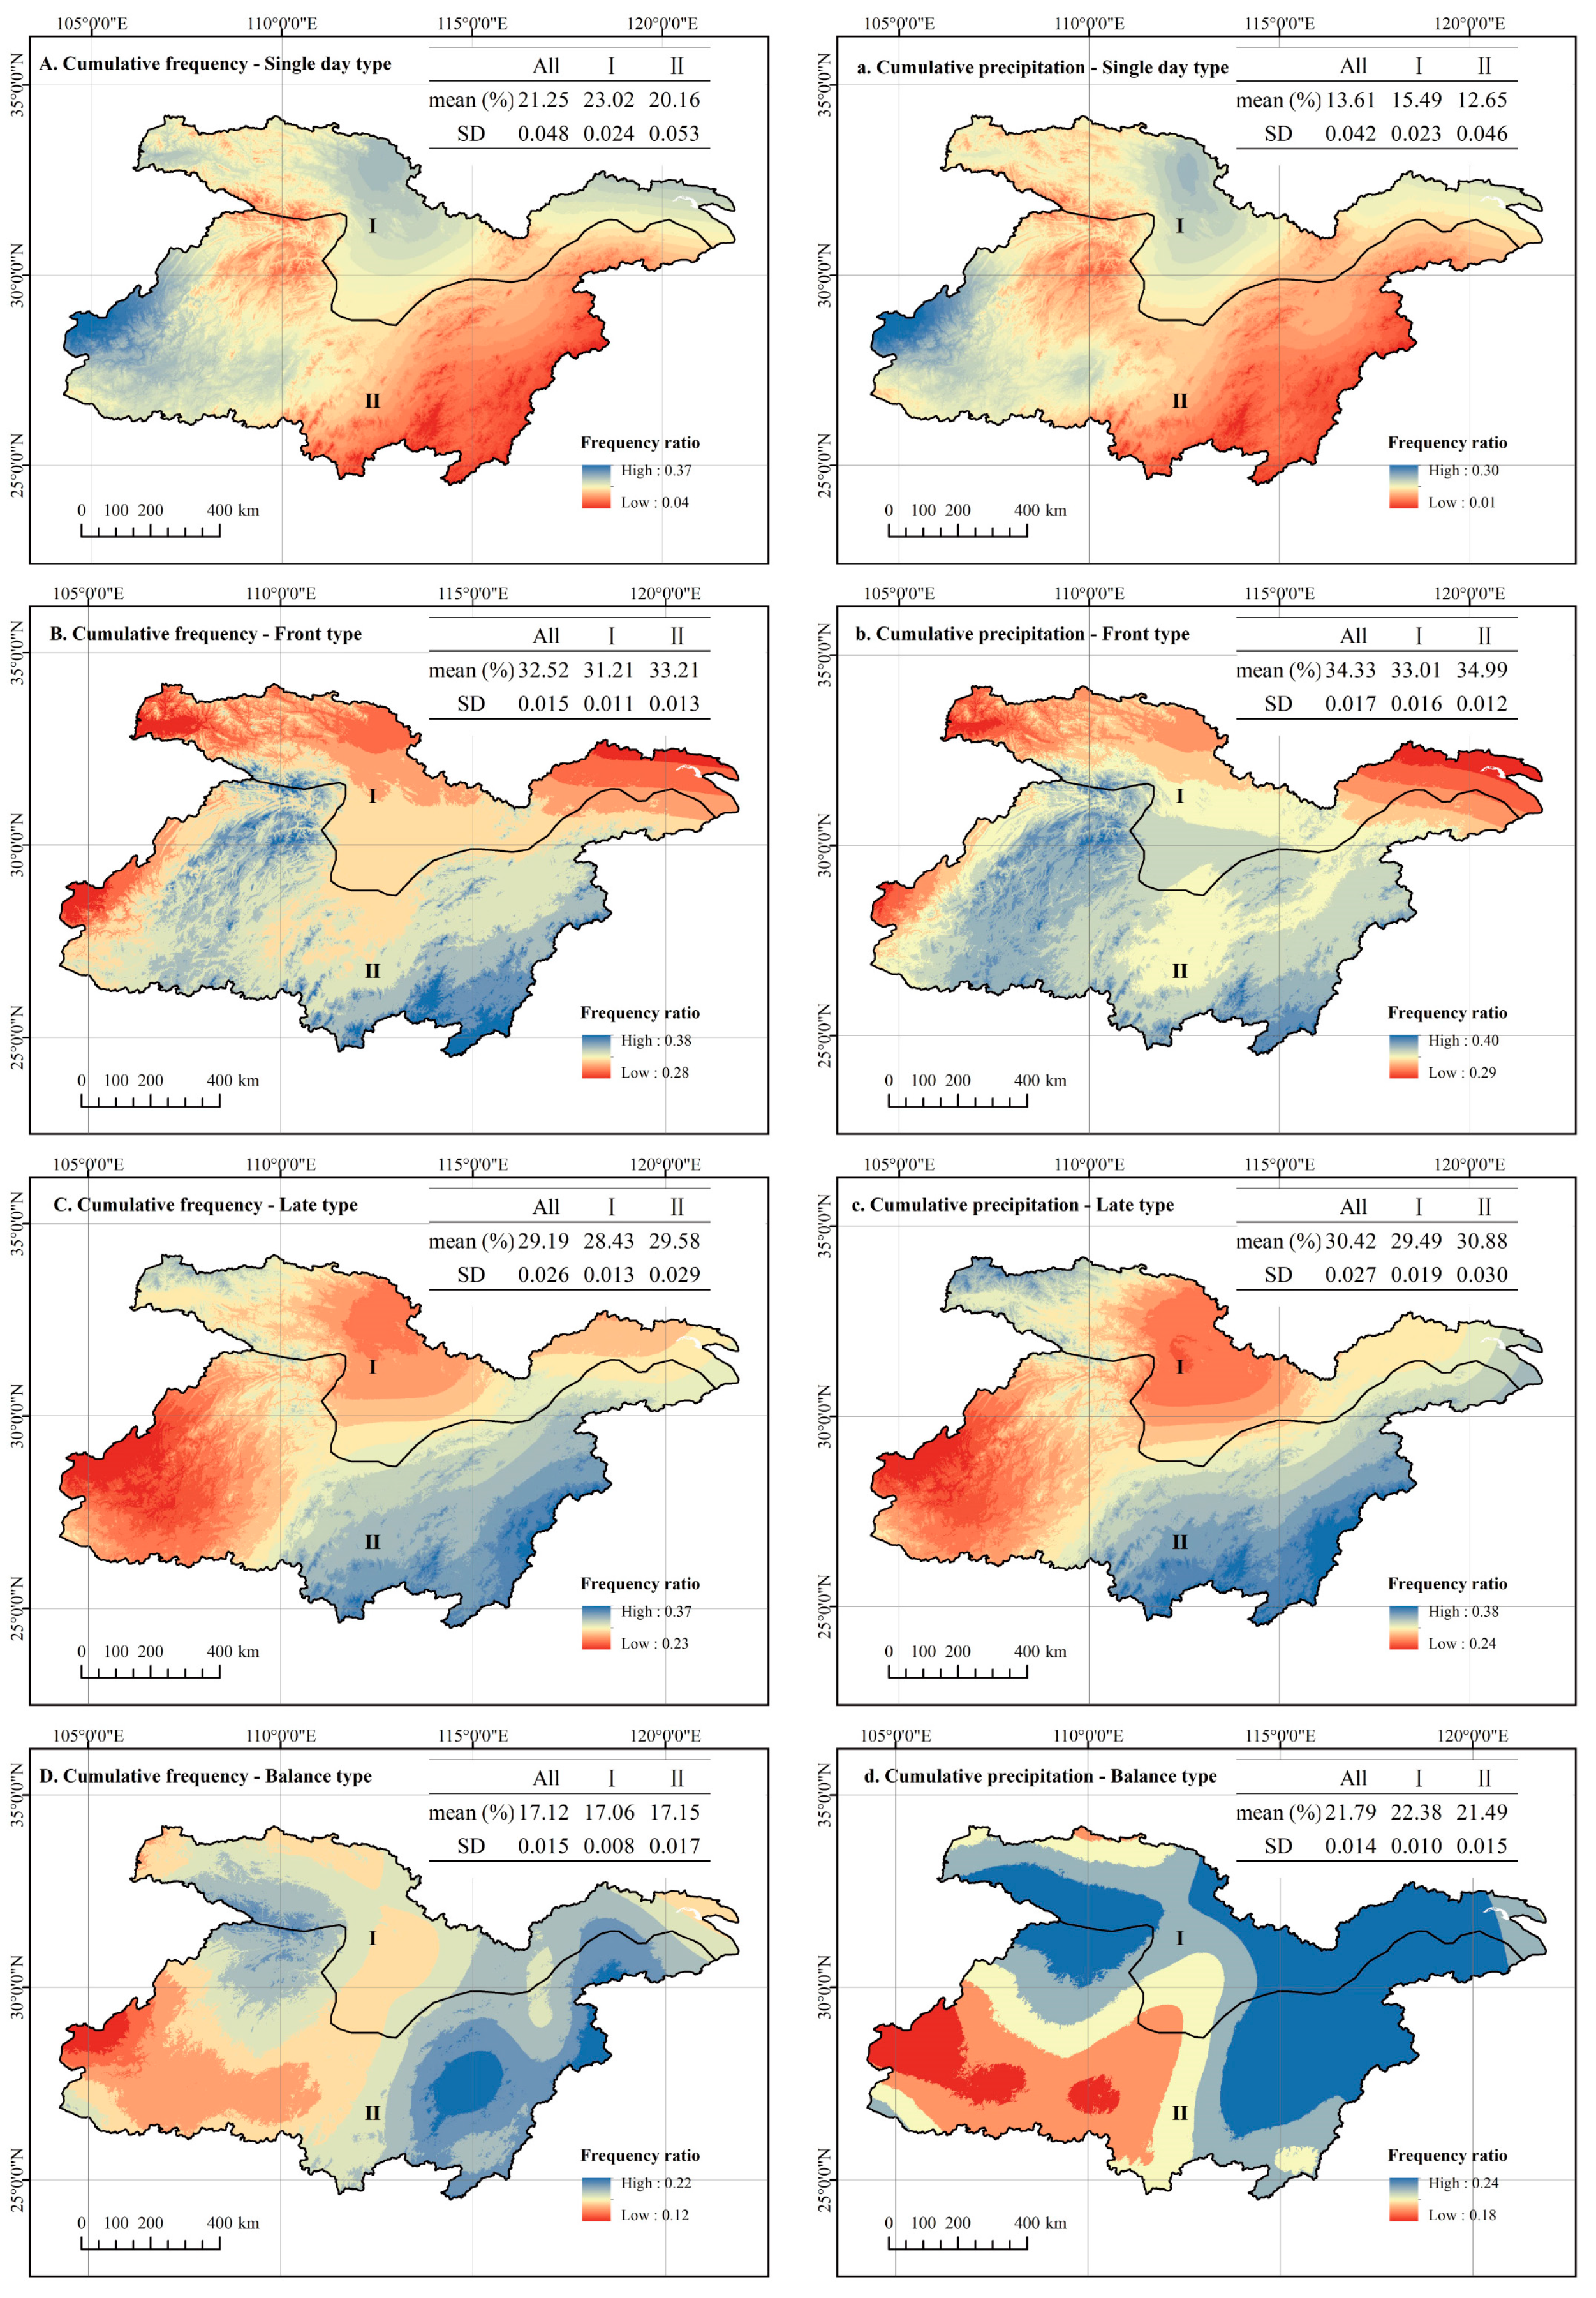
The precipitation amount and frequency of single-day EPEs accounted for only 13% and 21% of the EPEs, respectively, while the multi-day continuous EPEs (front EPE, late EPE, and balanced EPE) containing PSP accounted for 87% and 79%, respectively (Figure 6a,b). Front EPEs and late EPEs are the predominant EPE types in the MLRYRB, with both accounting for more than 60% of EPEs in the past 60 years.
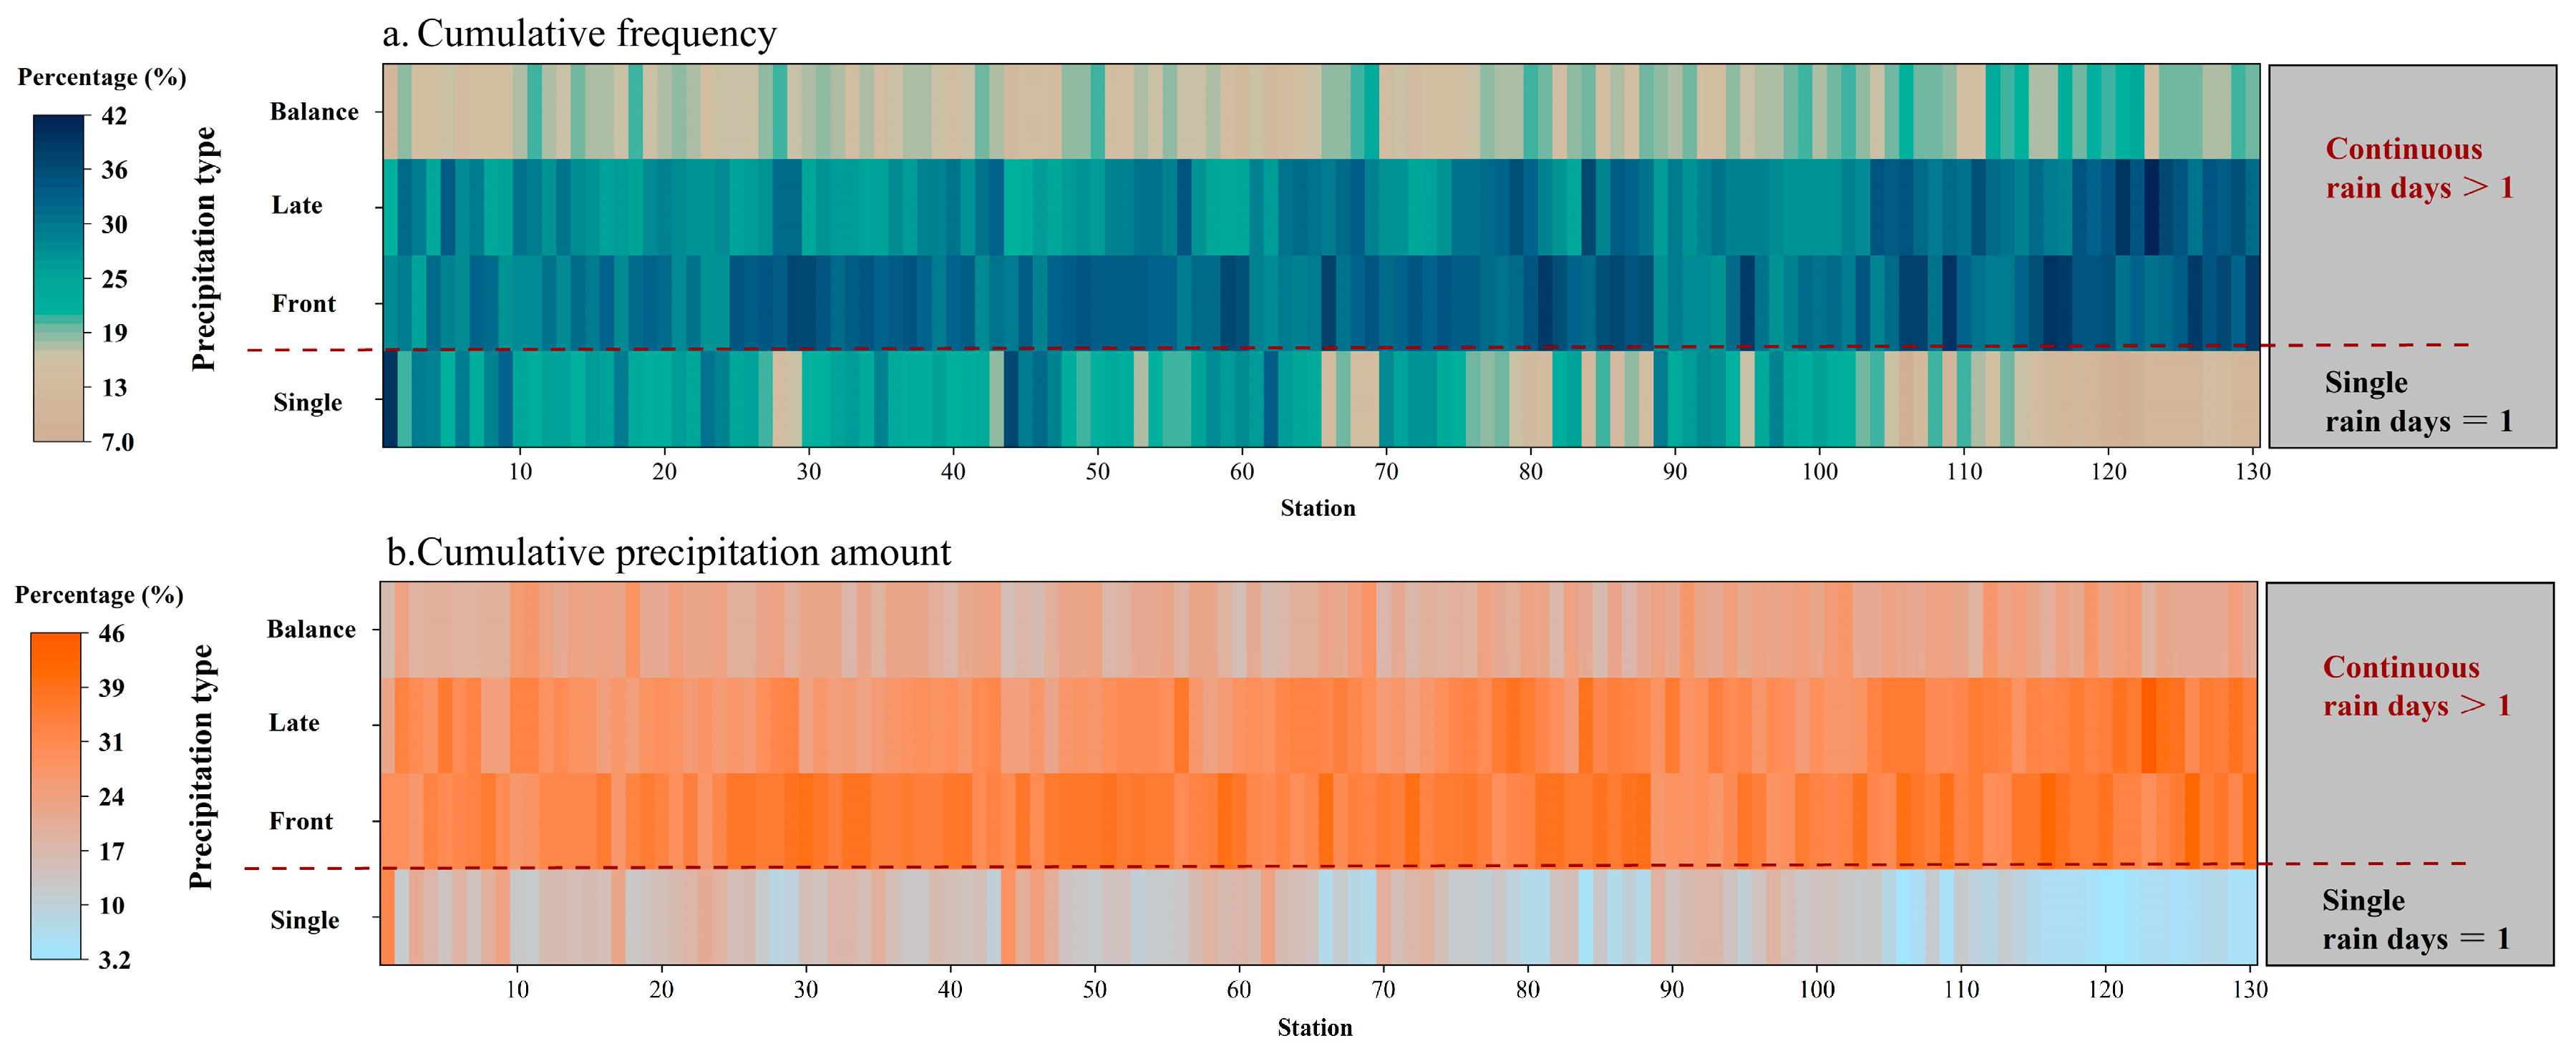
The spatial distribution of the cumulative precipitation and frequency (Figure 7) showed that the multi-year frequency and precipitation quantity of EPEs in the basin almost corresponded spatially. Single-day EPEs varied spatially from east to west, with a low value being observed in the eastern part of the basin. Late EPEs decreased gradually from southeast to northwest. In terms of differences in spatial dispersion, the Cv values were less than 0.07 and the entire basin exhibited relatively low spatial variations, indicating that the MLRYRB is dominated by variations in the four EPE types.

3.2.3. Interannual Variations in EPE

Trends of Different EPE Types

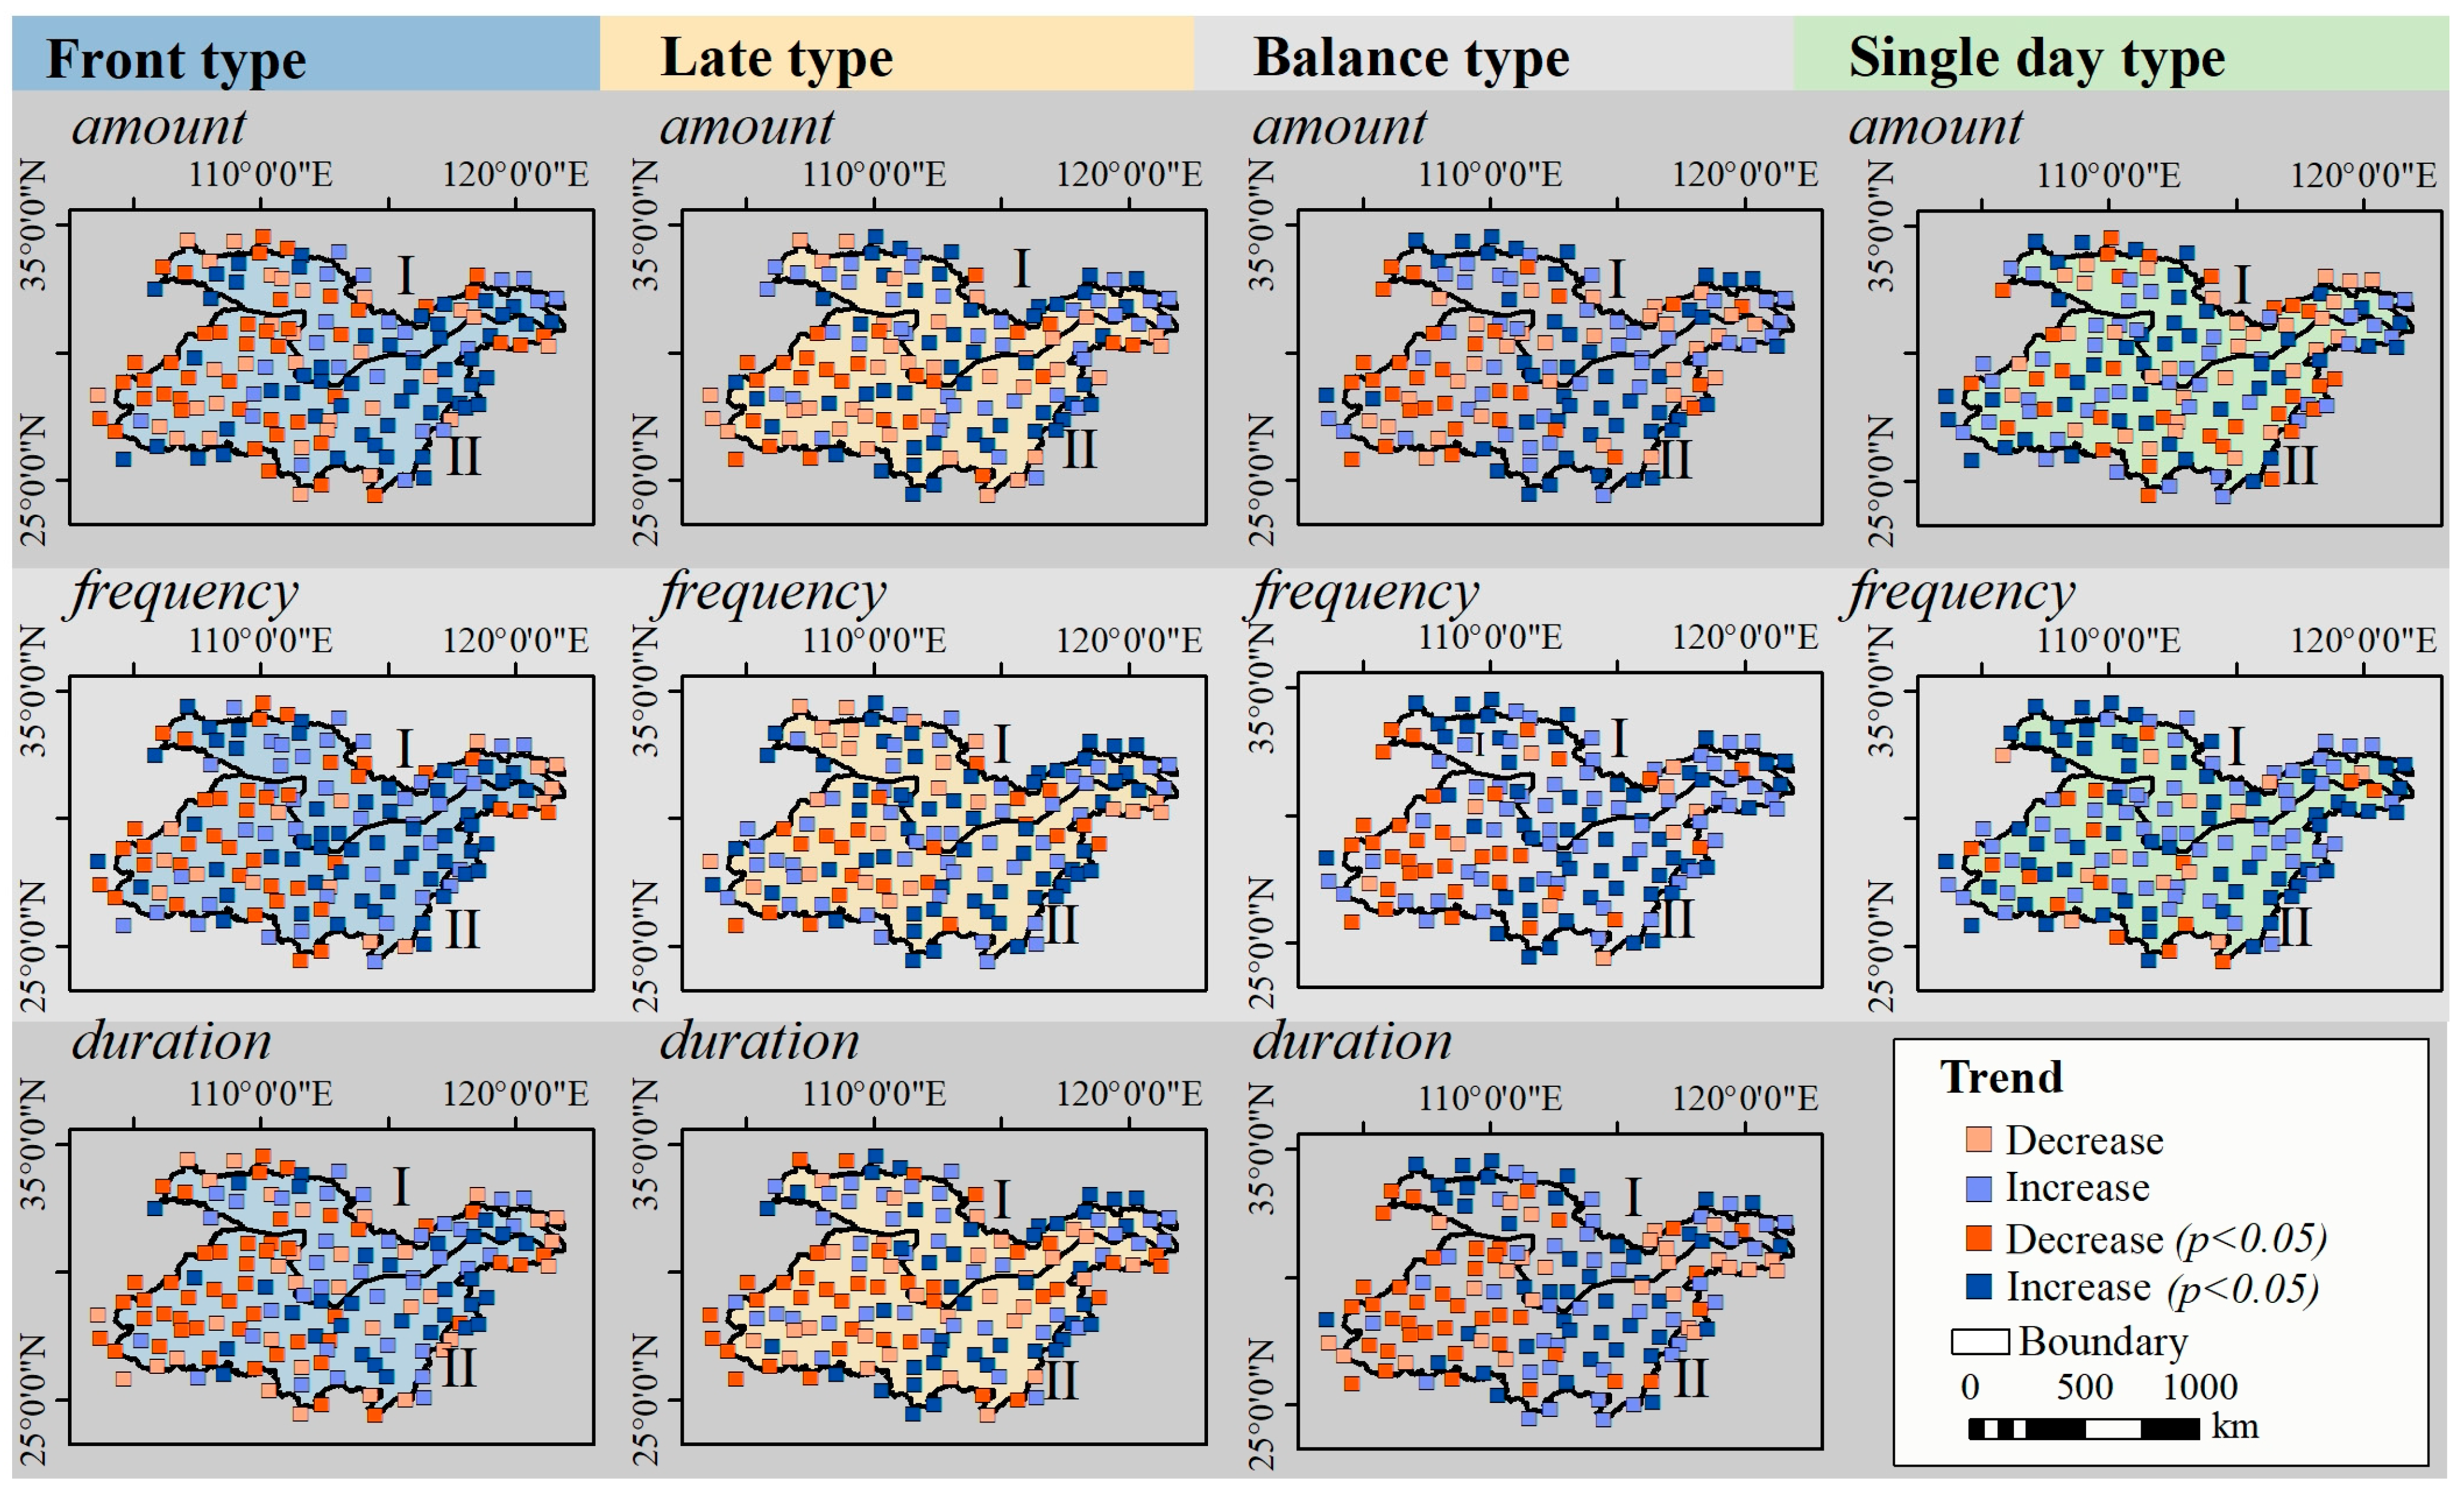
The frequency of the four types of EPEs in the MLRYRB exhibited a certain degree of variation in the last 60 years (Figure 8). The frequency of multi-day continuous EPEs was in the order of late EPEs > front EPEs > balanced EPEs. Although the frequency and quantity of single-day EPEs were low, single-day EPEs had the highest increase of nearly 60%. Spatial variation trends (Figure 9) revealed that the precipitation, frequency, and duration of front, late, and balanced EPEs in the southwest of the MLRYRB, including the Guizhou Plateau and Sichuan Basin, exhibited a downward trend. In contrast, an upward trend was shown in the southeast part of the MLRYRB.

Significance of Variations in EPE Trends

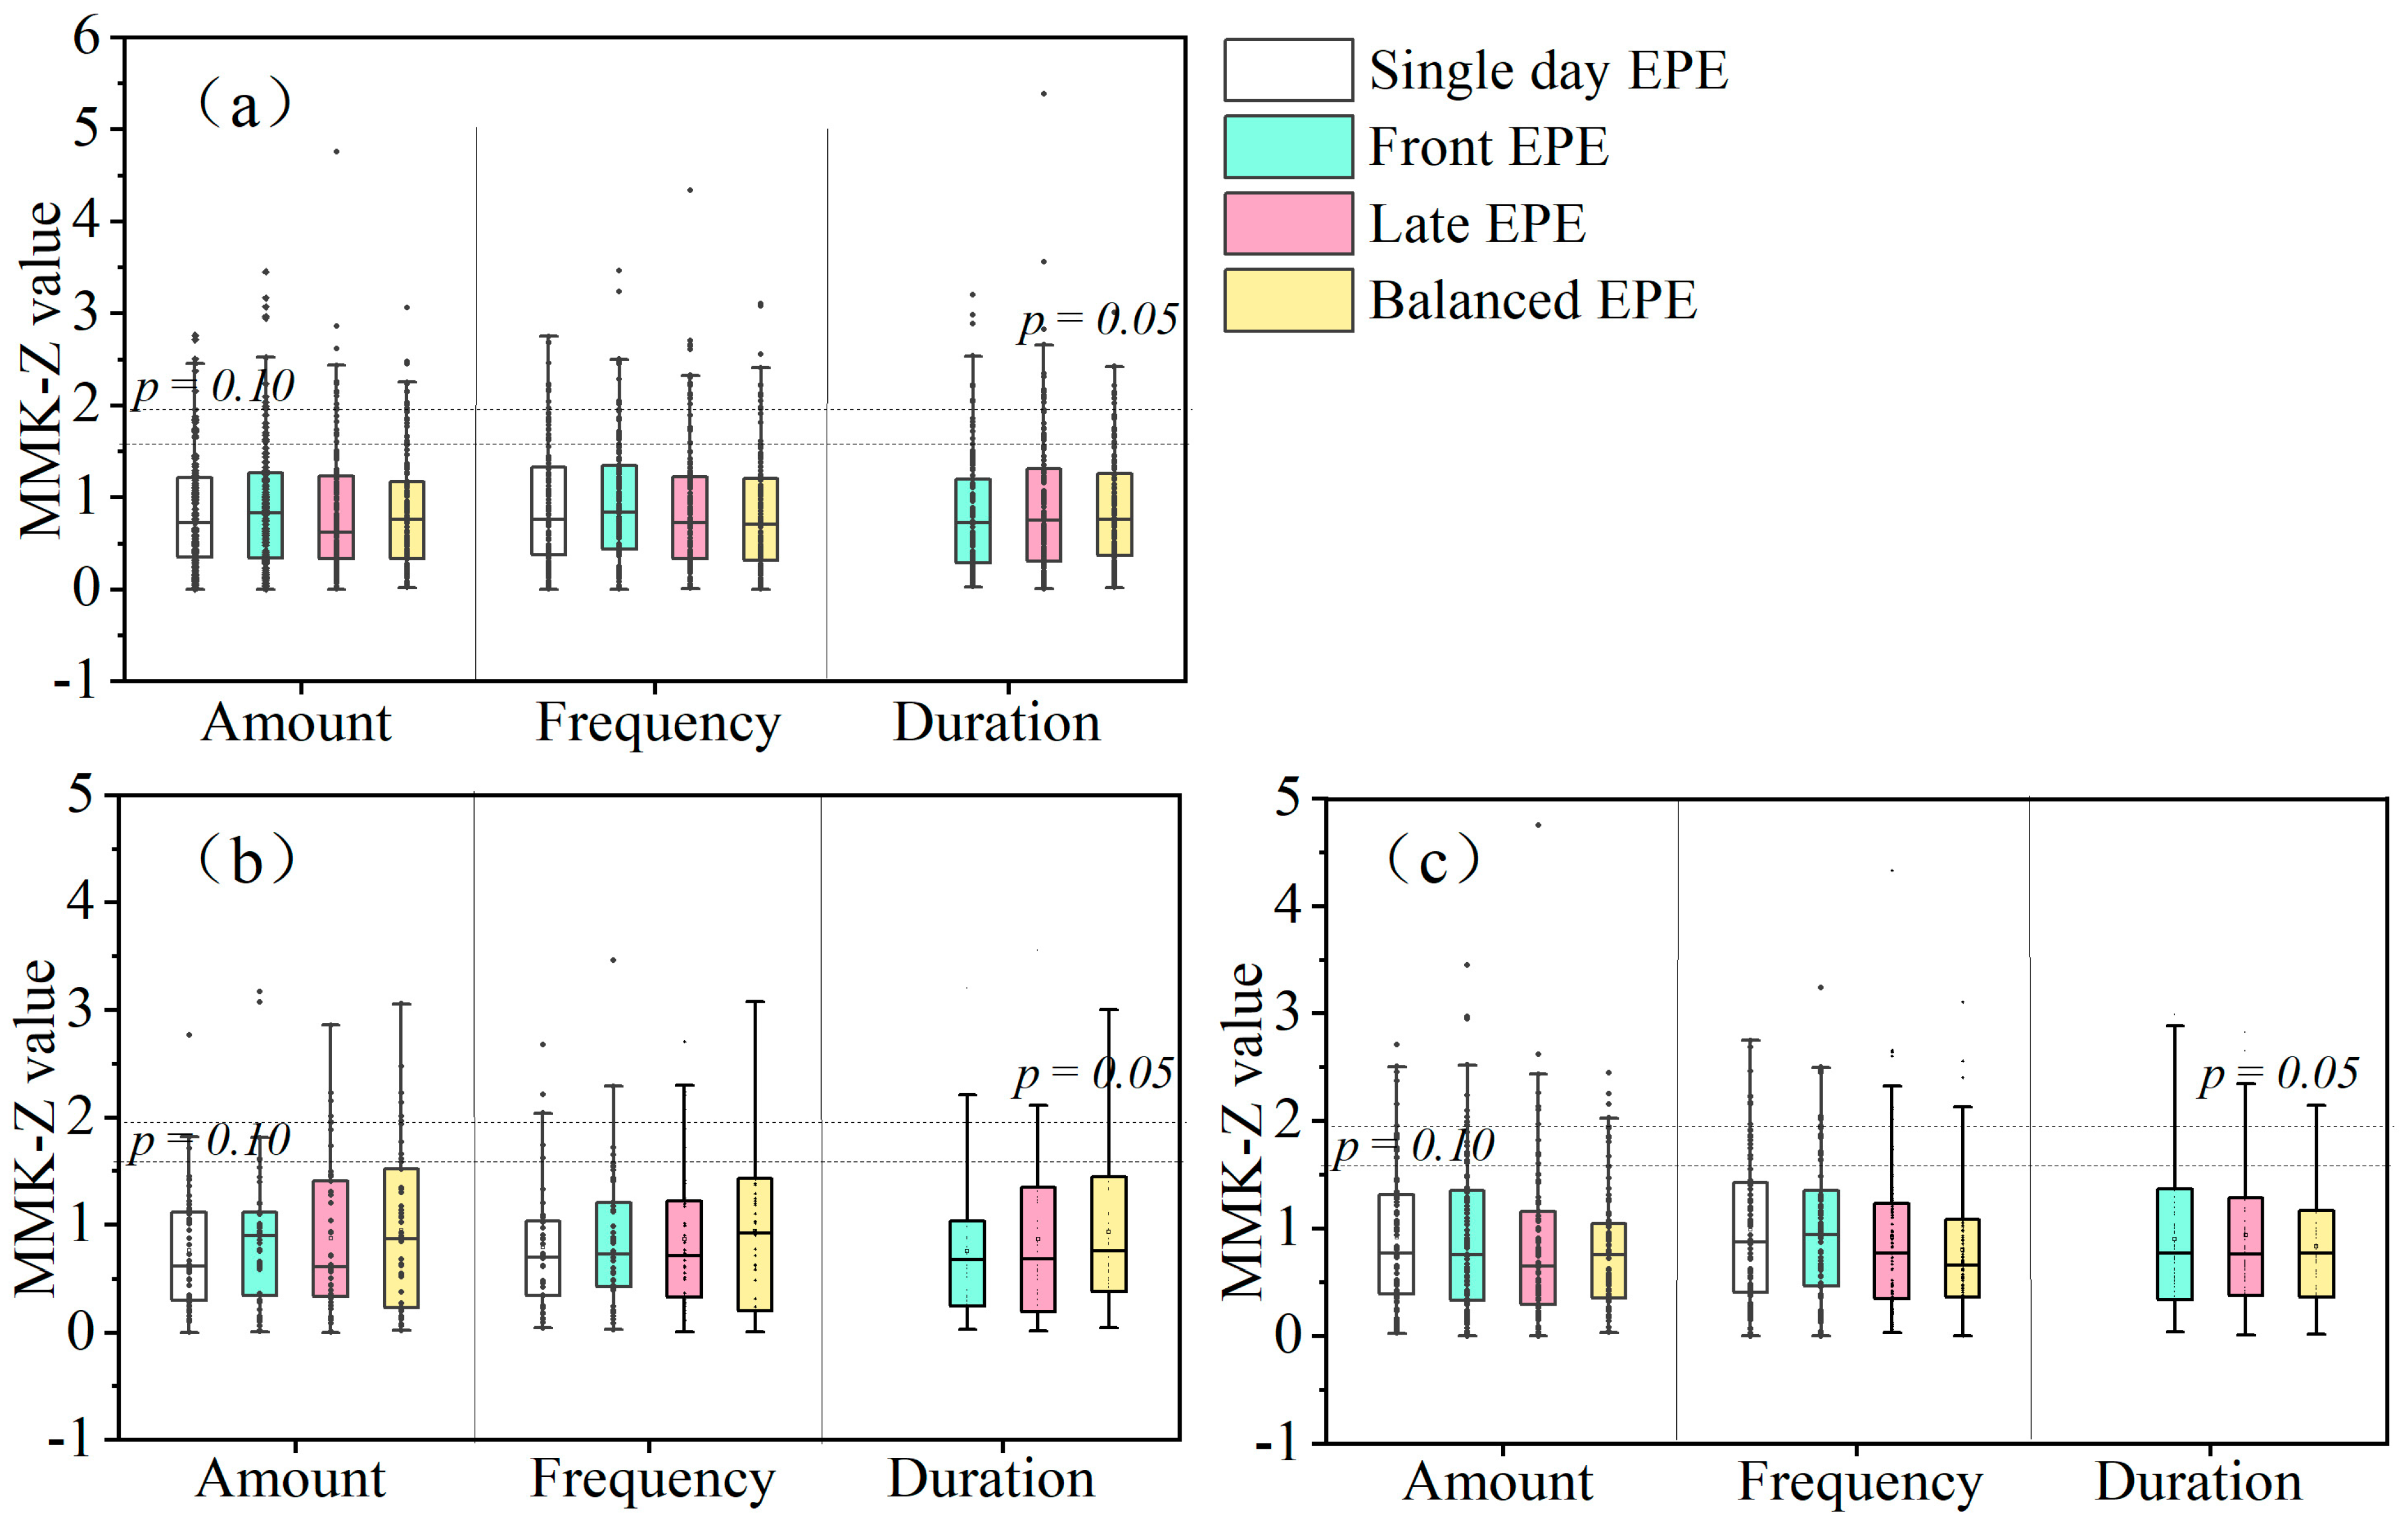
The trends in the different EPE types in the MLRYRB during the 1960–2019 period can be divided into two general categories based on data obtained from the 130 meteorological stations (Figure 10). First, significant trend changes accounted for approximately 46% of the entire basin. The three indices with significant changes in the EPEs were the highest in most meteorological stations and distributed across the entire basin. The frequency of single-day EPEs increased significantly in most of the meteorological stations. Second, fluctuating trend changes (insignificant) accounted for 54% of the stations in the basin. In the long run, the increase in EPEs is associated with temporal fluctuation, however, which requires further study with long-term observations.

Impact and Contribution of Extreme Precipitation to EPE

Multi-day continuous EPE types (front, late, and balanced) accounted for over 80% of the total EPEs in the MLRYRB, with the front and late EPEs accounting for more than 60% in the last 60 years (Figure 6). Based on the definition of an EPE, the summation of the daily extreme precipitation in an event should be less than or equal to the theoretical total amount of precipitation in an EPE. Thus, the PSP represents the difference between the extreme precipitation and the EPE in an event, which can reflect the degree of influence and the contribution of the extreme precipitation day’s precipitation to the total precipitation of the event. The C-value is presented as the contribution of precipitation on extreme precipitation days (EPD) to EPEs, and the formula is as follows:
C - value = E P E P S P E P E = E P D E P E
where the C-value = 1 for a single-day EPE and the C-value < 1 for multi-day continuous EPE types (front, late, and balanced EPEs). A low C-value indicates a greater contribution of PSP to an EPE.
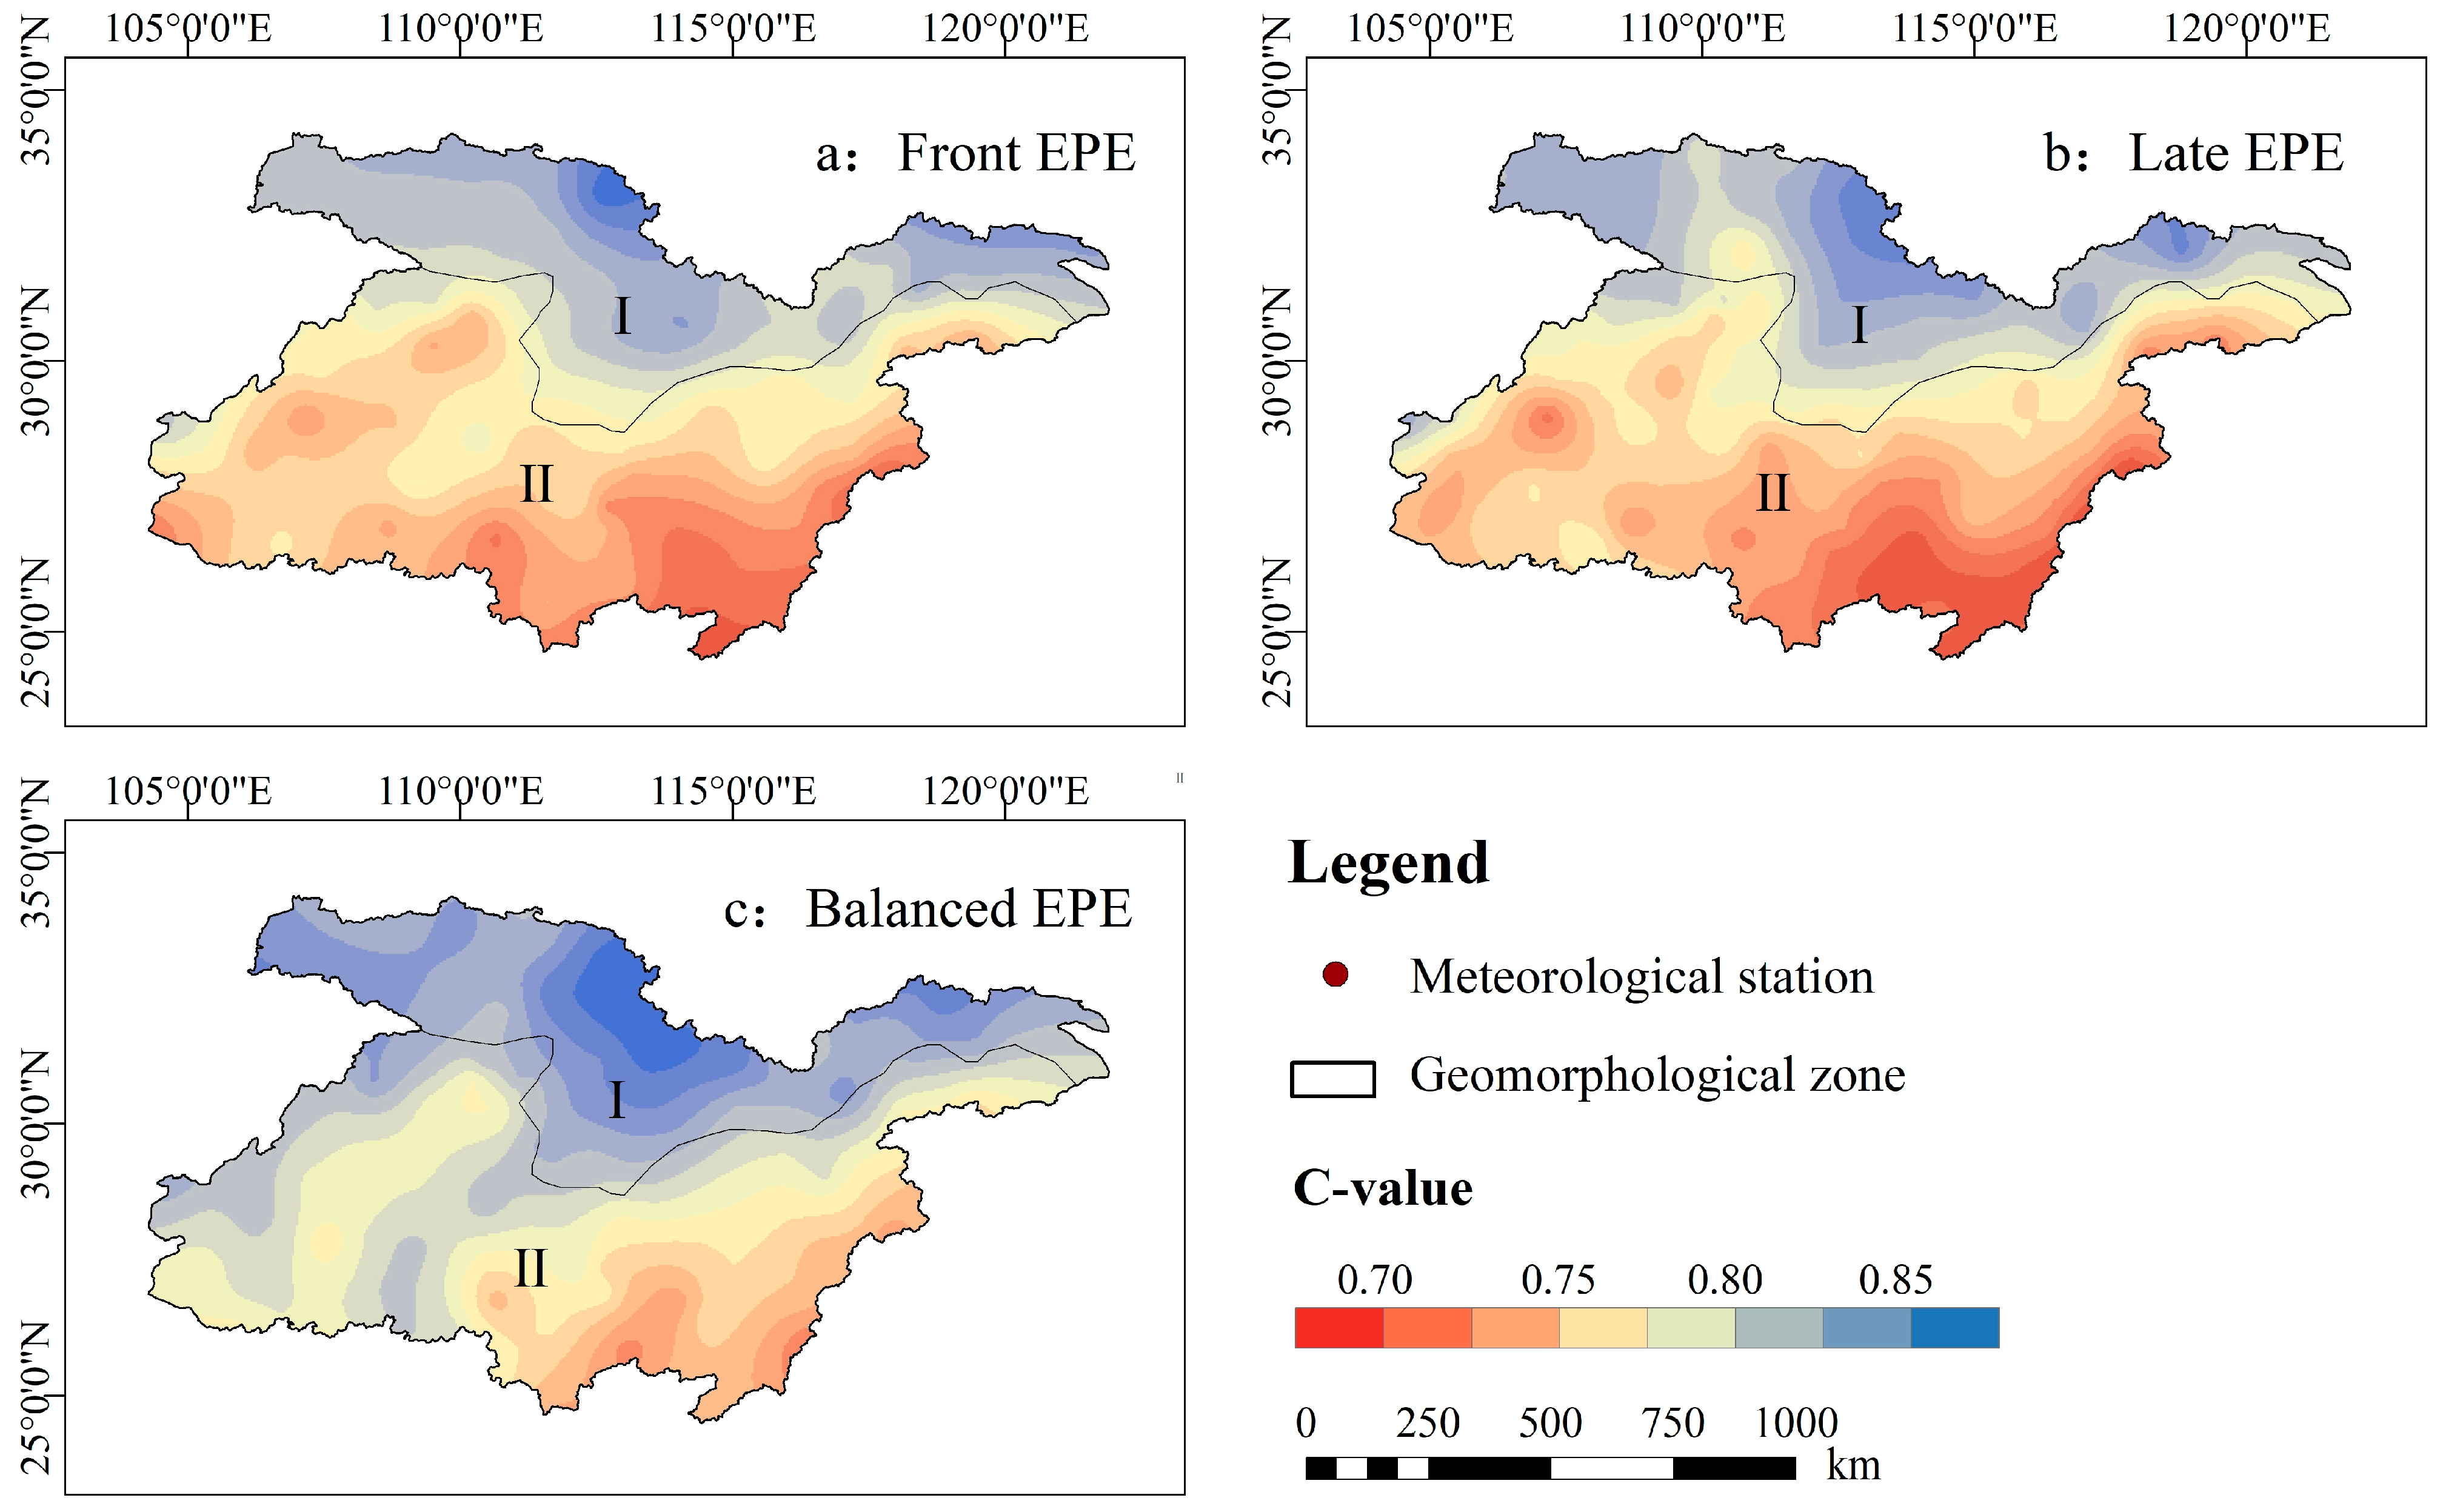
The long-term mean C-value for the three multi-day continuous EPE types ranged from 0.65 to 0.9 (Figure 11). The concentration range of the late EPEs was the lowest, indicating a greater contribution of PSP to late EPEs, followed by front EPEs. Both late and front EPEs showed considerable differences between the northern and southern area, and their spatial distribution was consistent with climatic regionalization. The concentration range of the balanced EPEs was relatively small, and the spatial distribution characteristics were consistent with that of China’s isoprecipitation line, which decreased from the southeast to the northwest.

3.2.4. Return Levels of Precipitation for EPEs

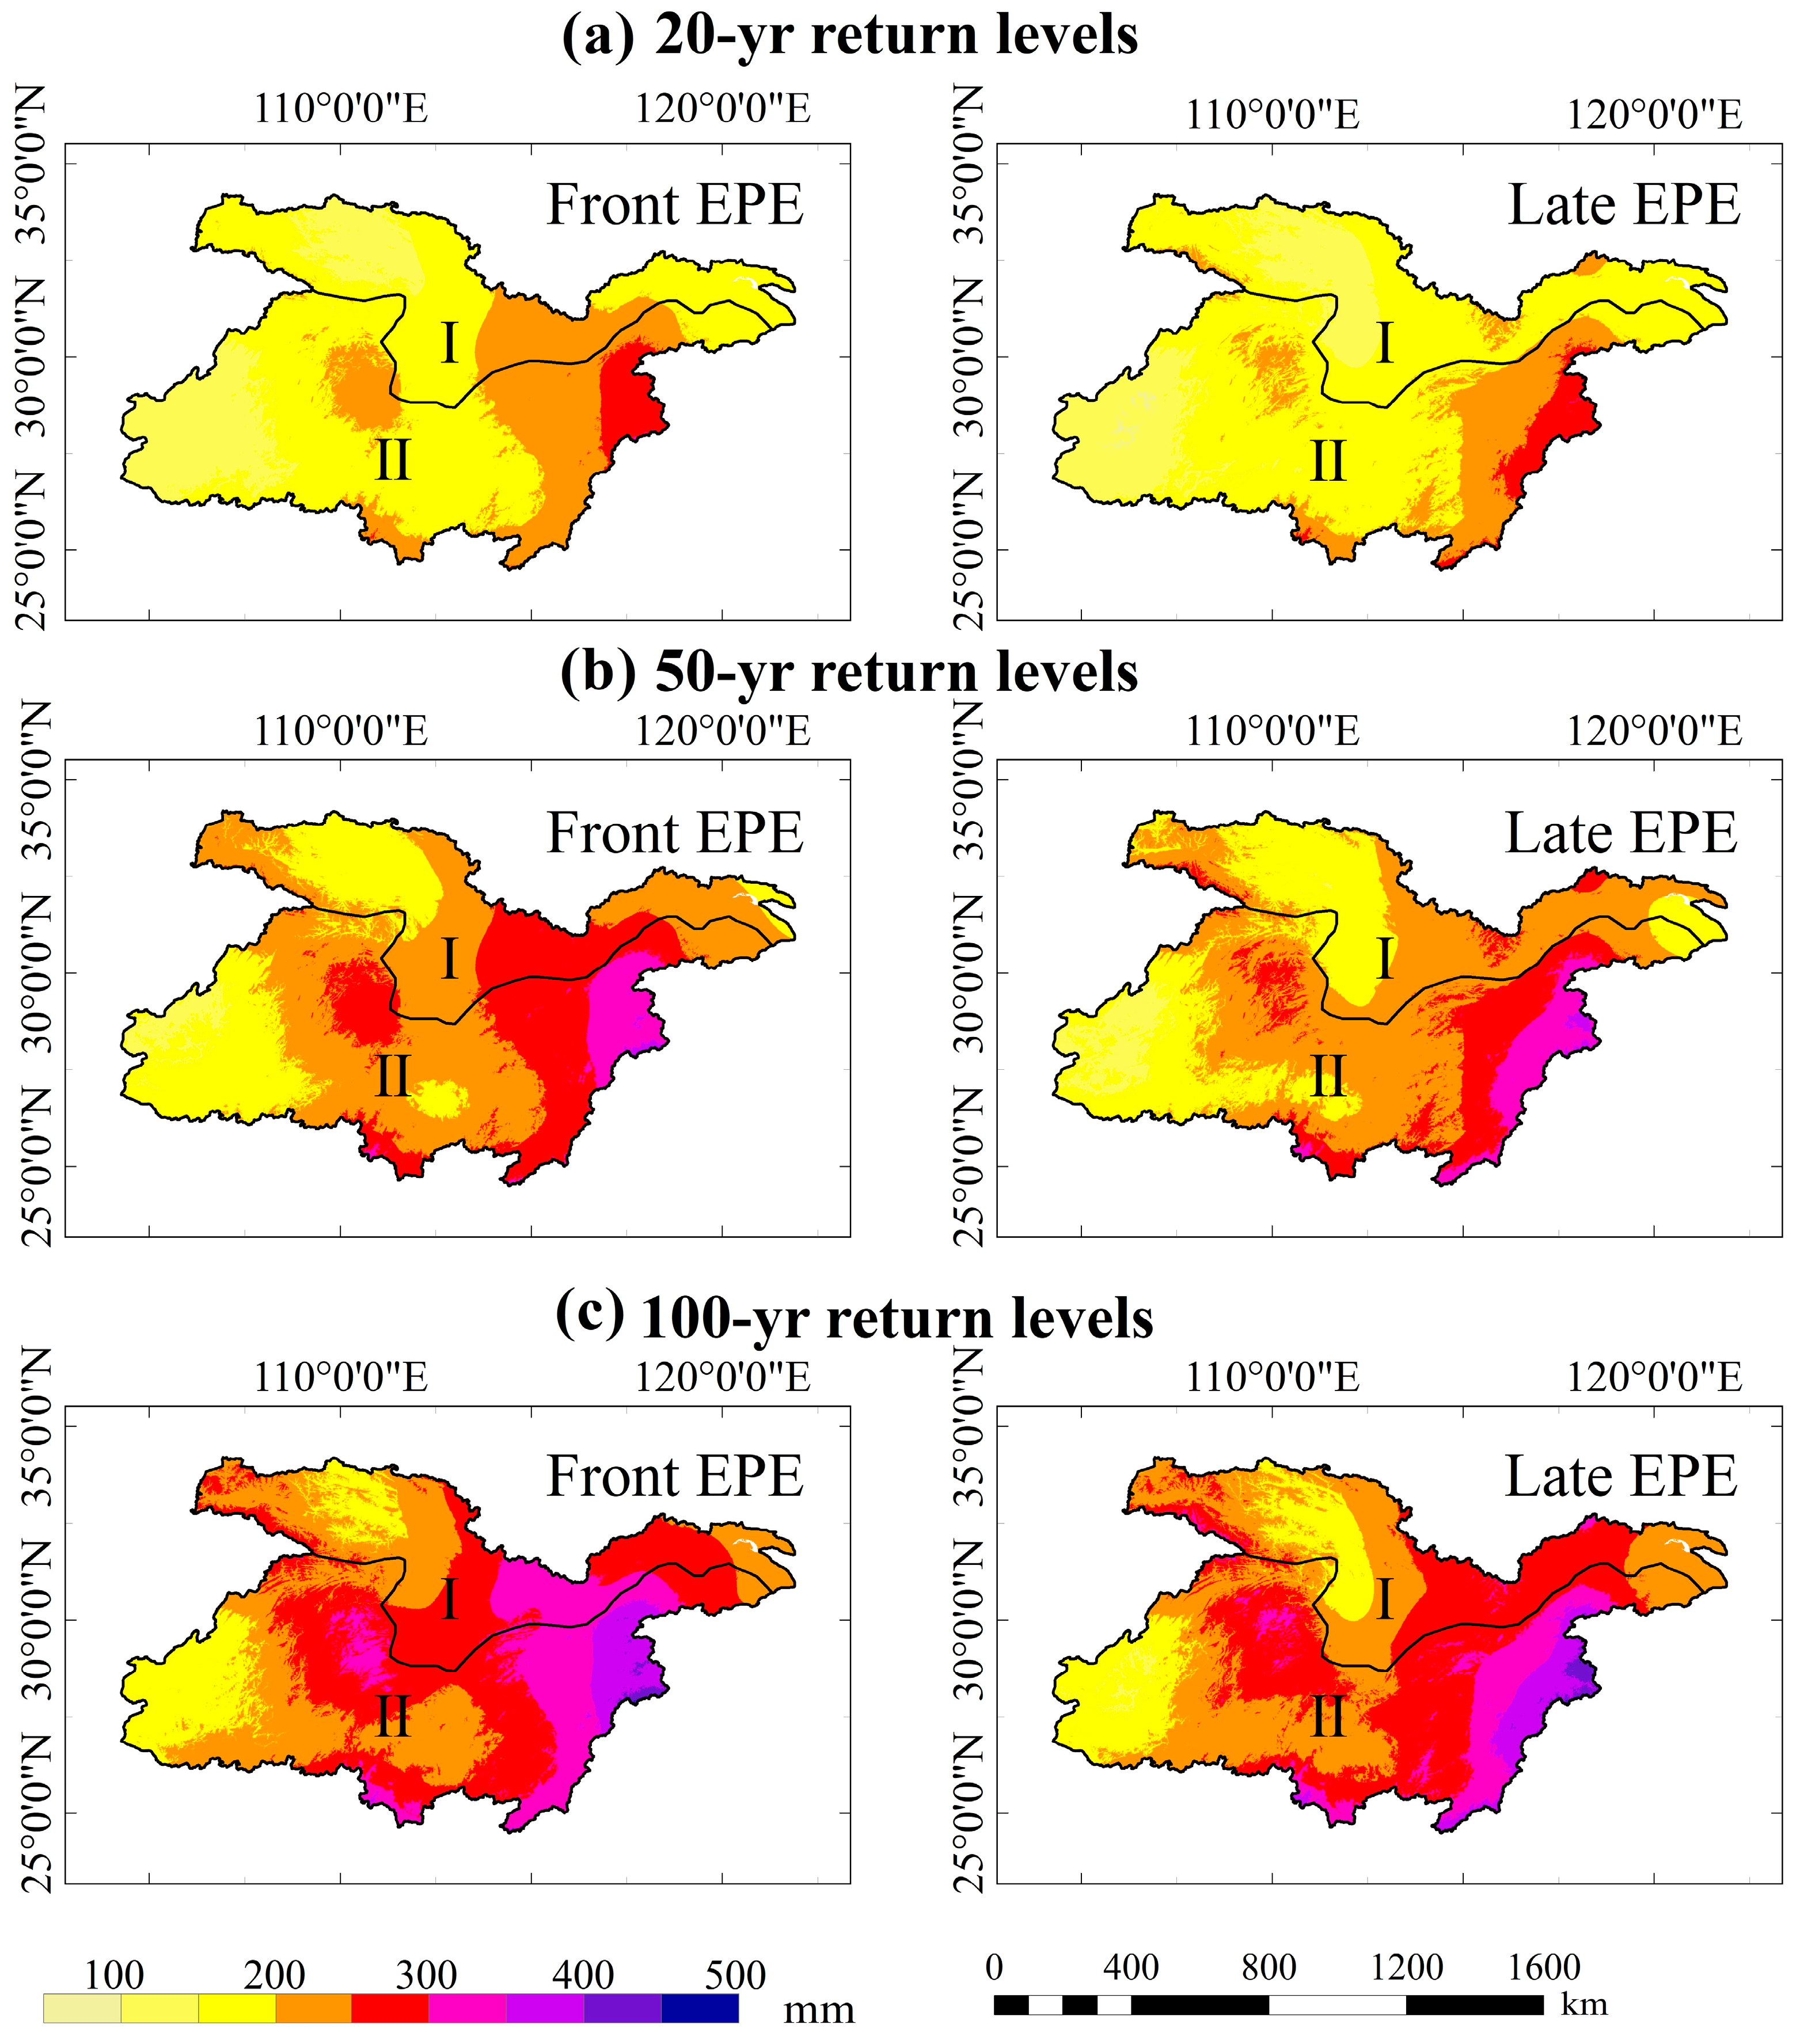
The two crucial and predominant EPE types in the MLRYRB were front and late EPEs because of their higher total amount and frequency of 65% and 62%, respectively. Therefore, the regression levels at 20, 50, and 100 years were set to predict the front and late EPEs (Figure 12). The regional averages of the 100-year prediction levels for front and late EPEs were 250 and 230 mm, respectively. From the west to the east, the front EPEs usually display higher precipitation than late EPEs, both of them indicating a significant increase in the horizontal direction.

3.2.5. Responses of EPE Types to Regional Warming

Global warming has exacerbated the instability of the climate system, increasing the frequency and intensity of the occurrence of anomalous circulation patterns, thereby triggering more extreme precipitation events [58]. Linear correlation analyses of temperature and precipitation statistics in the MLRYRB showed that temperature variations have a significant effect on single-day and late EPEs, with significant positive correlations across the region (Table 6). It is worth mentioning that precipitation parameters in the south are more closely related to temperature.
Nonlinear, multiscale wavelet coherence analyses revealed that the four EPE types in the MLRYRB had a positive correlation with temperature change, suggesting that the four types of EPE increased gradually under regional warming (Figure 13). Further, the response relationships between the EPEs and the temperature showed phased characteristics. The front and balanced EPEs had no significant correlation with the temperature before 1980, while a relatively short period (6–8a) occurred after 1990. The single-day EPEs indicated that regional warming occurred earlier than extreme precipitation variations after 2000. This discontinuous and inconsistent response over time could be related to uneven regional warming. The temperature showed a short-term decreasing trend between 1960 and 1969 (0.6 °C/10a) and then shifted to a sustained increase after 1970. A high warming rate (0.56 °C/10a) was observed during the 1990–2000 period, and 2010–2019 was the period with the highest regional warming rate (0.95 °C/10a) in the MLRYRB, and thus the responses of EPE and the temperature have become more intense and complex.

4. Discussion

4.1. Areas at High Risk of EPEs Under Climate Change in the MLRYRB

More attention should be paid to the multi-day EPE types in the MLRYRB, especially the front and late EPEs with relatively high precipitation and frequencies, which could pose a high risk of regional hydrological hazards triggered by extreme precipitation under continued global warming. According to observations, a front EPE lasting 5 days occurred in Wuhan (Station 57494), one of the centers of rainstorms in the Yangtze River, from 21 to 25 July 1998, with a total precipitation of more than 470 mm, and the highest precipitation in a single day was 285 mm, and this case of suprathreshold event magnitude is well reproduced in Figure 12. Combined with the predicted results of the GPD model, the performances of some local areas deserves attention [59]. Two significant areas of high values were observed (Figure 12). The first one was observed in the southeastern part of the MLRYRB, which receives the most abundant precipitation in China. This area is not only subject to climate warming, but also variations in thermal properties between the land and sea, and is thus sensitive to environmental factors, such as ocean currents and sea surface temperature [60,61,62,63]. The second hotspot was located west of the center of the MLRYRB, and the possible causes are worth discussing. This area was not observed in the earlier studies that predicted trends in the average precipitation or extreme precipitation indices. This area is within the southwestern part of Hubei Province (Yichang and Enshi Cities) and the northwestern part of Hunan Province (Dayong and Changde Cities), and geographically includes the Shennongjia Forestry District. Moreover, the Three Gorges project also belongs to this hotspot. This area is a complex small terrain formed by several typical landforms and forms the intersection between Guizhou Plateau and Jiangnan Hills. The terrain is rugged and the elevation changes rapidly. Therefore, it is speculated that the substantial EPEs observed in the second zone could be associated with the complex local microclimate cycle and regulatory effect of large-scale water conservation projects on the local microclimate [63,64,65]. Locally stronger descending air masses diffuse atmospheric moisture out of the lower troposphere region, which tends to cause excessive precipitation [66,67,68]. Although the storage of water in the Three Gorges Dam has a certain impact on the surrounding temperature and water vapor, the climate effect is a gradual long-term process, and the scope and intensity of the climate effect still require long-term observation data to verify [69,70,71,72].

4.2. Rationality of the EPE Concept for Application in the MLRYRB

The proportion of multi-day events (front, late, and balanced EPEs) in the MLRYRB over the last 60 years was greater than 86%, while the single-day EPEs with short durations accounted for only 14%, differing from the EPE characteristics observed in other regions. The Qinling Mountains have been characterized by multi-day EPEs in the last 50 years, with the balanced EPE frequency exceeding 30% as the dominant type [21]. In contrast, the frequency of EPEs with long durations is lower in the Loess Plateau, where the region is dominated by single-day EPEs [73]. In the Hindu Kush Himalayan region, the dominant type of extreme precipitation is represented by the temporal distribution pattern with peaks located on the right side [22]. The multi-year EPE concentration (C-value) in the MLRYRB varies between 0.65 and 0.9, suggesting that for the multi-day EPEs, PSP accounted for approximately 10%–35% of the total precipitation of an event. C-values increase as the average precipitation increases from northwestern to southeastern parts of the basin. The multi-year average value of the PSP at some stations in the southeastern coastal region were more than 30% of the total EPEs during the high-flow years (e.g., 1973, 1975, 1980, 1996, 1998, and 2020). Notably, the EPEs at some coastal stations can last more than half a month during the flood season and the contribution of precipitation from the PSP during a single event can exceed 60% of the total precipitation event [74,75]. A considerable amount of PSP and extreme-day precipitation, which are integral and objectively indivisible components of stormwater runoff and confluence, are superimposed on each other to form regional stormwater runoffs. Similarly, PSP can change the preexisting soil water conditions, making the area susceptible to flooding. In addition, a chain of secondary geological disasters may be triggered in localized areas with special underlying surfaces [76,77]. Based on the persistent characteristics of regional extreme precipitation, the method applied in this study did not segment the precipitation process and is therefore more applicable to some monsoon-controlled precipitation regions, such as the Amazon, Panama, and Malaysia, among others [78,79]. The concept of EPEs in this study lacks a more detailed threshold for PSP days, and the extent of the effect of PSP and the duration of the total precipitation in an EPE was difficult to determine. The results will be more precise if EPEs can be further analyzed according to different magnitudes of PSP in future work.

5. Conclusions

This study showed the variations in extreme precipitation in the MLRYRB between 1960 and 2019 based on extreme precipitation indices. In addition, the EPEs were classified into four categories to analyze their spatiotemporal characteristics and predict their return levels. The main conclusions of this paper are as follows:
(1) The precipitation in the MLRYRB has shown a non-significant increasing trend, while extreme precipitation was significant. (2) The MLRYRB is dominated by continuous EPE types (front, late, and balanced EPEs), with the highest frequency observed for front and late EPEs and the lowest frequency observed for single-day EPEs. (3) Higher growth trends were observed for single-day and late EPEs over the 60-year period. (4) The number of EPEs under three return levels (20-, 50-, and 100-year) increased from the western to the southeastern part of the basin. (5) EPEs were closely associated with climate warming, and single-day and late EPEs showed a tendency to increase with regional warming across the MLRYRB, especially in the southern region.

Author Contributions

Software, Y.R.; Investigation, Z.L. (Zhanbin Li) and Z.L. (Zifan Liu); Resources, Y.C.; Data curation, B.W.; Writing—original draft, Y.Z.; Visualization, Z.W.; Supervision, G.X.; Project administration, P.L. All authors have read and agreed to the published version of the manuscript.

Funding

This study was financially supported by the National Natural Science Foundation of China (Grant No. U2243201), the Shaanxi Provincial Key R&D Program in 2023: Research on Key Technologies for Assessing and Monitoring the Carbon Sequestration Capacity of Vegetation-Soil-Water Bodies in Typical Geomorphological Units in Shaanxi (2023-ZDLSF-65), the Shaanxi Provincial Department of Education Scientific Research Program Key Projects (23JT027), and the Shaanxi Province Philosophy and Social Science Research Special Project (2024QN112). We thank the reviewers for their useful comments and suggestions.

Institutional Review Board Statement

Not applicable.

Informed Consent Statement

Not applicable.

Data Availability Statement

Data are contained within the article.

Conflicts of Interest

The authors declare no conflict of interest.

References

  1. Trenberth, K.E. Changes in Precipitation with Climate Change. Clim. Res. 2011, 47, 123–138. [Google Scholar] [CrossRef]
  2. Fowler, H.J.; Lenderink, G.; Prein, A.F.; Westra, S.; Allan, R.P.; Ban, N.; Barbero, R.; Berg, P.; Blenkinsop, S.; Do, H.X.; et al. Anthropogenic intensification of short-duration rainfall extremes. Nat. Rev. Earth Environ. 2021, 2, 107–122. [Google Scholar] [CrossRef]
  3. Zhang, J.G.; Li, C.X.; Zhang, X.B.; Zhao, T.B. Improving simulations of extreme precipitation events in China by the CMIP6 global climate models through statistical downscaling. Atmos. Res. 2024, 303, 107344. [Google Scholar] [CrossRef]
  4. Frich, P.; Alexander, L.V.; Della-Marta, P.; Gleason, B.; Haylock, M.; Tank, A.M.G.K.; Peterson, T. Observed coherent changes in climatic extremes during the second half of the twentieth century. Clim. Res. 2002, 19, 193–212. Available online: https://www.jstor.org/stable/24866781 (accessed on 30 January 2023). [CrossRef]
  5. Alexander, L.V.; Zhang, X.; Peterson, T.C.; Caesar, J.; Gleason, B.E.; Tank, A.M.; Haylock, M.R.; Collins, D.; Trewin, B.C.; Rahimzadeh, F.; et al. Global observed changes in daily climate extremes of temperature and precipitation. J. Geophys. Res. 2006, 111, 1042–1063. [Google Scholar] [CrossRef]
  6. Chen, F.H.; Wang, J.S.; Jin, L.; Zhang, Q.; Li, J.; Chen, J.H. Rapid warming in mid-latitude central Asia for the past 100 years. Front. Earth Sci. 2009, 3, 42–50. [Google Scholar] [CrossRef]
  7. Ren, X.; Sha, Y.; Shi, Z.; Liu, X. Response of summer extreme precipitation over East Asia during the mid-Holocene versus future global warming. Glob. Planet. Change 2021, 197, 103398. [Google Scholar] [CrossRef]
  8. Sun, T.L.; Yao, S.X.; Huang, Q.; Guo, Q.; Xia, Y.C.; Zhang, H.M. Possible mechanism of the mid-high-latitude synoptic-scale disturbances impact on Meiyu precipitation anomalies. Atmos. Res. 2024, 298, 107137. [Google Scholar] [CrossRef]
  9. Shi, Y.F.; Jiang, T.Q.; Su, B.D.; Chen, J.Q.; Qin, N.X. Preliminary analysis on the relation between the evolution of heavy floods in the Yangtze River catchment and the climate changes since 1840. J. Lake Sci. 2004, 16, 289–297. (In Chinese) [Google Scholar] [CrossRef]
  10. Chen, J.Q.; Shi, Y.F.; Zhang, Q.; Zhang, Z.X. Climatic background for historical flood of 1860, 1870 during past 500 years in the upper Yangtze River basin. J. Lake Sci. 2006, 18, 476–483. (In Chinese) [Google Scholar] [CrossRef]
  11. Xu, Y.T.; Fang, J.; Tao, K.; Fang, J.Y.; Liu, Y.X. Increasing risk of synchronous floods in the Yangtze River basin from the shift in flood timing. Sci. Total Environ. 2024, 921, 171167. [Google Scholar] [CrossRef] [PubMed]
  12. Gao, T.; Xie, L. Spatiotemporal changes in precipitation extremes over Yangtze River Basin, China, considering the rainfall shift in the late 1970s. Glob. Planet. Chang. 2016, 147, 106–124. [Google Scholar] [CrossRef]
  13. Yuan, Z.; Yin, J.; Wei, M.; Yuan, Y. Spatio-temporal variations in the temperature and precipitation extremes in Yangtze River basin, China during 1961–2020. Atmosphere 2021, 12, 1423. [Google Scholar] [CrossRef]
  14. Jiang, Y.; He, X.G.; Li, J.J.; Zhang, X.P. On the response of daily precipitation extremes to local mean temperature in the Yangtze River basin. Atmos. Res. 2024, 300, 107265. [Google Scholar] [CrossRef]
  15. Zhang, S.; Ren, G.F.; Zhan, Y.J.; Zhang, C.; Ren, Y.Y. Extreme precipitation changes over the Yangtze River Basin in 1901–2020. Clim. Res. 2023, 90, 59–76. [Google Scholar] [CrossRef]
  16. Zhang, Q.; Peng, J.T.; Xu, C.Y.; Singh, V.P. Spatiotemporal variations of precipitation regimes across Yangtze River Basin, China. Theor. Appl. Climatol. 2014, 115, 703–712. [Google Scholar] [CrossRef]
  17. Gong, L.; Zhang, X.; Liu, J.; Gui, H.J. Exploring the influence of urban agglomeration on extreme precipitation: Evidence from the middle reaches of the Yangtze River, China. J. Hydrol. Reg. Stud. 2024, 55, 101932. [Google Scholar] [CrossRef]
  18. Wu, X.; Guo, S.; Yin, J.; Yang, G.; Zhong, Y.; Liu, D. On the event-based extreme precipitation across China: Time distribution patterns, trends, and return levels. J. Hydrol. 2018, 562, 305–317. [Google Scholar] [CrossRef]
  19. She, D.X.; Shao, Q.X.; Xia, J.; Taylor, J.A.; Zhang, Y.Y.; Zhang, L.P.; Zhang, X.; Zou, L. Investigating the variation and non-stationarity in precipitation extremes based on the concept of event-based extreme precipitation. J. Hydrol. 2015, 530, 785–798. [Google Scholar] [CrossRef]
  20. Zaman, M.; Ahmad, I.; Usman, M.; Saifullah, M.; Anjum, M.N.; Khan, M.I.; Uzair Qamar, M. Event-based time distribution patterns, return levels, and their trends of extreme precipitation across Indus basin. Water 2020, 12, 3373. [Google Scholar] [CrossRef]
  21. Li, S.S.; Wang, C.B.; Yan, J.P.; Liu, X.F. Variability of the event-based extreme precipitation in the south and north Qinling Mountains. Acta Geogr. Sin. 2020, 75, 989–1007. (In Chinese) [Google Scholar] [CrossRef]
  22. Malla, M.K.; Arya, D.S. Event-based extreme precipitation variability analysis over a part of the Hindu Kush Himalayan region. Int. J. Climatol. 2023, 43, 4196–4219. [Google Scholar] [CrossRef]
  23. White, R.H.; Battisti, D.S.; Skok, G. Tracking precipitation events in time and space in gridded observational data. Geophys. Res. Lett. 2017, 44, 8637–8646. [Google Scholar] [CrossRef]
  24. Hellie, F.; Peschke, G.; Seidler, C.; Niedel, D. Process-oriented subdivision of basins to improve the preprocessing of distributed precipitation-runoff-models. Interdiscip. Approaches Small Catchment Hydrol. Monit. Res. 2002, 137. Available online: https://www.researchgate.net/publication/242218175_Process-oriented_subdivision_of_basins_to_improve_the_preprocessing_of_distributed_precipitation-runoff-models (accessed on 25 February 2023).
  25. Wang, X.E.; Luo, M.; Wu, S.; Ning, G.; Liu, Z.; Wang, S.; Wang, P.; Zhang, H.; Li, X. Spatiotemporal evolution patterns of contiguous extreme precipitation events across China from a 3D perspective. Geophys. Res. Lett. 2022, 49, e2022GL098840. [Google Scholar] [CrossRef]
  26. Zhang, Y.H.; Liang, K.; Liu, C.M. Time distribution pattern and spatial heterogeneity of hourly scale event-based extreme precipitation in China. J. Hydrol. 2023, 622, 129712. [Google Scholar] [CrossRef]
  27. Guan, Y.H.; Zheng, F.L.; Zhang, X.C.; Wang, B. Trends and variability of daily precipitation and extremes during 1960–2012 in the Yangtze River Basin, China. Int. J. Climatol. 2017, 37, 1282–1298. [Google Scholar] [CrossRef]
  28. Lü, M.Q.; Wu, S.J.; Chen, J.L.; Chen, C.D.; Wen, Z.F.; Huang, Y.Y. Changes in extreme precipitation in the Yangtze River basin and its association with global mean temperature and ENSO. Int. J. Climatol. 2018, 38, 1989–2005. [Google Scholar] [CrossRef]
  29. Li, X.; Zhang, K.; Gu, P.R.; Feng, H.T.; Yin, Y.F.; Cheng, W.; Cheng, B.C. Changes in precipitation extremes in the Yangtze River basin during 1960-2019 and the association with global warming, ENSO, and local effects. Sci. Total Environ. 2021, 760, 144244. [Google Scholar] [CrossRef]
  30. Wu, X.; Wang, L.; Niu, Z.; Jiang, W.; Cao, Q. More extreme precipitation over the Yangtze River Basin, China: Insights from historical and projected perspectives. Atmos. Res. 2023, 292, 106883. [Google Scholar] [CrossRef]
  31. Vittal, H.; Karmakar, S.; Ghosh, S. Diametric changes in trends and patterns of extreme rainfall over India from pre-1950 to post-1950. Geophys. Res. Lett. 2013, 40, 3253–3258. [Google Scholar] [CrossRef]
  32. Garambois, P.A.; Larnier, K.; Roux, H.; Labat, D.; Dartus, D. Analysis of flash flood-triggering rainfall for a process-oriented hydrological model. Atmos. Res. 2014, 137, 14–24. [Google Scholar] [CrossRef]
  33. Xiao, C.; Wu, P.; Zhang, L.; Song, L.C. Robust increase in extreme summer rainfall intensity during the past four decades observed in China. Sci. Rep. 2016, 6, 38506. [Google Scholar] [CrossRef] [PubMed]
  34. Norbiato, D.; Borga, M.; Esposti, S.D.; Gaume, E.; Anquetin, S. Flash flood warning based on rainfall thresholds and soil moisture conditions: An assessment for gauged and ungauged basins. J. Hydrol. 2008, 362, 274–290. [Google Scholar] [CrossRef]
  35. Montesarchio, V.; Ridolfi, E.; Russo, F.; Napolitano, F. Rainfall threshold definition using an entropy decision approach and radar data. Nat. Hazards Earth Syst. Sci. 2011, 11, 2061–2074. [Google Scholar] [CrossRef]
  36. Coelho, G.D.A.; Ferreira, C.M.; Kinter, J.L. III. Multiscale and multi event evaluation of short-range real-time flood forecasting in large metropolitan areas. J. Hydrol. 2022, 612, 128212. [Google Scholar] [CrossRef]
  37. Yin, H.F.; Li, C.G. Human impact on floods and flood disasters on the Yangtze River. Geomorphology 2001, 41, 105–109. [Google Scholar] [CrossRef]
  38. Lu, H.; Shao, Q.; Liu, J.; Wang, J.; Chen, Z. Temporo-spatial distribution of summer precipitationover Qinghai-Tibet Plateau during the last 44 years. Acta Geogr. Sin. 2007, 62, 946–958. (In Chinese) [Google Scholar] [CrossRef]
  39. Yuan, C.; Yang, M. Interannual variations in summer precipitation in southwest China: Anomalies in moisture transport and the role of the tropical Atlantic. J. Clim. 2020, 33, 5993–6007. [Google Scholar] [CrossRef]
  40. Lu, G.; Li, Q.Q.; Sun, X.T.; Zhao, M.C.; Dong, L.L.; Wu, Q.Y.; Wang, L.J.; Zhao, L.; Duan, C.F.; Yin, Y.Z.; et al. Comparative analysis of peak-summer heatwaves in the Yangtze-Huaihe River Basin of China in 2022 and 2013: Thermal effects of the Tibetan Plateau. Atmos. Res. 2024, 300, 107222. [Google Scholar] [CrossRef]
  41. Nanding, N.; Chen, Y.; Wu, H.; Dong, B.; Tian, F.; Lott, F.C.; Tett, S.F.B.; Rico-Ramirez, M.A.; Chen, Y.; Huang, Z.; et al. Anthropogenic Influences on 2019 July Precipitation Extremes Over the Mid-Lower Reaches of the Yangtze River. Front. Environ. Sci. 2020, 8, 603061. [Google Scholar] [CrossRef]
  42. Zhang, X.; Alexander, L.; Hegerl, G.C.; Jones, P.; Tank, A.K.; Peterson, T.C.; Trewin, B.; Zwiers, F.W. Indices for monitoring changes in extremes based on daily temperature and precipitation data. Wiley Interdiscip. Rev. Clim. Chang. 2011, 2, 851–870. [Google Scholar] [CrossRef]
  43. Agyekum, J.; Annor, T.; Quansah, E.; Lamptey, B.; Okafor, G. Extreme temperature indices over the Volta Basin: CMIP6 model evaluation. Sci. Afr. 2022, 16, e01181. [Google Scholar] [CrossRef]
  44. Topaloğlu, F. Regional trend detection of Turkish river flows. Hydrol. Res. 2006, 37, 165–182. [Google Scholar] [CrossRef]
  45. Hamed, K.H.; Rao, A.R. A modified Mann-Kendall trend test for autocorrelated data. J. Hydrol. 1998, 204, 182–196. [Google Scholar] [CrossRef]
  46. Kendall, M.; Jean, G. Rank Correlation Methods. Br. J. Psychol. 1990, 25, 86–91. [Google Scholar] [CrossRef]
  47. Bonaccorso, B.; Cancelliere, A.; Rossi, G. Detecting trends of extreme rainfall series in Sicily. Adv. Geosci. 2005, 2, 7–11. [Google Scholar] [CrossRef]
  48. Hutchinson, M.F.; McKenney, D.W.; Lawrence, K.; Pedlar, J.H.; Hopkinson, R.F.; Milewska, E.; Papadopol, P. Development and testing of Canada-Wide Interpolated spatial models of daily minimum-maximum temperature and precipitation for 1961–2003. J. Appl. Meteorol. Climatol. 2009, 48, 725–741. [Google Scholar] [CrossRef]
  49. Whitcher, B.; Guttorp, P.; Percival, D.B. Wavelet analysis of covariance with application to atmospheric time series. J. Geophys. Res. Atmos. 2000, 105, 14941–14962. [Google Scholar] [CrossRef]
  50. Grinsted, A.; Moore, J.C.; Jevrejeva, S. Application of the cross wavelet transform and wavelet coherence to geophysical time series. Nonlinear Process. Geophys. 2004, 11, 561–566. [Google Scholar] [CrossRef]
  51. Wu, X.; Wang, Z.; Guo, S.; Liao, W.; Zeng, Z.; Chen, X. Scenario-based projections of future urban inundation within a coupled hydrodynamic model framework: A case study in Dongguan City, China. J. Hydrol. 2017, 547, 428–442. [Google Scholar] [CrossRef]
  52. Su, H.; Hu, J.; Wen, Z. Service life predicting of dam systems with correlated failure modes. J. Perform. Constr. Facil. 2011, 27, 252–269. [Google Scholar] [CrossRef]
  53. Kuzuha, Y. Estimating optimal stochastic probability distributions of daily precipitation considering return periods of the largest records. J. Jpn. Soc. Hydrol. Water Resour. 2015, 28, 59–71. [Google Scholar] [CrossRef]
  54. Ding, Y.; Zhang, J.; Jiang, Z. Experimental simulations of extreme precipitation based on the multi-status markov chain model. Acta Meteorol. Sin. 2010, 24, 484–491. [Google Scholar] [CrossRef]
  55. Langousis, A.; Mamalakis, A.; Puliga, M.; Deidda, R. Threshold detection for the generalized Pareto distribution: Review of representative methods and application to the NOAA NCDC daily rainfall database. Water Resour. Res. 2016, 52, 2659–2681. [Google Scholar] [CrossRef]
  56. Donegan, S.P.; Tucker, J.C.; Rollett, A.D.; Barmak, K.; Groeber, M. Extreme value analysis of tail departure from log-normality in experimental and simulated grain size distributions. Acta Mater. 2013, 61, 5595–5604. [Google Scholar] [CrossRef]
  57. Pels, W.A.; Adebanji, A.O.; Twumasi-Ankrah, S. Comparison of parameter estimators for Generalized Pareto Distribution under peak over threshold. Math. Stat. 2020, 8, 711–720. [Google Scholar] [CrossRef]
  58. Gründemann, G.J.; Giesen, N.V.D.; Brunner, L.; Ent, R.V.D. Rarest rainfall events will see the greatest relative increase in magnitude under future climate change. Commun. Earth Environ. 2022, 3, 235. [Google Scholar] [CrossRef]
  59. Gao, J.J.; Ma, P.F.; Du, J.; Huang, X.Q. Spatial distribution of extreme precipitation in the Tibetan Plateau and effects of external forcing factors based on Generalized Pareto Distribution. Water Supply 2021, 21, 1253–1262. [Google Scholar] [CrossRef]
  60. Simmonds, I.; Bi, D.H.; Yan, B.L. Relationships between summer rainfall over China and ocean temperatures in the tropical western pacific. J. Meteorol. Soc. Jpn. 1996, 74, 273–279. [Google Scholar] [CrossRef]
  61. Chen, X.; Zhou, T. Relative contributions of external SST forcing and internal atmospheric variability to July-August heat waves over the Yangtze River valley. Clim. Dyn. 2018, 51, 4403–4419. [Google Scholar] [CrossRef]
  62. Gao, M.; Wang, B.; Yang, J.; Dong, W. Are peak summer sultry heat wave days over the Yangtze-Huaihe River Basin predictable? J. Clim. 2018, 31, 2185–2196. [Google Scholar] [CrossRef]
  63. Deng, K.Q.; Jiang, X.W.; Hu, C.D.; Chen, D.L. More frequent summer heat waves in southwestern China linked to the recent declining of Arctic sea ice. Environ. Res. Lett. 2020, 15, 074011. [Google Scholar] [CrossRef]
  64. Miller, N.L.; Jin, J.; Tsang, C.F. Local climate sensitivity of the Three Gorges Dam. Geophys. Res. Lett. 2005, 32, L16704. [Google Scholar] [CrossRef]
  65. Ma, Z.Z.; Ray, R.L.; He, Y.P. Assessing the spatiotemporal distributions of evapotranspiration in the Three Gorges Reservoir Region of China using remote sensing data. J. Mt. Sci. 2018, 15, 2676–2692. [Google Scholar] [CrossRef]
  66. Huang, S.Z.; Zhang, X.; Chen, N.C.; Li, B.Y.; Ma, H.L.; Xu, L.; Li, R.H.; Dev, N. Drought propagation modification after the construction of the Three Gorges Dam in the Yangtze River Basin. J. Hydrol. 2021, 603, 127138. [Google Scholar] [CrossRef]
  67. Liu, J.Q.; Lin, C.; Dong, S.; Feng, R.X.; Su, A.; Cui, J.H.; Yu, S.P. 30 Years of Climate Change before and after the Impoundment of the Three Gorges Reservoir. J. Earth Sci. 2023, 34, 1315–1318. [Google Scholar] [CrossRef]
  68. Liu, X.B.; Peng, J.; Liu, Y.X.; Yu, S.T.; Wang, Y.L. The Three Gorges Dam has weakened the drought propagation process in the Yangtze River Basin. J. Hydrol. 2024, 632, 130875. [Google Scholar] [CrossRef]
  69. Dong, Q.; Zhang, X.; Lall, U.; Sang, Y.F.; Xie, P. An improved nonstationary model for flood frequency analysis and its implication for the three gorges dam China. Hydrol. Sci. J. 2019, 64, 845–855. [Google Scholar] [CrossRef]
  70. Tang, H.M.; Wasowski, J.; Juang, C.H. Geohazards in the Three Gorges Reservoir Area, China-Lessons learned from decades of research. Eng. Geol. 2019, 261, 105267. [Google Scholar] [CrossRef]
  71. Sheng, L.; Liu, D.Y.; Wang, B.H.; Yu, S.H.; Zuo, Y.W.; Gu, F.T. Temporal variations characteristic of precipitation in the Three Gorges Reservoir Area from 1961 to 2016. J. Water Clim. Chang. 2022, 13, 1765–1775. [Google Scholar] [CrossRef]
  72. Wu, X.J.; Wang, L.C.; Cao, Q.; Niu, Z.G.; Dai, X. Regional climate change and possible causes over the Three Gorges Reservoir Area. Sci. Total Environ. 2023, 903, 166263. [Google Scholar] [CrossRef] [PubMed]
  73. Zhang, Y.X.; Li, P.; Xu, G.C.; Min, Z.Q.; Li, Q.S.; Li, Z.B.; Wang, B.; Chen, Y.T. Temporal and spatial variation characteristics of extreme precipitation on the Loess Plateau of China facing the precipitation process. J. Arid Land 2023, 15, 439–459. [Google Scholar] [CrossRef]
  74. Melching, C.S.; Papanicolaou, A.N. Foreword to the Special Issue on the Yangtze River. J. Hydraul. Eng. 2009, 135, 697. [Google Scholar] [CrossRef]
  75. Jia, H.C.; Chen, F.; Pan, D.H.; Du, E.Y.; Wang, L.; Wang, N.; Yang, A.Q. Flood risk management in the Yangtze River basin-Comparison of 1998 and 2020 events. Int. J. Disaster Risk Reduct. 2021, 68, 102724. [Google Scholar] [CrossRef]
  76. Cascini, L.; Cuomo, S.; Pastor, M.; Sacco, C. Modelling the post-failure stage of rainfall-induced landslides of the flow type. Can. Geotech. J. 2013, 50, 924–934. [Google Scholar] [CrossRef]
  77. Wang, K.; Zhang, S. Rainfall-induced landslides assessment in the Fengjie County, Three-Gorge reservoir area, China. Nat. Hazards 2021, 108, 451–478. [Google Scholar] [CrossRef]
  78. Kenji, K.; Akio, K.; Takao, U.; Ryo, M.; Akira, N. Changes in precipitation-based extremes indices due to global warming projected by a global 20-km-mesh atmospheric model. SOLA 2006, 2, 64–67. [Google Scholar] [CrossRef]
  79. Durman, C.F.; Gregory, J.M.; Hassell, D.C.; Jones, R.G.; Murphy, J.M. A comparison of extreme European daily precipitation simulated by a global and a regional climate model for present and future climates. Q. J. R. Meteorol. Soc. 2010, 127, 1005–1015. [Google Scholar] [CrossRef]
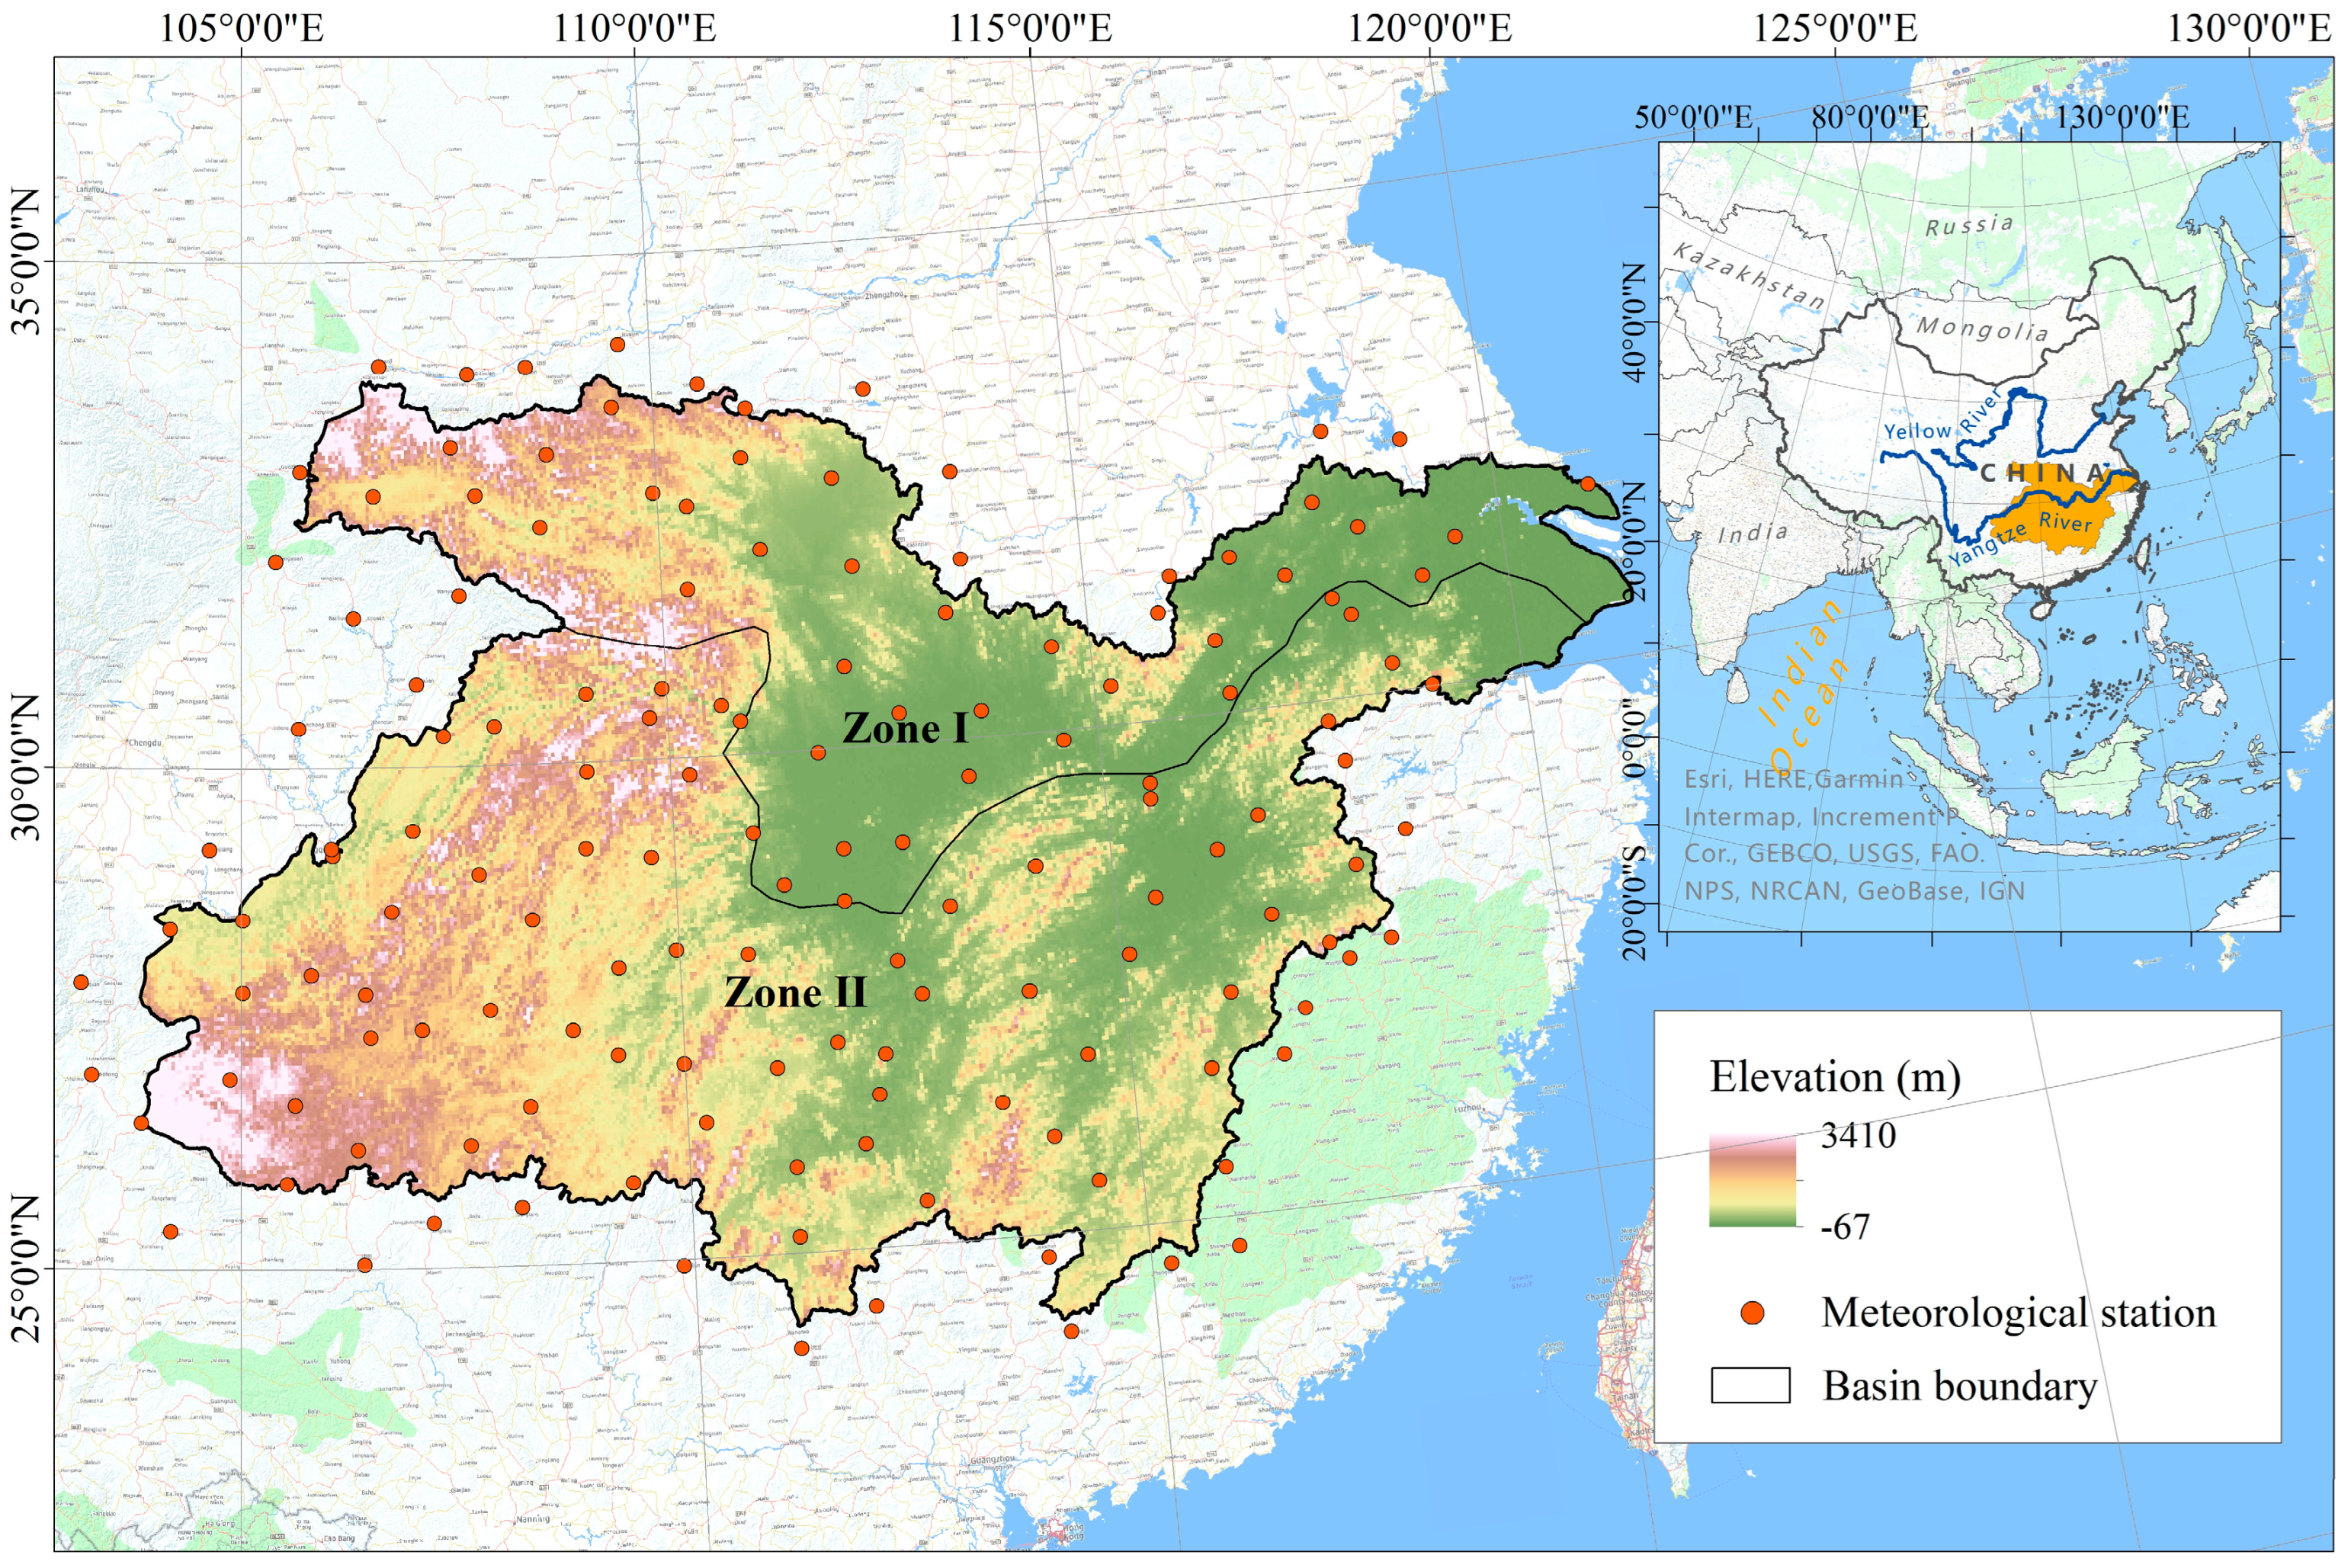
Figure 1. Overview of the study area and spatial distribution of the meteorological stations.
Sustainability 16 09197 g001
Figure 2. Identification process of extreme precipitation events (EPEs).
Sustainability 16 09197 g002
Figure 3. Spatial distribution of precipitation in different climate zones during the 1960–2019 period in the mid–lower reaches of the Yangtze River Basin.
Sustainability 16 09197 g003
Figure 4. Temporal variation in extreme precipitation in the mid–lower reaches of the Yangtze River Basin.
Sustainability 16 09197 g004
Figure 5. Cumulative frequency and monthly precipitation for different extreme precipitation event (EPE) types during the 1960–2019 period.
Sustainability 16 09197 g005
Figure 6. (a) Cumulative frequency of the extreme precipitation event (EPE) types during the 1960–2019 period. (b) Cumulative precipitation percentages of the extreme precipitation event (EPE) types during the 1960–2019 period.
Sustainability 16 09197 g006
Figure 7. Spatial distribution of extreme precipitation event (EPE) types during the 1960–2019 period.
Sustainability 16 09197 g007
Figure 8. Precipitation amount and frequency trends in extreme precipitation events (EPEs) during the 1960–2019 period.
Sustainability 16 09197 g008
Figure 9. Spatial variation trends in precipitation, frequency, and duration of extreme precipitation events (EPEs) during the 1960–2019 period.
Sustainability 16 09197 g009
Figure 10. Trends in the precipitation, frequency, and duration of extreme precipitation events (EPEs) in (a) the entire basin, (b) in the northern region (Zone I), and (c) in the southern region of the basin (Zone II).
Sustainability 16 09197 g010
Figure 11. Concentrations of extreme precipitation events (EPEs).
Sustainability 16 09197 g011
Figure 12. Return levels of precipitation for extreme precipitation events (EPEs) at (a) 20 years, (b) 50 years, and (c) 100 years.
Sustainability 16 09197 g012
Figure 13. Wavelet coherence analysis of extreme precipitation event types and temperature. The thick black contour indicates correlations above the 95% significance level against the noise.
Sustainability 16 09197 g013
Table 1. Definition of extreme precipitation indices.
AbbreviationIndexDefinitionUnit
Annual total wet-day precipitationPRCPTOTSum of annual precipitationmm
Precipitation on very extremely wet daysR99pSum of precipitation with daily precipitation ≥ 99th percentilemm
Precipitation on extreme wet daysR95pSum of precipitation with daily precipitation ≥ 95th percentilemm
Wet daysRdaySum of annual precipitation daysd
Total precipitation on extreme wet daysR95daySum of day with daily precipitation ≥ 95th percentiled
Simple precipitation intensity indexSDIIAverage precipitation in precipitation daysmm·d−1
Simple extreme precipitation intensity indexSDIIq95Average precipitation in extreme precipitation daysmm·d−1
Table 2. Classification of extreme precipitation events (EPEs).
TypeCategorizationExplanation
Single day typeA. Single day EPEEPE occurs within only 1 day, are short period, and are of high intensity.
Continuous typeB. Front EPEIn an EPE, the extreme precipitation exceeding the 95.0% threshold is clustered in the first half of the total precipitation period. That is, the first period is the time when extreme precipitation occurs, and the later period has no extreme precipitation, and the intensity of precipitation is significantly weakened.
C. Late EPEThe distribution of the extreme precipitation moments above the 95.0% threshold for an EPE is mainly in the second half of the total course.
D. Balanced EPEExtreme precipitation exceeding the 95.0% threshold for an EPE are distributed in both the before and after phases, indicating that the precipitation process has multiple extreme peaks.
Table 3. Cross-validation results of spatial interpolation of precipitation.
ElementCategorySNRSignalRMSERTVAR
Average precipitation1960–19890.3114.214.125.3
1970–19990.1811.917.330.5
1980–20090.2114.519.840.6
1990–20190.2012.720.344.7
2000–20190.251218.730.4
Cumulative EPE frequencyFront EPE0.158,90.00610.0199
Late EPE0.2411.50.00830.0151
Balanced EPE0.189.70.00750.0167
Single day EPE0.1910.50.0070.0163
Cumulative EPE volumeFront EPE0.1710.10.00820.0179
Late EPE0.2111.30.00550.0225
Balanced EPE0.199.90.00880.0193
Single day EPE0.159.10.00670.0221
Table 4. Spatial distribution statistics of mean precipitation in the mid–lower reaches of the Yangtze River Basin during the 1960–2019 period.
PRCPTOT
(mm)
a. 1960–1989b. 1970–1999c. 1980–2009d. 1990–2019e. 2000–2019
Area
Ratio (%)
Change
Ratio (%)
Area
Ratio (%)
Change Rate (a,b) (%)Area
Ratio
(%)
Change Rate (a–c) (%)Area
Ratio
(%)
Change Rate (a–d) (%)Area
Ratio
(%)
Change Rate (a–e) (%)
600–8001.9/2.426.31.1−42.12.952.61.5−21.1
800–100011.4/11.0−3.513.417.514.022.815.939.5
1000–120022.7/21.2−6.621.3−6.221.0−7.522.3−1.8
1200–140025.8/19.7−23.620.4−20.919.5−24.422.0−14.7
1400–160027.1/26.1−3.726.8−1.121.7−19.920.9−22.9
1600–180010.0/15.757.015.050.016.161.014.444.0
>18001.0/3.8280.02.0100.04.7370.03.1210.0
PRCPTOT represents the annual wet-day precipitation and “/” denotes no data.
Table 5. Interannual trends in extreme precipitation indices in the mid–lower reaches of the Yangtze River Basin during the 1960–2019 period.
Index1960–1989 (30a)1970–1999 (30a)1980–2009 (30a)1990–2019 (30a)2000–2019 (20a)1960–2019 (60a)
SlopeMeanSlopeMeanSlopeMeanSlopeMeanSlopeMeanSlopeMean
PRCPTOT2.0231286.713.6541324.73−4.551 *1318.52−0.4321328.154.9941312.531.261307.39
R99p0.95647.222.437 *48.21−0.0248.331.12448.922.96648.640.98 **48.11
R95p1.86119.813.173 *20.22−0.03520.100.71320.374.66820.171.393 **20.01
Rday0.252 **103.30−0.018105.40−0.557 ***104.71−0.187103.720.163102.650.026103.52
P95day0.02418.340.04318.88−0.03318.720.01818.920.06318.830.014 *18.64
SDII0.00612.460.012 *12.60−0.00912.59−0.00112.810.01612.790.005 *12.63
SDIIq950.0241.070.093 **1.070.0321.0750.061 *1.0740.098 **1.0690.036 ***1.075
* Indicates significant trend at p < 0.05; ** significant trend at p < 0.01; *** significant trend at p < 0.001.
Table 6. Correlation between extreme precipitation events and temperature changes.
EPE TypeIndexI-North AreaII-South AreaTotal Area
Correlation
Coefficient
SigCorrelation
Coefficient
SigCorrelation
Coefficient
Sig
Front EPEPrecipitation−0.150.870.070.980.100.71
Day−0.210.570.100.450.150.55
Frequency−0.150.870.100.950.020.64
Late EPEPrecipitation0.250.990.250.990.200.99
Day0.350.680.430.980.390.95
Frequency0.180.980.200.990.190.98
Balance EPEPrecipitation0.110.430.230.880.170.68
Day0.310.330.130.890.280.76
Frequency0.080.500.190.420.140.44
Single day EPEPrecipitation0.4410.490.990.460.99
Day0.310.990.410.990.370.99
Disclaimer/Publisher’s Note: The statements, opinions and data contained in all publications are solely those of the individual author(s) and contributor(s) and not of MDPI and/or the editor(s). MDPI and/or the editor(s) disclaim responsibility for any injury to people or property resulting from any ideas, methods, instructions or products referred to in the content.