1. Introduction
In November 2022, President Xi Jinping emphasized the need to “accelerate the synergistic development of digitization and greening” at the 29th APEC Economic Leaders’ Meeting. Building on this, the 2023 White Paper on Synergistic Development of Digitization and Greening, released by the China Academy of Information and Communication Research, introduced the concept of synergy between these two areas for the first time. On one hand, digitization supports green development by using technologies such as big data, artificial intelligence, and blockchain. These technologies help optimize resource use, conserve energy, reduce pollution, and cut carbon emissions, creating a win–win for both economic growth and environmental sustainability. On the other hand, green initiatives promote the upgrading of digital technologies. However, the two are not always perfectly aligned. For example, expanding digital infrastructure must consider its energy consumption and environmental impact to align with green transition goals [
1]. Therefore, under policies like “Double Carbon”, “sustainable development”, and “green, clean development”, digital technology should advance in a way that supports environmental benefits rather than compromises them.
In 2022, several government bodies, including the Office of the Central Cyberspace Affairs Commission and the National Development and Reform Commission, launched pilot projects to coordinate digitization and greening. These projects were set up in 10 regions, including Zhangjiakou in Hebei Province and Dalian in Liaoning Province. Previous studies focused on two main areas: (1) understanding how digital transformation drives green transformation [
2,
3], such as the role of digitalization in promoting green supply chains [
4], and (2) exploring the spatial distribution of synergies between the digital and green economies [
5,
6]. For example, studies have examined the spatial and temporal relationships between digital economy development and green innovation in China [
7]. Digital and green technologies are gradually converging, driven by China’s new development paradigm, which emphasizes innovation, coordination, and sustainability.
The convergence of digital and green technologies is both a gradual and inevitable process [
8,
9]. It stems from three key factors. First, the knowledge spillover effects of digital and green technologies. Romer (1986) highlighted the importance of knowledge accumulation in technological progress and economic growth [
10]. Knowledge spillovers, especially from R&D, significantly drive innovation and productivity growth [
11]. Second, infrastructures like cloud computing [
12], the Internet of Things (IoT) [
13], and big data [
14] provide the technical foundation for this convergence. Third, green investment incentives [
15] and industry standards [
16] support the integration of digital and green technologies. Therefore, this paper defines the convergence of digital and green technologies as the synergy between digital technologies (such as big data and artificial intelligence) and green technologies to promote the optimization of resource use, reduce environmental impact, and achieve sustainable development for both the economy and the environment.
Despite previous research, several gaps remain. ① Most studies focus on the individual impacts of either digital or green technologies, with limited quantitative analysis of their combined effects. ② The existing literature mainly investigates the impact of technological innovation on total factor productivity (TFP), but few studies specifically address how the convergence of these technologies influences regional TFP. ③ Few researchers have explored the threshold effects of technology integration on regional TFP. To address these gaps, this paper uses Stochastic Frontier Analysis (SFA) to measure regional TFP in Chinese provinces. The paper also applies a threshold model to investigate how the convergence of digital and green technologies affects regional TFP, providing a theoretical foundation for future research on this topic.
The purpose of this study was to analyze how the integration of digital and green technologies impacted regional TFP, revealing the underlying mechanisms and regional differences. Specifically, the study aimed to (1) clarify how digital–green integration affects regional TFP, (2) explore the threshold effects of the business environment and intellectual property protection in moderating the integration process, and (3) uncover regional heterogeneity by examining the varying effects of digital–green integration in China’s eastern, central, and western regions.
2. Literature Review and Research Hypothesis
In the context of the ongoing scientific and technological revolution, the digital economy—fueled by advances in digital technologies—has emerged as a crucial driver of high-quality economic development [
17]. At this new developmental stage, the innovation-driven process of digital industrialization and the digital transformation of traditional industries have paved the way for profound integration of digital technologies across various sectors. This integration is significantly enhancing total factor productivity (TFP). Numerous scholars have explored the ways digitalization, particularly through digital technologies [
18] such as the Internet [
19,
20], digital finance [
21,
22], technology integration [
23], and artificial intelligence [
24] have impacted productivity. The positive effects of these technologies have been examined from multiple perspectives, revealing how they contribute to boosting TFP. Studies have highlighted the “black box” mechanisms through which digitalization enhances productivity [
25], underscoring the transformative potential of digital technologies in economic systems.
Moreover, beyond improvements in productivity, the rapid advancements in digital technologies present significant opportunities for enterprise-level innovation. In particular, green innovation is becoming an essential pathway for facilitating economic transformation and achieving environmentally sustainable development. This form of innovation is central to reaching ambitious climate goals, such as the “Double Carbon” targets. Research has increasingly demonstrated a strong, positive correlation between digitalization and green technological innovation [
26,
27], from resource optimization [
28] to the green transition of industries [
29].
In light of these insights, the following research hypotheses are proposed to explore the intricate relationship between digital transformation, productivity, and green innovation.
Hypothesis 1. The convergence of digital and green technologies exerts a significant and positive linear effect on regional total factor productivity.
The rapid advancement of digital technology has significantly reduced the costs associated with searching, transmitting, and replicating information, thereby putting pressure on traditional firms to adapt [
30,
31]. However, the relationship between digital technology and total factor productivity (TFP) is likely to be nonlinear [
32]. The advancement of digital technology accumulates intangible assets in the economy. Nakatani (2024) recently found that there was a nonlinear inverted-U-shaped relationship between intangible assets and total factor productivity growth [
33]. Scholars have argued that the Internet, as a quintessential example of digital technology, exhibits nonlinear effects on TFP due to network externalities and increasing returns to scale [
19]. This nonlinearity can be attributed to factors such as the maturation of innovation cycles and the diminishing returns of certain digital innovations over time [
34]. As digital technologies evolve, their initial boost to technological innovation may taper off, reflecting a pattern of diminishing marginal effects.
When it comes to green innovation, the relationship with productivity is also complex. While some scholars have argued that green innovation can introduce additional costs, thereby hampering productivity [
35], others have contended that misaligned or poorly implemented green innovations may undermine intrinsic motivation and reduce TFP [
36]. Moreover, various external factors—such as government support [
37], regional income levels [
38], and other institutional constraints—can moderate the positive relationship between green innovation and TFP [
39]. These variables shape the extent to which green innovation can effectively contribute to sustainable productivity growth.
Based on these considerations, a second hypothesis is proposed to explore the potential nonlinear dynamics between digital green technologies and TFP.
Hypothesis 2. The convergence of digital and green technologies may exhibit a nonlinear relationship with regional total factor productivity.
Improvements in the business environment can influence innovative behaviors and consequently drive economic development through multiple channels:
First, a fair and competitive market environment is crucial. As the “invisible hand” guiding resource allocation [
40], a well-functioning, open market reduces entry barriers and fosters a supportive atmosphere that encourages innovative activities. Studies have shown that a highly transparent and fair market encourages firms to engage more actively in innovation [
41].
Second, government efficiency plays a pivotal role. The quality of the business environment is often shaped by political, legal, and institutional factors. Research indicates that a clean and corruption-free government can reduce rent-seeking behaviors, creating conditions that support firms’ R&D efforts and innovation, ultimately boosting total factor productivity [
42].
Third, high-quality human capital is essential. Human capital, as a core driver of economic growth, contributes significantly to an improved business environment. The active involvement of skilled human resources in production and technological innovation not only helps upgrade technology and industrial structures but also fuels overall economic progress [
43].
A well-developed business environment therefore provides crucial resources and institutional support for fostering innovation, particularly through digital and green innovation. On the other hand, a poor business environment, characterized by weak market foundations and limited human resources, stifles innovation and diminishes the potential for economic growth [
41].
Based on this analysis, the following hypothesis is proposed:
Hypothesis 3. As the business environment improves and surpasses a certain threshold, the convergence of digital and green technologies plays a pivotal role in enhancing regional total factor productivity.
Intellectual property (IP) protection has long been a key area of academic interest, with research focusing primarily on two aspects:
First, the impact of IP protection on innovation. Some studies suggest that as the level of IP protection strengthens, its positive influence on industrial value gradually diminishes [
44]. Additionally, researchers have identified a complex, nonlinear relationship between IP protection and technological innovation [
45]. In reviewing the literature, it becomes apparent that the effect of IP protection on innovation often follows an inverted-U-shaped relationship [
46], both domestically and internationally, with the exception of certain industries. However, the turning point of this inverted U-shape varies depending on factors such as enforcement strength and local protectionism [
47]. In China, for instance, the actual level of IP protection does not uniformly encourage R&D investments across all innovation sectors, largely due to varying levels of enforcement and regional protectionism.
Second, the effect of IP protection on economic development. Some scholars argue that strengthening IP protection does not always contribute to economic growth. When the level of IP protection is below a critical threshold, increasing its intensity can effectively promote growth [
48]. However, once this threshold is surpassed, the relationship becomes less clear or even counterproductive. In addition, B. Siliverstovs (2016) also found that productivity growth becomes significantly positive only after a certain critical mass of knowledge stock is accumulated [
49].
Based on these insights, the following hypothesis is proposed:
Hypothesis 4. As the intellectual property protection improves and surpasses a certain threshold, the convergence of digital and green technologies plays a pivotal role in enhancing regional total factor productivity.
3. Research Design
3.1. Sample and Data
The sample data for this study were drawn from three primary sources. First, China National Intellectual Property Administration (CNIPA): This paper utilized data on invention patents from each province, comprising 4.85 million patents filed and disclosed between 2010 and 2022. The dataset included details such as patent applications, disclosures, IPC classification numbers, and other relevant fields. Second, Statistical Yearbooks: Data were collected from various official yearbooks, including the China Statistical Yearbook, China Environmental Yearbook, China Science and Technology Statistical Yearbook, as well as provincial and municipal statistical yearbooks. These sources provided essential information on basic statistics, control variables, and other provincial data relevant to the study. Third, the CSMAR database: This paper drew from the CSMAR database to gather data on economic indicators, levels of digitization, and levels of greening. These metrics were crucial for assessing the variables involved in this study.
The preliminary data processing was conducted as follows. Firstly, continuous variables were subjected to a 1% winsorization on both ends to address outliers. Secondly, missing values were handled using interpolation techniques to fill in gaps. Thirdly, due to significant data deficiencies, the regions of Tibet Autonomous Region, Hong Kong, Macao, and Taiwan were excluded from the dataset. The processed sample data ensured robustness and accuracy for the empirical analysis conducted in the paper.
3.2. Method
Traditional studies of total factor productivity (TFP) and technology convergence often use methods like Ordinary Least Squares (OLS) and Fixed-Effects Models (FE). OLS estimates relationships between variables, assuming regional homogeneity. This assumption, however, can oversimplify regional complexity. Fixed-Effects Models improve upon OLS by controlling for unobservable time-invariant factors. Despite this improvement, both methods may fail to capture nonlinear relationships or threshold effects, which are crucial for understanding technology convergence dynamics.
The empirical methodologies used here were well suited for analyzing the impact of digital–green technology convergence on regional TFP. SFA, a parametric approach, separated technical inefficiency from random shocks, allowing for a more accurate evaluation of how different provinces benefited from these technologies. PTM further enhanced the analysis by identifying threshold effects, revealing how TFP shifted as factors like the business environment or intellectual property protection exceeded specific thresholds. This method effectively captured nonlinear relationships, which are critical for understanding how the integration of digital and green technologies impacts TFP across different institutional contexts.
3.3. Variable Definition
(1) Total factor productivity (TFP): This paper employed Stochastic Frontier Analysis (SFA) to estimate provincial total factor productivity (TFP), constructing a production function in the Cobb–Douglas (C-D) form. The convergence of digital and green technologies was integrated into the calculation by focusing on the economic outcomes of R&D activities, specifically reflected through the sales revenue of new products [
50], which served as the output variable in this study. For the input variables: ① Human capital input was measured by the number of R&D personnel involved. ② Physical capital input was represented by the stock of new product R&D expenditures. To ensure consistency, these expenditures were deflated to 2008 as the base year. The stock of R&D expenditure was calculated using the perpetual inventory method, with a depreciation rate (
δ) of 15%, following the approach of Griliches (1979) [
51]. The stock of R&D funding for new products in region
i and year
t was expressed as:
, where
is the stock of new product R&D funding in the previous year, and ∆Kit is the new investment in R&D for that year.
Table 1 presents the results from testing the suitability of the production function and the significance of its parameters using the Frontier 4.1 software. The regression results confirmed that all coefficients were statistically significant. The value of γ was estimated at 0.64701, with a significance level of 1%, indicating the presence of a significant composite structure in the error term. Furthermore, the absence of a likelihood ratio (LR) test for technological inefficiency confirmed the necessity of using the stochastic frontier technique to estimate TFP.
(2) The convergence of digital green technology (TechConv): This paper aligned the characteristics of digital industry technological innovation with those of green technological innovation in sustainable development, using provincial patent information to quantify the convergence of digital and green technologies at the provincial level. Specifically, the main classification numbers of the International Patent Classification (IPC) in the patent database were used to determine whether a patent reflected both technological innovation in the digital industry and green technological innovation.
For the identification of digital industry innovation patents, this paper used the “Reference Table of Relationship between Core Industry Classification of Digital Economy and International Patent Classification (2023)”, issued by the China National Intellectual Property Administration (CNIPA) in March 2023. For green technology patents, the classification system followed the “Green Patent Technology Classification System” released by CNIPA in August 2023. Based on these classification systems and the theoretical framework, the convergence of digital and green technologies was defined as follows: if a patent’s main IPC classification number was included in both the core industry classification of the digital economy and the green patent technology classification, the patent was considered to represent the convergence of digital and green technologies.
To create a provincial-level indicator, the number of such convergence patents in each province was summed up annually. The natural logarithm of (1 + number of convergence patents) was then used as the final measure of the convergence of digital and green technologies at the provincial level. This transformation helped to smooth the data and account for potential skewness in patent distribution across provinces.
(3) Control variables: To more accurately assess the impact of the convergence of digital and green technologies on total factor productivity (TFP), the following control variables were included in the analysis: ① Government intervention (Govi): This variable was measured by the share of fiscal expenditure relative to GDP in each province. It reflected the degree of government involvement in the economy. ② Industrial structure (Indstr): To capture the advancement of the industrial structure, this variable was represented by the ratio of the output value of the tertiary industry (services) to the output value of the secondary industry (manufacturing and construction) in each province. A higher ratio indicated a more advanced industrial structure. ③ Energy consumption (Encon): this was measured by the energy consumption per unit of GDP in each province, providing insight into the energy efficiency of the regional economy. ④ Environmental regulation (Enreg): The intensity of environmental regulation was captured by the ratio of completed investments in industrial pollution control to the value-added of industry in each province. This variable indicated the extent of environmental regulation and its impact on industrial activities.
These control variables helped isolate the specific effects of the convergence of digital and green technologies on TFP by accounting for other factors that could influence productivity at the provincial level.
3.4. Model Construction
In this paper, Model (1) was constructed for a benchmark regression to examine the impact of the convergence of digital and green technologies on regional total factor productivity (TFP):
where
i and
t denote the province and year, respectively.
TFPit represents the total factor productivity of province
i in year
t.
TecConvit indicates the number of convergence patents related to digital green technology in province
i during year
t.
Controlit is a set of control variables included in the model.
μi captures the province-specific fixed effects.
γt accounts for year-specific fixed effects.
β1 is the coefficient of interest associated with the convergence of digital green technology.
If the coefficient β1 is significantly positive, it suggests that the convergence of digital and green technologies enhance regional total factor productivity, thereby supporting the theoretical expectations of this study. This model provides a robust framework for analyzing the interplay between technological convergence and productivity at the provincial level.
5. Further Analysis
5.1. Nonlinear Relationship Analysis
To examine whether there was a nonlinear relationship between the convergence of digital–green technology and regional total factor productivity, this paper employed the following model to test for an “inverted U-shape” relationship between the two:
As shown in
Table 5, the coefficient of the primary term for the convergence of digital and green technologies was significantly positive at the 1% level, while the coefficient of the secondary term was significantly negative at the 1% level. This indicated the presence of an “inverted-U-shaped” relationship between the convergence of digital and green technologies and regional total factor productivity. Initially, the convergence of these technologies promotes total factor productivity, but after a certain point, it begins to have an inhibitory effect. Thus, Hypothesis 2 is confirmed.
5.2. Threshold Variable Test
This paper constructed a threshold effect model using the business environment and intellectual property protection as threshold variables. Drawing on Hansen’s methodology, which captures nonlinear thresholds caused by sudden structural changes in the economic system through automatic sample data identification [
52], the following threshold effect model was developed for the analysis, as shown in Equation (3):
where
I(·) represents the indicator function, which takes the value of zero if the condition in parentheses is false and one if true.
q denotes the threshold variable, and
θ is the specific threshold to be estimated. The other variables retain the same definitions as previously mentioned. This model allowed for the examination of how the impact of digital–green technology convergence on total factor productivity changed when crossing specific threshold levels of business environment and intellectual property protection.
(1) Business environment
This paper followed the approach of Du et al. (2020) [
41] and Zhang et al. (2020) [
53] to construct an evaluation index system for the business environment (BusEnv) in each province of China, with the following specific metrics: ① Government environment: this was calculated by weighting the “e-service capability index” (0.5) and the “government transparency index” (0.5). ② Human environment: human resources were weighted by the “credit information sharing platform score” (0.3), “R&D personnel full-time equivalent” (0.4), and “number of students” (0.3). ③ Market environment: the market environment was weighted by “foreign direct investment” (0.3), “internal R&D expenditure” (0.4), and the “innovation and entrepreneurship index” (0.3).
Stata 18.0 statistical software was used to test for the presence of a threshold effect by performing 500 bootstrap samples to derive the
p-value corresponding to the test statistic. The results of these tests are presented in
Table 6.
As shown in
Table 6, when the business environment was used as the threshold variable, the following conclusions could be drawn: the F-statistic was significant at the 1% level, meaning that the
p-value was less than 0.01. This indicated the presence of a single threshold in the model, and the threshold estimation results are provided in
Table 7.
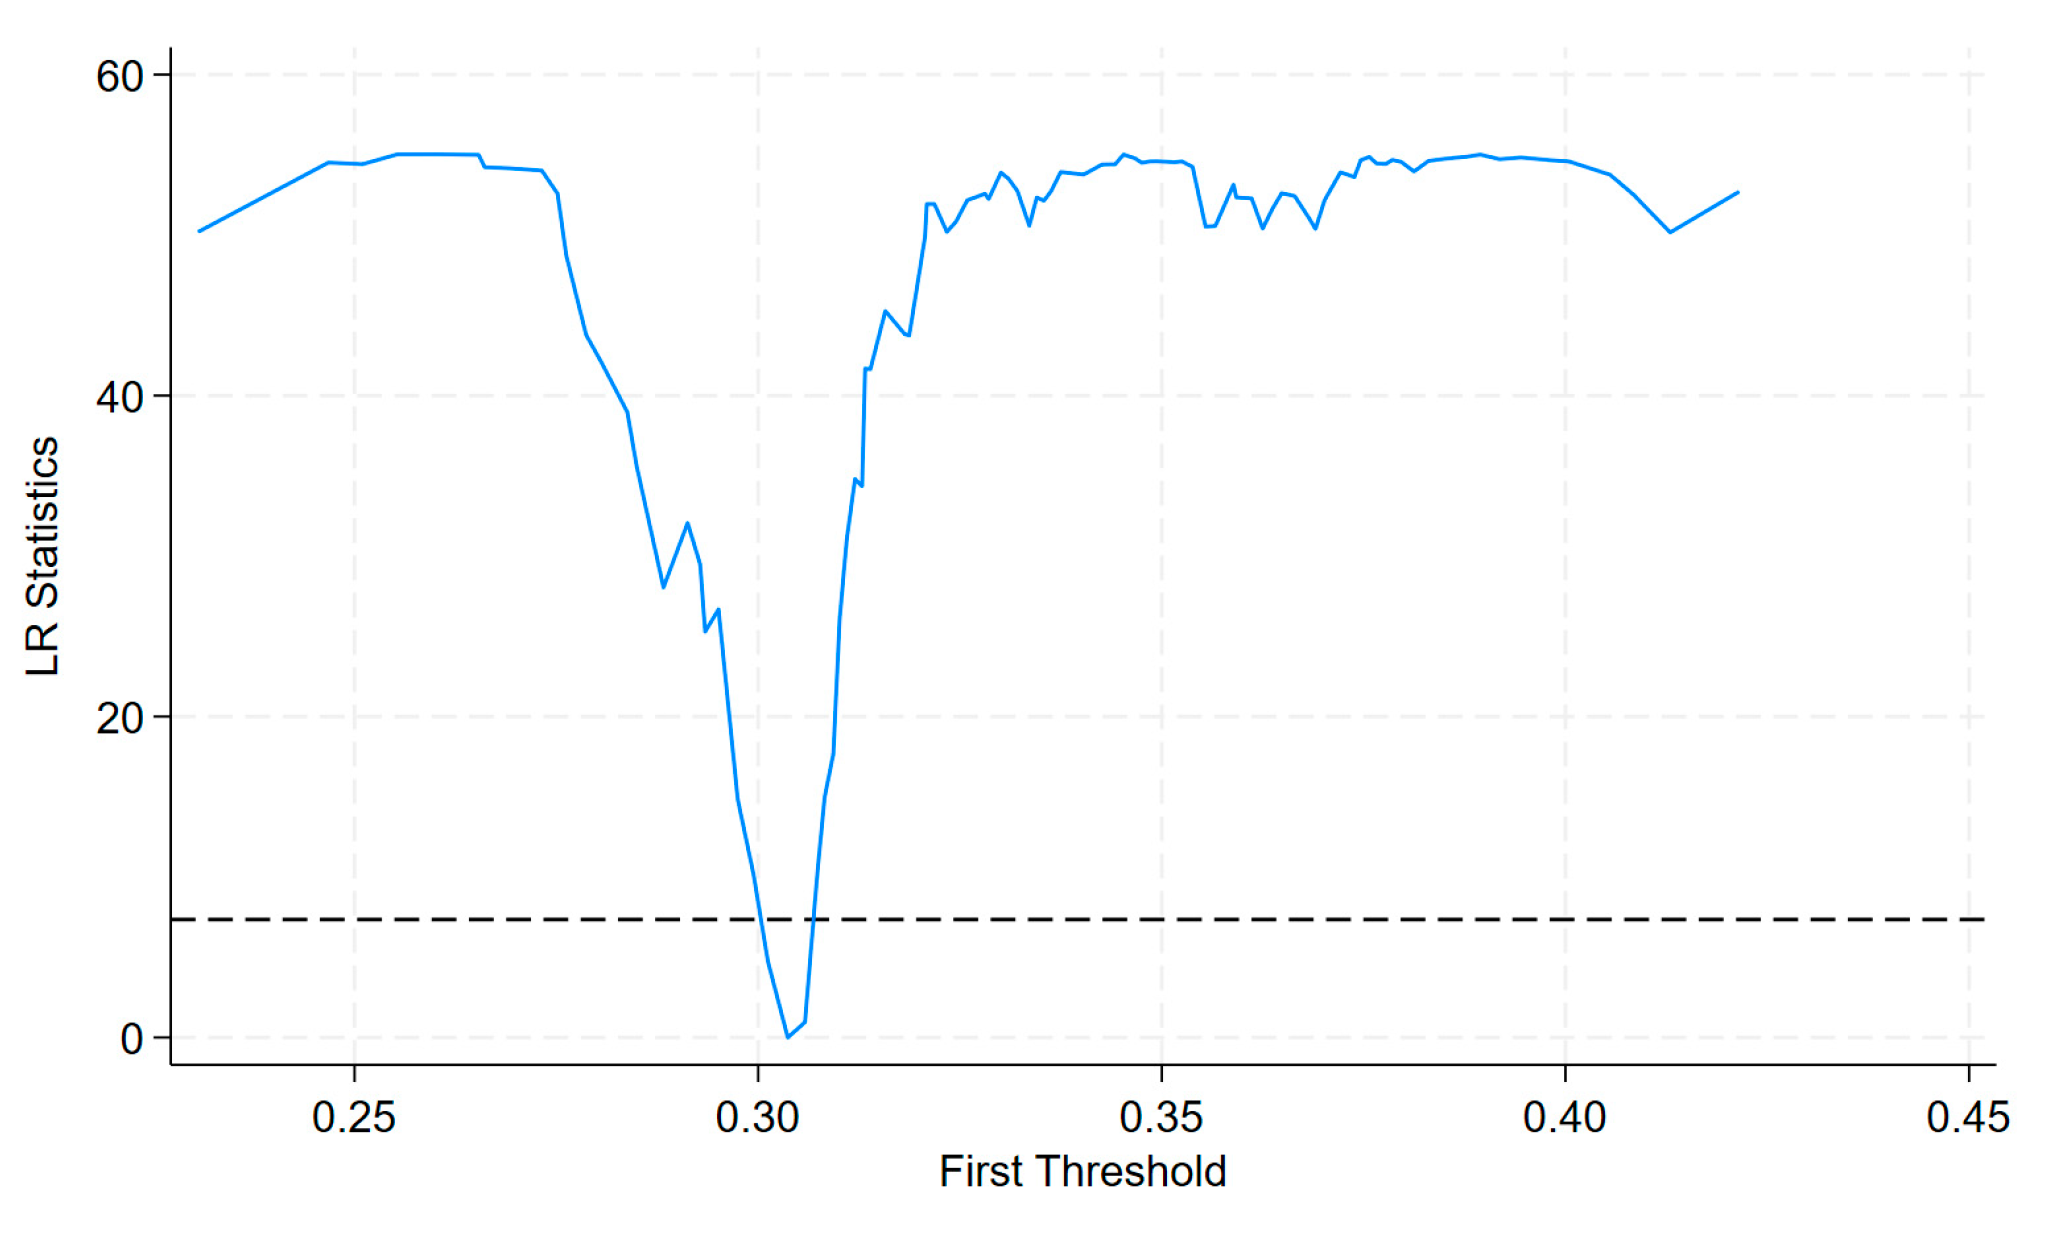
According to the threshold model principle, the threshold estimate corresponds to the γ value when the likelihood ratio statistic (LR) approaches zero. This paper presents a plot of the likelihood ratio function, along with the 95% confidence interval, for the estimated threshold value of 0.3037 (
Figure 1).
The test results in
Table 8 indicate the presence of a single-threshold effect, with the business environment serving as the threshold, on the impact of the convergence of digital and green technologies on regional total factor productivity. The estimated coefficients for each threshold range were significantly positive at the 1% level, and the coefficients increased as the threshold range widened.
When the business environment was in the range of BusEnv ≤ 0.3037, the regression coefficient of the convergence of digital and green technologies on regional total factor productivity was 0.037, significant at the 1% level. When the business environment exceeded 0.3037, the regression coefficient increased to 0.040, also significant at the 1% level.
The threshold regression results led to the following conclusions: The convergence of digital and green technologies has significantly different effects on regional total factor productivity across regions with varying business environments. This suggests that the positive impact of the convergence of digital and green technologies on total factor productivity is phased and grows stronger as the business environment improves. Enhancing the business environment strengthens the synergy between the business environment and the convergence of digital and green technologies, further promoting regional total factor productivity.
Thus, Hypothesis 3 is validated.
(2) Intellectual Property Protection
The intellectual property (IP) laws and regulations issued by the Chinese government are generally uniform across all regions, with the main differences lying in the level of law enforcement, judicial protection, and social protection. Drawing on the methodology of C. Wu and D. Tang (2016) [
54], this paper constructed an index to measure the intensity of intellectual property protection (IPP) from multiple dimensions: ① Administrative law enforcement (IPP1): This was measured by the number of patent infringement cases accepted in each province. Specifically, the number of administrative patent enforcement cases reported annually by the CNIPA was divided by the cumulative number of patents granted in that province during the same year. ② Judicial protection (IPP2): Judicial protection of intellectual property is handled by the People’s Courts at all levels across provinces. The ratio of GDP to the number of closed IP cases by the People’s Court in each province was manually collected and analyzed. ③ Social protection (IPP3): Social protection intensity is represented by the number of lawyers per 10,000 residents in each province. Data on the number of lawyers were sourced from official websites of the Ministry of Justice, provincial judicial departments, bar associations, and provincial and municipal statistical yearbooks. Using these three indicators (IPP1–IPP3), the paper employed a principal component analysis to construct a composite index of intellectual property protection (IPP) for each province.
To determine whether there was a threshold effect, this paper applied the same methodology of 500 bootstrap samples to obtain the
p-value corresponding to the test statistic. The results of this threshold effect test are shown in
Table 9.
From
Table 9, we can draw the following conclusions when intellectual property protection was used as the threshold variable. The F-statistic was significant at least at the 5% level for both the single and double thresholds. This indicated that there were two thresholds in the model. The estimated threshold values are presented in
Table 10.
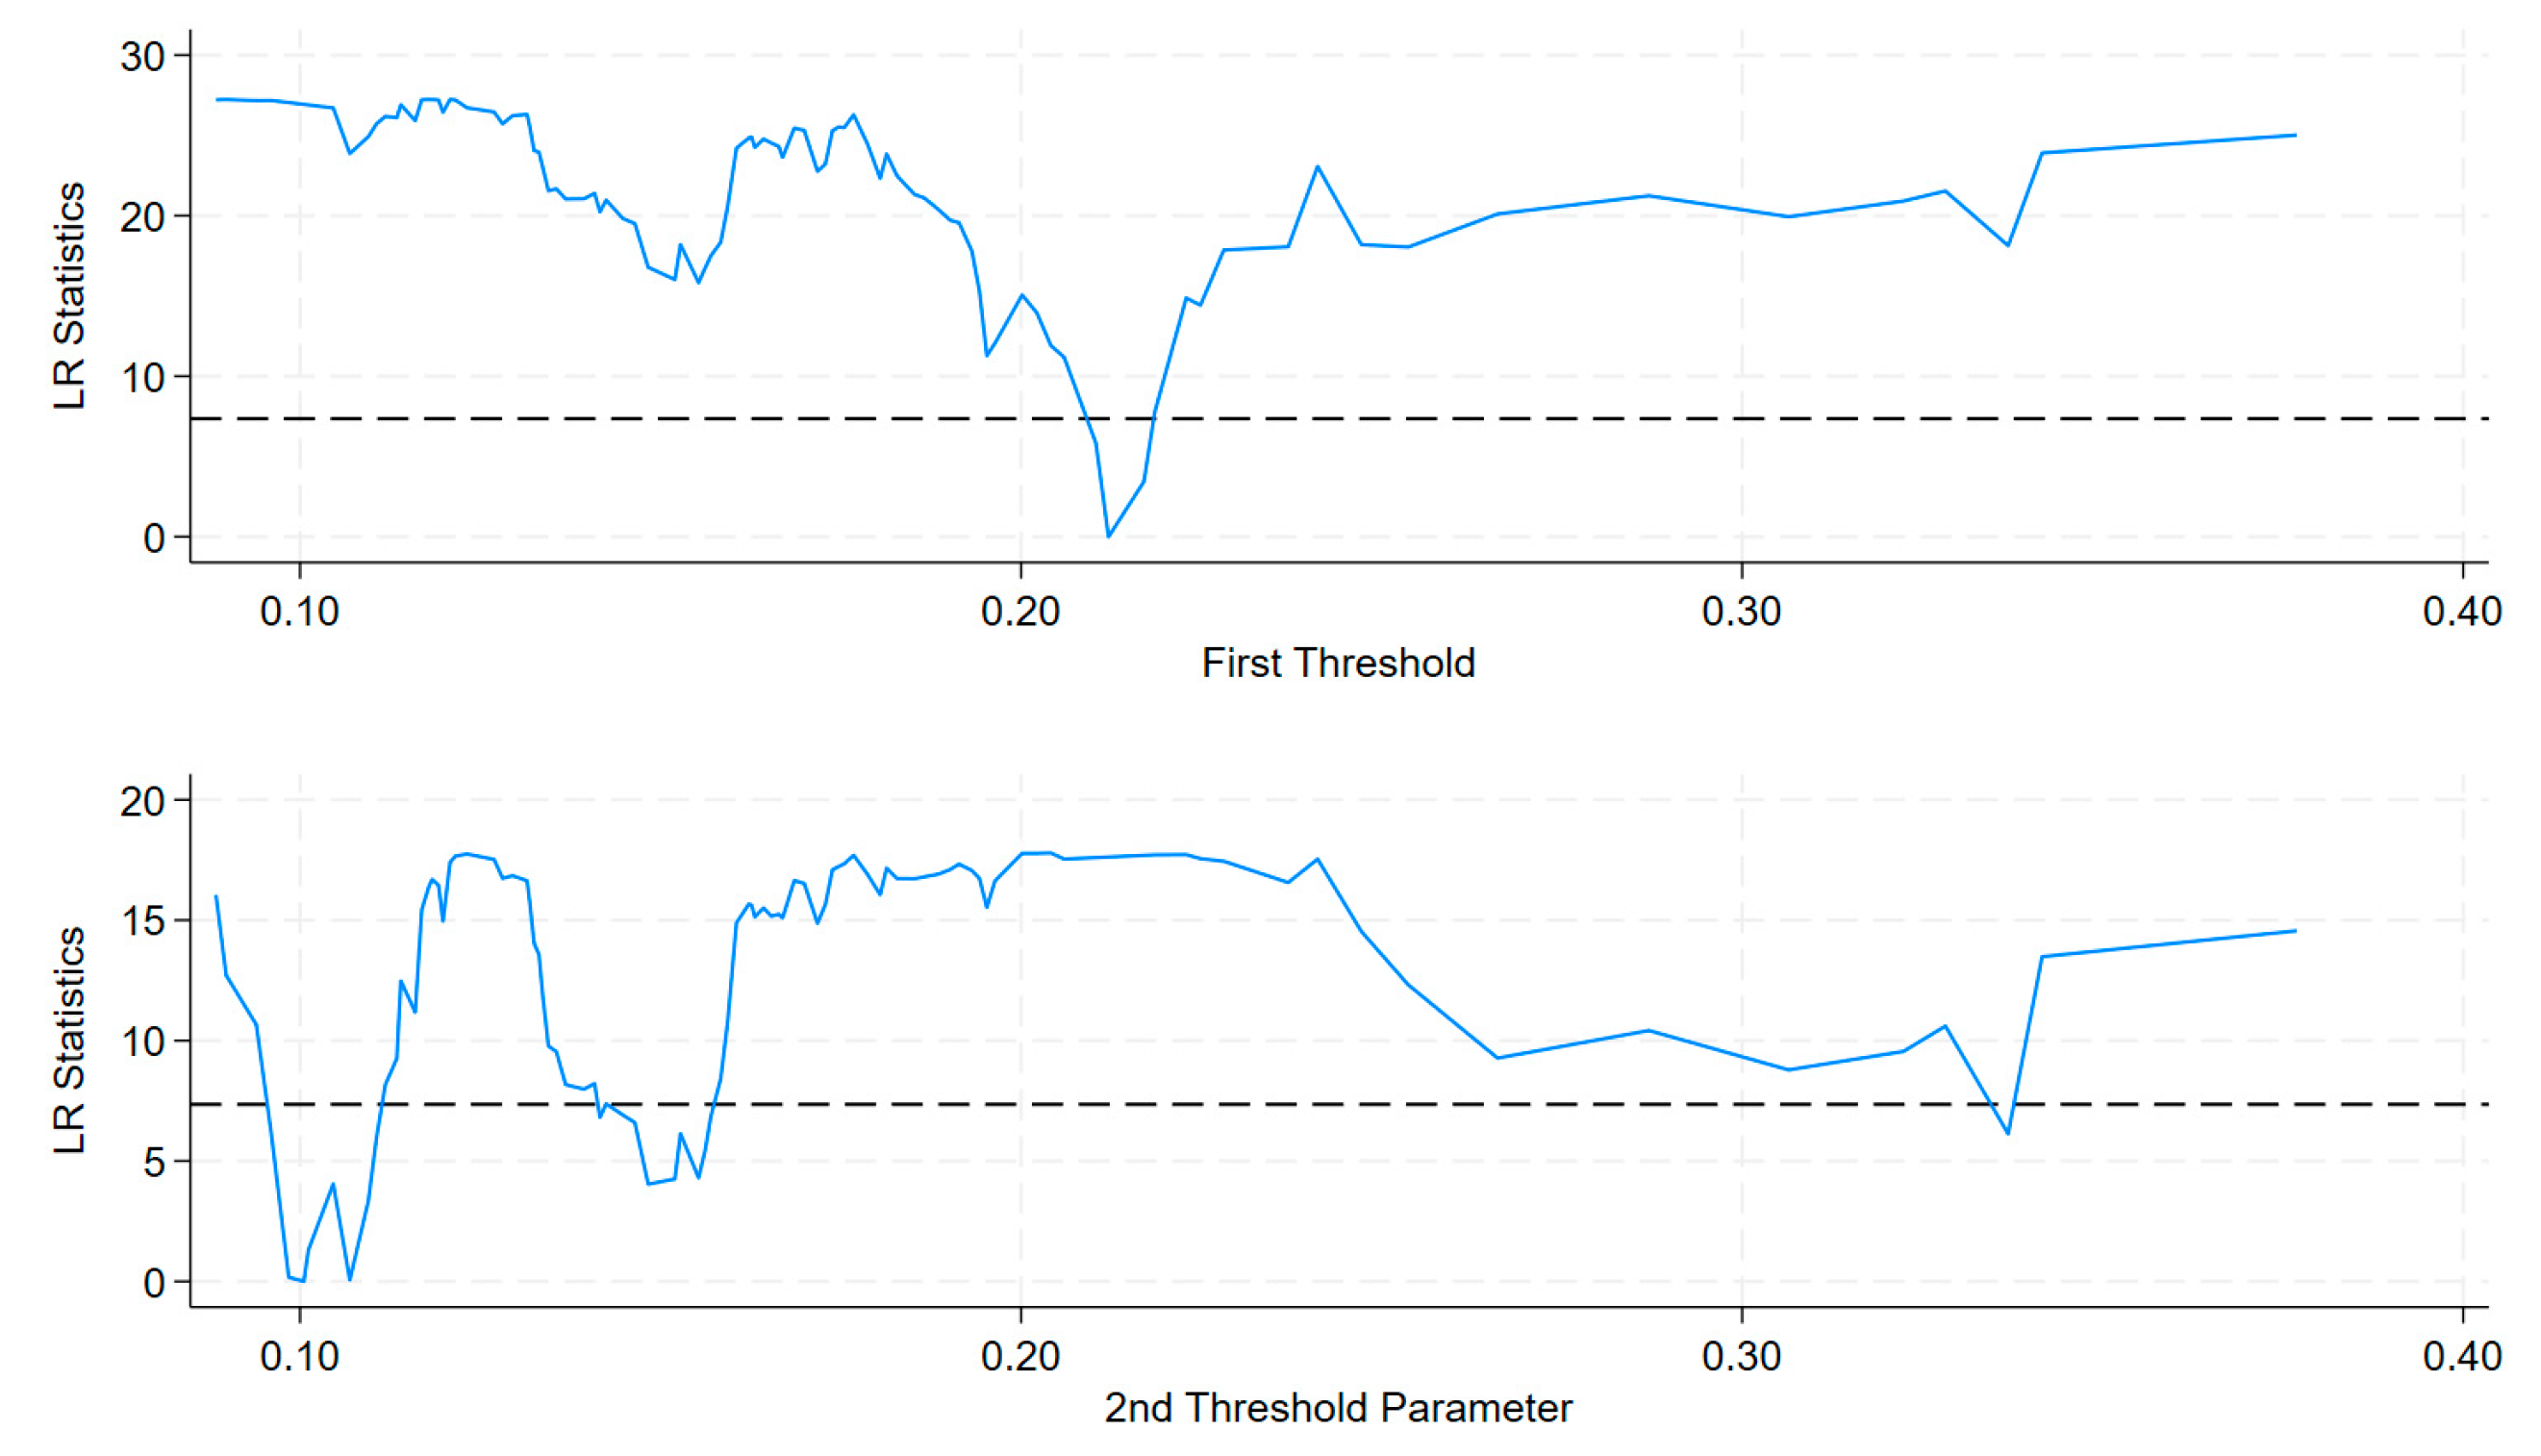
Figure 2 presents the likelihood ratio function along with the 95% confidence intervals for the two threshold estimators, 0.1005 and 0.2121, for the convergence of digital and green technologies. These thresholds captured the nonlinear relationship between digital green technology fusion and its impact on regional total factor productivity.
At the same time, we obtained the panel threshold regression results for the convergence of digital and green technologies, as shown in
Table 11. When the level of intellectual property protection was below 0.1005, the regression coefficient was 0.038, indicating that the convergence of digital and green technologies positively impacted regional total factor productivity at the 1% significance level. When the intensity of intellectual property protection fell between 0.1005 and 0.2121, the regression coefficient increased to 0.041, showing an even stronger positive effect of digital–green technology convergence on regional total factor productivity, also at the 1% significance level. However, when intellectual property protection exceeded the second threshold of 0.2121, the regression coefficient dropped slightly to 0.039. While digital–green technology convergence continued to significantly promote regional total factor productivity, the magnitude of the effect decreased. Thus, Hypothesis 4 (H4) is validated.
The regression results indicated that the impact of the convergence of digital and green technologies on regional total factor productivity exhibited a nonlinear pattern, influenced by the level of provincial intellectual property protection. Although varying levels of intellectual property protection had different effects on the extent to which regional total factor productivity was promoted, the general trend showed that achieving an optimal level of intellectual property protection maximized the positive impact of the convergence of digital and green technologies on regional total factor productivity.
5.3. Analysis of Regional Heterogeneity
To further investigate the impact of digital–green technology convergence on regional heterogeneity in total factor productivity, the data were categorized into three groups based on the National Bureau of Statistics of the People’s Republic of China: eastern, central, and western regions. The regression results for regional heterogeneity are presented in
Table 12.
The convergence of digital and green technologies had a significant positive impact on regional total factor productivity in the eastern region, with a regression coefficient of 0.061. This was notably higher than the coefficients for the central region (0.020) and the western region (0.026), where the positive effects, while present, were not statistically significant. Thus, there was clear evidence of significant regional heterogeneity in the impact of digital–green technology convergence on total factor productivity.
This paper identified three key reasons for this disparity. Firstly, economic development: The eastern region is more economically developed compared to the central and western regions, with a more diversified industrial structure, particularly in high-tech and service sectors. This diversity enables better investment in scientific research and technological innovation. In contrast, the central and western regions are primarily reliant on traditional agriculture and heavy industry, with limited motivation for innovation and digital transformation. Secondly, market connectivity: The eastern region is highly open and well connected to international markets and cutting-edge technologies, providing greater opportunities to absorb advanced international innovations. Conversely, the central and western regions are relatively closed off, with economic activities predominantly focused on the internal market. This lack of external engagement limits the promotion and application of digital and green technologies, which suffer from insufficient market demand and drive. Thirdly, government support: Compared to the eastern region, the central and western regions have more constrained government financial revenues, resulting in less support for enterprises. The convergence of digital and green technologies requires substantial initial investment and ongoing financial backing. Consequently, businesses and investors in the central and western regions are less inclined to commit to such projects, leading to a more fragile capital chain.
6. Discussion
This study, through an empirical analysis, delved into the impact of the convergence of digital and green technologies on regional TFP and uncovered multiple mechanisms and regional heterogeneity effects.
Firstly, from both linear and nonlinear perspectives, the results indicated that the convergence of digital and green technologies had a significant linear promoting effect on regional TFP, but there were varying nonlinear relationships at different levels of integration. The results suggested that although the convergence of digital and green technologies generally had a positive impact on regional TFP, its effect did not increase linearly with higher levels of integration. This reflects the potential issue of diminishing marginal returns at different stages of technological development [
55]. This finding is consistent with Joseph Schumpeter’s “innovation cycle” theory of technological innovation [
56], while further deepening the understanding of the complex mechanisms by which technological integration affects TFP.
Secondly, this study introduced business environment and intellectual property protection as threshold variables to further explore their role in the mechanism by which the convergence of digital and green technologies affects TFP. The findings revealed that the threshold effects of the business environment and intellectual property protection indicated that the positive effects of the convergence of digital and green technologies on productivity were not uniform across different institutional settings. Specifically, when the business environment and intellectual property protection surpassed certain thresholds, the positive impact of the convergence of digital and green technologies on productivity was significantly enhanced. This finding not only confirms the critical role of institutional environments in the diffusion of technology, aligning with M. Coccia’s research on institutional change and the spread of technological innovation [
57], but also demonstrates that under favorable business conditions and strict intellectual property protection, innovators can better harness the potential benefits of technological integration to improve productivity. This conclusion is consistent with Ü. Özdemir’s findings on technology diffusion and productivity [
58]. The study provides important insights for policymakers, suggesting that improving institutional environments can more effectively amplify the economic benefits of technological integration.
Finally, the study results also revealed regional heterogeneity, showing that the convergence of digital and green technologies significantly promoted TFP in eastern regions, while the impact on central and western regions was not significant. This disparity reflects the significant differences in the level of economic development, technological foundation, and policy environment across regions, which affect the acceptance and effectiveness of the convergence of digital and green technologies. This aligns with R. Capello and C. Lenzi’s conclusions on technological change and regional development heterogeneity [
59], while also providing new theoretical support for the formulation of regional technology policies. For the central and western regions, policies could focus more on infrastructure development and improvements to the technological environment, thereby narrowing the regional development gap and boosting TFP growth.
7. Conclusions, Limitations, and Recommendations
7.1. Conclusions
This paper empirically investigated the impact of digital–green technology convergence on regional total factor productivity (TFP) and explored the mechanisms behind this relationship using data from 30 provincial-level administrative regions in China between 2010 and 2022. The main findings were as follows. ① Linear and nonlinear impacts: This study delved into both linear and nonlinear dynamics, providing a deeper understanding of how digital–green technology convergence affects regional TFP. The results demonstrated a significant linear promotion effect of digital–green technology convergence on TFP improvement. Additionally, a nonlinear relationship emerged at different levels of technology convergence, indicating varying effects based on the degree of convergence. ② Threshold effects of business environment and intellectual property protection: The paper introduced business environment and intellectual property protection as threshold variables, analyzing their roles in moderating the impact of the convergence of digital and green technologies on TFP. The findings revealed a single-threshold effect for business environment, where crossing a certain threshold enhanced the positive impact of digital green technology on TFP. In addition, a double-threshold effect was observed for intellectual property protection, showing that as IP protection improves, the positive impact of digital green technology on TFP becomes more pronounced beyond certain thresholds. These insights enrich the understanding of the mechanisms through which the convergence of digital and green technologies affects TFP. ③ Regional heterogeneity: The promotion effect of the convergence of digital and green technologies on TFP was significant in the eastern region, while the central and western regions showed no significant effect. This highlights substantial regional heterogeneity in how digital green technology impacts TFP. The findings contribute to theoretical research on the regional heterogeneity of the convergence of digital and green technologies on TFP and provide a useful reference for policymakers to design region-specific development strategies.
In summary, this study enhances our understanding of the relationship between the convergence of digital and green technologies and regional TFP, highlighting the importance of business environment, intellectual property protection, and regional disparities in shaping this dynamic.
7.2. Limitations
This study still has certain limitations, and future research can be further deepened in the following directions. (1) Regions broadly divided, heterogeneity yet to be refined: Although this study found significant differences in the impact of the convergence of digital and green technologies on the eastern, central, and western regions, the regional division was somewhat broad. There may also be notable differences within these regions. Future research could further subdivide the regions to explore more detailed regional heterogeneity. For example, regions can be divided into city clusters or specific provinces to analyze the effects of technology integration on TFP within different subregions. (2) Sector differences unclear, industry impacts yet to be explored: This study primarily explored the impact of the convergence of digital and green technologies at the regional level but did not delve into the differences across industries or sectors. Since the application and development levels of technologies vary by industry, the convergence of digital and green technologies may have significantly different impacts on each sector. Future research could conduct a more detailed analysis based on sectoral data, especially focusing on the differential impacts of technology integration on high-tech industries, manufacturing, and traditional industries. (3) Mechanism analysis incomplete, transmission paths yet to be clarified: While the study revealed the role of the business environment and intellectual property protection as threshold variables, the specific transmission paths and mediating effects were not thoroughly explored. Future research could use mediation models or structural equation models to further clarify the specific channels (e.g., technology diffusion, capital accumulation, institutional innovation) through which digital and green technology integration affects TFP. This would provide a more comprehensive understanding of the complex mechanisms by which technology integration influences productivity. (4) Methodological limitations, precision of models to be improved: Although the Stochastic Frontier Analysis and Panel Threshold Model used in this study were appropriate for analyzing the impact of the convergence of digital and green technologies on regional total factor productivity, these methods rely on certain assumptions, such as the setting of efficiency boundaries and the selection of threshold values, which may affect the robustness and generalizability of the results. Future research could explore the use of alternative approaches, such as dynamic stochastic frontier models or more sophisticated spatial econometric models, to better address the sensitivity of model assumptions and enhance the precision of the analysis.
7.3. Recommendations
Based on the empirical results of this study, the following policy recommendations are proposed.
(1) Technological innovation: The convergence of digital and green technologies requires substantial capital and technical infrastructure, which can be challenging for less-developed regions. To address this, governments should establish targeted funding mechanisms, such as low-interest loans or subsidies, to help these regions invest in necessary technologies. Additionally, policies should promote gradual innovation tailored to local industries, especially in traditional sectors, to ensure they can adapt to technological change. Encouraging cross-regional collaboration and knowledge-sharing will further help less-developed areas access advanced technologies and reduce the development gap.
(2) Business environment: Improving the local business environment is crucial but may face challenges such as bureaucratic inefficiencies, regulatory inconsistencies, and limited resources in less-developed areas. To overcome these, governments should streamline administrative processes and reduce red tape to foster a more transparent and efficient environment. Implementing region-specific regulations that address local economic conditions can help tailor support to where it is most needed. Additionally, promoting public–private partnerships and offering incentives for innovation can encourage local businesses to embrace digital and green technologies, thereby enhancing overall competitiveness and sustainability.
(3) Intellectual property protection: Strengthening intellectual property protection can stimulate innovation but may also pose challenges by limiting knowledge-sharing and collaboration. To address this, policymakers should balance strong IP enforcement with flexible regulations that encourage open innovation, especially for early-stage technologies. Tailoring IP policies to different industries—allowing for less restrictive protection in sectors that benefit from collaboration—can foster innovation while still protecting key inventions. Additionally, enhancing the efficiency of IP enforcement mechanisms, especially in less-developed regions, will ensure that businesses have adequate protection without stifling creativity.
These recommendations aim to support balanced technological growth across regions and industries, ensuring that the convergence of digital and green technologies continues to drive improvements in total factor productivity nationwide.


