Article

Understanding the Influence of Built Environment Indicators on Transit-Oriented Development Performance According to the Literature from 2000 to 2023

1
School of Architecture, Soochow University, No. 199 Ren-ai Road, Suzhou Industrial Park, Suzhou 215123, China
2
China-Portugal Joint Laboratory of Cultural Heritage Conservation Science, Suzhou 215000, China
3
School of Architecture, Tsinghua University, Beijing 100084, China
*
Author to whom correspondence should be addressed.
Sustainability 2024, 16(21), 9165; https://doi.org/10.3390/su16219165
Submission received: 2 September 2024 / Revised: 15 October 2024 / Accepted: 21 October 2024 / Published: 22 October 2024

Abstract

:
The transit-oriented development (TOD) model provides benefits to urban areas in terms of transportation, the economy, society, and the environment. Given the complexity and limitations arising from the various backgrounds, objectives, and other aspects of previous studies, empirical research on specific cases has often failed to fully analyze the influence of built environment indicators on TOD performance. This paper systematically reviews and analyzes related empirical studies conducted worldwide up until June 2023. The correlations between built environment indicators and their impacts on TOD performance indicators are visualized and measured. General patterns of the influences of built environment indicators on TOD performance are summarized using social network analysis (SNA), and the key indicators are identified via cluster analysis. Finally, by analyzing the key indicators such as diversity, density, design, and distance to transit stations, as well as their associated built environment indicators, the built environment characteristics that ensure TOD performance are thoroughly examined. These insights provide a better understanding of the influences of the built environment on TOD performance, thus offering guidance for the development and application of the TOD model.

1. Introduction

Transit-oriented development (TOD) [1] is a model of urban development that emphasizes environmentally friendly and socially robust urban development relying on high-capacity public transit, mixed land use, and high-intensity development, among other factors. The TOD model has been widely applied in the United States (US) under market-oriented urbanization [2], which has served as a reference for TOD construction and development in other countries. The TOD model brings numerous benefits to cities in terms of transportation, the economy, society, and the environment, as evidenced by many empirical studies [3]. These benefits include alleviating urban sprawl and vehicle use, promoting sustainable transportation development [4], facilitating enterprise transformation and economic development [5,6], increasing public transportation identity, reducing energy consumption, improving the local environment, enhancing quality of life [7,8], addressing the imbalance between residential and employment areas, and promoting social trust and reciprocity [9,10]. In summary, TOD performance is a comprehensive concept that encompasses the impacts of TOD on transportation, the economy, society, and the environment [11,12]. As more empirical studies have been conducted, it has become evident that the successful implementation of the theoretical concepts of TOD engenders a dilemma, and the performance of different TOD projects varies significantly [13,14]. Studies have shown that the effects of TOD performance on residents’ travel patterns may fall short of expectations [15]. High population densities are theorized to suppress vehicle miles traveled (VMT) (Appendix B, item 1) [16,17,18], and the actual performance is influenced by multiple factors, including walking and cycling environments, transportation accessibility, the built environment, and node characters [19]. Thus, the diverse spatial environmental characteristics of TOD projects may lead to varied and uncertain performance outcomes.
To better advance the construction of the TOD model, scholars have summarized the built environment indicators that affect TOD performance. For instance, in terms of traffic performance, Cervero and Kochelman (1997) summarized ten sub-indicators of the “3D” dimensions of the built environment (density, diversity, and design) [20], and Cervero et al. (2009) proposed 39 indicators of the “5D” dimensions (density, diversity, design, distance to transit, and destination accessibility) [21]. The “3D”/”5D” frameworks have become key references for scholars when selecting built environment indicators in TOD performance studies. Additionally, Lyu et al. (2016) summarized 94 indicators from the “transit,” “development,” and “oriented” dimensions and extracted 18 built environment indicators as standards for TOD evaluation and classification [22]. Moreover, based on the development practice of US TOD projects, Renne (2005) summarized 56 indicators to evaluate TOD performance from five aspects: transportation, the economy, the environment (air quality and energy consumption), the built environment, and society [23]. These studies provide a robust foundation for exploring the correlation between the built environment and TOD performance in rail transit station areas.
However, the intricate correlations between built environment indicators and TOD performance indicators require gradual clarification through extensive empirical research. Previous studies on TOD performance indicators and their influencing factors have mostly focused on a specific aspect [10,23,24,25,26], which often may have negative impacts on research and practice. Given the differences in and complexities of researchers’ disciplinary backgrounds, research goals, and research subjects, as well as the selection of performance indicators and influencing factors across different cases, single studies alone are insufficient to comprehensively analyze TOD performance and its influencing factors. The differential characteristics of the impacts of “3D” or “5D” built environment indicators on travel behavior (transit use, walking/cycling, VMT, etc.) have been confirmed in existing studies [20,21]. Ewing and Cervero (2010) systematically reviewed the relationship between travel behavior and the built environment using meta-analyses and summarized the general pattern of the “5D” dimension indicators in terms of their impact on travel behavior [23]. Moreover, Cervero (2013) summarized the “5D” dimension indicators based on the impact of the US built environment on travel behavior [27]. With related research on TOD performance evaluation being carried out in more countries, the applicability of these research results still requires verification with more empirical cases.
The correlations among some built environment indicators have been confirmed in practical case studies, such as those carried out by Sun (2023) [3], Alquhtani (2021) [4], Yu (2022) [28], and Ke (2021) [29]. Additionally, studies by Xia (2022) [26], Uddin (2023) [30], and Xiao (2021) [31] noted greater combined effects of several built environment variables on the transportation impact. However, there remains a lack of a sufficient systematic review of the characteristic correlation effects of different combinations of built environment indicators, and their specific supportive roles in TOD performance have not been fully revealed.
Therefore, to better understand the influences of built environment indicators on TOD performance across diverse urban contexts, it is crucial to reflect on global TOD practices, avoiding insufficient comprehension in specific cases. This work addresses the following questions via a review of the literature related to TOD performance:
(1)
Which built environment indicators exhibit universality across TOD performance indicators (traffic, economic, environmental, and social)?
(2)
How can the correlation effects among built environment indicators be leveraged to more effectively enhance TOD performance?
(3)
Given the variability in TOD project performance, which built environment characteristics can effectively improve TOD performance?

2. Methods

The first step was to conduct an extensive literature search regarding TOD performance. The search mainly focused on studies published in English. After reviewing many articles, a preliminary analysis of commonly used keywords on TOD performance was conducted to refine the screening process. The selection criteria for articles focused on titles containing “station area”, “transit-oriented”, “TOD”, or “transit station”, along with abstracts or keywords that included terms like “performance”, “influence”, “impact”, “effect”, “evaluate”, “assess”, “measure”, “encourage”, or “reduce”. These keywords served as the first-order criteria, and were combined using logical operators (“OR”) to form the second-order keywords. These terms were entered into various databases, such as the Web of Science, Elsevier, SAGE, and Taylor & Francis. The retrieved results, with publication dates up to June 2023, were saved as “Plain Text” with “Full Record and Cited References” yielding 347 articles. These articles were imported into literature management software (i.e., Endnote 4.0, NoteExpress 20) for inclusion and exclusion screening. The criteria were as follows: exclusions involved duplicate entries from different databases, articles irrelevant to the topic (i.e., those that do not discuss the influence of the built environment in terms of transportation, the economy, society, and the environment), and those merely citing others’ findings without in-depth discussion. The inclusion criteria focused on studies that clearly discussed the qualitative or quantitative relationships among built environment indicators or their relationship with TOD performance. Ultimately, 146 articles were considered valid for further analysis. Figure 1 shows the distribution of case studies, with nearly 40% focusing on TOD in the US and the others mainly considering the contexts of China, Australia, South Korea, and some European countries. There has been an especially significant increase in empirical research cases on TOD in China [5,8,19].
Second, environment indicators that describe the built environment characteristics of TOD and performance indicators for the evaluation of the impacts of TOD were extracted from the literature. In total, 59 built environment indicators, including the population density, diversity of land use, distance to transit stations, development density, and employment density, and 40 performance indicators that pertain to the environmental, economic, social, and traffic dimensions were captured. Appendix A Table A1 provides the statistics on these indicators and their inter-relationships. An input–output analysis method, which is commonly used in economics to reflect inter-relationships among different parts of an economic system, was applied [32]. To clearly outline the specific performance indicators of TOD and their influencing factors, the built environment indicators of TOD were classified as “inputs”, and the specific performance indicators of TOD were classified as “outputs.” In previous TOD performance evaluations, such as that by Higgins and Kanaroglou (2016), the input indicators included the density, the balance between residence and employment, street connectivity, and the diversity of land use, while the output indicators included the public transit share rate, walking share rate, cycling share rate, and vehicle miles traveled (VMT) [33].
Third, the correlations between the environment and performance indicators were examined using the social network analysis (SNA) method to explicate the effects of TOD interventions. The relationships between different built environment indicators were also analyzed to uncover the associations between different design and planning considerations. The aim was to identify common patterns based on existing empirical studies. SNA has been widely used in various disciplines, from information science [34] to architecture and planning, and has been proven as an effective approach to capturing relationships between components in complex systems. In SNA, individuals are represented as nodes and the relationships between them are represented as linkages, thus forming a network whose structure and characteristics can be analyzed. Relationships defined by linkages among units are a fundamental component of network theories. Key SNA indicators include density, centrality (degree/betweenness/closeness), and cliques [34]. Degree centrality indicates the importance of an element within the network [35], while cliques represent closely interconnected nodes. In this study, degree centrality and cliques were used to examine the effects of built environment indicators on TOD performance and the inter-relationships between different indicators. Degree centrality metrics include the following: (1) degree centrality within the output (DCO), reflecting the impact of input elements on specific TOD performance indicators; and (2) degree centrality within inputs (DCI), indicating the inter-relationships among input elements, which is measured by the sum of connection values within cliques formed by directly related input indicators.
Finally, based on the SNA results, a two-step cluster analysis using IBM SPSS version 27 was conducted to study the key indicators affecting TOD performance, which were ranked in terms of importance. This method is a hierarchical clustering algorithm through which clustering analysis is performed using statistics as the distance index, so high-quality cluster analysis results can be generated [36]. It also allows for a choice of cluster variables and assigns or automatically generates the number of clusters. Thus, it has been widely used in data mining analysis, e.g., to identify different health-related lifestyle clusters, define metropolitan regions, and identify neighborhood groupings [14]. In this study, DCI and DCO were used as the variables in the two-step cluster analysis method to examine the key indicators affecting TOD performance from the aspects of traffic, the economy, the environment, and society. These indicators generated four clusters of TOD performance (highest, high, medium, and low).

3. Results

3.1. Input Elements of TOD Performance Evaluation

A systemic review of the input indicators affecting TOD performance considered in the extant literature was conducted (Appendix B, item 2). These indicators and their associations in relevant studies, as determined using SNA, are presented in Figure 2 (Appendix B, item 3).
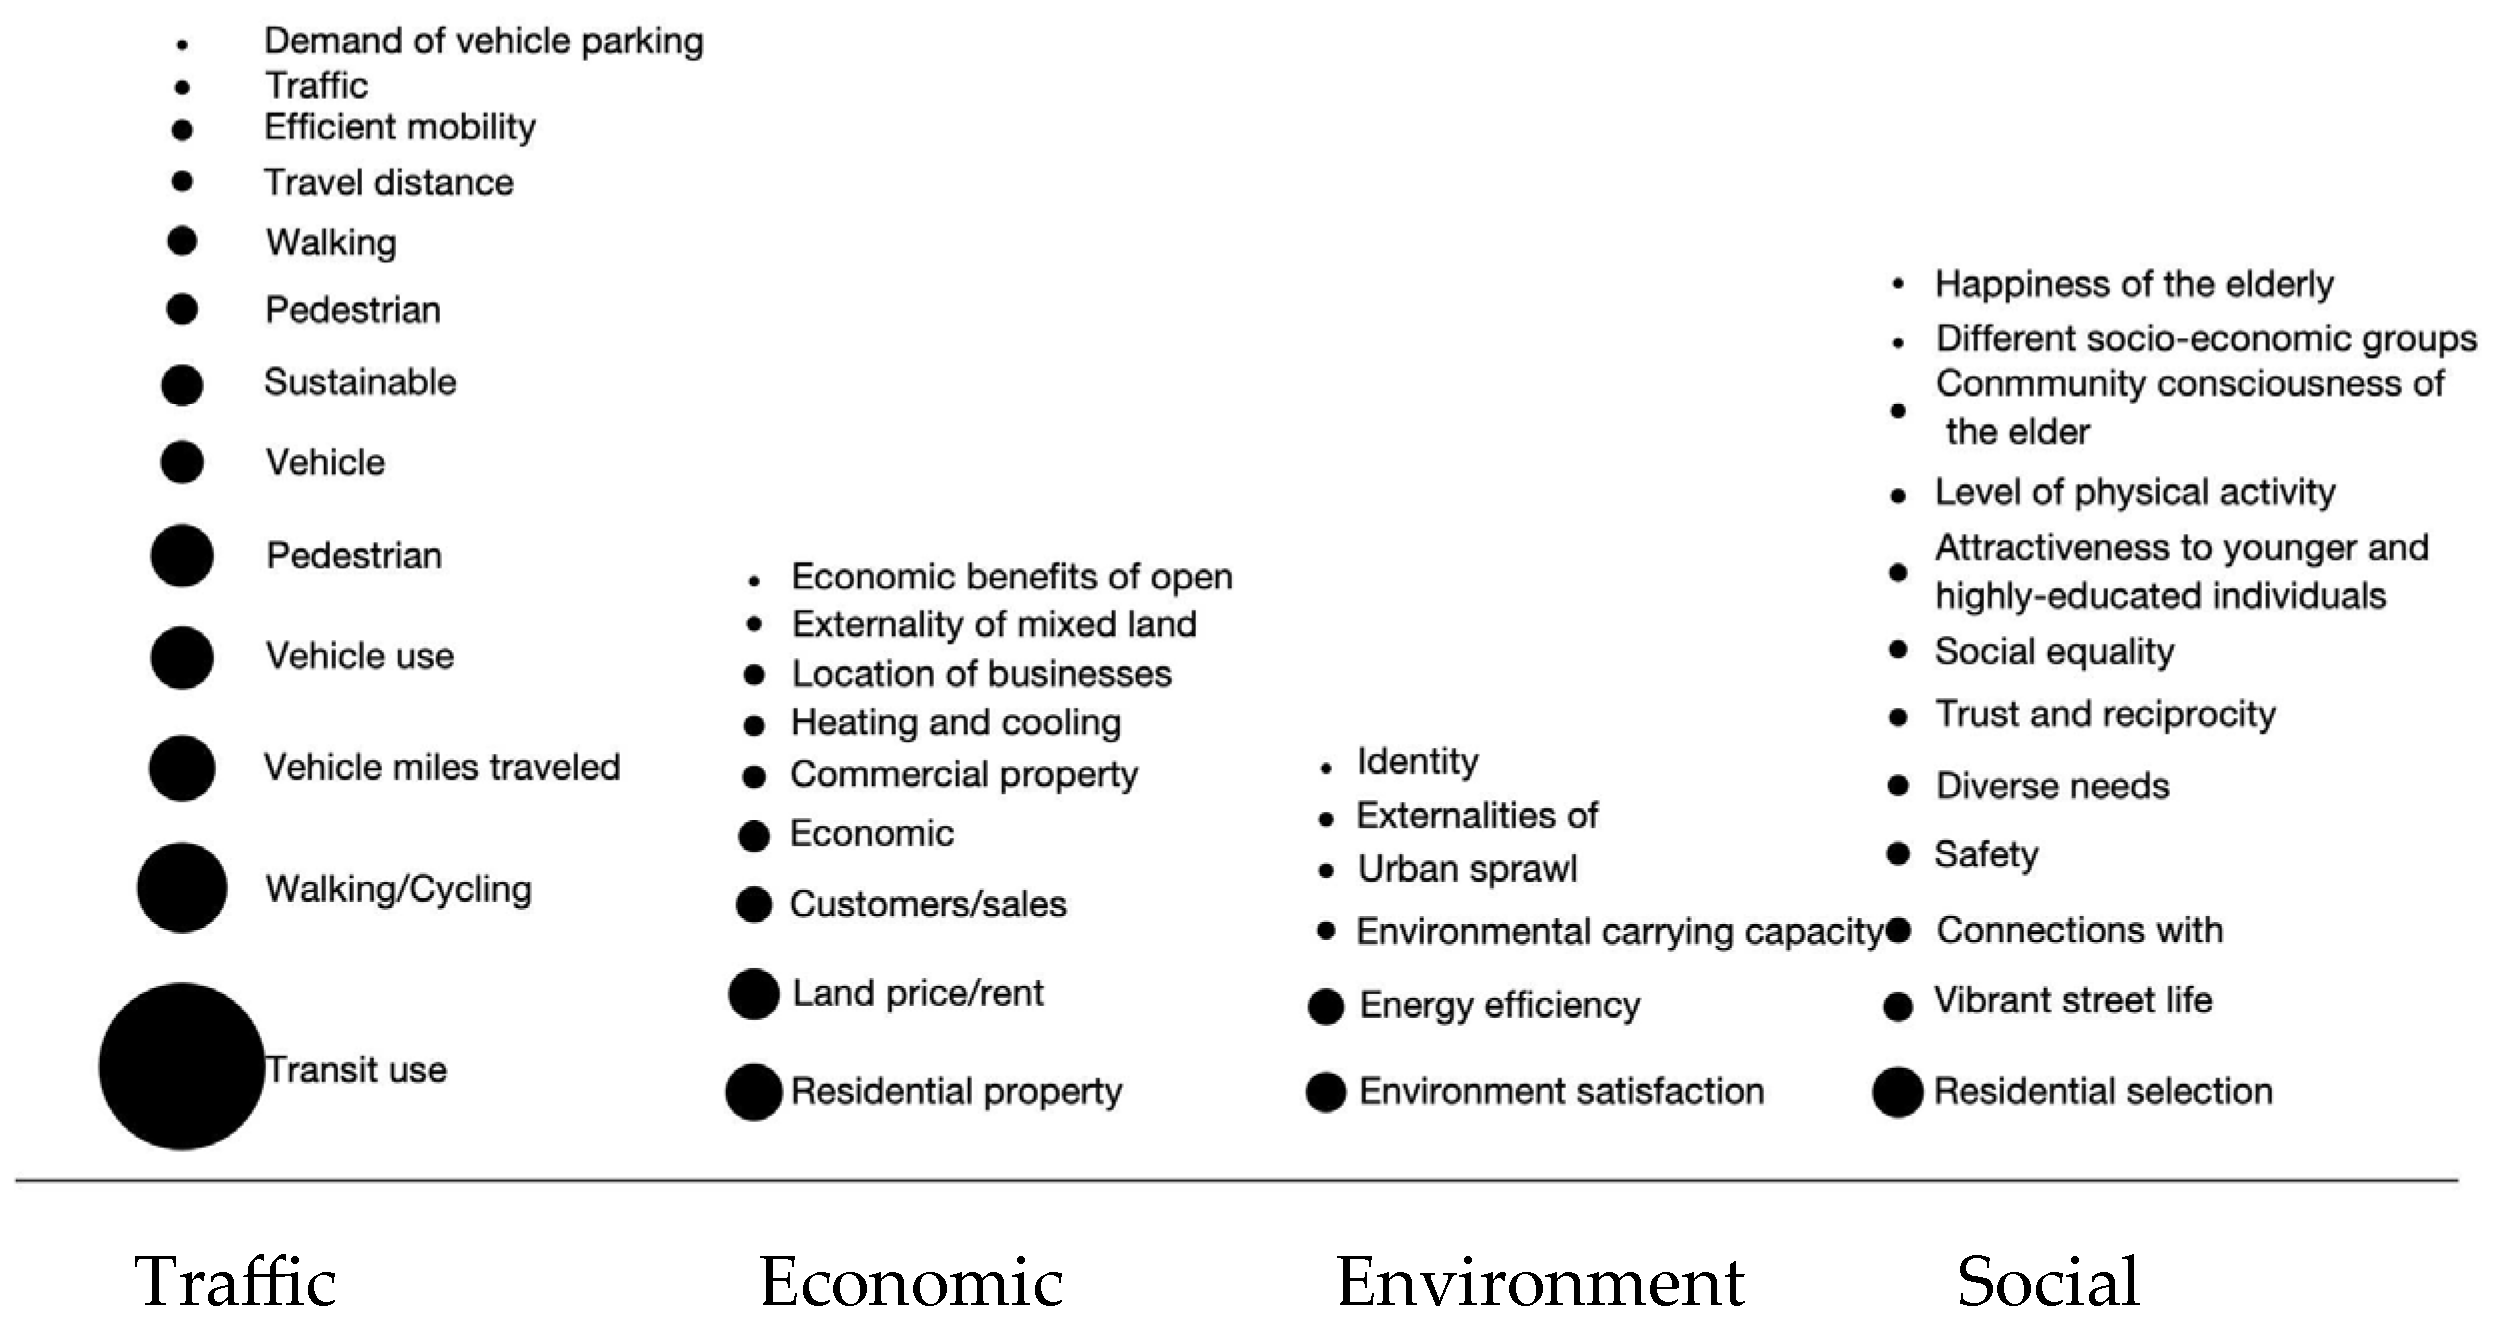
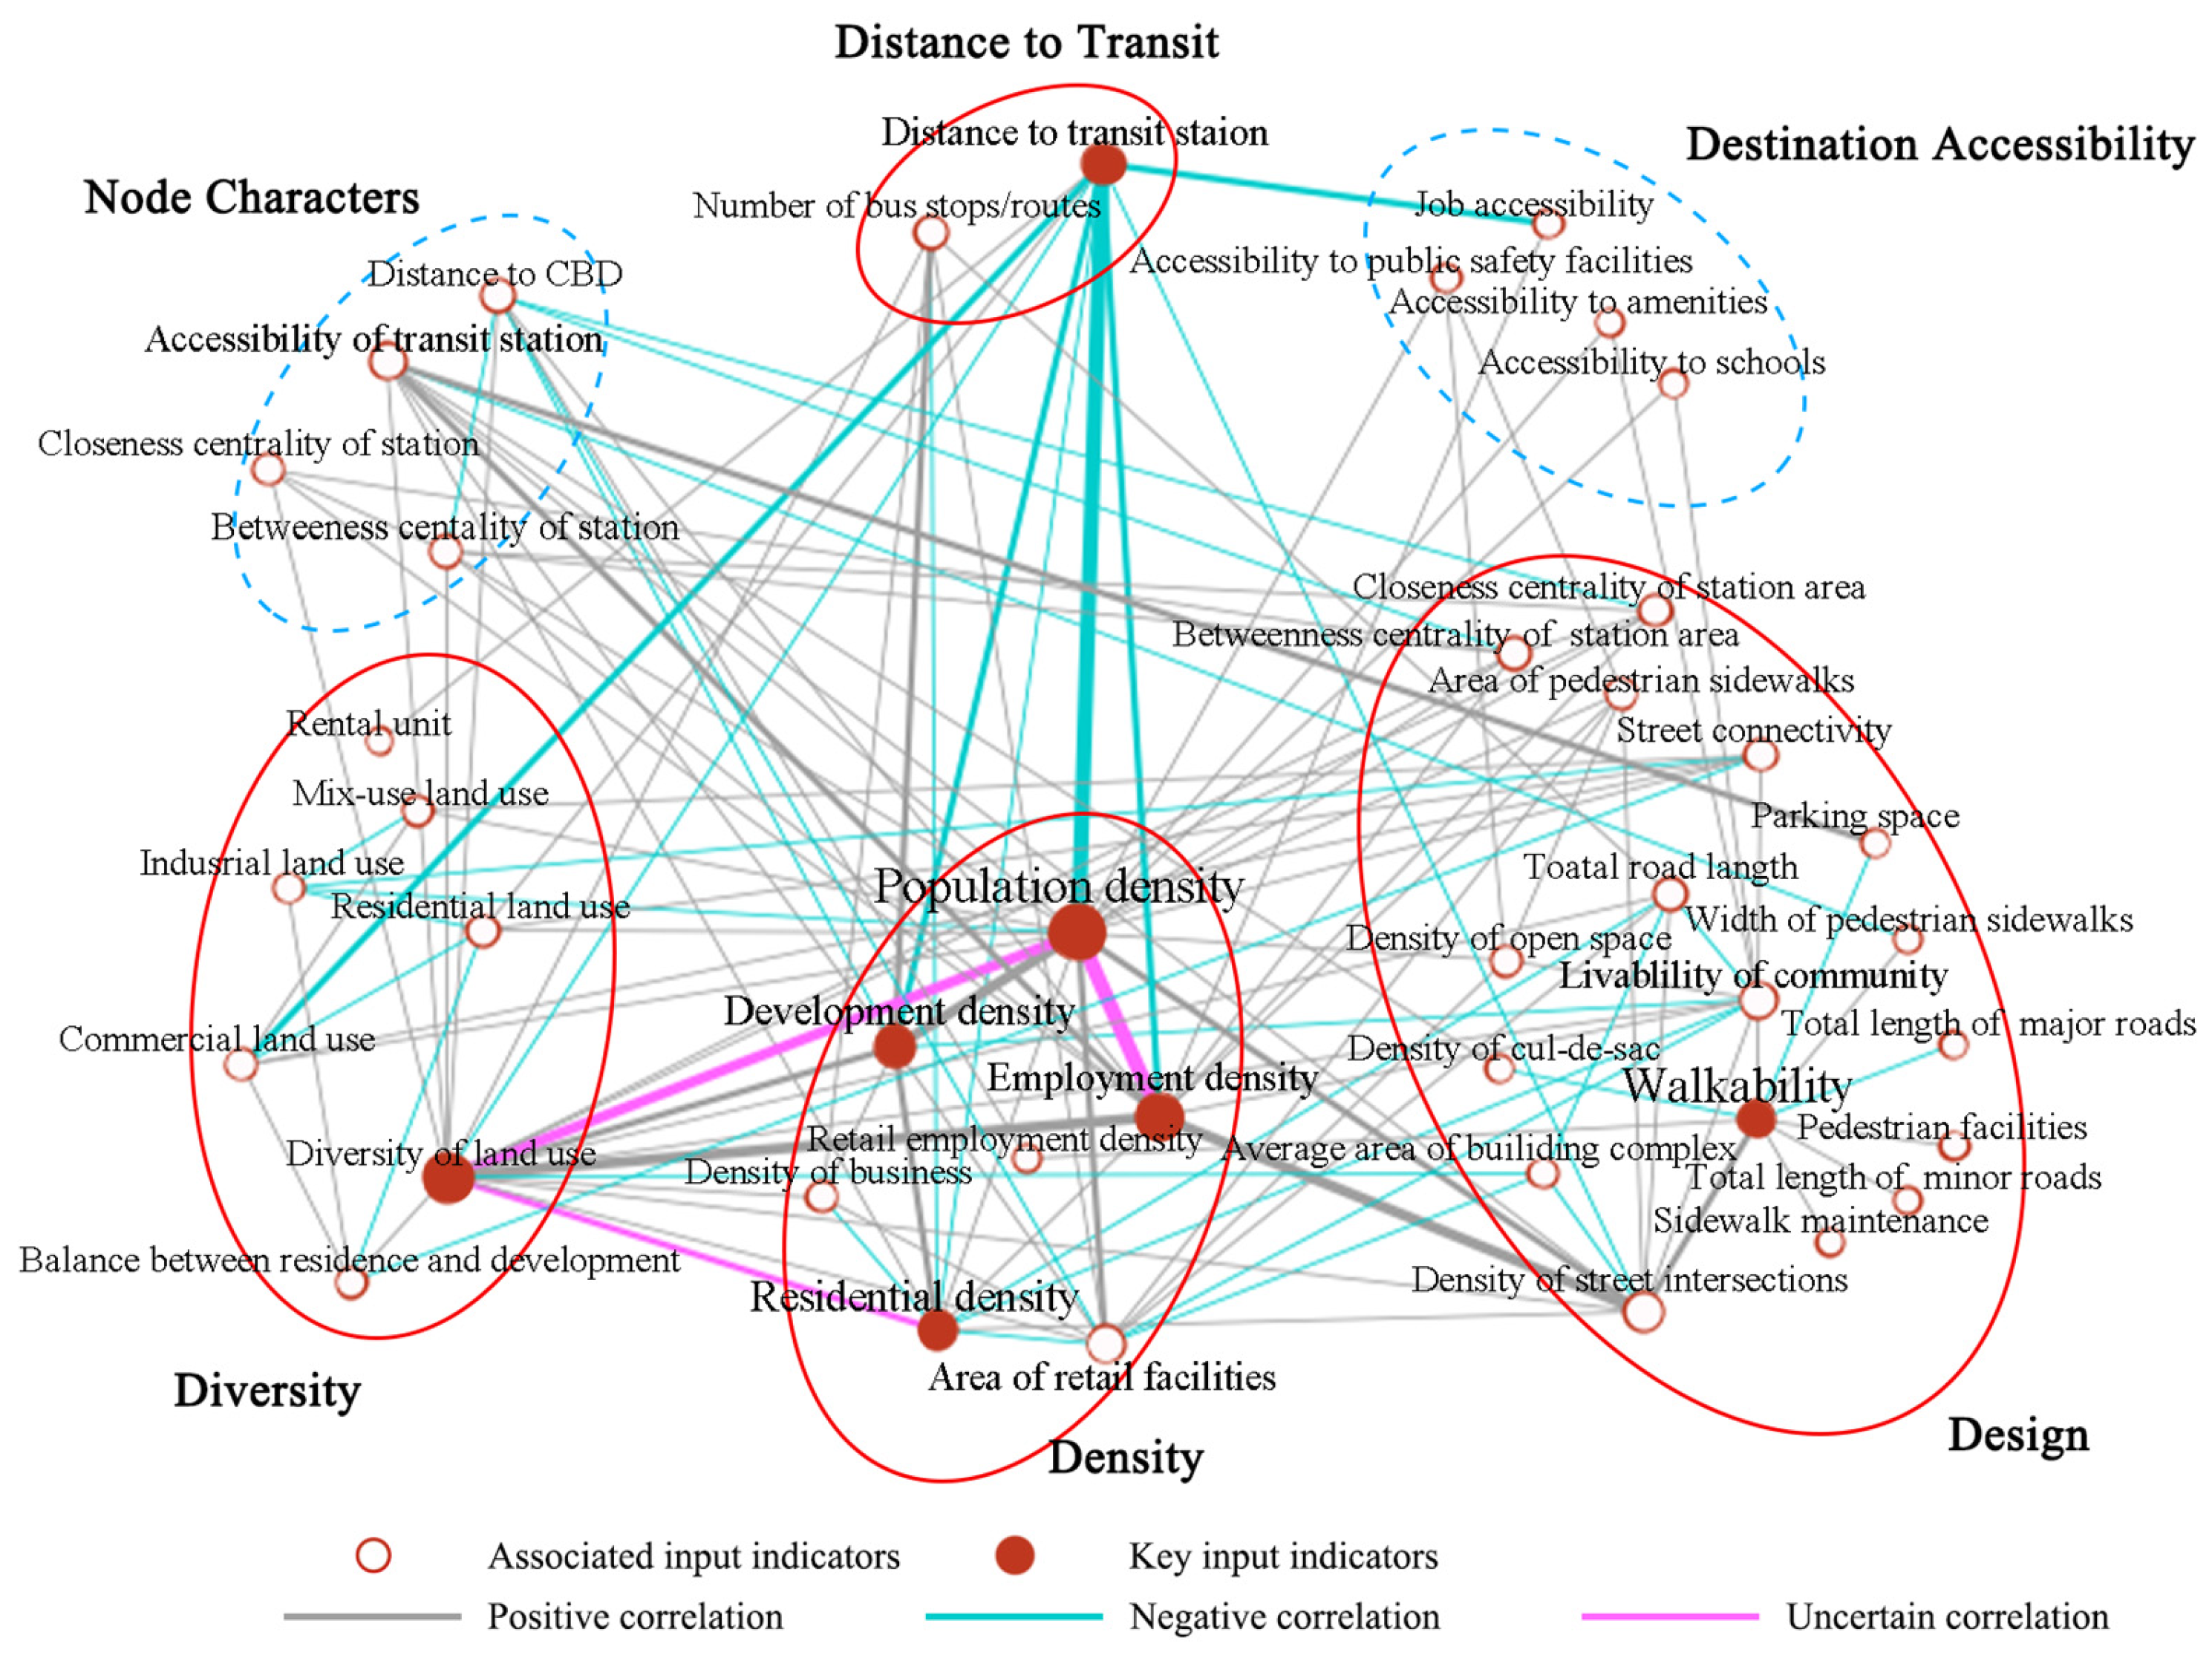
  • As illustrated in Figure 2 and Appendix A Table A1, it is evident that numerous case studies have validated the effects of the “5D” dimension indicators proposed by Cervero et al. (2009) on TOD performance [21]. Moreover, the elements of the “5D” framework have been enriched and refined, exhibiting an improving research trend. Indicators such as pedestrian shelters, street design/geometry, the design of bus stops, the closeness centrality of stations, the betweenness centrality of stations, and the density of open space have been confirmed to influence TOD performance in transit station areas. In addition to the “5D” dimension indicators, some studies have revealed the influences of key indicators of node characters (e.g., the accessibility of the transit station, the distance to the central business district (CBD), the closeness and betweenness centrality of the station, etc.) on TOD performance, which can promote a comprehensive analysis of the different performance of TOD projects.
2.
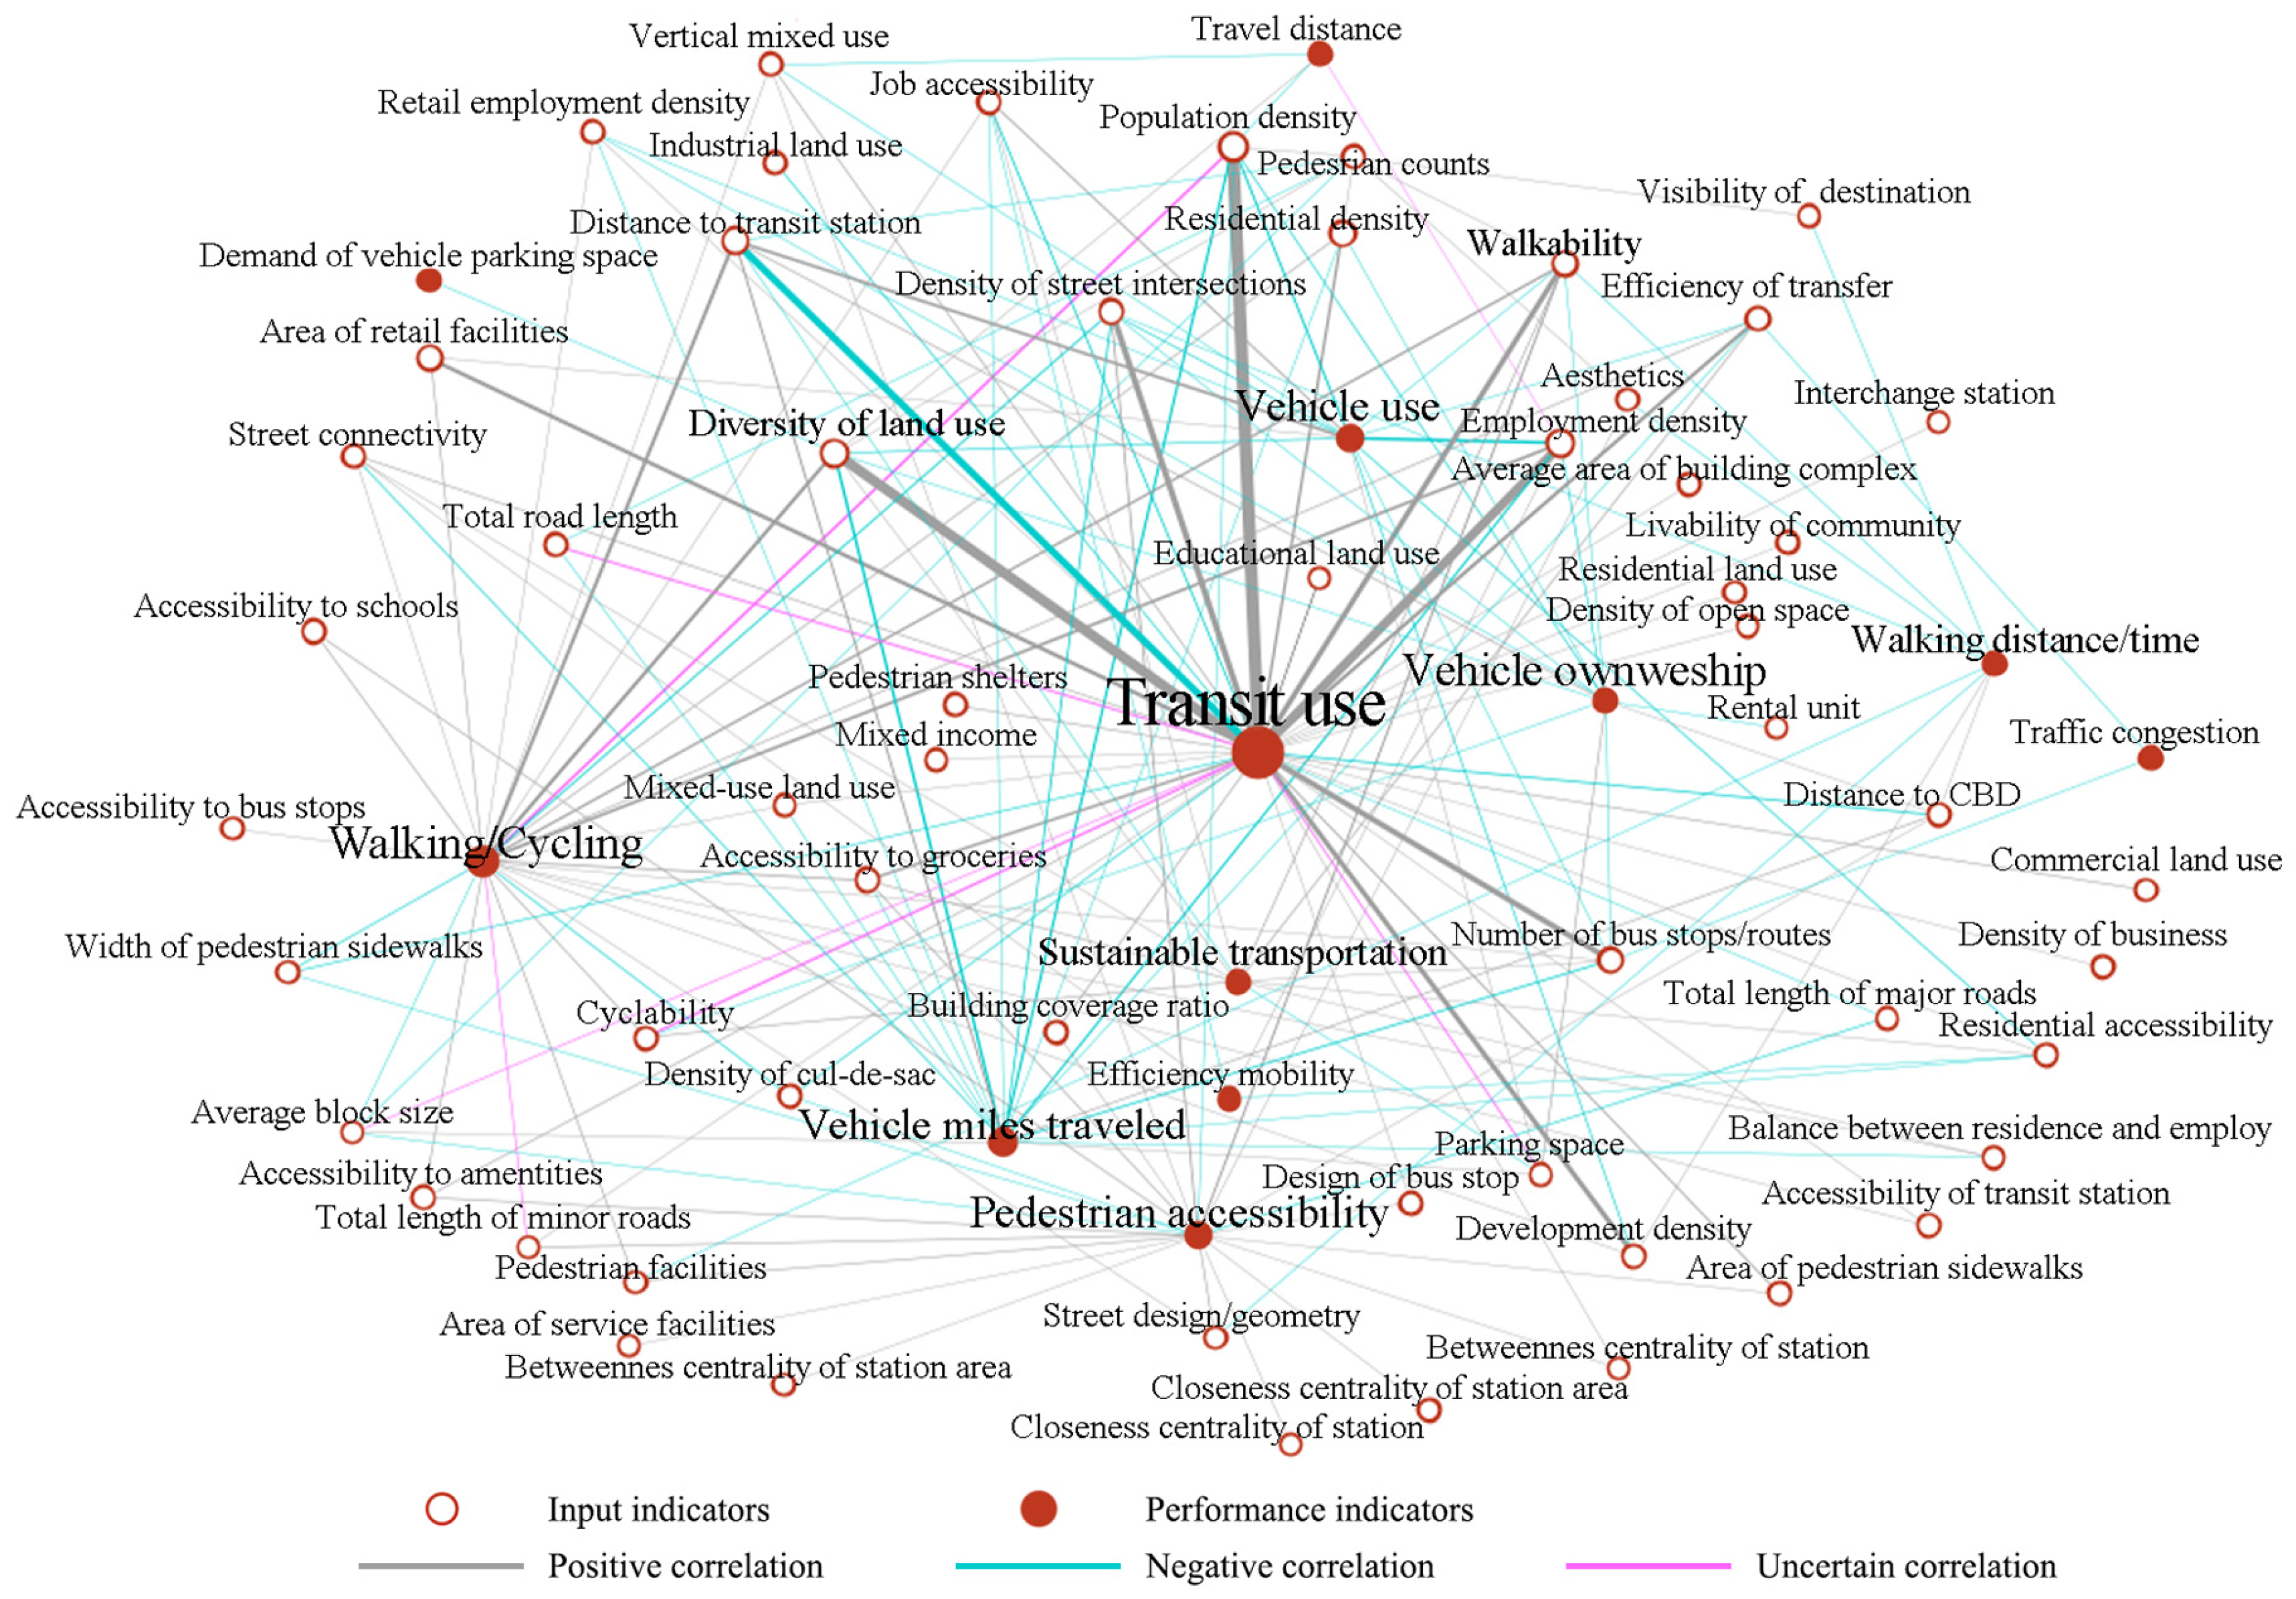
The connections among different input indicators, as shown in Figure 2, and the associations among the indicators, as listed in Appendix A Table A1, reveal significant differences in TOD performance based on built environment indicators. Moreover, the same built environment indicator may exert different influences on different TOD performance indicators. The efficiency of TOD is significantly influenced by several built environment indicators. Key indicators include the population density, diversity of land use, employment density, community livability, distance to transit stations, and development density. Among these, the distance to transit stations has been extensively studied, with approximately 50 studies verifying its influence on TOD performance [4,27,37,38]. This indicator has the most significant effect on traffic performance within TOD, although its direct impact on environmental performance remains less empirically supported.
3.
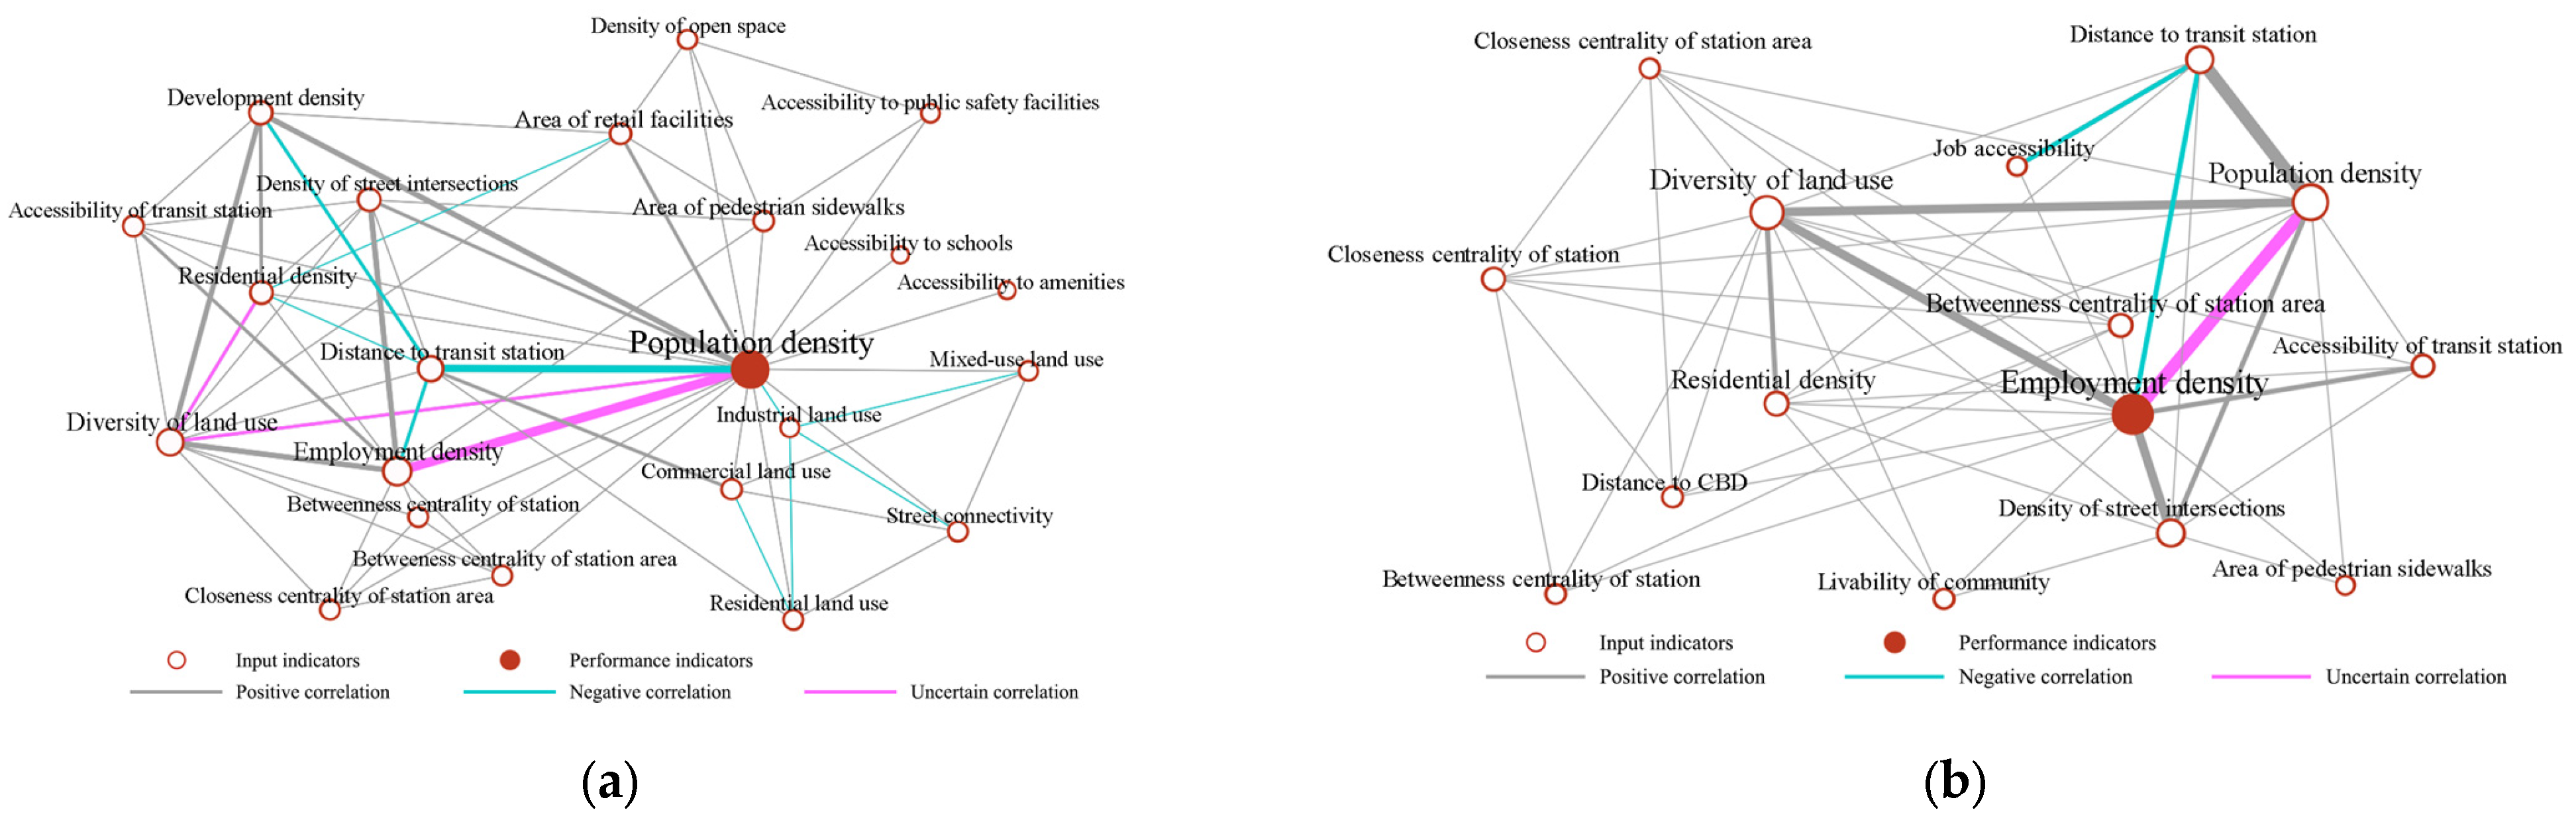
The cliques formed among different input indicators, as shown in Figure 3, reveal symbiotic coexistence and mutual influence relationships among various built environment indicators. In the present analysis of TOD performance, the values of association among different inputs were obtained by calculating the degree of centrality of each key input constituting a clique. This approach made it possible to clarify and measure the features of associations among different indicators of the built environment, as indicated by a large number of empirical studies. This is evidenced in Figure 3a, in which factors such as the population density, diversity of land use, residential density, development density, density of retail facilities, closeness centrality of stations, betweenness centrality of stations, and street connectivity exhibit positive correlations. In Figure 3b, the employment density exhibits positive correlations with the diversity of land use, the density of street intersections, the residential density, the betweenness centrality of the station area, the accessibility of the transit station, and the job accessibility.

3.2. Indicators of TOD Performance Evaluation and Their Influencing Factors

The key indicators of the built environment around rail stations were analyzed in terms of four aspects: traffic performance, economic performance, environmental performance, and social performance. Figure 4 presents the statistics on TOD performance indicators that have appeared in previous studies, the results of which reveal the following:
  • In traffic performance, public transit use (Appendix B, item 4), walking/cycling (Appendix B, item 5), VMT, vehicle use, and pedestrian accessibility have been intensively studied;
  • In economic performance, researchers have examined residential property values, land prices/rents, customers/sales, economic activities, and commercial property values;
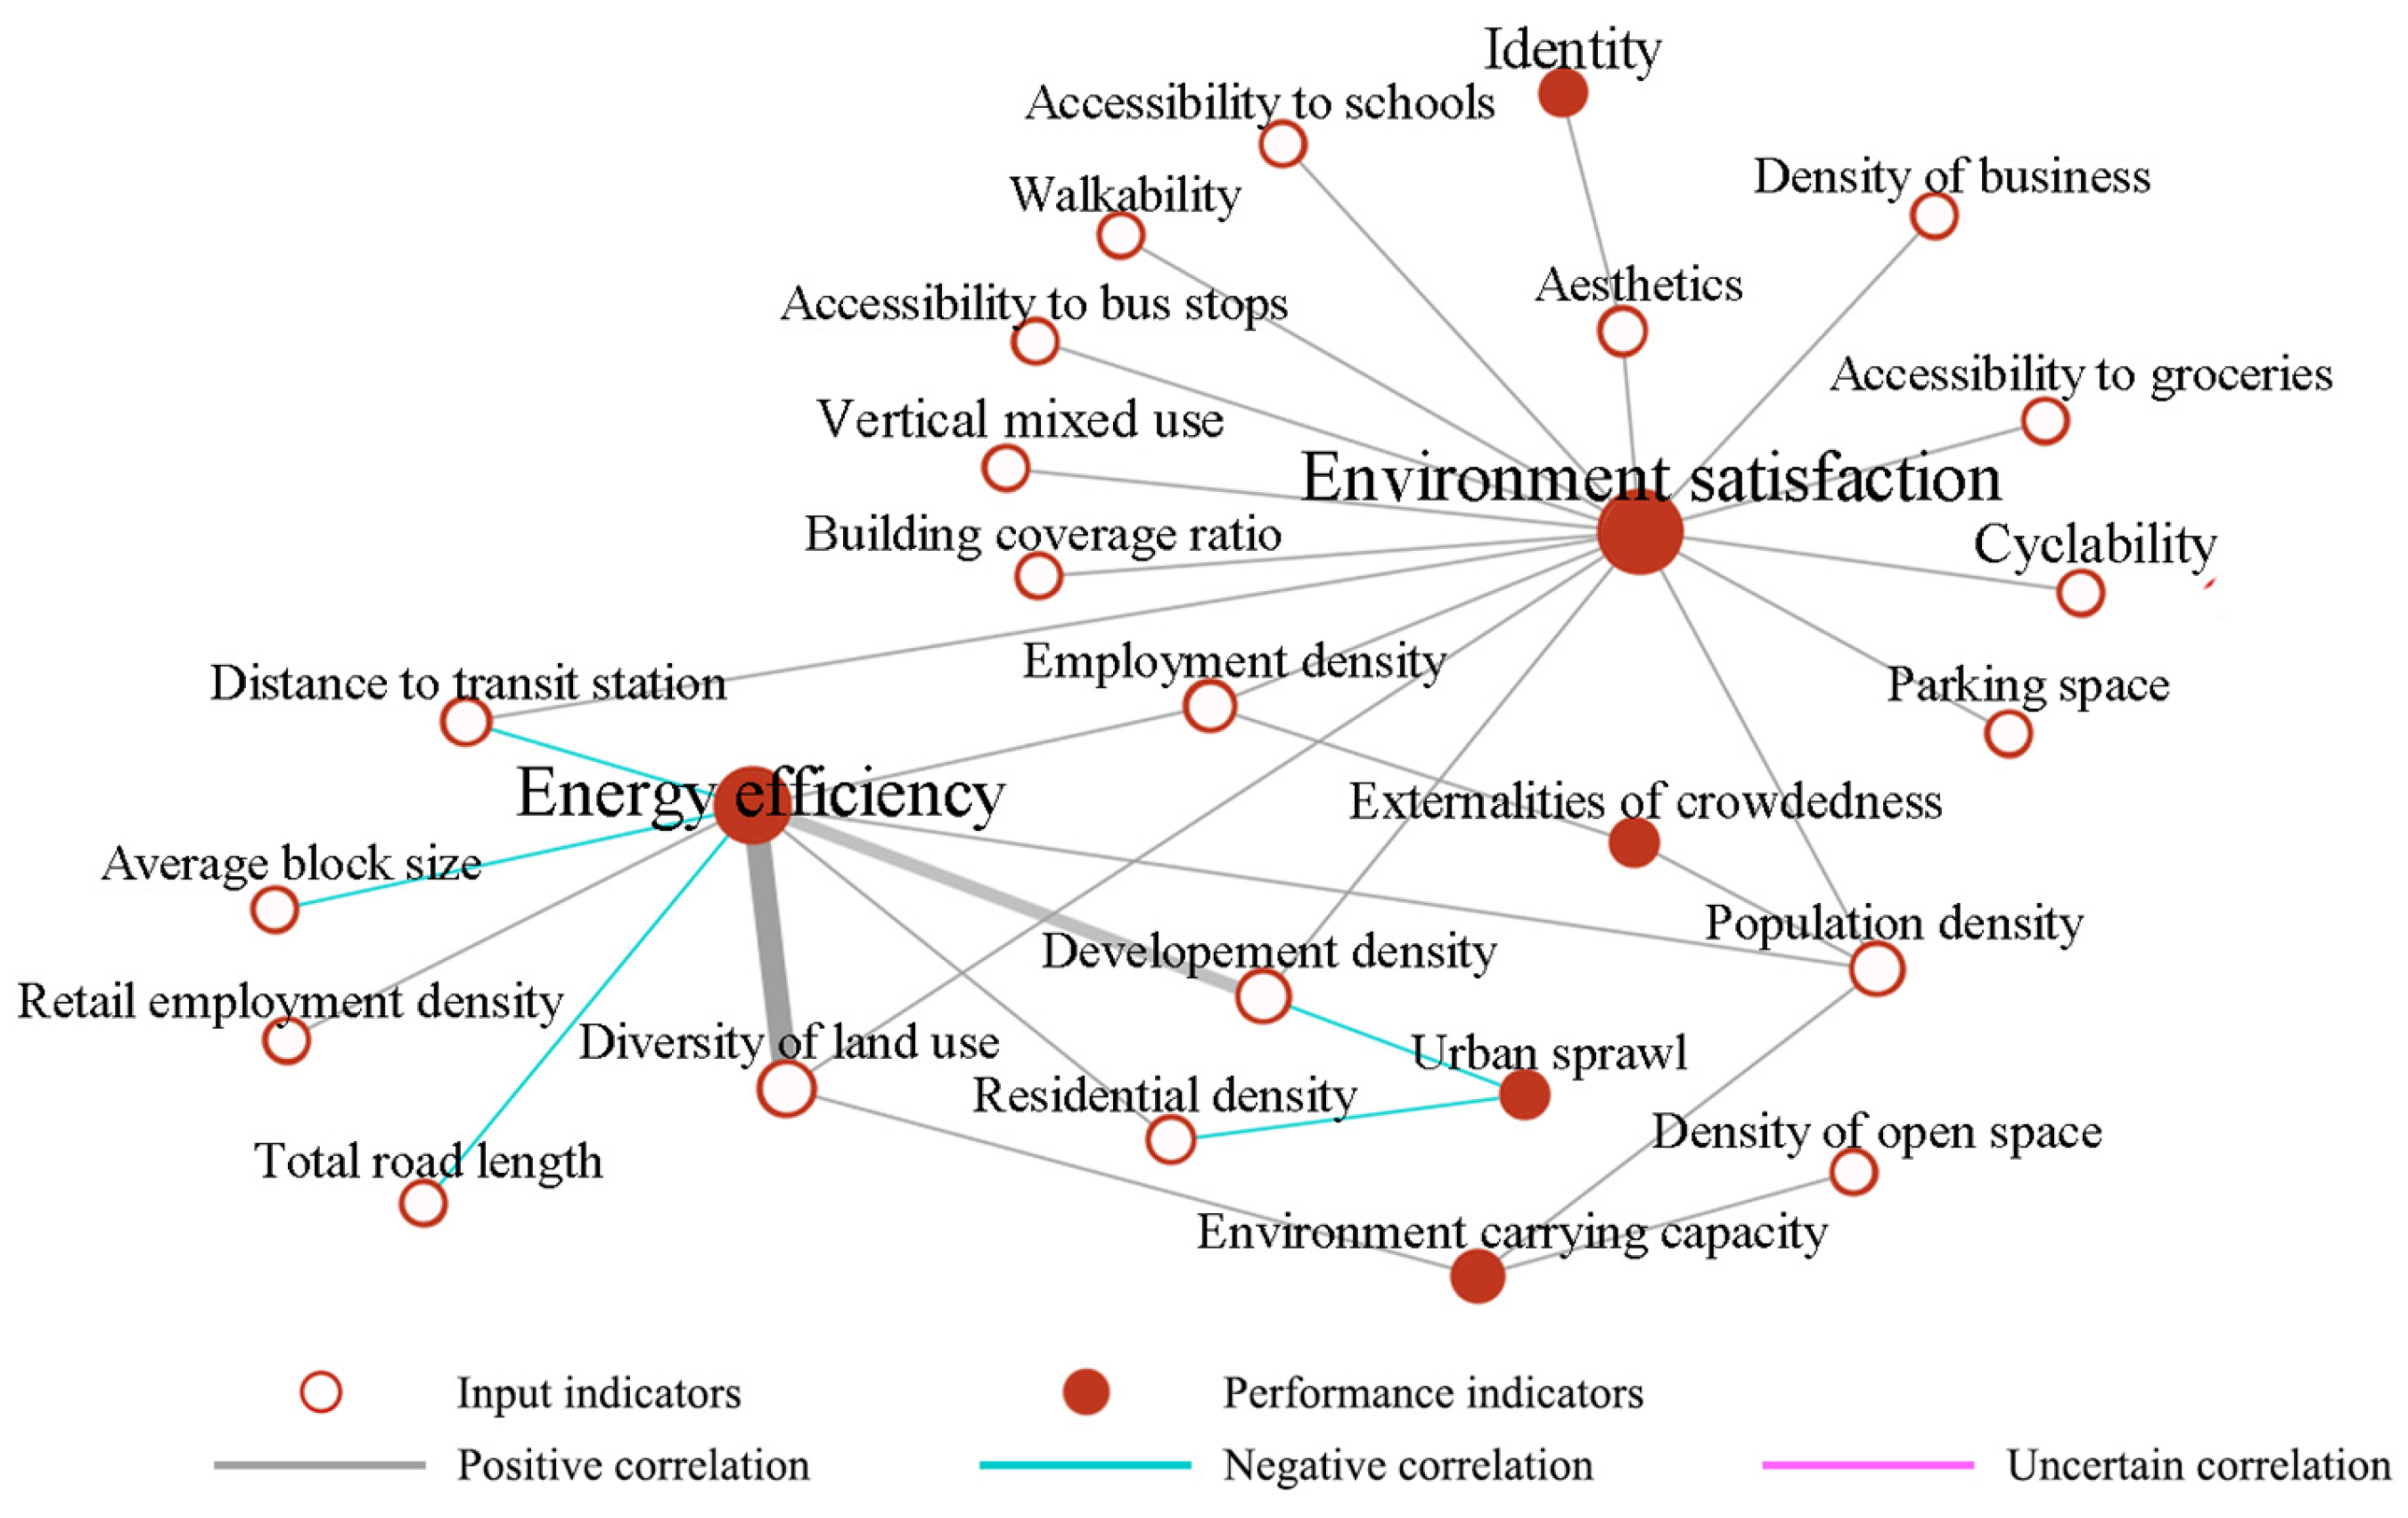
  • In environmental performance, environment satisfaction and energy efficiency have been intensively studied;
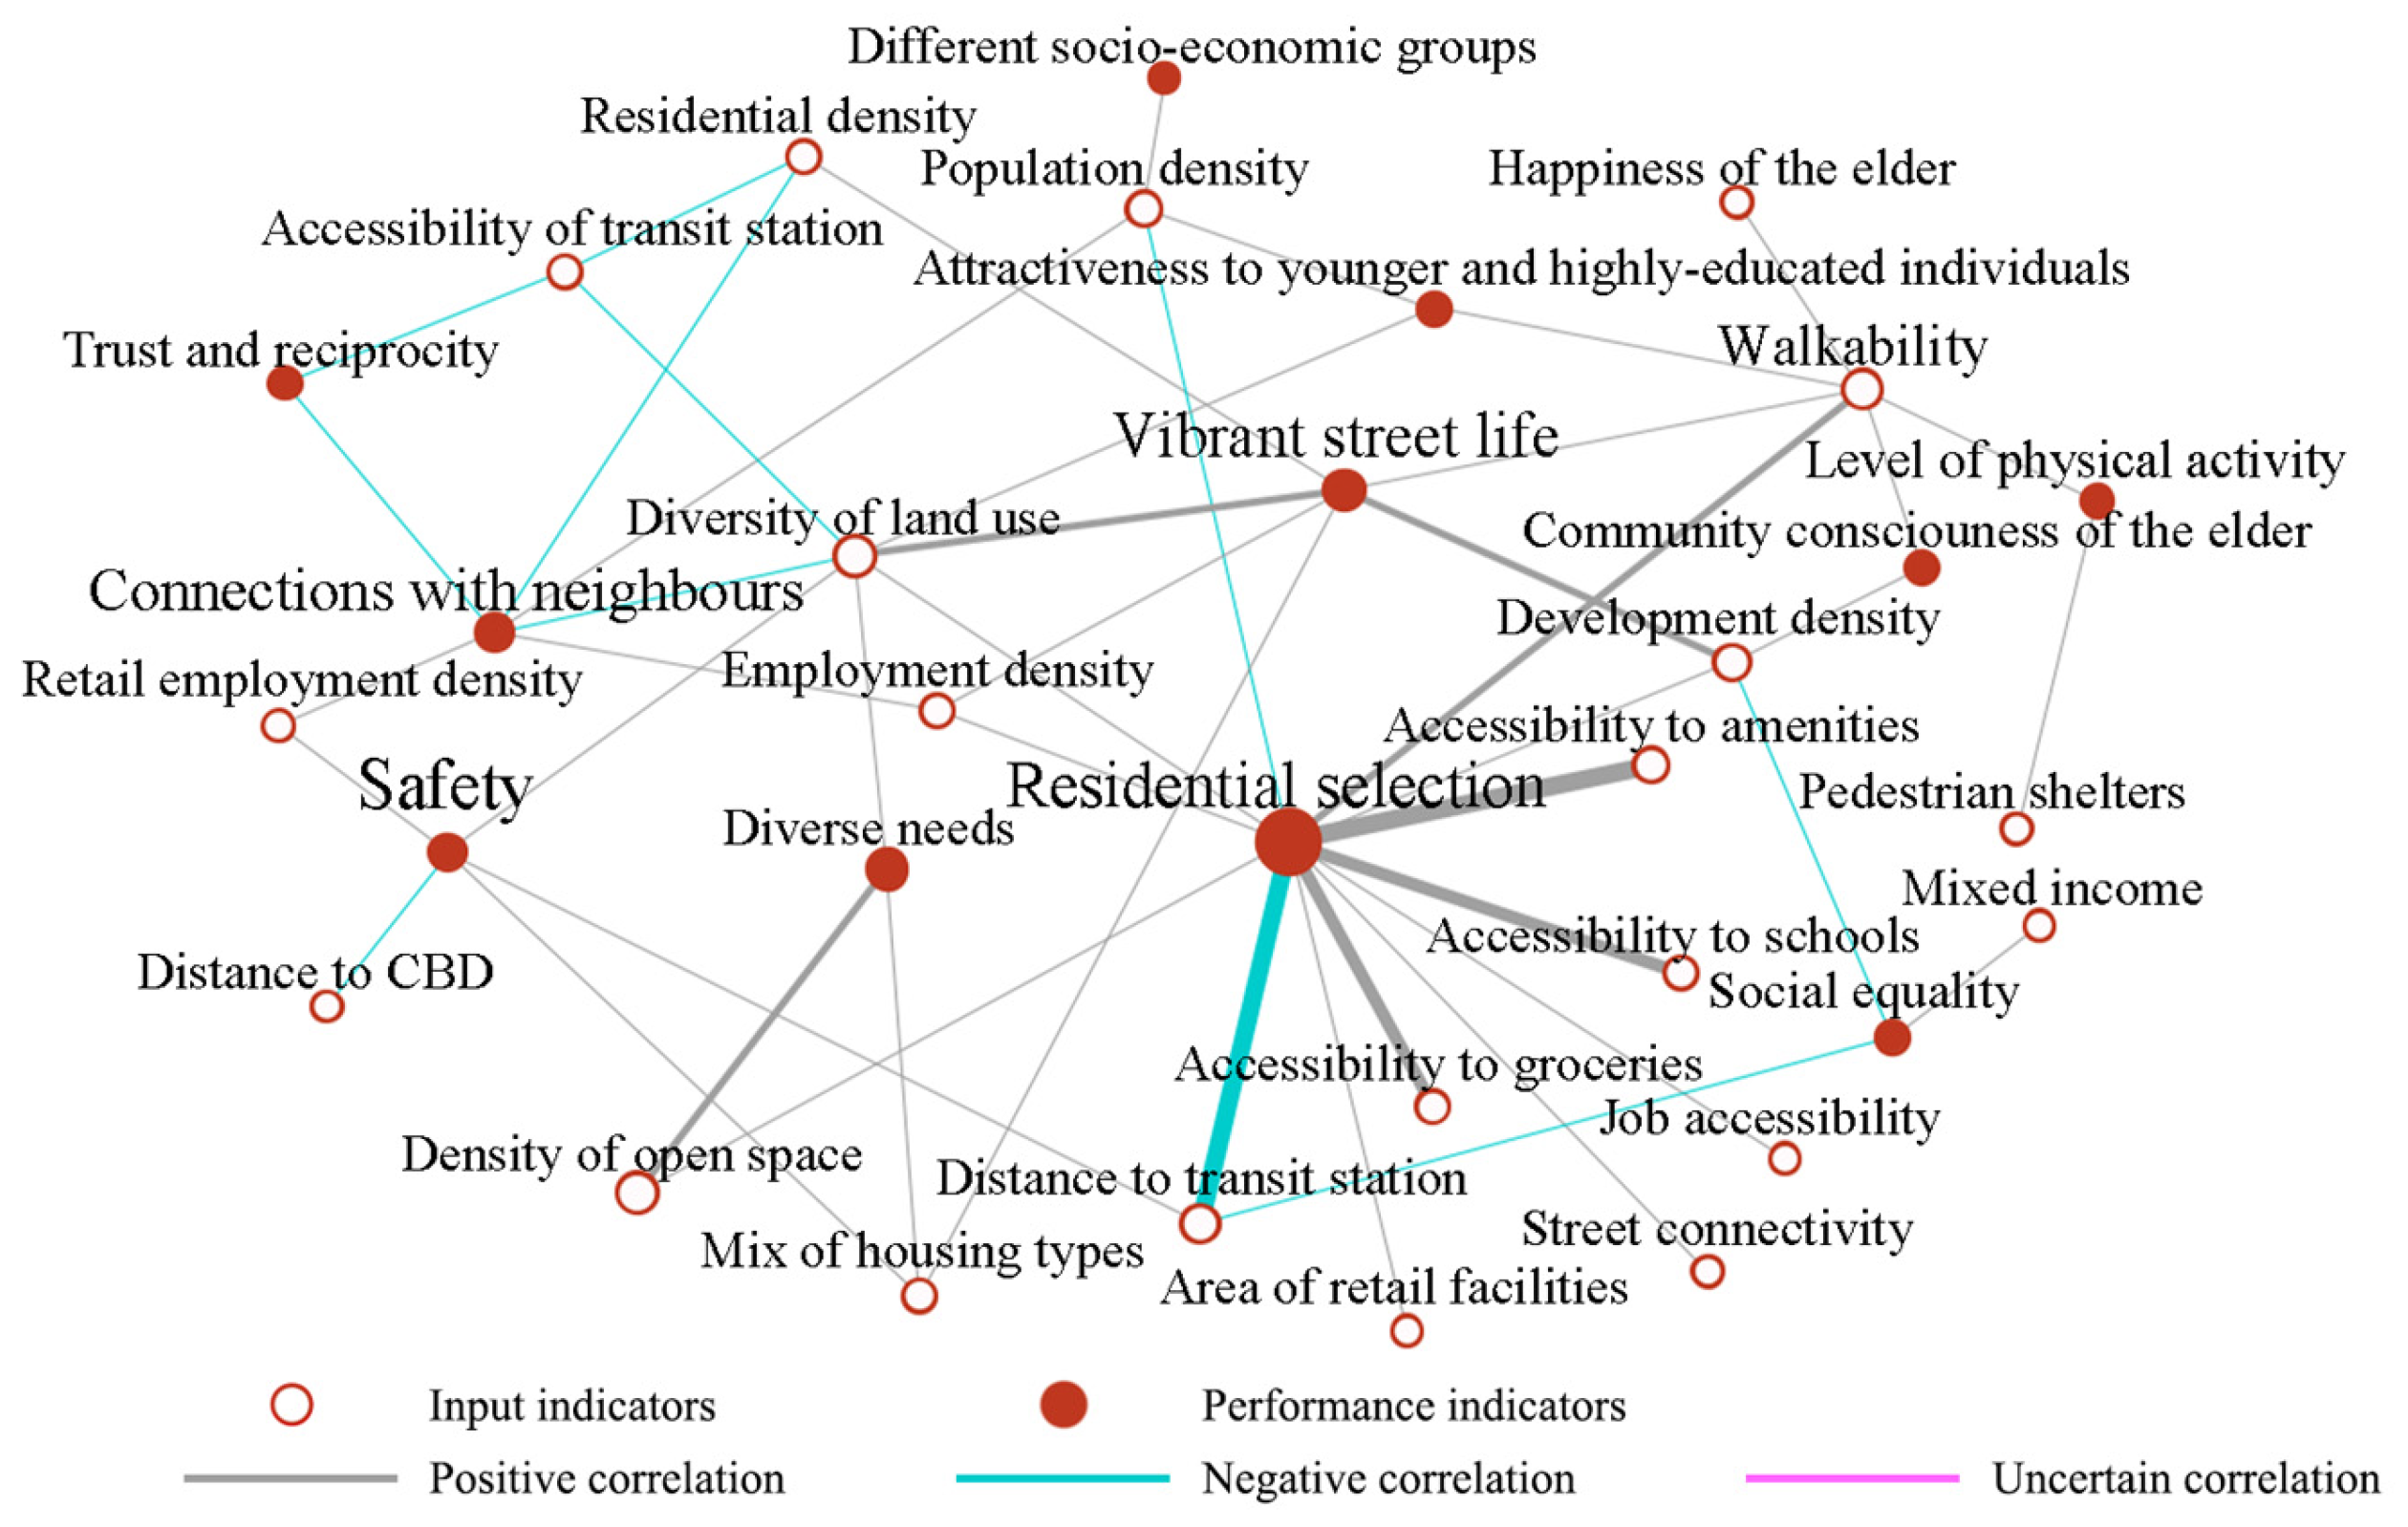
  • In social performance, researchers have studied residential selection, connections with neighbors, safety, and diverse needs.

3.2.1. TOD Traffic Performance and Its Influencing Factors

Figure 5 presents the relationships among the traffic performance indicators of TOD and their influencing factors using SNA. The figure reveals the following:
  • First, related studies have confirmed the different effects of built environment indicators on TOD traffic performance. The most frequently validated input indicators, from highest to lowest frequency, are as follows: population density, diversity of land use, employment density, distance to transit stations, walkability, and the density of street intersections.
  • Second, the influences of some built environment indicators on TOD traffic performance exhibit common features. Studies have shown that transit use and walking/cycling in rail station areas can be enhanced by optimizing the population density, employment density, distance to transit station, and diversity of land use. Vehicle use and household VMT can be reduced by improving the employment density, population density, and diversity of land use.
  • Third, current studies on TOD traffic performance focus on the public transit share rate (transit use, vehicle use, walking/cycling, etc.) and VMT. Although some studies have addressed performance related to specific traffic behaviors (pedestrian counts, walking distance/time, pedestrian accessibility, efficient mobility, etc.) and their influencing factors, more empirical studies are needed to understand general features. For example, do indicators like the density of street intersections, walkability, pedestrian facilities, street design, and aesthetics universally impact the walking distance/time? Do parking spaces around the station areas, the number of bus stops/routes, the average block size, and the distance to transit stations universally impact transit use?
  • Additionally, some built environment indicators were found to exhibit abnormal effects in their relationship with TOD traffic performance indicators. For example, the average block size within a station area is not positively correlated with transit use. High-density street networks with small blocks promote connectivity and walking/cycling. However, as the block size increases to its threshold, low connectivity among blocks reduces transit use [39]. Similarly, the number of parking spaces exhibits a threshold effect; effective parking-space planning must balance convenience with encouraging transit use to ensure reasonable utilization [27].
Four clusters for TOD traffic performance were generated, and two indexes (DCO and DOI) of the key indicators of this outcome (56 input elements) were used as clustering variables based on the two-step cluster analysis method, as shown in Figure 6. The statistics for the indicators and the categories for the clustering variables of the key indicators of TOD traffic performance are shown in Appendix A Table A1. The results demonstrate that the clustering quality is “good”. Clusters A (DCI: 24.00; DCO: 48.50) and B (DCI: 13.14; DCO: 17.57) have strong impacts. Cluster A represents the highest DCO of traffic performance and the highest DCI for factors influencing traffic performance, while Cluster B represents a high DCO and high DCI. The four input indicators in Cluster A (7.1% of the total) are, in order from the strongest to the weakest impact, the population density, employment density, diversity of land use, and distance to transit station. The seven input indicators in Cluster B (12.5% of the total) are the density of street intersection, walkability, and development density. Cluster D (DCI: 1.14; DCO: 4.86) represents a medium DCO and low DCI and includes 28 indicators, like the efficiency of transfer and access to groceries. Cluster C (DCI: 6.00; DCO: 2.71) represents a medium DCI and low DCO and includes 17 indicators like the accessibility of transit stations and the betweenness centrality of station areas.
Thus, by combining the different influences of built environment indicators on TOD traffic performance and their associations, 11 key indicators that influence TOD traffic performance were obtained from 56 factors. The four core indicators of TOD traffic performance are distance to the transit station, employment density, population density, and diversity of land use. Seven other important indicators are the number of bus stops/routes, walkability, development density, residential density, the density of street intersections, the area of retail facilities, and the livability of the community. These findings indicate that in the built environment of high-density rail station areas, TOD traffic performance can be promoted by improving the distance to transit stations, the diversity of land use, and the walkability. Additionally, strategies such as increasing the number of bus stops/routes, increasing the density of retail facilities, and the livability of the community can significantly boost TOD traffic performance. Furthermore, regarding the influences of the other 45 indicators on TOD traffic performance and their associations with the 11 core indicators, these indicators should be selectively applied according to specific features of the built environment to optimize traffic performance. For example, the density of open space, which was found to be positively correlated with some built environment indicators, such as the population density, the area of retail facilities, and the livability of the community, can promote the use of public transit, particularly in high-density environments where this indicator is more effective [31,32,33,34,35,36,37,38,39,40].

3.2.2. TOD Economic Performance and Its Influencing Factors

Figure 7 shows the economic performance indicators of TOD and the associations between their influencing factors, determined using SNA. The input indicators that influence TOD economic performance, from the strongest to the weakest impact, were found to be as follows: distance to the transit station, diversity of land use, development density, population density, and walkability. The following can be observed from Figure 7.
  • The distance to the transit station has the most significant direct impact on TOD economic performance, with its negative correlation with economic performance indicators (e.g., residential property values, land prices/rents, commercial property prices) confirmed in many empirical cases;
  • Second, other indicators that had a confirmed association with TOD economic performance in some empirical cases should also be used as a reference for performance optimization. These indicators include the following:
    • Residential property values are positively correlated with walkability, the density of street intersections, rental units, job accessibility, the area of parking spaces, and retail employment density, but are uncertainly correlated with population density in the station area [41]. In high-density environments, residential property values are positively correlated with population density, with a threshold present. Conversely, in low-density environments, they show a negative correlation [42].
    • Land prices and rental units are influenced by built environment factors such as the diversity of land use, accessibility of amenities, and walkability [41]. However, issues such as noise and pollution caused by an excessive diversity of land use can negatively impact property prices [43].
    • The economic vitality in station areas could be promoted by improving their employment density, closeness centrality, and betweenness centrality, as well as the closeness and betweenness centrality of the station area and the accessibility of the station space.
Four clusters were generated for the factors of TOD economic performance (31 input indicators) via cluster analysis, as shown in Figure 8. Appendix A Table A1 provides the statistics on the indicators and categories of the clustering variables of the key indicators of TOD economic performance. The results show that the clustering quality is in the “good” range. Clusters A (DCI: 17.00; DCO: 24.00) and B (DCI: 22.33; DCO: 6.00) have significant impacts on TOD economic performance. Cluster A represents the highest DCO of economic performance and a high DCI for factors influencing economic performance, while Cluster B represents a high DCO for economic performance and the highest DCI for factors affecting economic performance. One input indicator in Cluster A (3.2% of the total) is the distance to the transit station. Three input indicators in Cluster B (9.7% of the total) are the population density, diversity of land use, and employment density. Cluster C (DCI: 7.92; DCO: 2.17), which represents a medium DCO and medium DCI, includes 12 input indicators, such as development density and residential density. Cluster D (DCI: 1.53; DCO: 1.53), which represents a low DCO and low DCI, includes 15 input indicators, such as accessibility of amenities and accessibility of groceries.
Therefore, considering the differential influences of built environment indicators on TOD economic performance and the correlations between different built environment indicators, four key indicators—the distance to the transit station, the diversity of land use, population density, and employment density—have the most significant influences on TOD economic performance and should be the focus of optimization efforts in transit station areas. It is evident that in built environments around transit stations with a high population density, improving the pedestrian accessibility of the transit station and the diversity of land use can effectively ensure TOD economic performance. The impacts of the remaining 27 indicators on TOD economic performance and their correlations with the aforementioned four key indicators have been confirmed in some empirical case studies of TOD, providing experiential data for optimizing TOD economic performance. For instance, the area of retail facilities and the density of open space can not only directly enhance residential property values, but also positively correlate with population density and land use diversity [40].

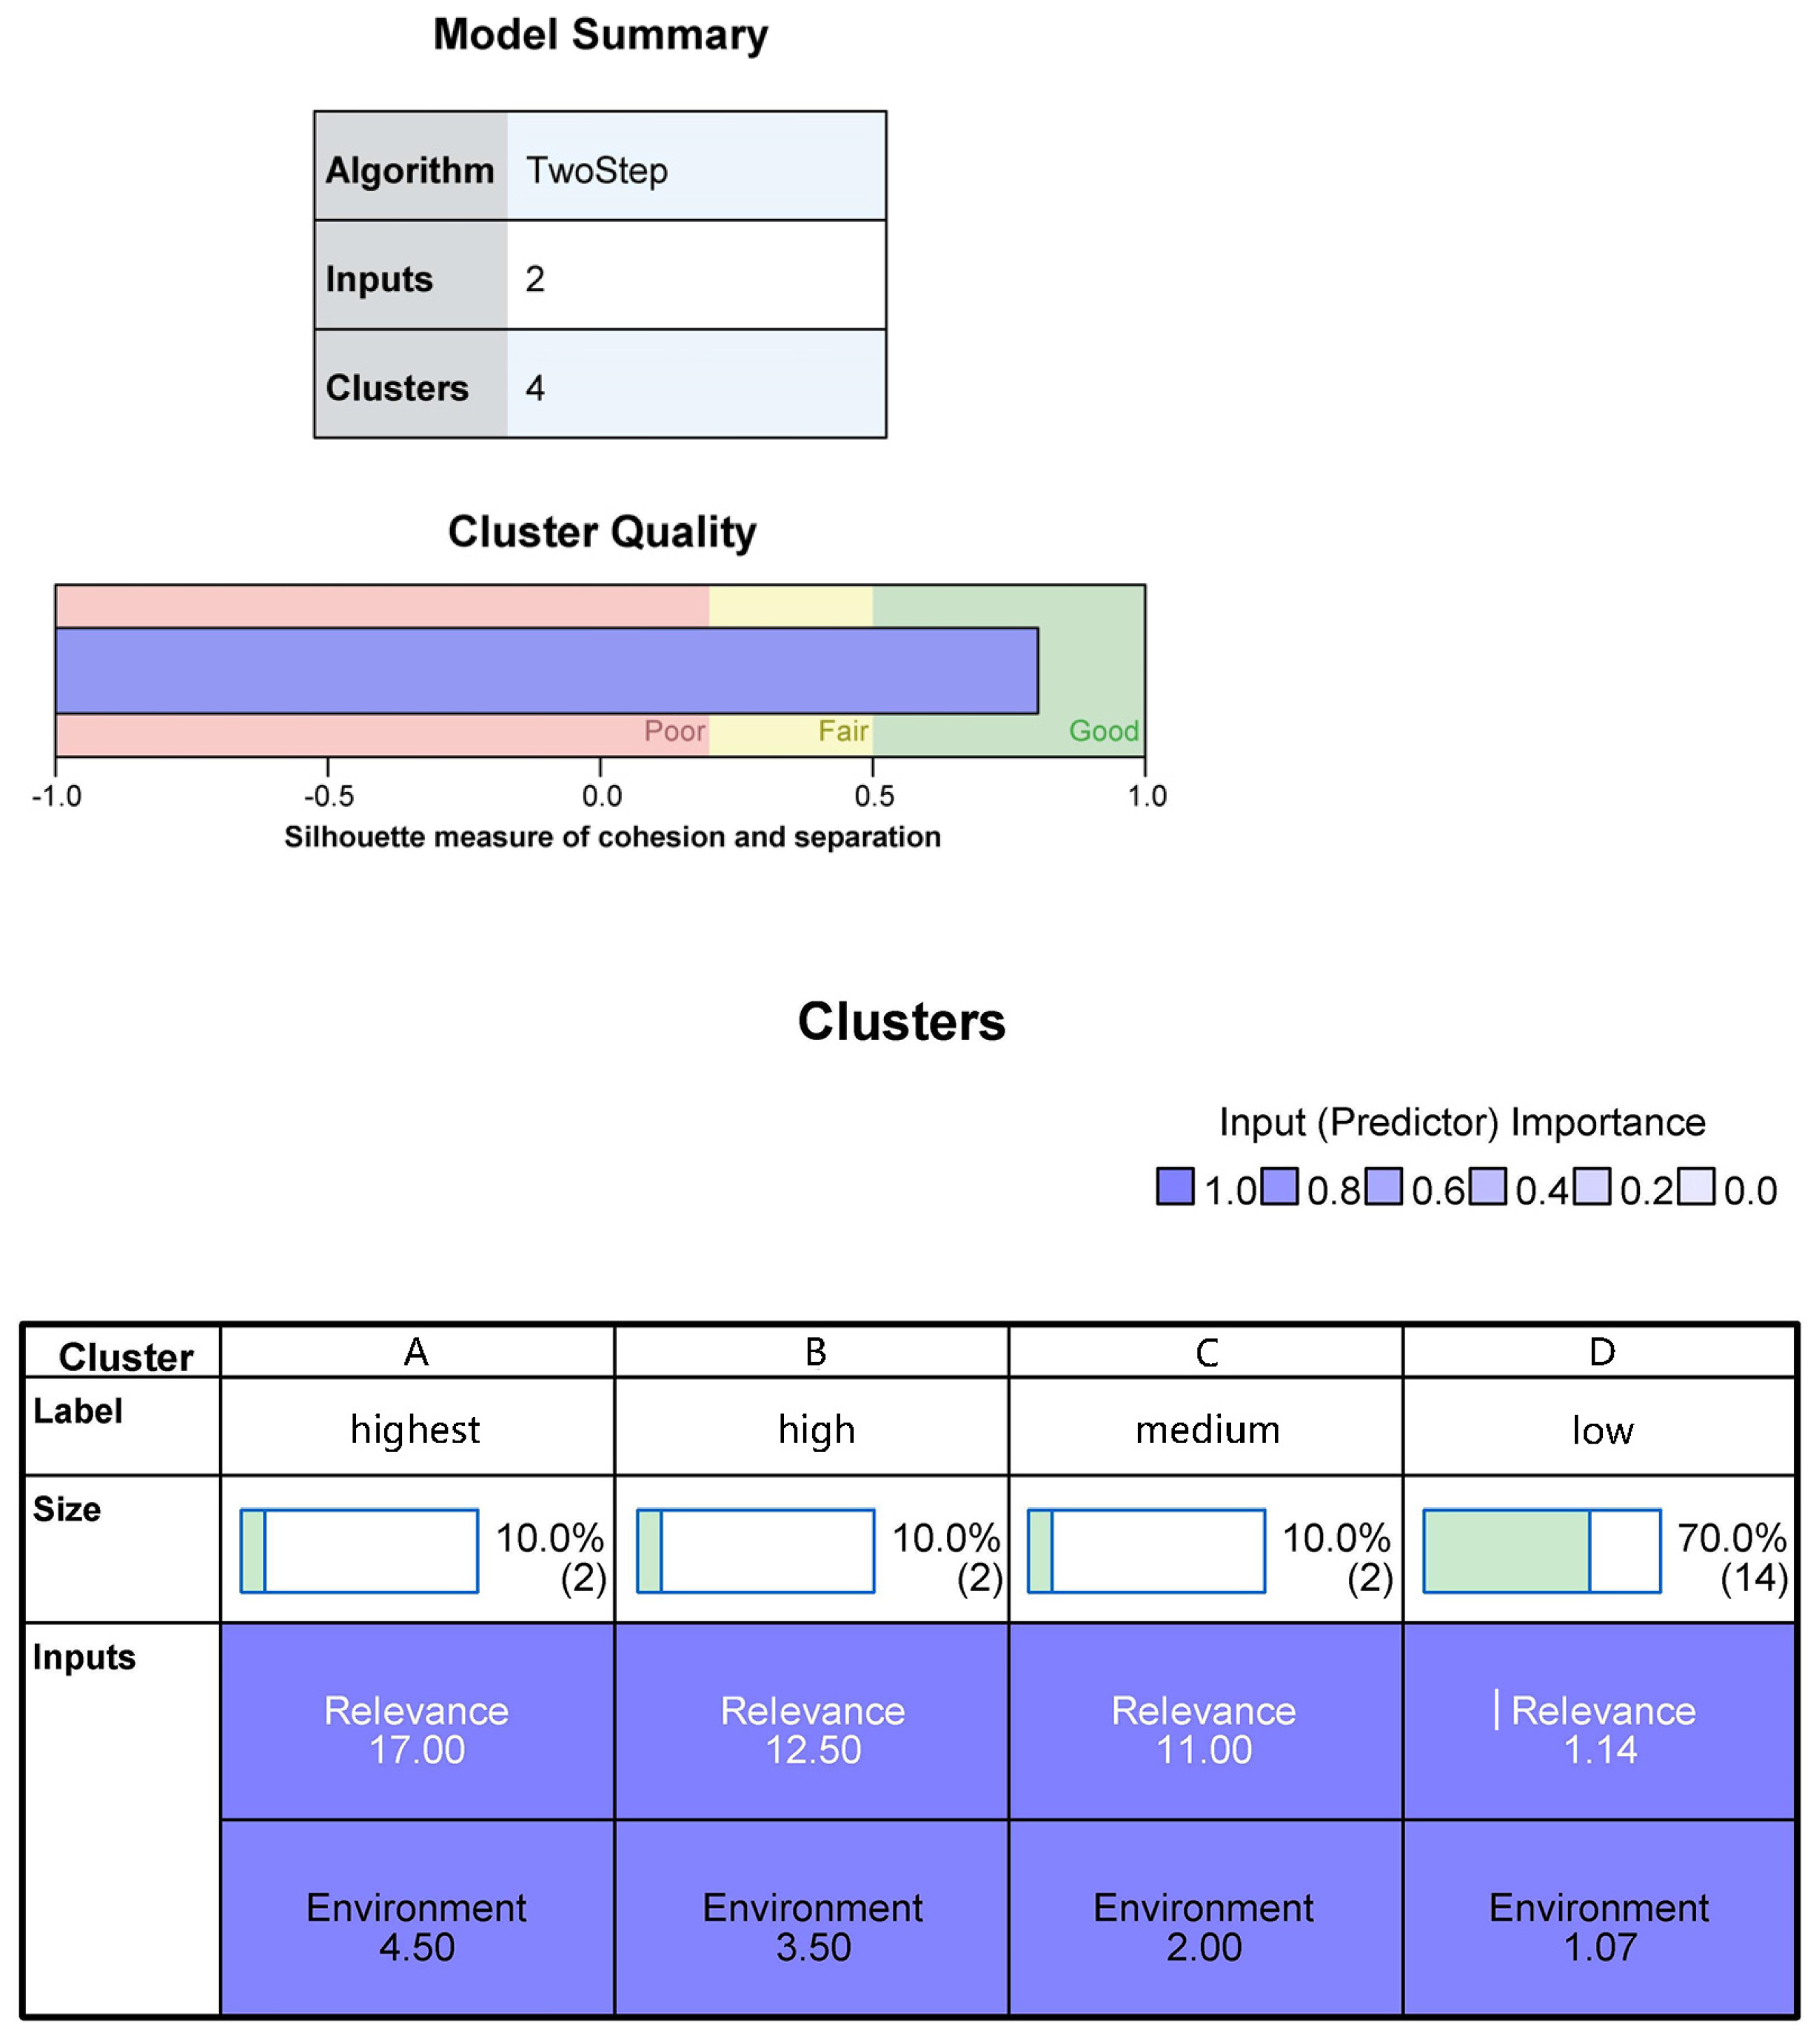
3.2.3. TOD Environmental Performance and Its Influencing Factors

Figure 9 exhibits the environmental performance indicators of TOD and the relationships among their influencing factors as determined using SNA. The figure demonstrates that studies on TOD environmental performance have extensively investigated the influences of the diversity of land use, development density, and population density, as evidenced by the following:
  • With increases in the diversity of land use and the population density, the environmental burden also intensifies, making it crucial to optimize the land use layout in station areas [44]. Furthermore, high population density development imposes high demands on the spatial environmental carrying capacity [40].
2.
Appropriate development density and diversity of land use can reduce dependence on private vehicles and increase transit use, thus reducing traffic congestion and greenhouse gas emissions [45]; however, development with a high density might lower livability and cause various externalities, such as crowded living and the excessive use of air-conditioning [46]. This principle applies to cities located in both Western and Asian regions.
3.
Optimizing the aesthetic characteristics of station area spaces, enhancing the quality of the walking environment, increasing the accessibility of groceries, and optimizing street design can improve residents’ satisfaction with the TOD environment.
4.
Vibrations and noise generated by the operation of TOD station areas can easily be transmitted to nearby buildings, becoming a major environmental issue that triggers resident complaints and severely affects their quality of life and health [47].
Four clusters were generated using the DCO and DOI indexes of the key indicators that impact TOD environmental performance (20 input indicators). A two-step cluster analysis was carried out, as shown in Figure 10. Appendix A Table A1 provides the statistics of the indicators and the categories of the clustering variables of the key indicators of TOD environmental performance. The results show that the clustering quality is in the “good” range. Clusters A (DCI: 17.00; DCO: 4.50) and B (DCI: 12.50; DCO: 3.50) have significant influences on TOD environmental performance. Cluster A represents the highest DCO of environmental performance and the highest DCI of factors influencing environmental performance, while Cluster B represents a high DCO of environmental performance and a high DCI of factors influencing environmental performance. The two input indicators in Cluster A (10% of the total) are the population density and diversity of land use. The two input indicators in Cluster B (10% of the total) are the development density and employment density. Cluster C (DCI: 11.00; DCO: 2.00), which represents a medium DCO and medium DCI, includes the residential density and the density of street intersections, and the remaining factors are assigned to a low DCO and low DCI.
Thus, the following findings were obtained by combining the correlations of built environment indicators and their influences on TOD environmental performance. First, two indicators (diversity of land use and population density) were found to be particularly important for the environmental role of TOD. These indicators not only have a direct impact on specific environmental performance indicators but also share close relationships with other factors. Cervero believes that reductions in carbon emissions and energy consumption can be achieved through improved land use and population density, as evidenced by examples such as Hammarby Sjöstad in Sweden and the Rieselfeld and Vauban districts in Freiburg, Germany [48]. Second, although the influences of two indicators (development density and employment density) on environmental performance have rarely been examined in the empirical literature, these factors should be a key focus for optimizing TOD environmental performance due to their strong associations with other variables. Tamakloe suggests that employment density is correlated with energy efficiency, the number of bus stops, and shared bicycle stations, indirectly influencing environmental efficiency [49]. Similarly, Appleyard argues that in stations with higher livability opportunities, employment density relates to lower carbon emissions, further impacting environmental performance [7].

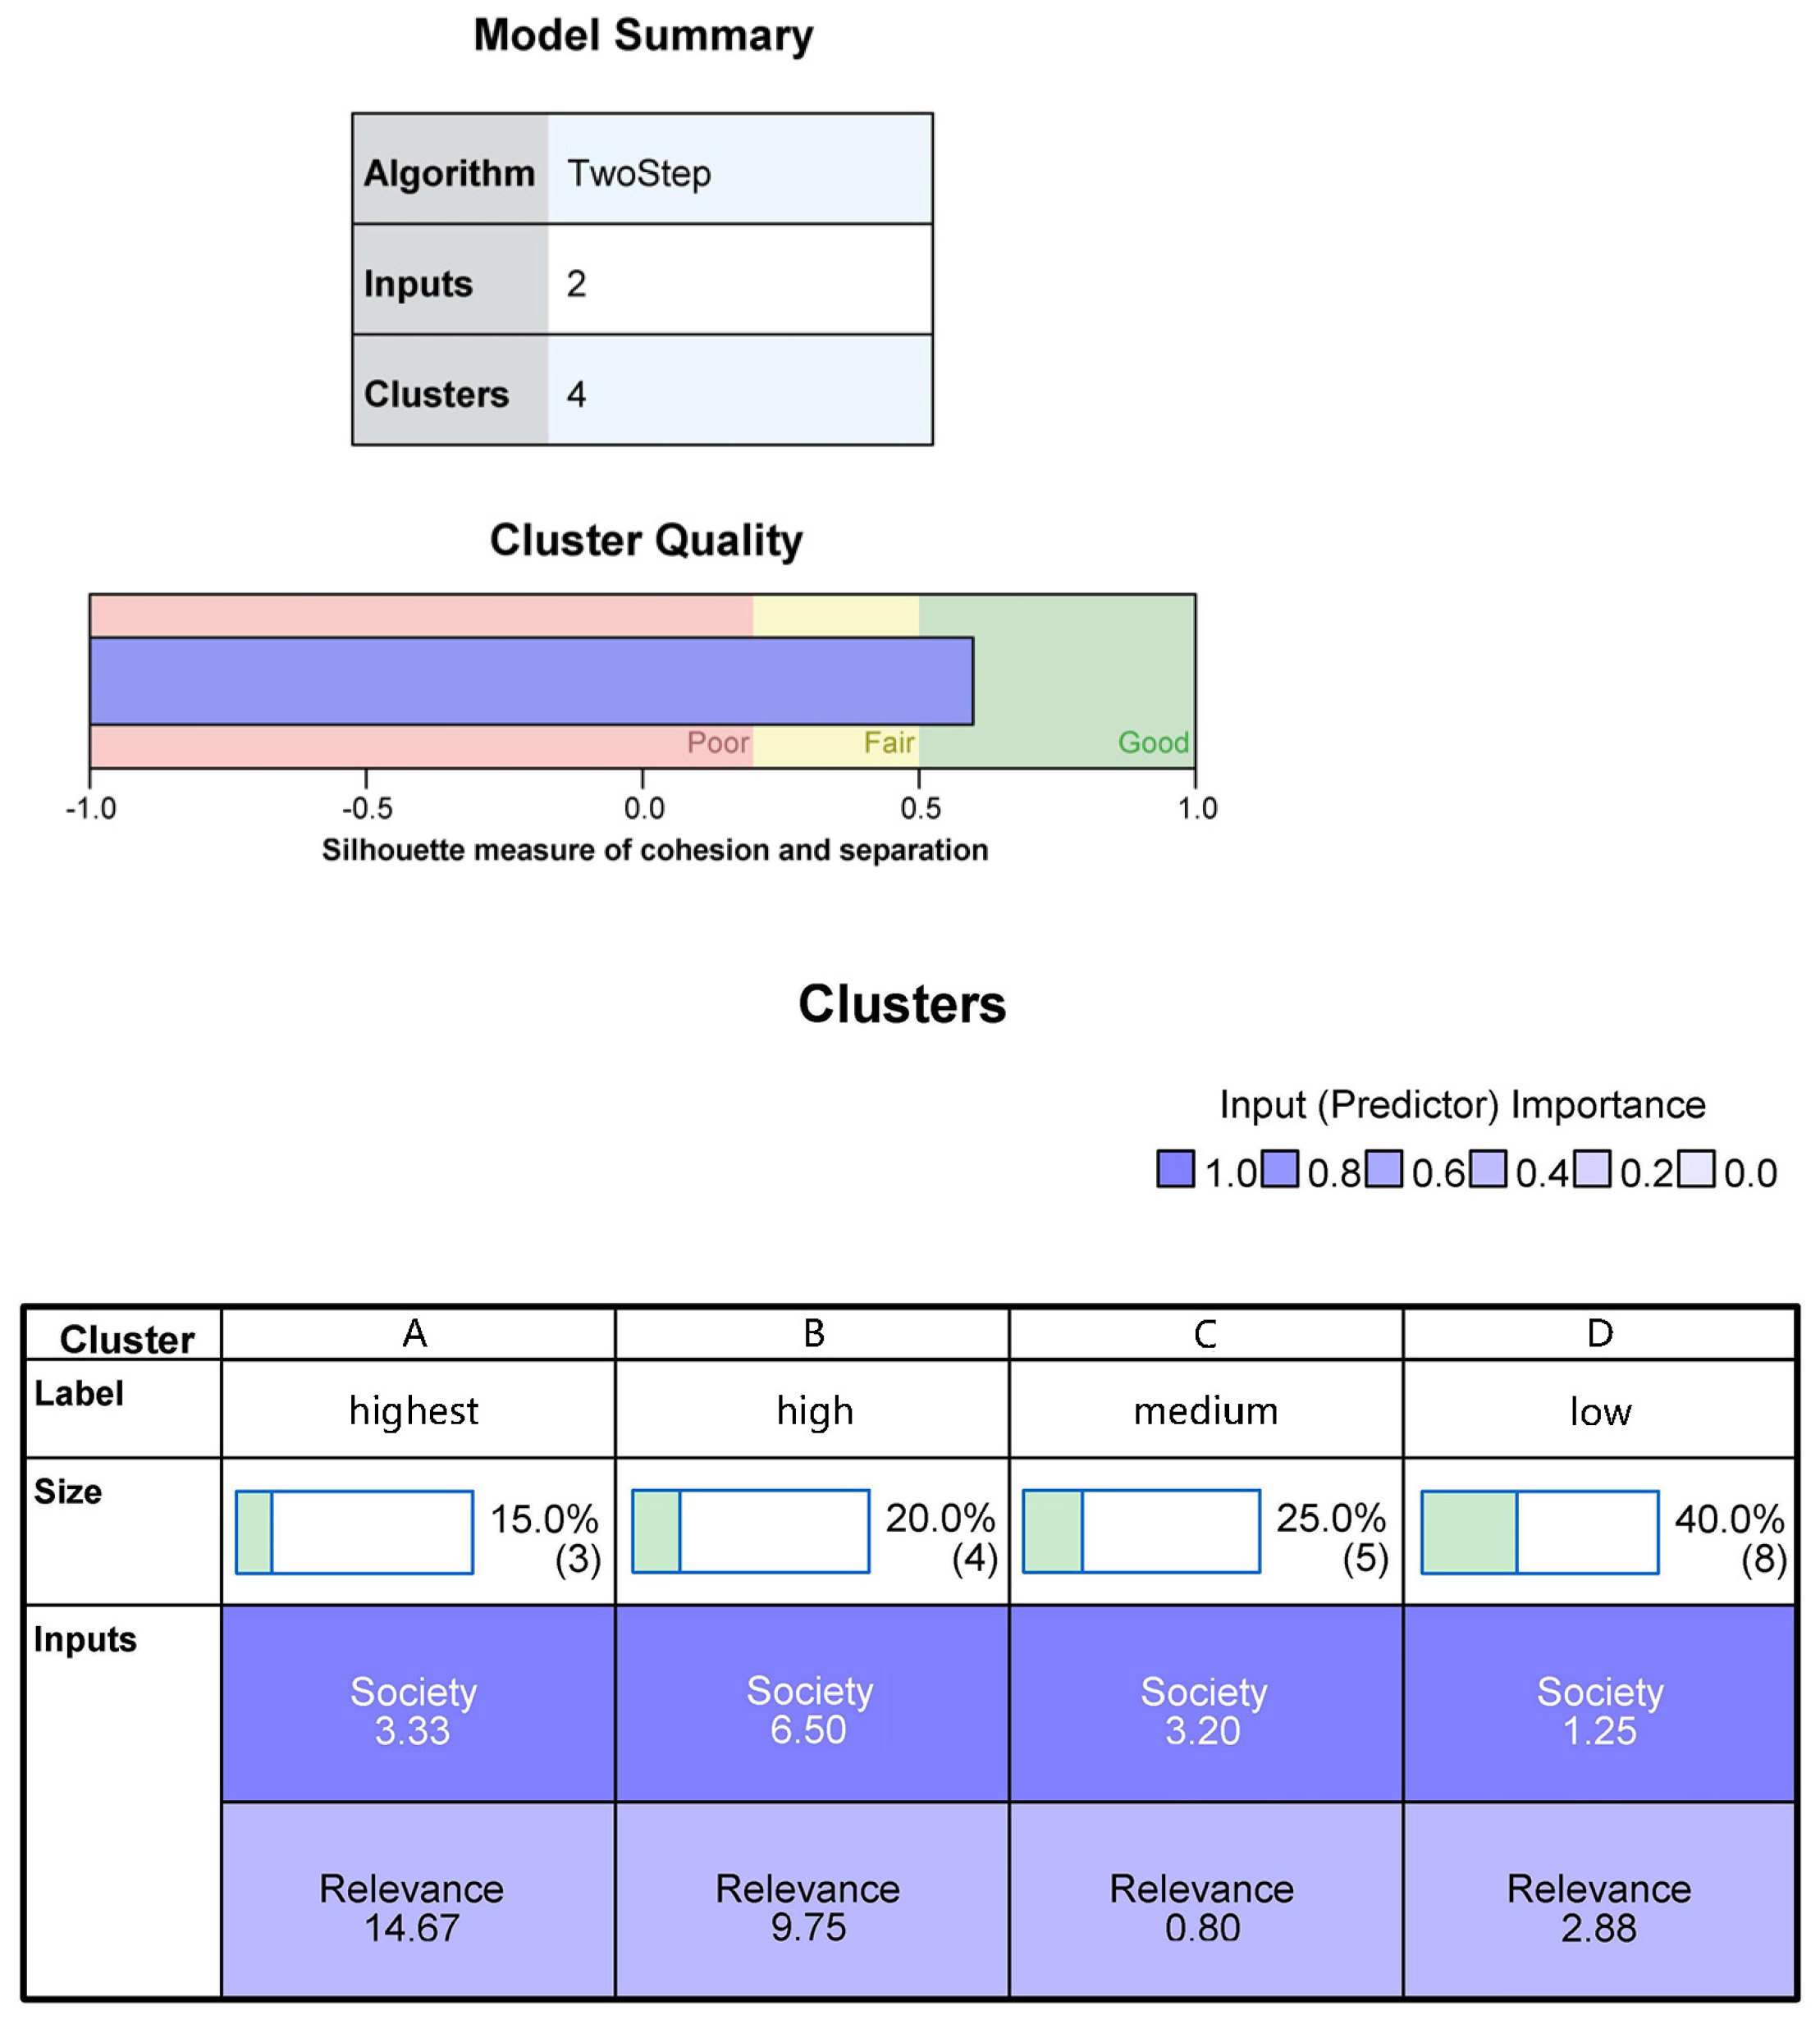
3.2.4. TOD Social Performance and Its Influencing Factors

Figure 11 shows the social performance indicators of TOD and the correlations among their influencing factors obtained using SNA. The figure demonstrates that there has been a significant amount of research on the influences of diverse land use, walkability, the distance to transit stations, development density, and accessibility of amenities on TOD social performance. Taking into account the findings of the existing studies, the following were determined.
  • The positive impacts of improving the distance to transit stations and access to amenities, groceries, and schools were found to be consistent in multiple studies.
  • Studies on other indicators of social performance and their influencing factors are rare; nonetheless, the existing findings provide basic empirical references for future research to optimize the social performance indicators of TOD.
Enhancing the distance to transit stations also promotes the use of public space, establishes connections with neighbors, enhances spatial safety, and advances social equity. However, high population density around transit stations is positively correlated with attractiveness to younger and highly educated individuals, thereby enhancing demographic diversity. Moreover, high residential density projects in transit station areas can stimulate vibrant street life [4]. On the other hand, high population density brings about various negative social influences, such as social segregation, whereby low-income groups may be isolated on the urban periphery and distant from quality resources and services, as well as strains on public resources, environmental pollution, and traffic congestion [50]. Additionally, TOD models promoting enhanced regional transit accessibility led to increased residential property values. This process, however, is accompanied by a “spatial squeeze-out” effect on low- and middle-income residents, resulting in residential spatial differentiation and socioeconomic stratification, thus increasing societal issues such as “housing–transport mismatch” [29].
Four clusters were generated using the DCO and DOI indexes for the key indicators that influence TOD social performance (20 input indicators). A two-step cluster analysis was carried out, as shown in Figure 12. Appendix A Table A1 provides the statistical data on the clustering variables and the classifications of the impact factors of TOD social performance. The results show that the clustering quality is in the “good” range. Clusters A (DCI: 14.67; DCO: 3.33) and B (DCI: 9.75; DCO: 6.50) have significant impacts on TOD social performance. Cluster A represents a high DCO of social performance and the highest DCI of factors influencing social performance, while Cluster B represents the highest DCO of social performance and a high DCI of factors influencing social performance. The three input indicators in Cluster A (15% of the total) are the population density, employment density, and residential density. The four input indicators in Cluster B (20% of the total) are walkability, the development density, distance to transit stations, and the diversity of land use. Cluster C (DCI: 0.80; DCO: 3.20), which represents a medium DCO and low DCI, includes accessibility of groceries and amenities, and the remaining eight factors are assigned to a low DCO and medium DCI.
Thus, by combining the different relationships among built environment indicators and their influence on TOD social performance with the features of different social indicators of the built environment, the following were determined.
  • Population density, employment density, and residential density are particularly crucial for TOD social performance. These indicators not only have direct impacts on specific social performance indicators, but also have close correlations with other influencing factors.
  • Walkability, the development density, the distance to transit stations, and the diversity of land use also significantly influence TOD social performance. These factors have notable correlations with TOD social performance indicators, thus confirming their impacts on specific aspects of TOD social performance.
  • The accessibility of groceries, amenities, and schools, as well as similar indicators, should be considered as reference points for optimizing TOD social performance due to their associative impacts on specific TOD social performance indicators.
In high-density built environments around transit stations, enhancing employment density, expanding residential density, and accommodating larger population densities can enhance TOD social performance. However, mitigation strategies, such as promoting walkability and managing distances to transit stations, are required to address the negative impacts of high-density environments. Furthermore, while research on the effects of residential choices on TOD social performance has been relatively extensive, there remains an inadequate exploration of aspects such as vibrant street life, connections with neighbors, public space utilization, and social equity within high-density environments around transit stations.

3.3. Factors of Comprehensive TOD Performance

We performed an automated, two-step cluster analysis using the degree of centrality and the DCOs of each input’s traffic, economic, environmental, and social performance as variables. The basic features of the cluster analysis are shown in Figure 13, indicating two types of factors (with a total of 59 elements) for comprehensive TOD performance. The statistics for the indicators and categories of the clustering variables of the key elements in comprehensive TOD performance are shown in Appendix A Table A1. The results show that the clustering quality was in the range of “good”. In Cluster A, the DCOs for traffic, economic, environmental, and social performance were 40.00, 5.50, 3.17, and 8.33, respectively, and the DCI was 20.67, representing high DCO and high DCI. In Cluster B, there were 53 elements (89.8% of the total input elements). The DCOs of traffic, economic, environmental, and social performance were 4.89, 0.55, 0.30, and 0.77, respectively, and the DCI was 3.92, representing low DCO and low DCI. In Cluster 1, the six input elements (10.2% of the total elements) were the distance to transit stations, diversity of land use, population density, walkability, employment density, and development density. Therefore, these six indicators should be the focus of TOD construction in rail station areas to optimize comprehensive performance. Not only has their effect on TOD performance been widely confirmed in related studies, but they have also demonstrated significant associations with other factors (Table 1).
Due to the associations among various key indicators of the built environment, a combination of multiple key indicators can exert a greater impact [26,27,31]. Thus, the built environment indicators that are directly associated with the six key indicators (e.g., distance to a rail station, diversity of land use, population density) should become a focus for TOD construction and performance optimization in rail station areas. The results of the clique and node categorization analysis for the six input indicators are shown in Figure 14, revealing the following:
  • First, among the 41 indicators and in addition to the “5D” dimension indicators, the 4 indicators that characterize the features of rail transit stations are the accessibility of the transit station, the distance to the CBD, the closeness centrality of the station, and the betweenness centrality of the station. These indicators were included and defined as “node characters”.
  • Second, node characters can better depict the location of rail stations in an urban space, their ranking among rail transport structures, and the spatial accessibility within local transportation networks and surrounding rail stations. They also exhibit associations with the “3D” dimension indicators (density, diversity, and design) and demonstrate the differences among rail stations in TOD construction.
  • Third, cross-dimensional, interdependent, and interactive associations were found to exist between the six key input indicators and the other indicators. Therefore, studying the influences of the input indicators in the “5D” dimensions and the node characters dimensions on TOD performance (traffic, economic, environmental, and social performance) and their associative characteristics can provide a more targeted theoretical basis for TOD construction and performance optimization in transit station areas.

4. Discussion

By sorting and categorizing the key indicators influencing the overall efficiency of TOD and the associated built environment indicators, the spatial characteristic indicators ensuring TOD performance were identified. Furthermore, Figure 14 reveals the correlations between various built environment indicators and the six key indicators, namely the distance to the transit station, diversity of land use, population density, walkability, employment density, and development density. The figure illustrates the synergistic relationships among built environment indicators. The analysis conclusions focus on the impacts of dimensions, such as diversity, density, design, and distance to transit stations and their correlations, providing practical verification support for enhancing TOD performance in transit station areas, while emphasizing that the following strategies are valid across different contexts.

4.1. Ensuring TOD Performance Through “Density” Strategies

The density strategy is the most crucial measure to ensure TOD performance. Within the density dimension, three key indicators—population density, employment density, and development density—influence TOD performance. Additionally, the density indicators have correlations with the other five dimensions, particularly with the distance to the transit station, the diversity of land use, and the accessibility of the transit station. Therefore, ensuring TOD performance should be based on density strategies validated by extensive practical cases. These include controlling the total development scale in station areas according to the characteristics of the transit stations and ensuring that they match the traffic-carrying capacity of the area; controlling the types and scales of development projects based on the accessibility of transit stations to enhance the overall benefits of land development; emphasizing the enhancement diversity of land use in high-density developments to improve the carrying capacity of high-density environments; and comprehensively considering the optimization of other construction conditions in station areas to ensure the social efficiency of TOD projects. For example, increasing the density of open space and public service facilities around high-density residential development projects, as well as optimizing and enhancing street connectivity and accessibility of amenities, could meet the needs of people and improve urban spatial safety [40].

4.2. Ensuring TOD Performance Through “Diversity” Strategies

The diversity dimension includes six indicators representing the diversity of the space and functional use at the station area level. Combining these indicators with the correlation characteristics of other built environment indicators can help form a diversity strategy to ensure TOD performance. In terms of transportation efficiency, higher diversity of land use supports high development density in areas near transit stations. Optimizing the walkability of station areas can promote more bidirectional traffic behaviors and non-peak public transportation behaviors [51]. Additionally, integrating and optimizing the diverse needs of residents with walkability (including distance to a transit station, the betweenness centrality of a station area, and the closeness centrality of a station) can promote the development and implementation of pedestrian-friendly cities [52]. In terms of economic efficiency, allocating commercial land that serves external needs around transit stations facilitates concentrated economic development and enhances economic vitality [6]. In terms of environmental efficiency, the diversity of land use is highly correlated with energy consumption and carbon emissions, and proactive measures should be taken to address the associated noise, pollution, congestion, and crime issues [42]. In terms of social efficiency, enhancing the diversity of land use could not only meet the needs of people but may also increase the vibrancy of urban street spaces [48].

4.3. Ensuring TOD Performance Through “Design” Strategies

The design dimension includes 17 indicators, with walkability being a key indicator influencing overall TOD performance. The density of street intersections, the livability of the community, and street connectivity are critical to TOD traffic performance. High development density and diverse land use must be combined with good design conditions to create pedestrian-oriented spaces and livable station area environments, which are essential for enhancing TOD performance. The optimization of street connectivity can improve the closeness centrality and betweenness centrality of station areas, thus enhancing the accessibility and convenience of pedestrian traffic. Moreover, reducing the density of vehicle main roads and increasing the density of open spaces, the total length of minor roads, the density of street intersections, and pedestrian facilities could improve the pedestrian environment and promote more walking behavior. Effective parking-space planning requires the balance of parking convenience and the promotion of transit use [27]. Parking spaces should not interfere with pedestrian activities, thus promoting walking and public transit use, energy consumption, energy efficiency, and improved urban environmental quality [27]. Meeting the diverse needs of residents by providing a variety of public spaces and pedestrian facilities can enhance community livability and social cohesion, thereby increasing community vitality and inclusiveness. Meanwhile, “design” strategies should take into account diverse land uses and varying land values in different development areas. In regions where land values are high or increasing, a forward-looking approach is necessary to avoid a mismatch with market demand that could result in resource waste.

4.4. Ensuring TOD Performance Through “Distance to Transit” Strategies

The dimension of the distance to transit includes the indicators of the distance to the transit station and the number of bus stops/routes, which reflect the accessibility of transit stations and the convenience of transfers to other forms of public transportation, which are crucial for TOD performance. The distance to the transit station is a key indicator affecting overall TOD performance, while the number of bus stops/routes significantly influences TOD traffic performance. Therefore, high-density commercial and office development projects should be located near transit stations to ensure high accessibility. Transportation interchange should also be arranged in high-density areas. Improving the quality of the walking environment, increasing the density of street intersections, and raising the proportion of minor roads for walking can further enhance the walkability and pedestrian-friendliness of these areas. These strategies can help form an efficient green transportation system, with high accessibility in high-density areas, ensuring enhanced TOD performance.
Furthermore, although there are no key indicators affecting TOD performance in the dimensions of the node characters and destination accessibility, the close correlations with the six key indicators indicate that these dimensions should also be considered for ensuring TOD performance. For instance, indicators in the dimension of the node characters reflect the accessibility characteristics of transit stations at the macro and regional levels. High development density in transit station areas requires conditions related to the accessibility of the transit station [53]. In high-density environments around transit stations, the enhancement of the spatial accessibility of transit stations in the surrounding traffic network, including by improving their closeness and betweenness centrality, also supports the implementation of density strategies and diversity of land use strategies. Additionally, workplaces providing jobs should be arranged around transit stations, and their walkability to transit stations should be emphasized. Functional land-serving TOD communities should be laid out based on walkability and integrated with public spaces to create a livable community environment.

5. Conclusions

The TOD model has had positive impacts on urban areas in various ways and has been adopted globally. This article systematically reviewed and synthesized the influencing factors of TOD performance and the associated characteristics mentioned in the relevant literature and empirical studies.
First, there are significant differences among the impacts of various built environment indicators on TOD performance indicators, while the same indicator can exert different influences on different aspects of TOD performance. Six key indicators—the distance to transit stations, diversity of land use, employment density, population density, development density, and walkability—generally apply to the overall performance of TOD (traffic, economic, environmental, and social). Meanwhile, directly related built environment indicators that promote TOD performance were identified and found to include 41 important indicators across six dimensions.
Second, interdependent and interactive relationships are present among the built environment indicators. Thus, built environment indicators should be coordinated to ensure the performance of TOD. Future TOD strategies should focus on leveraging these synergies by integrating built environment factors holistically to foster mutually reinforcing benefits.
Lastly, design strategies established by six key input indicators and their associated input elements could effectively improve TOD performance across different contexts. In particular, common patterns summarized in the dimensions of density, diversity, design, and distance to transit are more impactful.
This finding could provide theoretical support and practical guidance for policymakers, urban designers, and planners, particularly in areas such as the integrated planning of transportation and land use, enhancing the attractiveness of public transit systems, and optimizing urban spatial structures. This study shows how to optimize the combination of built environment indicators to maximize the benefits of TOD. However, it may still be challenging to fully reveal the relationships between the built environment and TOD indicators by overcoming the limitations of the existing research and the differences in the approaches to TOD performance. Therefore, in addition to focusing on the 41 indicators across six dimensions and their correlations summarized in this study, built environment indicators with targeted impacts on specific TOD performance indicators that have not been thoroughly explored should also be considered reference data for TOD construction. Future research should explore the more specific indicators in TOD performance in different urban contexts, geographical conditions, and socio-economic factors, focusing on specific control criteria and design methods for key indicators.

Author Contributions

Conceptualization, Z.X. and Y.Z.; methodology, Z.X. and Y.Z.; software, Z.X. and H.C.; validation, Z.X., W.F, and Y.Z.; formal analysis, Z.W, H.C. and Y.Z.; resources, Z.X. and W.F.; data curation, Z.X. and W.F.; writing—original draft preparation, Z.X. and W.F.; writing—review and editing, Z.X., W.F. and Y.Z.; visualization, H.C.; supervision, Z.X. and Y.Z.; project administration, Z.X. and Y.Z.; funding acquisition, Z.X. All authors have read and agreed to the published version of the manuscript.

Funding

This research was funded by Natural Science Foundation of Jiangsu Province (BK20211315) and the Humanities and Social Science Project of the Ministry of Education (18YJCZH195).

Institutional Review Board Statement

Not applicable.

Informed Consent Statement

Not applicable.

Data Availability Statement

The original contributions presented in the study are included in the article, further inquiries can be directed to the author.

Conflicts of Interest

The authors declare no conflicts of interest.

Appendix A

Table A1. Clustering variable indicators and classification of TOD performance influencing factors.
TrafficEconomicEnvironmentSocialOverall
DCIDCOCLDCIDCOCLDCIDCOCLDCIDCOCLDCICL
Residential density1411B111C92C93A14B
Development density1617B134C104B125B16A
Building coverage ratio03D 01D 0B
Population density3254A284B174A224A33A
Employment density2247A193B103B133A22A
Area of retail facilities1313B102C 71D13B
Retail employment density25D23D11D22D2B
Density of business51C 31D 5B
Average area of building complexes41C 4B
Job accessibility310D22D 21D3B
Residential accessibility16D 1B
Accessibility of bus stops01D01D01D 0B
Visibility of destination02D 0B
Accessibility of groceries114D01D01D03C1B
Accessibility of amenities26D13D 14C2B
Accessibility of schools24D12D11D13C2B
Accessibility of public safety facilities 3B
Vertical mixed use16D 01D 1B
Diversity of land use2550A2011B135A148B25A
Rental units11D11D 1B
Residential land use61C31D 6B
Commercial land use72C41D 7B
Industrial land use52C 5B
Mixed-use land use43C 4B
Area of service facilities11D01D 1B
Mix of housing types 03C1B
Balance between residence and employment53C 5B
Mixed income11D 01D1B
Educational land use01D 0B
Walkability1029B54C21D17B11A
Cyclability010D 01D 0B
Average block size06D01D01D 0B
Density of street intersections1529B122C 15B
Street connectivity77C 11D7B
Density of open spaces41C32D11D23C5B
Density of cul-de-sacs25D 2B
Sidewalk maintenance 1B
Width of pedestrian sidewalks25D 2B
Area of pedestrian sidewalks54C51C 6B
Parking spaces38D12D11D 3B
Closeness centrality of station areas61C61C 6B
Betweenness centrality of station areas71C71C 7B
Design of bus stops22D 2B
Livability of communities161B 17B
Aesthetics03D 02D 0B
Total road length76C52C21D 7B
Total length of minor roads15D11D 1B
Total length of major roads13D 1B
Street design/geometry24D 2B
Pedestrian shelters02D 01D0B
Pedestrian facilities35D 3B
Interchange station01D 0B
Closeness centrality of stations41C41D 4B
Betweenness centrality of stations72C71C 7B
Distance to CBD88C85C 51D8B
Accessibility of transit stations112C 62D11B
Distance to transit stations1743A1724A102C126B17A
Efficiency of transfer116D 1B
Number of bus stops/routes823B62C 8B
Note: DCI stands for Degree Centrality within Inputs, DCO stands for Degree Centrality within Outputs, CL stands for Cluster Classification. A, B, C, and D stand for Cluster A, B, C and D, respectively, in cluster analysis.

Appendix B

(1)
The total distance traveled by a vehicle within a certain period of time is referred to as vehicle miles traveled (VMT). In different literature, the measured indicator is vehicle kilometers traveled (VKT). In this article, we categorized them as VMT.
(2)
In reviewing the literature, we found that some indicators, such as population density, development density, and balance between residence and employment, are two-way indicators: they not only depict the conditions of the area for TOD construction but also reflect TOD performance. For the sake of simplification, they were treated as input indicators.
(3)
In Figure 2 and Figure 3, the size of each dot represents the total frequency with which the correlation between this indicator and other indicators has been confirmed in the relevant literature. Moreover, the thickness of each line represents the total frequency with which the correlation between the two connected indicators has been confirmed in the relevant literature, without considering the correlations between non-key indicators.
(4)
In different studies, transport was categorized into public transport (bus + rail transit), rail transport, sustainable transport (non-motorized travel, i.e., bus + rail transport + walking/cycling), motor vehicle travel and so on. For our research needs, we included the impact of rail transit use in “public transport”.
(5)
In many studies, the effect of TOD inputs on walking and cycling was combined in discussions; for the sake of simplification, the present study included the impact of walking activities in “walking/cycling”.
(6)
In Figure 5, Figure 7, Figure 9, and Figure 11, the dot size represents the total frequency with which the correlations between the performance indicator and factors which influence it have been verified in the extant research, and the line thickness represents the total frequency with which the relationship between the two connecting indicators has been verified.

References

  1. Calthorpe, P. The Next American Metropolis: Ecology, Community, and the American Dream; Princeton Architectural Press: Hudson, NY, USA, 1993; ISBN 9781878271686. [Google Scholar]
  2. Cervero, R. Transit-oriented development in the US: Contemporary practices, impacts and policy directions. In Incentives, Regulations and Plans: The Role of States and Nation-States in Smart Growth Planning; Knaap, G.-J., Haccoû, H.A., Eds.; Edward Elgar Publishing: Cheltenham, UK, 2007; pp. 149–167. [Google Scholar]
  3. Sun, Z.; Allan, A.; Zou, X.; Scrafton, D. Scientometric Analysis and Mapping of Transit-Oriented Development Studies. Plan. Pract. Res. 2022, 37, 35–60. [Google Scholar] [CrossRef]
  4. Alquhtani, S.; Anjomani, A. Do Rail Transit Stations Affect the Population Density Changes around Them? The Case of Dallas-Fort Worth Metropolitan Area. Sustainability 2021, 13, 3355. [Google Scholar] [CrossRef]
  5. Rao, F.; Pafka, E. Shopping Morphologies of Urban Transit Station Areas: A Comparative Study of Central City Station Catchments in Toronto, San Francisco, and Melbourne. J. Transp. Geogr. 2021, 96, 103156. [Google Scholar] [CrossRef]
  6. Zandiatashbar, A.; Hamidi, S.; Foster, N.; Park, K. The Missing Link between Place and Productivity? The Impact of Transit-Oriented Development on the Knowledge and Creative Economy. J. Plan. Educ. Res. 2019, 39, 429–441. [Google Scholar] [CrossRef]
  7. Appleyard, B.S.; Frost, A.R.; Allen, C. Are All Transit Stations Equal and Equitable? Calculating Sustainability, Livability, Health, & Equity Performance of Smart Growth & Transit-Oriented-Development (TOD). J. Transp. Health 2019, 14, 100584. [Google Scholar]
  8. Li, C.-N.; Lin, C.; Hsieh, T.-K. TOD District Planning Based on Residents’ Perspectives. ISPRS Int. J. Geo-Inf. 2016, 5, 52. [Google Scholar] [CrossRef]
  9. Nasri, A.; Carrion, C.; Zhang, L.; Baghaei, B. Using Propensity Score Matching Technique to Address Self-Selection in Transit-Oriented Development (TOD) Areas. Transportation 2020, 47, 359–371. [Google Scholar] [CrossRef]
  10. Kamruzzaman, M.; Wood, L.; Hine, J.; Currie, G.; Giles-Corti, B.; Turrell, G. Patterns of Social Capital Associated with Transit Oriented Development. J. Transp. Geogr. 2014, 35, 144–155. [Google Scholar] [CrossRef]
  11. Xia, Z.; Zhang, Y. From “5D” to “5D+N”: Research Published in English on the Factors Influencing TOD Performance. Urban Plan. Int. 2019, 34, 109–116. [Google Scholar] [CrossRef]
  12. Xia, Z.; Zhang, Y.; Xu, L. Influencing Factors and Improvement Strategies of TOD Performance in Rail Transit Station Area. Planners 2019, 35, 5–12. [Google Scholar]
  13. Zemp, S.; Stauffacher, M.; Lang, D.J.; Scholz, R.W. Classifying Railway Stations for Strategic Transport and Land Use Planning: Context Matters! J. Transp. Geogr. 2011, 19, 670–679. [Google Scholar] [CrossRef]
  14. Kamruzzaman, M.; Baker, D.; Washington, S.; Turrell, G. Advance Transit Oriented Development Typology: Case Study in Brisbane, Australia. J. Transp. Geogr. 2014, 34, 54–70. [Google Scholar] [CrossRef]
  15. Timmermans, H. Transit-oriented urban environments reduce travel–a fairytale? In Incentives, Regulations and Plans: The Role of States and Nation-States in Smart Growth Planning; Knaap, G.-J., Haccoû, H.A., Eds.; Edward Elgar Publishing: Cheltenham, UK, 2007; pp. 168–189. [Google Scholar]
  16. Zhang, Y.; Song, R.; van Nes, R.; He, S.; Yin, W. Identifying Urban Structure Based on Transit-Oriented Development. Sustainability 2019, 11, 7241. [Google Scholar] [CrossRef]
  17. Akbari, S.; Mahmoud, M.S.; Shalaby, A.; Habib, K.M.N. Empirical Models of Transit Demand with Walk Access/Egress for Planning Transit Oriented Developments around Commuter Rail Stations in the Greater Toronto and Hamilton Area. J. Transp. Geogr. 2018, 68, 1–8. [Google Scholar] [CrossRef]
  18. Nasri, A.; Zhang, L. The Analysis of Transit-Oriented Development (TOD) in Washington, D.C. and Baltimore Metropolitan Areas. Transp. Policy 2014, 32, 172–179. [Google Scholar] [CrossRef]
  19. Yin, P.; Cheng, J.; Peng, M. Analyzing the Passenger Flow of Urban Rail Transit Stations by Using Entropy Weight-Grey Correlation Model: A Case Study of Shanghai in China. Mathematics 2022, 10, 3506. [Google Scholar] [CrossRef]
  20. Cervero, R.; Kockelman, K. Travel Demand and the 3Ds: Density, Diversity, and Design. Transport. Res. Part D-Transport. Environ. 1997, 2, 199–219. [Google Scholar] [CrossRef]
  21. Cervero, R.; Sarmiento, O.L.; Jacoby, E.; Gomez, L.F.; Neiman, A. Influences of Built Environments on Walking and Cycling: Lessons from Bogotá. Int. J. Sustain. Transp. 2009, 3, 203–226. [Google Scholar] [CrossRef]
  22. Lyu, G.; Bertolini, L.; Pfeffer, K. Developing a TOD Typology for Beijing Metro Station Areas. J. Transp. Geogr. 2016, 55, 40–50. [Google Scholar] [CrossRef]
  23. Cervero, R. Transit-Oriented Development in the United States: Experiences, Challenges, and Prospects; Transportation Research Board: Washington, DC, USA, 2004; Volume 102. [Google Scholar]
  24. Ewing, R.; Cervero, R. Travel and the Built Environment, Journal of the American Planning Association. J. Am. Plan. Assoc. 2010, 3, 265–294. [Google Scholar] [CrossRef]
  25. Monajem, S.; Ekram Nosratian, F. The Evaluation of the Spatial Integration of Station Areas via the Node Place Model; an Application to Subway Station Areas in Tehran. Transport. Res. Part D-Transport. Environ. 2015, 40, 14–27. [Google Scholar] [CrossRef]
  26. Xia, J.; Zhang, Y. Where Are Potential Areas for Transit-Oriented Development (TOD)—Exploring the Demands for Built Environment for TOD Planning. Sustainability 2022, 14, 8364. [Google Scholar] [CrossRef]
  27. Cervero, R. Linking Urban Transport and Land Use in Developing Countries. J. Transp. Land Use 2013, 6, 7–24. [Google Scholar] [CrossRef]
  28. Yu, B.; Cui, X.; Liu, R.; Luo, P.; Tian, F.; Yang, T. Intergenerational Differences in the Urban Vibrancy of TOD: Impacts of the Built Environment on the Activities of Different Age Groups. Front. Public Health 2022, 10, 994835. [Google Scholar] [CrossRef]
  29. Ke, L.; Furuya, K.; Luo, S. Case Comparison of Typical Transit-Oriented-Development Stations in Tokyo District in the Context of Sustainability: Spatial Visualization Analysis Based on FAHP and GIS. Sust. Cities Soc. 2021, 68, 102788. [Google Scholar] [CrossRef]
  30. Uddin, M.A.; Hoque, M.S. A Framework to Measure Transit-Oriented Development around Transit Nodes: Case Study of a Mass Rapid Transit System in Dhaka, Bangladesh. PLoS ONE 2023, 18, e0280275. [Google Scholar] [CrossRef]
  31. Xiao, L.; Lo, S.; Liu, J.; Zhou, J.; Li, Q. Nonlinear and Synergistic Effects of TOD on Urban Vibrancy: Applying Local Explanations for Gradient Boosting Decision Tree. Sust. Cities Soc. 2021, 72, 103063. [Google Scholar] [CrossRef]
  32. Dietzenbacher, E.; Velázquez, E. Virtual Water and Water Trade in Andalusia. A Study by Means of an Input-Output Model. Reg. Stud. 2004, 27, 697–711. [Google Scholar]
  33. Higgins, C.D.; Kanaroglou, P.S. A Latent Class Method for Classifying and Evaluating the Performance of Station Area Transit-Oriented Development in the Toronto Region. J. Transp. Geogr. 2016, 52, 61–72. [Google Scholar] [CrossRef]
  34. Otte, E.; Rousseau, R. Social Network Analysis: A Powerful Strategy, also for the Information Sciences. J. Inf. Sci. 2002, 28, 441–453. [Google Scholar] [CrossRef]
  35. Kim, Y.; Choi, T.Y.; Yan, T.; Dooley, K. Structural Investigation of Supply Networks: A Social Network Analysis Approach. J. Oper. Manag. 2011, 29, 194–211. [Google Scholar] [CrossRef]
  36. Chiu, T.; Fang, D.; Chen, J.; Wang, Y.; Jeris, C. A Robust and Scalable Clustering Algorithm for Mixed Type Attributes in Large Database Environment. In Proceedings of the Seventh ACM SIGKDD International Conference on Knowledge Discovery and Data Mining, New York, NY, USA, 26 August 2001. [Google Scholar]
  37. Phani Kumar, P.; Ravi Sekhar, C.; Parida, M. Identification of Neighborhood Typology for Potential Transit-Oriented Development. Transport. Res. Part D-Transport. Environ. 2020, 78, 102186. [Google Scholar] [CrossRef]
  38. Zhang, Q.; Zhang, Y.-J.; Ding, X.; Wang, Q.-P. Correlations between Distribution of Producer Services and Urban Built Environment in Metro Station Areas: A Case of Xi’an, China. Adv. Civ. Eng. 2022, 2022, 6165563. [Google Scholar] [CrossRef]
  39. Qiang, D.; Zhang, L.; Huang, X. Quantitative Evaluation of TOD Performance Based on Multi-Source Data: A Case Study of Shanghai. Front. Public Health 2022, 10, 820694. [Google Scholar] [CrossRef]
  40. Wey, W.-M.; Zhang, H.; Chang, Y.-J. Alternative Transit-Oriented Development Evaluation in Sustainable Built Environment Planning. Habitat Int. 2016, 55, 109–123. [Google Scholar] [CrossRef]
  41. Jiang, Y.; Gu, P.; Cao, Z.; Chen, Y. Impact of Transit-Oriented Development on Residential Property Values around Urban Rail Stations. Transp. Res. Record 2020, 2674, 362–372. [Google Scholar] [CrossRef]
  42. Mathur, S. Impact of Transit Stations on House Prices across Entire Price Spectrum: A Quantile Regression Approach. Land Use Pol. 2020, 99, 104828. [Google Scholar] [CrossRef]
  43. Zhai, Z.; Yao, M.; Li, Y. Evaluation of Land-Use Layout of the Rail Station Area Based on the Difference in Noise Sensitivity to Rail Transit, Taking a Suburb of Tokyo as an Example. Sustainability 2022, 14, 7553. [Google Scholar] [CrossRef]
  44. Dong, S.; Wang, Y.; Dou, M.; Gu, Y.; Zhang, P.; Gong, J. A Multi-objective Land Use Design Framework with Geo-Big Data for Station-Level Transit-Oriented Development Planning. Int. J. Geo-Inf. 2022, 11, 364. [Google Scholar] [CrossRef]
  45. Irsal, R.M.; Hasibuan, H.S.; Azwar, S.A. Spatial Modeling for Residential Optimization in Dukuh Atas Transit-Oriented Development (TOD) Area, Jakarta, Indonesia. Sustainability 2022, 15, 530. [Google Scholar] [CrossRef]
  46. Chow, A.S.Y. Urban Design, Transport Sustainability and Residents’ Perceived Sustainability: A Case Study of Transit-Oriented Development in Hong Kong. J. Comp. Asian Dev. 2014, 13, 73–104. [Google Scholar] [CrossRef]
  47. Liu, Q.; Kang, Z.; Zhang, H.; Song, R.; Li, G. A Case Study on Annoyance Noise Caused by Metro Railway at a TOD Developed Depot. Adv. Civ. Eng. 2022, 2022, 3173567. [Google Scholar] [CrossRef]
  48. Cervero, R.; Sullivan, C. Green TODs: Marrying Transit-Oriented Development and Green Urbanism. Int. J. Sustain. Dev. World Ecol. 2011, 18, 210–218. [Google Scholar] [CrossRef]
  49. Tamakloe, R.; Hong, J.; Tak, J. Determinants of Transit-Oriented Development Efficiency Focusing on an Integrated Subway, Bus and Shared-Bicycle System: Application of Simar-Wilson’s Two-Stage Approach. Cities 2021, 108, 102988. [Google Scholar] [CrossRef]
  50. Ali, L.; Nawaz, A.; Iqbal, S.; Aamir Basheer, M.; Hameed, J.; Albasher, G.; Shah, S.A.R.; Bai, Y. Dynamics of Transit Oriented Development, Role of Greenhouse Gases and Urban Environment: A Study for Management and Policy. Sustainability 2021, 13, 2536. [Google Scholar] [CrossRef]
  51. Chorus, P.; Bertolini, L. Developing Transit-Oriented Corridors: Insights from Tokyo. Int. J. Sustain. Transp. 2016, 10, 86–95. [Google Scholar] [CrossRef]
  52. Chan, H.-Y.; Ip, L.-C.; Mansoor, U.; Chen, A. Pedestrian Route Choice with Respect to New Lift-Only Entrances to Underground Space: Case Study of a Metro Station Area in Hilly Terrain in Hong Kong. Tunn. Undergr. Space Technol. 2022, 129, 104678. [Google Scholar] [CrossRef]
  53. Li, D.; Zang, H.; Yu, D.; He, Q.; Huang, X. Study on the Influence Mechanism and Space Distribution Characteristics of Rail Transit Station Area Accessibility Based on MGWR. Int. J. Environ. Res. Public Health 2023, 20, 1535. [Google Scholar] [CrossRef]
Figure 1. The attributions and numbers of cases considered in the extant literature.
Sustainability 16 09165 g001
Figure 2. The input indicators in previous studies and their associations.
Sustainability 16 09165 g002
Figure 3. The cliques of inputs. (a) Clique of “population density”; (b) Clique of “employment density”.
Sustainability 16 09165 g003
Figure 4. The TOD performance indicators considered in previous studies. Note: the size of the dot represents the total frequency with which the performance indicator has been validated in previous studies.
Sustainability 16 09165 g004
Figure 5. TOD traffic performance and its influencing factors (Appendix B, item 6).
Sustainability 16 09165 g005
Figure 6. Cluster analysis of the factors affecting TOD traffic performance.
Sustainability 16 09165 g006
Figure 7. TOD economic performance and its influencing factors.
Sustainability 16 09165 g007
Figure 8. Cluster analysis of the factors affecting TOD economic performance.
Sustainability 16 09165 g008
Figure 9. TOD environmental performance and its influencing factors.
Sustainability 16 09165 g009
Figure 10. Cluster analysis of the factors influencing TOD environmental performance.
Sustainability 16 09165 g010
Figure 11. TOD social performance and its influencing factors.
Sustainability 16 09165 g011
Figure 12. Cluster analysis of the factors affecting TOD social performance.
Sustainability 16 09165 g012
Figure 13. Cluster analysis of the factors affecting comprehensive TOD performance.
Sustainability 16 09165 g013
Figure 14. The key input elements and their associated input elements for the six dimensions affecting TOD performance. The ellipses are used to clarify the indicators with the same dimensional characteristics based on the “5D” theory.
Sustainability 16 09165 g014
Table 1. Important input elements that affect TOD performance.
Main Influential Factors“5D” DimensionsTOD PerformanceOther Input Elements
Traffic Economic Environmental SocialOverall
Distance to Transit StationDistance to TransitHighestHighest-HighHighHigh
Diversity of land useDiversityHighestHighHighestHighHighHighest
Population densityDensityHighestHighHighHighestHighHighest
Employment densityDensityHighestHighHighestHighestHighHighest
WalkabilityDesignHigh--HighHighHigh
Development densityDensityHigh-HighHighHighHigh
Residential densityDensityHigh--Highest-High
Number of bus stops/routesDistance to TransitHigh----High
Density of street intersectionsDesignHigh----High
Area of retail facilitiesDensityHigh----High
Livability of communityDesignHigh----High
Note: The total number of confirmations in relevant literature for the interrelated impacts among factors influencing TOD traffic, economic, environmental, and social efficiency, as well as other input elements, are classified into four levels: highest, high, medium, and low. Only indicators classified as highest and high are identified; TOD overall performance is classified into only high and low levels, with only the high level identified.
Disclaimer/Publisher’s Note: The statements, opinions and data contained in all publications are solely those of the individual author(s) and contributor(s) and not of MDPI and/or the editor(s). MDPI and/or the editor(s) disclaim responsibility for any injury to people or property resulting from any ideas, methods, instructions or products referred to in the content.

