Abstract
The global energy landscape is undergoing an unprecedented transformation with the rapid development of clean energy and the continued significance of traditional energy creating a complex dynamic relationship. This study employs the TVP-QVAR-DY model to systematically examine the dynamic spillover effects between clean and traditional energy markets in the United States, focusing on the impacts of economic policy uncertainty (EPU) and geopolitical risk (GPR). The findings reveal (1) significant time-varying spillover effects between the two markets, with total spillover effects ranging from 30% to 50%, intensifying during extreme events; (2) increases in EPU and GPR exacerbate uncertainty in energy markets, particularly in the traditional energy sector, with spillover effects from crude oil to natural gas reaching 23.60% and vice versa at 24.30%; and (3) in the short term, the clean energy market is influenced by traditional energy, with spillover effects from oil to clean energy at 5.10%, while in the medium to long term it gradually becomes independent and inversely affects the traditional energy market, contributing 2.94% to oil spillovers. The results indicate that as the global energy transition deepens, the clean energy market is shifting from a risk receiver to a risk contributor. Based on these findings, the study proposes policy recommendations including accelerating energy structure transition, managing macroeconomic uncertainty risks, coordinating domestic and international energy markets, and leveraging market mechanisms.
1. Introduction
The global energy landscape is undergoing an unprecedented transformation, driven primarily by global challenges such as climate change, energy security, and sustainable development [1,2,3]. In this context, the rapid development of clean energy and the ongoing significance of traditional energy create a complex dynamic relationship. According to data from the International Energy Agency (IEA), in 2023, global renewable energy capacity surpassed coal for the first time, marking an important milestone in the energy transition [4]. However, traditional energy still holds a significant position in the global energy structure, particularly in developed countries like the United States. As a key component of the global energy system, the interaction between clean and traditional energy sectors in the U.S. has a substantial impact on the global energy landscape [5,6]. In recent years, investment in clean energy in the U.S. has rapidly grown, reaching $114 billion in 2022, an increase of 11.9% year-on-year [7]. At the same time, the U.S. remains the world’s largest producer of oil and natural gas, with the traditional energy sector playing a crucial role in the national economy [8]. This dual characteristic makes the U.S. energy market an ideal setting for studying the interactions between clean and traditional energy.
Against the backdrop of the energy transition, the mutual influence between clean and traditional energy markets is becoming increasingly complex. This complexity is first reflected in the significant increase in market volatility. The uncertainty factors facing energy markets are on the rise, including geopolitical risks, technological innovations, and policy changes. For instance, the Russia–Ukraine conflict in 2022 led to a surge in European natural gas prices, which in turn affected the global energy market [9]. Rapid advancements in clean energy technologies, such as improvements in solar photovoltaic efficiency and breakthroughs in energy storage, continually reshape the competitive landscape of energy markets, increasing the potential stranding risk of traditional energy assets [10]. Energy policies formulated by various governments to combat climate change, such as carbon pricing mechanisms and renewable energy subsidies, significantly impact the supply–demand relationship in energy markets [11]. Research by [12] indicates that this increased volatility not only affects individual energy commodities but also transmits through complex market mechanisms among different energy varieties, forming a highly interconnected dynamic system.
The connections between clean and traditional energy sectors are tightening, with changes in one sector potentially having significant effects on the other, leading to cross-sector spillover effects. These spillover effects primarily transmit through channels such as price mechanisms, investment flows, and technological spillovers. Ref. [13] found that the decreasing cost of solar power may reduce demand for natural gas generation, thereby affecting natural gas prices. Research by [14] shows that investors’ allocation decisions between clean and traditional energy can be influenced by various factors, including policy support, technological advancements, and market expectations; such shifts in funding flows may lead to correlated asset prices between the two sectors. Additionally, traditional energy companies are increasingly investing in clean energy technologies, and advancements in clean energy technologies may also enhance the efficiency of traditional energy, reinforcing the interdependence between the two sectors [15].
Energy markets are also affected by multiple uncertainty risks, with economic policy uncertainty and geopolitical risks being particularly important. The economic policy uncertainty index developed by [16] reveals how policy changes impact business investment decisions and market expectations. In the energy sector, such uncertainty may manifest as fluctuations in clean energy subsidy policies or changes in fossil fuel regulations, thereby influencing the dynamics of the entire energy market. The geopolitical risk index quantified by [17] reflects the potential impact of global political situations on economic activity. As a global strategic resource, energy markets are particularly susceptible to geopolitical risks. Moreover, with the advancement of global climate governance, the uncertainty surrounding policy tools such as carbon pricing mechanisms and emissions trading has also become a significant factor influencing energy markets. This risk may lead to early depreciation of traditional energy assets and accelerated investment in clean energy [18].
The dynamic relationship in energy markets is not static but evolves with changes over time and in external environments. This time-varying characteristic can be reflected in long-term structural changes (e.g., the shale oil revolution altering the global oil and gas market), short-term drastic changes due to unexpected events, and seasonal fluctuations in certain energy commodities (e.g., natural gas). Ref. [19] emphasize the importance of capturing time-varying characteristics of financial market connectivity, which is particularly crucial for understanding the evolution of the dynamic relationship between clean and traditional energy in energy market research. Ref. [20] explore the relationship between the U.S. clean energy market and human capital as well as urbanization income using the ARDL method, suggesting that increasing levels of urbanization and income accelerate environmental degradation; furthermore, clean energy does not promote the development of green technologies in the U.S.
Additionally, the interactions in energy markets may exhibit different characteristics across various time scales. Short-term intraday or weekly price fluctuations may reflect market microstructure or short-term supply–demand imbalances, while monthly or quarterly changes may capture seasonal patterns or mid-term economic cycle influences. Changes over annual or longer time scales may reflect impacts from technological advancements, policy reforms, or long-term economic structural adjustments. Ref. [21] highlights the application value of wavelet analysis in economic research, particularly in handling non-stationary time series and capturing time–frequency characteristics. In energy market research, frequency domain analysis can help us gain a more comprehensive understanding of the complex interactions between clean and traditional energy. Ref. [22] investigates the relationship between the U.S. clean energy and commercial markets, finding spillover connections between clean energy and its sub-industries with the commercial market.
This study aims to delve deeply into the time-varying spillover effects and frequency connections between the U.S. clean and traditional energy markets, with a particular focus on the impacts of multiple uncertainty factors such as economic policy uncertainty and geopolitical risks. Specifically, we employ the TVP-QVAR-DY model to analyze the dynamic spillover effects between clean and traditional energy markets. This model is chosen for its ability to capture time-varying relationships and nonlinear responses to shocks, which are crucial in energy markets characterized by significant fluctuations and external influences such as geopolitical risks and policy changes. Alternative methods, such as the standard VAR or GARCH models, were considered. However, these models have limitations in dealing with the evolving nature of relationships over time and the asymmetry of shock transmissions. For instance, standard VAR models assume static relationships, which may overlook the dynamic interactions between markets during periods of extreme volatility, while GARCH models focus primarily on volatility clustering without addressing the broader systemic spillover effects. The TVP-QVAR-DY model addresses these shortcomings by allowing parameters to evolve over time and capturing the full extent of spillover dynamics, providing a more comprehensive understanding of energy market interactions. Compared to traditional VAR models, the TVP-QVAR-DY model allows parameters to change over time, capturing the dynamic evolutionary characteristics between energy markets [23]. The introduction of quantile regression enables the characterization of asymmetric effects of energy price shocks at different quantile levels. Considering the impact of uncertainty factors aligns more closely with the current complex and changing global economic environment. The monthly data used in this study, including EPU and GPR, span a long time frame and cover significant events such as the financial crisis and the COVID-19 pandemic, thus comprehensively reflecting the volatility characteristics of energy markets under different periods and shock intensities. Based on this data, this study will systematically assess the impacts of economic policy uncertainty and geopolitical risks on the dynamic relationships in energy markets and discuss the dynamic connections from short-term, mid-term, and long-term perspectives.
The innovations and significance of this study primarily manifest in three aspects: First, the methodological innovation lies in combining time-varying parameter models, quantile regression, and vector autoregression methods to construct the TVP-QVAR-DY model. Compared to traditional VAR and TVP-VAR models, this model can depict nonlinear and asymmetric transmission paths of risk shocks between different markets while dynamically capturing the connections in energy markets, representing an important extension of existing literature. By introducing uncertainty indicators, this model can also quantify the impact of uncertainty factors on energy markets, contributing to a deeper understanding of the driving mechanisms behind current energy market volatility and providing new analytical tools for refining energy pricing theory. Second, the contribution at the data level is that this paper innovatively incorporates clean energy, traditional energy, and multidimensional uncertainty indicators such as EPU and GPR into a unified analytical framework, creating a large sample dataset encompassing multiple key events. This not only provides a solid data foundation for comprehensively examining energy market linkages and testing the effects of uncertainty shocks but also opens up new avenues for empirical research in energy economics, potentially expanding the breadth and depth of future studies by including more types of energy commodities and risk factors. The findings from this model offer critical insights into energy policy formulation, emphasizing the need for enhanced support for clean energy initiatives, including the development of new pricing mechanisms and market regulations. For risk management, this research highlights the increasing interconnectedness between clean and traditional energy markets, suggesting the need for dynamic hedging strategies that account for time-varying spillover effects. Additionally, the study’s results are highly relevant for investment decision-making, pointing to the growing importance of diversifying portfolios with clean energy assets to mitigate risks associated with geopolitical tensions and economic policy uncertainties. Third, this research closely aligns with the theme of energy transition under the “carbon neutrality” goal, focusing on the dynamic relationships between clean and traditional energy. The conclusions of the study will not only provide micro-decision-making references for promoting clean energy development, optimizing energy market operations, and achieving sustainable energy goals but also offer important policy insights for addressing climate change and achieving carbon reduction targets on a macro level. Furthermore, the analytical ideas and modeling methods presented in this paper can be applied to other countries and markets, contributing to a deeper understanding of the operational rules of the global energy market and grasping the risk transmission mechanisms in the energy market under the new conditions.
Through this research, we expect to provide in-depth insights into the dynamics of the U.S. energy market for both academia and practice, providing scientific evidence for decision-making in the energy transition process. In the following chapters, we will first review the relevant literature, then detail the research methods and data, present our empirical results and discussions, and finally summarize the research findings and propose policy recommendations.
2. Data Description and Methodology
2.1. Data Description
The data utilized in this study encompass various markets and uncertainty risk indicators, including economic policy uncertainty (EPU), stock market-related economic uncertainty (WLEMUINDXD), and global geopolitical risk (GPR), as well as major energy markets such as oil (OIL), liquefied natural gas (LNG), natural gas (GAS), clean energy (CE), fuel (FUEL), and coal (COAL). The specific time frame of the data includes significant events such as the global financial crisis and the COVID-19 pandemic, providing a robust foundation for analyzing market volatility and spillover effects during different periods.
The economic policy uncertainty (EPU) and the global geopolitical risk (GPR) data were sourced from the Uncertainty Index website (https://www.policyuncertainty.com/), reflecting changes in uncertainty within the context of the global macroeconomic and geopolitical landscape. Energy market data—including that for oil, natural gas, and clean energy—were obtained from Investing (https://www.investing.com/), capturing the dynamic fluctuations in global energy prices and supply–demand relationships.
All datasets were collected and processed at a daily frequency. Given the differences among the data, each subset has been standardized to cover the period from 24 January 2007 to 2 January 2024, ensuring high temporal relevance and broad applicability for the research. Additionally, the first differences of the natural logarithm of the level series were employed to measure the return series of the total variables. (See Figure 1).
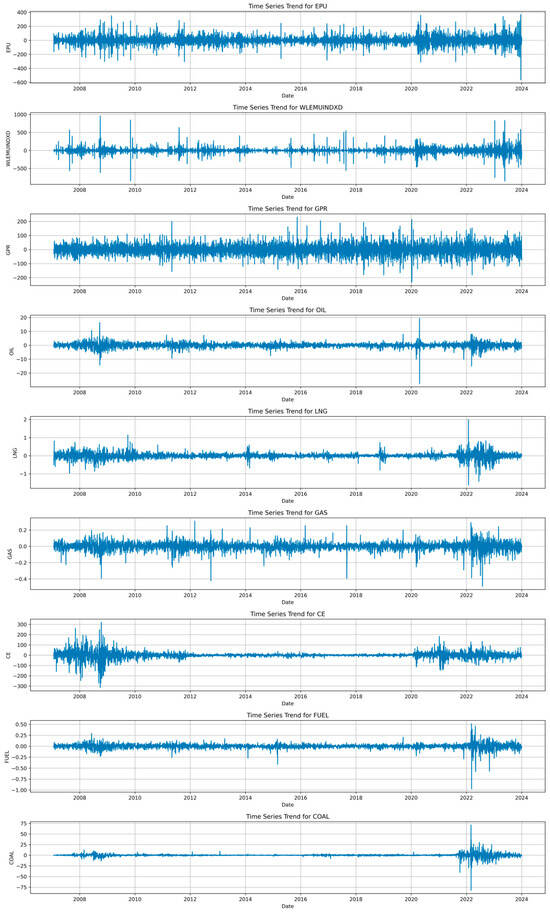
Figure 1.
Daily log returns.
We used descriptive statistics to understand the basic characteristics of the data. Descriptive statistics enable a quick overview of the distribution of each variable, including measures of central tendency, dispersion, and the overall range of the data. This foundational analysis supports further econometric investigation. According to the results of the descriptive statistics, each variable contains 4220 observations, indicating a substantial amount of data that provides a reliable basis for subsequent analysis. The mean values reflect the long-term trends of each variable, with the EPU having a mean of 0.011, WLEMUINDXD at 0.010, GPR at 0.009, OIL at 0.004, and LNG at −0.001. These mean values suggest that, despite some fluctuations, the long-term trends for these variables remain relatively stable.
In terms of standard deviation, WLEMUINDXD exhibits a standard deviation of 85.514, indicating considerable volatility, whereas OIL has a much lower standard deviation of 1.804, suggesting stability. This implies that WLEMUINDXD experiences more drastic fluctuations compared to the steadiness observed in OIL. Similarly, EPU and GPR have standard deviations of 62.988 and 41.782, respectively, indicating a notable degree of variability. The maximum and minimum values reveal significant outliers for some variables. For instance, WLEMUINDXD has a maximum value of 962.910 and a minimum of −849.970, indicating extreme volatility during the sample period. Likewise, EPU’s maximum is 367.620 and its minimum is −562.880, also suggesting substantial abnormal fluctuations in its data.
Building upon the descriptive statistics, we performed several critical tests, including the ADF test, KPSS test, and JB test. These tests provide key insights into the stationarity of the variables, the presence of unit roots, and their distributional characteristics, all of which are essential for assessing whether the variables meet the requirements for further modeling.
The ADF (augmented Dickey–Fuller) test is primarily employed to assess whether a time series possesses a unit root, indicating non-stationarity. The test results reveal that the ADF statistics for all variables are significantly negative, accompanied by very small p-values (e.g., the ADF statistic for EPU is −22.987, with a p-value less than 0.01, denoted as ***). This indicates that all variables reject the unit root hypothesis, suggesting that these time series are stationary and suitable for further time series modeling. Conversely, the KPSS (Kwiatkowski–Phillips–Schmidt–Shin) test assesses whether a time series is trend stationary. In the KPSS test, a low p-value suggests that the time series may be non-stationary. The results indicate that many variables have significant KPSS statistics, yet high p-values (e.g., the KPSS statistic for EPU is 0.014, with a p-value of 0.1, denoted as *). This suggests that at a lower significance level, we cannot reject the hypothesis that the time series is trend stationary, indicating the possible presence of a trend component. The JB (Jarque–Bera) test assesses whether the data follow a normal distribution. All variables exhibit very large JB statistics, with p-values close to zero (e.g., the JB statistic for EPU is 4867.202, with a p-value less than 0.01, denoted as ***), indicating a strong rejection of the normality hypothesis. In other words, the time series data significantly deviate from a normal distribution, suggesting the presence of notable skewness or kurtosis.
In summary, the test results indicate that all variables exhibit stationarity (as evidenced by significant ADF test results), although most time series may contain trend components (as KPSS test results fail to significantly reject the hypothesis of trend stationarity). Furthermore, not all variables conform to the normal distribution assumption (as shown by significant JB test results). This information serves as a critical reference for selecting appropriate time series models (such as autoregressive models or differencing models) in our subsequent analyses. (See Table 1).

Table 1.
Data descriptions and tests.
2.2. Methodology
This study employs a time-varying parameter vector autoregression spillover model (TVP-QVAR-DY) to analyze the dynamic spillover effects of systemic risk across different periods. This model combines the flexibility of the vector autoregression (VAR) framework with the characteristics of time-varying parameters (TVP), enabling it to capture the dynamic evolution of spillover effects between different points in the system. The following outlines the specific process of this methodology.
The TVP-QVAR-DY model is built upon the traditional VAR framework, where represents a vector containing k variables. The model is expressed as follows:
Here, denotes the coefficient matrices that may change over time, and represents the error term, capturing the idiosyncratic shocks affecting the system. This model structure allows for the coefficients to vary according to time, reflecting changes in the relationships between the variables and enabling a more nuanced analysis of spillover effects under different conditions.
To estimate the TVP-QVAR-DY model, we apply a Bayesian framework that utilizes Markov chain Monte Carlo (MCMC) methods, allowing for efficient estimation of time-varying parameters. The results obtained from this model will facilitate a deeper understanding of how systemic risk manifests and evolves in response to varying economic conditions and external shocks.
To quantify the systemic risk spillover effects, this study adopts the spillover index proposed by [24]. In the TVP-QVAR model, the spillover index can be computed through variance decomposition of forecast errors. The core idea of this method is to analyze the variance contributions of the variables within the system to determine each variable’s spillover effects on others. The specific steps are as follows:
- (1)
- Variance decomposition of forecast errors: Initially, the proportion of each variable’s volatility attributable to the fluctuations of other variables is calculated through the variance decomposition of the model’s forecast errors.
- (2)
- Total spillover index: Based on the decomposition results of the forecast errors, the total spillover effects among the variables in the system are computed, illustrating how overall risk is transmitted between different variables. The total spillover index is defined as
3. Empirical Results and Analysis
Table 2 presents the static spillover matrix, illustrating the interrelationships among various market variables, along with each variable’s own contribution and the influence exerted by external variables. The main diagonal indicates the impact of return shocks on independent variables, while the off-diagonal elements represent the interactions between the financial indices.
Table 2.
Connectedness index.
The analysis of the full-sample static spillover matrix reveals the complex and nuanced interplay between energy markets and macroeconomic uncertainty, with significant implications for real-world economic and policy contexts. Firstly, the strong bidirectional spillover effects between crude oil and natural gas (23.60% from OIL to GAS and 24.30% from GAS to OIL) reflect the central role these traditional energy commodities play in the global energy market. This close relationship can be traced back to the historical development of the energy industry, where oil companies often operate in both oil and gas sectors, and the substitutability of oil and gas in various industrial and power generation processes. In practical markets, this connection implies that supply and demand shocks in one sector can rapidly transmit to the other. For instance, the natural gas supply disruptions caused by the Russia–Ukraine conflict in 2022 not only drove up natural gas prices but also indirectly stimulated demand for crude oil, leading to rising oil prices. This phenomenon underscores the need to consider the interdependencies among different energy commodities when formulating energy policies.
The spillover effects between clean energy (CE) and traditional energy, while relatively weaker, reveal the market dynamics inherent in the energy transition process. CE receives greater spillover from OIL and GAS (5.10% and 3.82%, respectively) than it contributes to them (2.94% and 2.26%, respectively), indicating that the clean energy market remains significantly influenced by fluctuations in traditional energy markets. This situation may reflect several real-world factors: first, many clean energy companies’ financial health and investment decisions continue to be affected by fossil fuel prices; second, in power systems, renewable and fossil fuel generation often need to complement each other, particularly when intermittent renewable energy sources (like wind and solar) require backup power; finally, government support policies for clean energy often adjust according to changes in fossil fuel prices. For example, when oil prices surge, governments may increase subsidies for clean energy to accelerate the energy transition.
The significant bidirectional relationship between economic policy uncertainty (EPU) and global stock market uncertainty (WLEMUINDXD) (6.37% from EPU to WLEMUINDXD and 7.37% from WLEMUINDXD to EPU) underscores the close relationship between the macroeconomic environment and financial markets. In practice, this relationship may manifest as follows: when policy uncertainty rises, investors may reduce their risk exposure, leading to declines in the stock market; conversely, significant stock market fluctuations may prompt policymakers to adjust economic policies, thereby increasing policy uncertainty. This interaction has become particularly evident in recent years; for example, during the COVID-19 pandemic, governments frequently adjusted economic policies in response to the crisis, while financial market volatility continuously influenced policy direction.
Notably, geopolitical risk (GPR) exhibits the highest self-explanatory capability (99.30%), reflecting the unique and unpredictable nature of geopolitical events. Nevertheless, the impact of GPR on energy markets should not be overlooked, especially in the context of a global energy supply chain heavily reliant on specific regions. For instance, political turmoil in the Middle East often leads to oil price fluctuations, and the recent Russia–Ukraine conflict has directly affected gas supplies in Europe.
As the largest net contributor to spillover effects (net spillover effect of 6.44%), crude oil underscores its central role in the global economy. Fluctuations in crude oil prices not only directly affect energy costs but also influence overall economic activity through channels such as transportation and manufacturing. This finding serves as a reminder for policymakers and market participants to closely monitor developments in the crude oil market and consider its potential spillover effects on other economic sectors.
After conducting an in-depth analysis of the full-sample static spillover effects, we recognize the complex interactions among energy markets, financial markets, and macroeconomic policies. However, static analysis only provides a long-term average perspective and struggles to capture the dynamic changes in these relationships over time. Given the high volatility of energy markets and the ongoing evolution of the macroeconomic environment, we have reason to believe that these interactions may undergo significant changes over time. Therefore, to gain a more comprehensive understanding of the dynamic characteristics of these relationships, we introduced a rolling window analysis approach.
Rolling window analysis allows us to observe the interactions among variables over shorter time periods and track how these interactions evolve over time. By rolling a fixed-width time window throughout the entire sample period, we can generate a series of time-varying spillover indices. This approach offers several notable advantages: first, it can identify the impact of specific events or periods on the system’s interdependencies; second, it can reveal potential structural changes or trends; and third, it provides a more granular method for observing the evolution of relationships among different variables. We employed a 200-day rolling window to calculate the time-varying total spillover index (TCI) and the net spillover effects between individual variables. The choice of this window size aims to balance sensitivity to short-term fluctuations with the stability of long-term trends.
Figure 2 illustrates the dynamic changes in the strength of interactions among the various variables within the system, providing crucial insights into the complex relationships among energy markets, financial markets, and macroeconomic policies. During the observation period from 2010 to 2023, the overall spillover effects fluctuated between approximately 30% and 50%, indicating sustained and significant interdependencies within the system, though the intensity varied over time. Notably, despite short-term fluctuations, the overall spillover effect did not exhibit a clear long-term upward or downward trend, suggesting that the system’s overall structure remained relatively stable during this period.
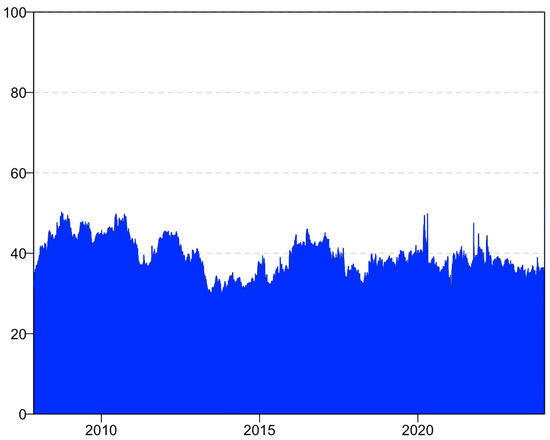
Figure 2.
Overall spillover effect.
The figure reveals pronounced cyclical patterns, particularly during the period from 2010 to 2015, where volatility was more pronounced. This cyclicality may reflect economic cycles or periodic changes in the energy market. Specifically, (1) the high levels of spillover during 2010–2012 may have been associated with the economic recovery following the global financial crisis and the European debt crisis, indicating that market interdependencies are more pronounced in times of heightened economic uncertainty; (2) the significant decline in spillover effects in 2014–2015 was likely linked to the dramatic fall in international oil prices during that time, when OPEC decided not to cut production, altering the interaction patterns between the energy market and other markets; and (3) the noticeable peak in spillover effects observed in early 2020 was undoubtedly related to the outbreak of the COVID-19 pandemic and its impact on the global economy and energy markets. This peak underscores that during global crises, the connections among markets intensify, resulting in deeper interdependencies.
Interestingly, starting from late 2020, the overall spillover effects appeared to stabilize, with a reduced amplitude of fluctuations. This trend may reflect the market’s gradual adaptation to the new normal following the pandemic, as well as the ongoing effects of policy support from various countries.
The figure also highlights several notable extreme values in spillover effects, particularly around 2020 and 2022. These peaks may correlate with specific major events, such as different phases of pandemic impact, escalating geopolitical conflicts (e.g., the Russia–Ukraine conflict), or significant changes in energy policies. These observations emphasize the dynamic and complex relationship between the energy market and the macroeconomic environment, indicating that the system is highly sensitive to external shocks and policy changes.
Next, we analyzed spillover effects from the perspective of individual variables, as shown in Figure 3.
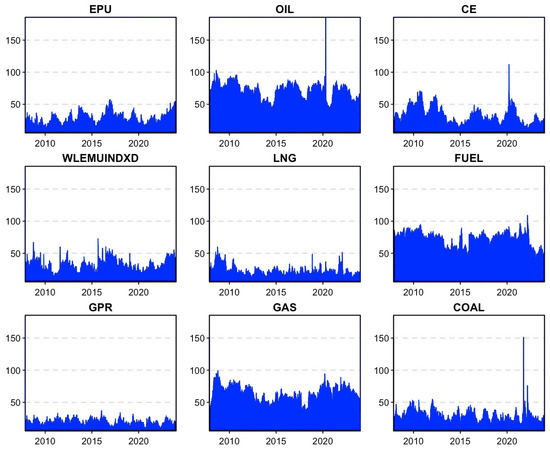
Figure 3.
Net overflow. Note: Outcomes relied on a TVP-VAR with order-one lag and a 20-step-ahead GFVED.
From the figure, it can be observed that different variables exhibit significant fluctuations during specific time periods, particularly in the oil market (OIL), which has a net spillover value of 6.44, indicating its significant net spillover contribution within the entire system. This can be explained by the key role of oil in the global economy; its price fluctuations not only directly impact other traditional energy markets, such as natural gas (LNG) and fuel (FUEL), but also have a significant indirect effect on the clean energy market (CE).
Economic policy uncertainty (EPU) shows multiple peaks of fluctuation throughout the sample period, especially during the COVID-19 outbreak in 2020, reflecting a substantial increase in global policy uncertainty due to the pandemic. The large-scale fiscal stimulus and monetary policy adjustments taken by various governments further exacerbated this uncertainty. In 2020, OIL’s fluctuations were particularly severe, likely related to the collapse in global crude oil demand caused by the pandemic, as well as the subsequent price war between Saudi Arabia and Russia. During March and April 2020, oil prices briefly fell below zero, and this unprecedented market volatility transmitted to other energy markets, especially natural gas and fuel markets.
In contrast, the clean energy market (CE) acts as a major net receiver, with a net spillover value of −4.64, reflecting its continued dependence on fluctuations in traditional energy markets within the context of global energy transition. This trend was especially pronounced in 2020, as the dramatic fluctuations in the oil and fuel markets also increased volatility in the clean energy market, particularly against the backdrop of policies promoting a green economy under the Biden administration.
Fluctuations in the WLEMUINDXD index peaked in 2015 and 2020. The volatility in 2015 likely related to the severe fluctuations in the Chinese stock market and concerns about a slowdown in China’s economic growth, while the volatility in 2020 was associated with the panic selling in global financial markets triggered by the pandemic. Additionally, traditional energy markets such as LNG, GAS, FUEL, and COAL also experienced significant fluctuations in 2020, primarily due to the sudden drop in global energy demand and supply chain disruptions caused by the pandemic.
Lastly, the relative independence of global geopolitical risk (GPR) and economic policy uncertainty (EPU), as reflected by their high self-contribution rates, indicates that their fluctuations are primarily driven by endogenous factors. However, during specific periods, such as the pandemic, they indirectly affected the connectivity and volatility of the entire energy market by influencing the oil market.
Based on the analysis of directional spillover and spill-in effects, we can clearly see that different markets and uncertainty risks exhibit significant dynamic changes during the sample period, especially during major events. This phenomenon reflects the interdependence of markets and the enhanced volatility transmission mechanisms during specific time periods. (See Figure 4).
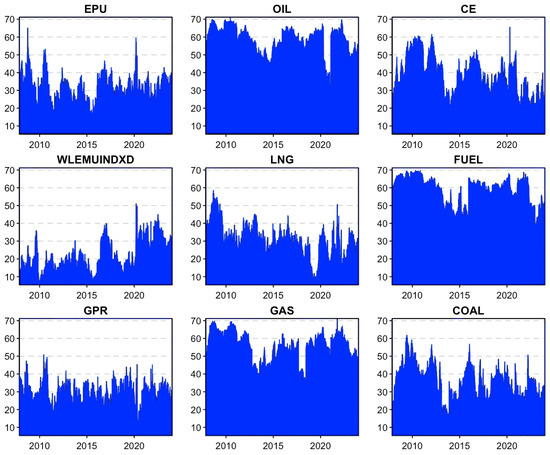
Figure 4.
Direction spillover and direction spill-in.
Firstly, economic policy uncertainty (EPU) demonstrated significant spillover and spill-in effects during the COVID-19 pandemic in 2020. The pandemic led to a highly uncertain global economic policy environment, with frequent adjustments to government fiscal stimulus and monetary easing policies, resulting in considerable fluctuations in investors’ expectations regarding future policy directions. The rise in EPU spillover effects indicates that policy uncertainty had a widespread impact on global energy markets and other financial markets during the pandemic. Simultaneously, the significant increase in EPU spill-in effects reflects the bidirectional interaction between economic uncertainty and external markets. The decline in global demand, supply chain disruptions, and economic slowdown caused EPU to be influenced by fluctuations in other markets, such as oil and stock markets.
In this context, the oil market (OIL) emerged as one of the most important volatility transmitters during the pandemic. The spillover effect chart indicates that the oil market had a strong spillover effect on other markets (such as natural gas, fuel, and clean energy) during the initial outbreak of the pandemic in early 2020. The collapse in global oil demand, coupled with the price war between Saudi Arabia and Russia, led to a significant decline in oil prices, which not only impacted the global energy market but also affected the clean energy market through spillover effects. At the same time, the oil market’s spill-in effects also increased significantly, reflecting that during periods of global economic turbulence, the oil market is influenced not only by its own supply shocks but also by the transmission effects of economic uncertainty related to the stock market (WLEMUINDXD) and geopolitical risks (GPR).
The clean energy market (CE) displayed significant bidirectional volatility transmission characteristics in 2020. With the growing global focus on the green economy and energy transition, the clean energy market gradually became a focal point of policy and market attention. However, the economic slowdown and sharp decline in energy demand caused by the pandemic meant that the clean energy market both was influenced by fluctuations from traditional energy markets (such as oil and natural gas) and, under the backdrop of policies promoting a green economic recovery, transmitted volatility to other markets. Particularly after the global economic recovery began in 2021, the spillover effects of the clean energy market on other markets significantly increased, reflecting a restoration of market confidence in green investments. During this period, the interaction between stock market-related economic uncertainty (WLEMUINDXD) and the oil and clean energy markets also became closer. Both spillover and spill-in effects of WLEMUINDXD peaked during the pandemic, indicating intensified fluctuations in global stock markets, which not only affected energy markets but were also influenced by volatility in those markets. This bidirectional interaction was particularly evident during periods of market panic, as investors sought safe-haven assets amid stock market fluctuations, while price volatility in the energy market further exacerbated uncertainty in the stock market.
Traditional energy markets, such as natural gas (LNG), fuel (FUEL), and coal (COAL), also exhibited significant spillover and spill-in effects in 2020. These markets became the primary recipients of volatility from the oil market amid the global economic downturn and sharp drop in energy demand. Furthermore, the fluctuations in these traditional energy markets also transmitted to external markets, particularly impacting the clean energy market significantly. This phenomenon reflects the gradually increasing interaction between traditional and clean energy markets against the backdrop of the global energy transition.
From Figure 5, we can clearly identify the bidirectional spillover effects between markets. Firstly, economic policy uncertainty (EPU) plays a crucial role in the bidirectional spillover effects with other markets. Before the outbreak of the pandemic, the spillover effects of EPU with markets such as oil (OIL) and clean energy (CE) were relatively stable, with small fluctuations. However, following the outbreak of COVID-19 in 2020, the spillover effects of EPU significantly increased, especially its interaction with the oil market became closer. The global economic uncertainty, frequent policy adjustments, and variability of government responses brought about by the pandemic caused EPU to become an important transmitter of fluctuations in other markets. At the same time, EPU also received considerable spillover effects from energy markets, indicating a bidirectional feedback mechanism between economic policy and energy prices. After the pandemic, with the implementation of economic stimulus policies in various countries and the increase in policy uncertainty, the mutual influence between EPU and energy markets further intensified.
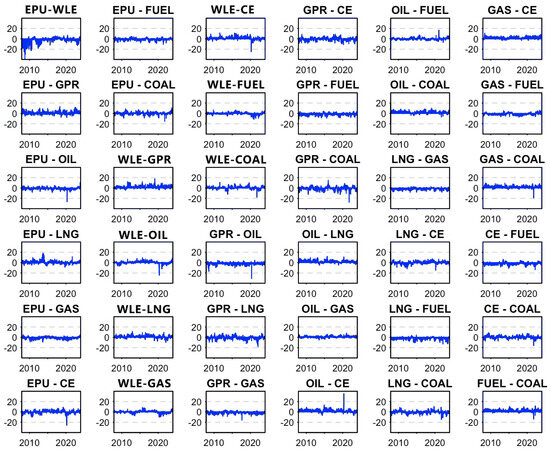
Figure 5.
Spillover effects between two variables.
OIL is another significant contributor to spillover effects. Before the outbreak of the pandemic, the bidirectional spillover effects of oil with other energy markets (such as natural gas (LNG) and fuel (FUEL)) were relatively stable. However, after the outbreak, the volatility of the oil market intensified, particularly due to the sharp decline in global oil demand and the impact of price wars in 2020, leading to a significant increase in the spillover effects of oil on other markets, including clean energy. After the pandemic, as global demand gradually recovered, the volatility of the oil market returned to normal levels, but its spillover effects on the clean energy market remained high, reflecting the impact of traditional energy markets on the global energy transition.
The clean energy market (CE) also exhibited significant changes in its bidirectional spillover effects with traditional energy markets (such as oil and natural gas). Before the pandemic, the interaction between the clean energy market and traditional energy markets was limited, and spillover effects remained relatively low. With the outbreak of the pandemic, global attention to energy transition increased, and the clean energy market received greater volatility transmission from traditional energy markets. This indicates that while the clean energy market is gradually becoming independent from traditional energy, it remains influenced by traditional energy markets during significant market fluctuations. Moreover, in the latter part of the pandemic, the clean energy market gradually became a transmitter of volatility, as increasing global investment in green energy began to impact other energy markets, especially against the backdrop of accelerated global energy transition.
Geopolitical risk (GPR) also exhibited different bidirectional spillover effects before and after the pandemic. Before the pandemic, the spillover effects of GPR were relatively small, primarily impacting other markets during specific periods (such as the 2014 Ukraine crisis and Middle Eastern conflicts). However, after the pandemic, the spillover effects of GPR increased, particularly the bidirectional relationship with the oil market became closer. This phenomenon reflects the intensified interaction between geopolitical risks and the global energy market after the pandemic.
In summary, the bidirectional spillover effects of various markets show significant changes before and after the pandemic. Prior to the outbreak, the interactions between markets were relatively stable, with mild spillover effects. After the outbreak, economic policy uncertainty and volatility in the oil market became the main contributors to spillover effects, influencing multiple markets including clean energy. With the global economic recovery and acceleration of the energy transition, the clean energy market has gradually shifted from being a receiver of spillover effects to a transmitter of volatility, reflecting profound changes in the global energy landscape.
Figure 6 illustrates the interconnections between various variables and their spillover directions. The nodes represent different markets or risk variables, while the arrows indicate the direction and strength of spillovers. Thick lines represent stronger spillover effects, while thin lines represent weaker effects. This chart clearly shows the complex interactions between the global energy market and multiple uncertainty risks.
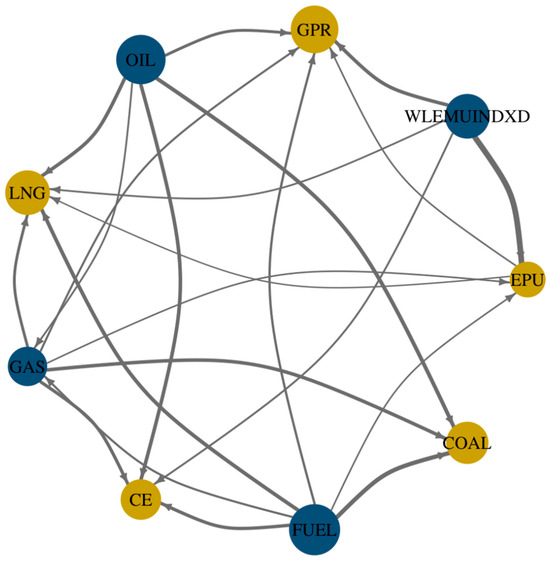
Figure 6.
Spillover effect network diagram between two variables.
Firstly, the oil market (OIL) occupies a critical position in the entire network, demonstrating its powerful spillover effects on multiple markets, particularly on natural gas (LNG), fuel (FUEL), clean energy (CE), and economic policy uncertainty (EPU). This is consistent with the dominant role of oil in the global energy market, indicating that its volatility can widely transmit to other energy markets and further impact policy uncertainty and the global economy through spillover effects. Natural gas (LNG) and fuel (FUEL) also exhibit strong bidirectional spillover effects, especially in their interactions with the oil market. This reflects the high interconnectivity of traditional energy markets, suggesting that when oil prices fluctuate, these effects quickly transmit to the natural gas and fuel markets. Additionally, the spillover effects between the natural gas and fuel markets are also strong, further evidencing the close ties within traditional energy markets.
Secondly, the clean energy market (CE), as a vital component of energy transition, shows significant spillover effects with traditional energy markets, especially with oil, fuel, and natural gas markets. Clean energy is not only affected by the fluctuations in traditional energy markets but also influences them through its own volatility. This indicates that, with the increasing global investment in clean energy and policy support, the volatility of the clean energy market and its interactions with traditional energy markets are also intensifying. Economic policy uncertainty (EPU) and WLEMUINDXD are also key risk factors in the network. EPU exhibits strong bidirectional spillover effects with multiple markets, particularly with the oil and coal (COAL) markets. Policy uncertainty plays a dual role in market volatility, acting both as a receiver of volatility and as a factor that influences energy market fluctuations through policy adjustments and market expectations. Furthermore, the spillover effects of geopolitical risk (GPR) with other markets are relatively small; however, during specific periods (such as pandemics or international conflicts), geopolitical risks impact the oil market, which then transmits to other markets.
In the bidirectional spillover effect diagram, the transmission of fluctuations between markets is depicted in detail as changes in time series, while this network diagram provides a macro perspective on the interdependencies of the entire system. Notably, the oil market and EPU serve as primary transmitters of volatility, significantly influencing the entire energy and uncertainty risk framework. By combining the analyses of these two charts, we can achieve a more comprehensive understanding of the dynamic interactions between markets during different periods and the roles of key variables.
4. Robustness Analysis
To validate the robustness of our model, we conducted further tests on several variables, including the natural gas market (LNG), gasoline market (GAS), oil market (OIL), clean energy market (CE), fuel market (FUEL), coal market (COAL), global geopolitical risk (GPR), and stock market-related economic uncertainty (WLEMUINDXD).
Following the study by [25], we performed robustness tests on the quantile ratios. Specifically, in the context of conditional means presented in the main text, we further explored the results for lower and upper quantiles (τ = 0.05, τ = 0.95).
From Table 3 and Table 4, it can be seen that the oil market (OIL) is a major contributor to spillover effects across all quantiles. In the benchmark model at τ = 0.5, the spillover effect from the oil market is 59.35%, while under τ = 0.05 and τ = 0.95, the spillover contributions rise to 94.62% and 91.76%, respectively, indicating a significant increase. This suggests that the oil market consistently acts as a primary transmitter of volatility, and its influence on other markets is further amplified during extreme volatility scenarios, similarly observed in other markets.
Table 3.
QVAR-DY spillover at 0.05 quantile for the full sample.
Table 4.
QVAR-DY spillover at 0.95 quantile for the full sample.
Overall, the results of the robustness tests indicate that the spillover effects among markets are more pronounced in low and high volatility conditions compared to the benchmark scenario, particularly in traditional energy markets like oil. The results across different quantiles exhibit a consistent trend, affirming the model’s robustness in addressing extreme market volatility.
5. Conclusions and Policy Implications
This study employed the TVP-QVAR-DY model to systematically investigate the dynamic spillover effects between the clean energy and traditional energy markets in the United States, with a focus on the impacts of economic policy uncertainty (EPU) and geopolitical risk (GPR). The findings reveal that (1) there are significant time-varying spillover effects between the clean energy and traditional energy markets, which are notably strengthened during extreme events (such as financial crises and the COVID-19 pandemic); (2) an increase in EPU and GPR significantly amplifies uncertainty in the energy markets, exacerbating negative spillover effects, particularly in the traditional energy markets; and (3) over the short term, the clean energy market is primarily influenced by the fluctuations of the traditional energy markets (especially the oil market), while in the medium to long term, the clean energy market gradually distances itself from traditional energy influences, becoming an important factor affecting the traditional energy markets and macroeconomic uncertainty. In summary, as the global energy transition deepens, the clean energy market is shifting from being a risk receiver to a risk contributor, increasingly impacting the energy market and the broader macroeconomy.
Based on the study’s findings, we propose several policy recommendations aimed at both short-term and long-term improvements in the energy market. First, accelerating the transition of the energy structure requires not only government subsidies but also enhanced support for technological innovation, as seen in Germany’s successful Energiewende, which reduced its reliance on fossil fuels by over 30% in 10 years. Second, managing macroeconomic uncertainty risks can be achieved through policy tools like strategic oil reserves, as demonstrated by the U.S. during the 2020 oil price crash. Coordinating domestic and international energy markets is essential, as highlighted by the European Union’s integrated energy market, which helped stabilize prices during the Russia–Ukraine conflict. Finally, leveraging market mechanisms, such as carbon pricing and emissions trading, can stimulate clean energy investment. Following examples set by California’s cap-and-trade program, the study proposes the following policy recommendations:
- (1)
- Accelerate the transition of the energy structure. The research indicates that the clean energy market is progressively shedding the influence of traditional energy markets and beginning to affect the entire energy market. The government should enhance support for clean energy, including strengthening technological R&D, improving pricing mechanisms, and optimizing the market environment to expedite the transition to a cleaner, low-carbon energy structure.
- (2)
- Focus on managing macroeconomic uncertainty risks. The rise of EPU and GPR can exacerbate volatility in the energy market, affecting supply and price stability. When formulating macroeconomic policies, the government needs to fully consider their potential impacts on the energy market. Additionally, a robust energy risk early warning mechanism should be established to improve the capacity to respond to extreme events.
- (3)
- Coordinate domestic and international energy markets. The study shows that during extreme events, the interconnectedness of global energy markets significantly increases. Therefore, while advancing domestic energy market development, it is essential to strengthen international energy cooperation and actively participate in global energy governance to enhance China’s voice and influence in the global energy market.
- (4)
- Leverage market mechanisms. As the share of clean energy in the energy structure continues to rise, the decisive role of the market in resource allocation needs to be further emphasized. The government should refine the energy price formation mechanism, reduce unnecessary administrative interventions, and allow the market to play a greater role in the development of clean energy.
This study also has some limitations that warrant further exploration in the future. Firstly, the sample data do not encompass the latest developments, such as the Russia–Ukraine conflict and its impacts. Secondly, it does not account for the influence of energy policy adjustments in major global countries. Thirdly, there is room for improvement in the TVP-QVAR-DY model regarding the depiction of dynamic relationships. Future research can focus on expanding the sample, incorporating policy shocks, and improving model specifications to gain a more comprehensive understanding of the dynamic relationships within the energy market. Additionally, applying the model to other countries or markets to analyze the interconnections among regional energy markets is also a valuable direction for future research.
Despite the significant findings of this study, several limitations must be acknowledged. First, the sample data do not encompass recent major events such as the Russia–Ukraine conflict, which has had substantial impacts on global energy markets. The exclusion of these events may limit the study’s ability to fully capture the current dynamics within the energy sector. Second, this study does not account for recent energy policy adjustments in key global economies, which could influence both clean and traditional energy markets. Additionally, while the TVP-QVAR-DY model offers robust insights into time-varying spillover effects, there is room for improvement in terms of model specification. Future research could benefit from expanding the dataset to include more recent and global events, incorporating policy shocks, and refining the model to capture more intricate dynamics. Lastly, applying the model to other countries or regions could provide valuable insights into the interconnections of regional energy markets, offering a more comprehensive view of global energy market relationships.
Author Contributions
Conceptualization, R.D. and P.X.; methodology, R.D. and P.X.; software, R.D.; validation, R.D. and P.X.; formal analysis, R.D.; resources, R.D.; data curation, R.D. and P.X.; writing—original draft preparation, R.D.; writing—review and editing, R.D. and P.X.; visualization, R.D.; supervision, P.X.; project administration, P.X.; funding acquisition, R.D. All authors have read and agreed to the published version of the manuscript.
Funding
This research received no external funding.
Institutional Review Board Statement
Not applicable.
Informed Consent Statement
Not applicable.
Data Availability Statement
Data will be made available on request.
Conflicts of Interest
The authors declare no conflicts of interest.
References
- Stern, P.C.; Sovacool, B.K.; Dietz, T. Towards a science of climate and energy choices. Nat. Clim. Chang. 2016, 6, 547–555. [Google Scholar] [CrossRef]
- Wu, R.; Li, M.; Liu, F.; Zeng, H.; Cong, X. Adjustment strategies and chaos in duopoly supply chains: The impacts of carbon trading markets and emission reduction policies. Int. Rev. Econ. Financ. 2024, 95, 103482. [Google Scholar] [CrossRef]
- Wu, R.; Li, M. Optimization of shipping freight forwarding services considering consumer rebates under the impact of carbon tax policy. Ocean. Coast. Manag. 2024, 258, 107361. [Google Scholar] [CrossRef]
- International Energy Agency (IEA). Renewable Energy Market Update; International Energy Agency: Paris, France, 2024. [Google Scholar]
- Cavus, M.; Allahham, A.; Adhikari, K.; Giaouris, D. A hybrid method based on logic predictive controller for flexible hybrid microgrid with plug-and-play capabilities. Appl. Energy 2024, 359, 122752. [Google Scholar] [CrossRef]
- Cavus, M.; Ugurluoglu, Y.F.; Ayan, H.; Allahham, A.; Adhikari, K.; Giaouris, D. Switched Auto-Regressive Neural Control (S-ANC) for Energy Management of Hybrid Microgrids. Appl. Sci. 2023, 13, 11744. [Google Scholar] [CrossRef]
- BloombergNEF. Clean Energy Investment Trends 2022; BloombergNEF: London, UK, 2023. [Google Scholar]
- U.S. Energy Information Administration (EIA). Annual Energy Outlook 2024; U.S. Energy Information Administration (EIA): Washington, DC, USA, 2024.
- Baffes, J.; Kabundi, A.; Nagle, P.; Ohnsorge, F. The Impact of the War in Ukraine on Commodity Markets; World Bank: Washington, DC, USA, 2022. [Google Scholar]
- Gielen, D.; Boshell, F.; Saygin, D.; Bazilian, M.D.; Wagner, N.; Gorini, R. The role of renewable energy in the global energy transformation. Energy Strategy Rev. 2019, 24, 38–50. [Google Scholar] [CrossRef]
- Creutzig, F.; Agoston, P.; Goldschmidt, J.C.; Luderer, G.; Nemet, G.; Pietzcker, R.C. The underestimated potential of solar energy to mitigate climate change. Nat. Energy 2017, 2, 17140. [Google Scholar] [CrossRef]
- Ferrer, R.; Shahzad, S.J.H.; López, R.; Jareño, F. Time and frequency dynamics of connectedness between renewable energy stocks and crude oil prices. Energy Econ. 2018, 76, 1–20. [Google Scholar] [CrossRef]
- Kyritsis, E.; Serletis, A. Oil prices and the renewable energy sector. Energy J. 2019, 40, 337–364. [Google Scholar] [CrossRef]
- Reboredo, J.C.; Ugolini, A. The impact of energy prices on clean energy stock prices. A multivariate quantile dependence approach. Energy Econ. 2018, 76, 136–152. [Google Scholar] [CrossRef]
- Noailly, J.; Smeets, R. Directing technical change from fossil-fuel to renewable energy innovation: An application using firm-level patent data. J. Environ. Econ. Manag. 2015, 72, 15–37. [Google Scholar] [CrossRef]
- Baker, S.R.; Bloom, N.; Davis, S.J. Measuring economic policy uncertainty. Q. J. Econ. 2016, 131, 1593–1636. [Google Scholar] [CrossRef]
- Caldara, D.; Iacoviello, M. Measuring geopolitical risk. Am. Econ. Rev. 2022, 112, 1194–1225. [Google Scholar] [CrossRef]
- Battiston, S.; Mandel, A.; Monasterolo, I.; Schütze, F.; Visentin, G. A climate stress-test of the financial system. Nat. Clim. Chang. 2017, 7, 283–288. [Google Scholar] [CrossRef]
- Baruník, J.; Křehlík, T. Measuring the frequency dynamics of financial connectedness and systemic risk. J. Financ. Econom. 2018, 16, 271–296. [Google Scholar] [CrossRef]
- Pata, U.K.; Caglar, A.E.; Kartal, M.T.; Depren, S.K. Evaluation of the role of clean energy technologies, human capital, urbanization, and income on the environmental quality in the United States. J. Clean. Prod. 2023, 402, 136802. [Google Scholar] [CrossRef]
- Crowley, P.M. A guide to wavelets for economists. J. Econ. Surv. 2007, 21, 207–267. [Google Scholar] [CrossRef]
- Li, M.; Işık, C.; Yan, J.; Wu, R. The nexus between clean energy market risk and US business environment: Evidence from wavelet coherence and variance analysis. Stoch. Environ. Res. Risk Assess. 2024, 2024, 1–16. [Google Scholar] [CrossRef]
- Zeng, H.; Abedin, M.Z.; Wu, R.; Ahmed, A.D. Asymmetric dependency among US national financial conditions and clean energy markets. Glob. Financ. J. 2024, 2024, 101046. [Google Scholar] [CrossRef]
- Diebold, F.X.; Yilmaz, K. Better to give than to receive: Predictive directional measurement of volatility spillovers. Int. J. Forecast. 2012, 28, 57–66. [Google Scholar] [CrossRef]
- Asadi, M.; Roudari, S.; Tiwari, A.K.; Roubaud, D. Scrutinizing commodity markets by quantile spillovers: A case study of the Australian economy. Energy Econ. 2023, 118, 106482. [Google Scholar] [CrossRef]
Disclaimer/Publisher’s Note: The statements, opinions and data contained in all publications are solely those of the individual author(s) and contributor(s) and not of MDPI and/or the editor(s). MDPI and/or the editor(s) disclaim responsibility for any injury to people or property resulting from any ideas, methods, instructions or products referred to in the content. |
© 2024 by the authors. Licensee MDPI, Basel, Switzerland. This article is an open access article distributed under the terms and conditions of the Creative Commons Attribution (CC BY) license (https://creativecommons.org/licenses/by/4.0/).