1. Introduction
Energy use control measures in the EU are enacted through directives, such as the updated Energy Performance of Buildings Directive (EPBD) [
1] and the Energy Efficiency Directive (EED) [
2]. These two key European energy directives are based on the premise that higher energy efficiency leads to lower energy demand and better environmental protection. Apart from reducing the energy demand, however, decarbonizing the energy supply may also be accomplished at the source of energy, which may be replaced with more sustainable alternatives. In this regard, the Renewable Energy Directive (RED) of the EU has set ambitious targets to increase the share of energy generated from renewable energy systems (RES) [
3].
In the case of the Small Island State of Malta and indeed many other Mediterranean cities, given that space for the implementation of large-scale RES projects is extremely limited, the adoption of RES systems in households plays an important role in contributing towards reaching the set targets. Apart from reducing the dependence on fossil fuels, a household RES allows EU citizens to profit from their renewable energy (RE) home installations, with the aid of fiscal support mechanisms. Additionally, while bringing the dwelling closer to near zero-energy status as required by the EPBD for new and renovated buildings, an RES improves the self-sufficiency rating of the dwelling. Lastly, to the benefit of society, jobs and new markets are created for the retail, installation, and maintenance of small-scale EE and RES technologies.
In line with the above, the main aim of this paper was to determine how commercially available RES technologies can be optimally implemented in different use-case scenarios for dwellings in large confined Mediterranean cities, taking Malta as a case study. Two main factors were considered to establish optimality, namely, energy yield and economic benefit. This paper presents the calculations of the energy output of different RES technologies for the case of Malta in the central Mediterranean, based on conditions relevant to each type of dwelling considered. Numerical models were generated to obtain economic parameters throughout the lifespan of different RES implementations in households. Information was gathered through a questionnaire to characterize the electricity and water heating demand in Maltese households and correlate these with factors such as occupancy and dwelling type. Lastly, sensitivity analyses were carried out on the various parameters which impact the energy yield and economic benefit of RES technologies in dwellings to identify the key factors that have a direct impact on the optimization of the energy yield and economic benefit of residential RES technologies in Malta.
2. Literature Review
Taking a look at the current literature available regarding RESs in households, it was noted how most studies focus on the simulation of specific configurations and their performance. This paper takes an innovative approach whereby a number of dwelling RES configurations are modelled to establish the factors that play a significant role in their performance, such as the impact of partial shading, fiscal incentives, orientation, and occupancy.
2.1. Environmental Factors and Dwelling Characteristics in Central Mediterranean Regions
The typical meteorological year (TMY) of Malta is representative of the climatic zone situation in central Mediterranean regions. As such, dwellings are generally designed and built similarly as well. A 2019 local study was set to establish the TMY for Malta by applying three different analytical methods. The analysis was carried out based on long-term solar radiation data gathered at the Institute for Sustainable Energy of the University of Malta (Marsaxlokk Campus), Malta, throughout the 11-year period (representative of one solar cycle) of 2007–2017. The three outcomes of the project were the TMY, the clearness index, and the diffuse fraction, which all varied slightly across the different methodologies applied [
4]. In this study, the 11-year averages of daily global solar radiation on the horizontal plane for each month serve as an indication, as seen in
Table 1.
A multidecadal report concerning the Maltese climate was published in 2022, covering an assessment based on weather data gathered in the period of 1991–2020. Central Mediterranean regions tend to be relatively warm, with alternating cycles of slightly cool and wet months followed by a prolonged period of hot and dry weather [
5]. Other environmental factors which may interfere with the performance of solar photovoltaics (PVs) and SWH are rainfall and snowfall patterns. While snow deposited on PV panels or solar collectors results in degraded performance due to less solar radiation making it through, rainfall can have a positive effect since it acts as a natural cleansing mechanism. In this regard, snowfall in Malta does not occur, and hence, its effect can be completely ignored. Rainfall, on the other hand, is not uncommon in the cooler period from September to March [
5], but this serves to keep the solar collectors and PV modules clean and operating at better efficiencies.
RES implementation in households depends on the building elements available, which vary for different dwelling types. It should be noted that even dwellings of the same type may vary significantly in terms of space available for RES implementation. Rooftops across all types of buildings in the region are flat, due to the general lack of snowfall. Therefore, the main constraints limiting the optimal utilization of RESs in households are potential shading from nearby buildings and orientation for the case of wall-mounted RE systems.
Terraced houses are undoubtedly the most spacious of the dwelling types being considered, consisting of multiple floors (normally ranging between two and three). The main difference from the rest stems from the fact that a terraced house is the sole owner of the building plot, whereas the other types of dwellings share the ownership of the plot and quite often the roof area as well. The only exception is when the building block has penthouses, in which case the roof would normally be owned by the penthouse [
6,
7]. Being so spacious, there are usually sufficient areas available in terraced houses for the implementation of RES technologies, be it on the roof, façade, front yard, backyard, and even balconies.
Making part of the ground floor segment of a building block, maisonettes in Malta tend to consist of one or two (in case of a duplex) floors. Older structures consisted of solitary maisonettes sharing the ground floor with another unit and having ownership of the roof space. In modern blocks though, with property development being a mainstream business venture, apartments and penthouses are being built above maisonettes [
8]. As such, the space available for the implementation of RESs in this dwelling type might include the façade, rooftop, balconies, and backyard.
Apartments are generally the most limited in terms of available area for installing RESs. In this case, the term “apartment” refers to middle-floor units, which do not have ownership of either the rooftop or backyard. Hence, the only space available for apartment buildings in relation to RESs are the balconies and the façade. On the other hand, penthouses, being the uppermost floor of a residential building block, usually also have ownership of the rooftop, as mentioned earlier [
7].
2.2. RES Technologies in the Residential Sector
Nowadays, the typical solar PV system used for households consists of several crystalline silicon-based PV modules connected in series [
9], with a maximum allowable peak power of 3.6 kWp per phase. Apart from the peak power, it is also important to consider a PV module’s power loss coefficient, which refers to the drop in efficiency to be expected from a temperature rise above the standard testing condition of 25 °C.
A study conducted in Malta set out to establish the relationship between different configurations of a 3 kWp household PV system and its energy generation capability. A solar PV setup inclined at 30° to the horizontal facing south results in the highest overall year-long total energy generation. However, other configurations coupled with different electricity consumption patterns may ultimately result in a higher income for the home owner [
10]. Apart from changing the configuration to optimize the performance of a solar PV system, nowadays, bifacial solar PV panels are also seeing wider application. This relatively new technology is penetrating the market due to its potential for an increased economic benefit resulting from higher energy yields. A case study in Poland has found that for similar insolation levels, a bifacial panel would produce 10% more electricity in high insolation conditions and 28% more electricity in low insolation (higher diffuse fraction) conditions, when compared to the same but monofacial setup [
11]. It is to be noted that the price for bifacial PV modules are currently on a par with monofacial panels, at least in Malta.
A quick look at the Maltese SWH market shows that single-glazed flat plate collector (GFPC)-type SWH systems are the prevalent technology, followed by the less common evacuated tube collector (ETC)-type systems. The literature indicates that the former is more adequate for heating water to temperatures ranging from 40 °C to 80 °C, whereas the latter can reach temperatures higher than 100 °C, if installed in optimal conditions [
12]. Hence, the commercial availabilities of both technologies, which are dependent on market need, may be considered as reflective of the domestic hot water (DHW) temperature requirements of Maltese households.
The effectiveness of an SWH installation in an adequate environmental setting depends on the characteristics of each component. Key factors include the transmissivity and reflectivity of the glazing, conductivity of the flow tubes and headers, absorptivity of the absorber, and the heat conduction properties of the insulation. A properly designed SWH system ensures that the solar radiation transmitted as well as the heat trapped within the collector box are maximized. Other important considerations are the insulation of the piping connecting the collector with the DHW storage tank along with the insulation of the tank itself. When compared to solar PV technology, SWH is generally cheaper to invest in while solar to thermal energy conversion efficiency is higher than solar to electrical energy conversion efficiency. Studies assign generic values of around 40–70% for the former and 17–20% for the latter [
13]; however this is subject to technological advancements.
Tests on air-source HPWH in Malta have found that the average coefficient of performance (COP) of a typical HPWH unit in wintertime is 2.75, leading to a reduction of up to 70% in electrical energy consumption when compared to a standard boiler utilizing electric resistance heating elements. The life cycle cost (
LCC) of HPWH was also found to be up to 1.5 times lower than the
LCC of mainstream electrical resistance water heaters (COP of 0.75–1) [
14]. Hence, the adoption of HPWH not only has the potential of being economically beneficial but might also offset a considerable amount of residential electricity consumption. Moreover, the EU Renewable Energy Directive (RED) 2023/2413 allocates part of the useful energy delivered by a heat pump as eligible renewable energy, according to specific equations and provided that the COP is larger than 2.875 [
15].
The relatively high COP is achieved given that the heat required is not being directly converted from another source of energy as in the case of electrical resistance heaters which convert electrical energy to heat energy. Contrarily, the working principle of HPWH is a reverse refrigeration cycle, in that the heat required is transported from the ambient air instead [
16]. Hence, the performance of air-source HPWH systems depends on the ambient air temperature, as this is a function of the thermal energy content in the ambient air. The higher the air temperature, the easier it will be for water to be heated to higher temperatures, i.e., the COP is higher. By referring to air temperature records, it can be noted that the ambient air temperature in Malta remains significantly above 0 °C in the winter period.
2.3. RES Technical Analysis Using Polysun
Polysun software has featured in various pieces of literature covering the technical analysis of RES systems in the household context. The most relevant studies found were in the form of simulations on existing buildings, optimal sizing exercises, and the simulation of combining technologies together to maximize natural resource use.
In a case study performed by M Żołądek et al., an existing roof solar PV system was modelled and analysed using Polysun [
17]. The study was conducted to establish how accurate the software is at calculating the electrical energy generation performance as well as to identify the optimal configuration of the panels for maximum energy yield. Results showed that the software underestimated the annual energy generation of the PV array by 6.2%. The simulation also allowed the researchers to pin-point three optimization steps that would improve the output of the PV system by 20–45% [
17]. The identification of these solutions was possible as the simulation accounted for the tilt angle of the PV panels, shading factor, and the diffuse components of the radiation incident on the PV cells.
Polysun is also applicable for simulating the combination of RES technologies. In an optimization study based on a single-family household in Finland, the combination of solar PV and HPWH was analysed. The software was used mainly to simulate the electrical generation of the PV system as well as the seasonal power consumption of the HPWH system. The latter was dependent on the setpoint temperatures inputted by the researcher, as well as the ambient temperature of the building. The optimization factor was the regulation of the HPWH power source, depending on the power output of the solar PV system inverter [
18]. The software enabled the simulation of different scenarios of regulation types, and the results were compared to establish the variation from the baseline setting.
There are also studies concerning SWH analysis for the supply of DHW. A study conducted in China considered the global solar irradiation levels and the outdoor ambient temperature as the two most influential parameters affecting the performance of SWH systems. These therefore served as the two main input factors in the simulation performed using the Polysun software. The aim of the project was to vary the SWH collector size so as to obtain the best solar fraction (SF), which may be defined as the component of the total energy required to heat the DHW being fulfilled solely by solar radiation energy. This value was a direct output of the simulation and depended (to a smaller extent than the collector area) on the tilt angle and buffer volume of the DHW storage tank [
19].
2.4. Economic Analysis of Residential RES
In the context of Maltese dwelling RESs, economic viability may be attained by satisfying either or both of the following conditions:
All the revenue generated by selling the energy to the national grid, at a feed-in tariff set by local policies, is greater than the costs incurred to set up and maintain the installation throughout its lifespan. A typical example would be the application of a feed-in tariff to all the energy generated from a rooftop solar PV system.
The energy generated by the installed RES technology results in a respective cumulative saving that is greater than the costs incurred to set up and maintain the installation throughout its lifespan. This saving is usually attained by offsetting the energy source. Examples include making direct use of solar energy converted from solar PVs (self-consumption) and SWH, or else making use of HPWH to offset the electrical energy consumption of an electric resistance boiler.
The transition from fossil fuels to cleaner energy sources can be facilitated when the levelized cost of energy (
LCOE) of the various renewable energy systems is favorable. The
LCOE refers to the life cycle cost incurred for generating a unit amount of energy, normally expressed as [EUR/kWh] [
20], and is used across the literature for economic comparisons between RESs and conventional energy generation methods [
21]. The
LCOE indicator is derived directly from the life cycle costing (
LCC) of an RE project; refer to Equation (1).
In the context of RE generation systems, the
LCC is the total discounted cost to procure, install, operate, and maintain the system throughout the lifetime of the project [
22]. This is different from life cycle analysis, which is not considered in this paper. Life cycle analysis takes into consideration all energy aspects of the project from cradle to grave, including the mining, manufacturing, transporting, using, maintaining, recycling, and scrapping of the product.
Apart from the
LCC and
LCOE, three other economic indicators are commonly used to determine financial feasibility, namely, the net present value (
NPV), the payback period (
PBP), and the internal rate of return (
IRR). In fact, all these parameters feature as key premises for financial analyses in studies concerning solar PV installations in residential buildings [
23]. In this case, these are defined as follows:
NPV: The summation of all cash inflows and outflows throughout the project’s lifetime, discounted to the present and accounting for the time value of money; refer to Equation (2). A positive value means the project is indeed profitable.
where
N is the lifetime of the project in years,
Cn is the annual cash flows in EUR (positive means inflow, negative means outflow),
r is the discount rate, and
n is the current year.
PBP: Can either be simple or discounted. Refers to the time taken (usually in years) for the RES project to generate enough cumulative revenue to break even with the capital and operational costs incurred. The discounted
PBP accounts for the time value of money, whereas simple
PBP considers only the current value of money; refer to Equations (3) and (4), respectively.
where
SPBP is the simple
PBP,
I is the initial investment cost in EUR,
Rn is the annual cash inflows (from energy revenue or savings) in EUR,
n is the current year,
DPBP is the discounted
PBP, and
r is the discount rate.
IRR: The discount rate at which the
NPV at the end of the project’s life cycle is 0 (no profit or loss); refer to Equation (5). This gives an equivalent percentage interest rate for the investment over its lifetime.
where
N is the lifetime of the project in years,
Cn is the annual cash flows in EUR (positive means inflow, negative means outflow),
r is the discount rate, and
n is the current year.
The discount rate plays a major role in evaluating financial feasibility. From estimates generated with regards to applicable discount rates for renewable energy projects, it was found that the relevant mean weighted average cost of capital (WACC) in OECD countries is 5.4% [
24]. The WACC may be taken as the discount rate for the purposes of an economic analysis, as it is an indicator of the time value of money across future cash flows.
The Renewable Energy Directive (RED) was already mentioned as the target-setter for EU member states with regards to the implementation of RESs [
15]. Member states are required to produce National Energy and Climate Plans (NECPs) as well as National Renewable Energy Action Plans (NREAPs) to monitor their progress. With reference to the latest issues of Malta’s NECP and NREAP, the most relevant measures enacted with respect to this study are the fiscal support schemes laid out for residential solar PV, SWH, and heat pump water heaters [
25]. Upon observation, it can be noted how the reformed schemes of 2021, which have been renewed in 2023 and continued in 2024 [
26], target all three RES technologies being considered in this study. With regards to solar PV, the support scheme has also been extended to hybrid inverters and battery storage add-ons for the first time.
The active schemes help to drive investment in renewable energy systems and bridge the gap between the higher costs required for acquiring such renewable energy products and the current business-as-usual fossil-fueled electrical energy tariffs. Hence, RES economic analyses performed in the Maltese residential context should take the available grants and incentives into consideration for results to be realistic. The following is a description of the currently active schemes which are relevant to the study:
- o
PV system with standard inverter: Capital grant, where applicants benefit from a 50% refund of the cost incurred to procure the PV system, at a rate of EUR 625/kWp, up to EUR 2500. All energy fed to the national grid is sold at a feed-in tariff of EUR 0.105/kWh, with a maximum of 1600 kWh/kWp/annum for a period of 20 years.
- o
PV system with hybrid inverter: Capital grant, where applicants benefit from a 50% refund of the costs incurred to procure the PV system, at a rate of EUR 750/kWp, up to EUR 3000. All energy fed to the national grid is sold at a feed-in tariff of EUR 0.105/kWh, with a maximum of 1600 kWh/kWp/annum for a period of 20 years.
- o
Hybrid inverter and battery system: Capital grants, where applicants benefit from an 80% refund of costs incurred to procure the hybrid inverter and battery system at a rate of EUR 450/kWp, up to EUR 1800 and EUR 600/kWh, up to EUR 3600, respectively.
- o
Battery system: Capital grant, where applicants benefit from an 80% refund of costs incurred to procure the battery system at a rate of EUR 600/kWh, up to EUR 3600.
- o
Feed-in tariff: No solar PV system capital grant benefit; however, all energy fed to the national grid is sold at EUR 0.15/kWh, with a maximum of 1600 kWh/kWp/annum for a period of 20 years [
28].
Solar Water Heaters (SWHs): Capital grant, where applicants benefit from a 75% refund of the costs incurred to procure and install the SWH unit, up to EUR1400. Another capital grant is available, covering maintenance costs incurred throughout the first 5 years of the installation, up to EUR500 [
29].
Heat Pump Water Heaters (HPWHs): Capital grant, where applicants benefit from a 50% refund of the cost incurred to procure and install the HPWH unit, up to EUR 1000 [
30].
3. Materials and Methods
The methodology of this study was initiated with the preparation and delivery of a questionnaire, the responses of which were used in the subsequent analysis phases. The aim of this questionnaire was to collect data pertaining to the usage of energy and application of RES technologies in Maltese dwellings in addition to identifying the type of dwellings and the size (occupancy) of households. The data collected served only as supportive indicators to already existing data from the national census of population and housing 2011 (as the 2021 census was not available yet during the time of the study). Demographic representation was not considered relevant to this study given that Malta is a very small island totaling 320 km2 with no microclimates and the population is considered to be homogeneous across the whole country.
The selection of RES technologies to be considered in the study was based on several factors, with the most important being applicability and commercial viability. The three technologies selected were solar photovoltaics (PVs), solar water heating (SWH), and heat pump water heating (HPWH). These are also considered to be the fastest technologies that can accelerate energy efficiency and increase the renewable energy share within a short span of time and with least inconvenience for their installation. Electrical energy storage was also featured as a supportive technology to RESs in the latter stages of the sensitivity analysis. For clarity, the paper reiterates the importance of applying the Energy Efficiency First Principle, through the optimization of passive measures applied to the building envelope before resorting to renewables. Nevertheless, it has already been demonstrated that the application of renewable energy systems in dwellings has the largest impact on reducing the carbon footprint, due to the abundance of solar energy and the moderate ambient temperatures that facilitate the high performance of heat pump water heaters.
Subsequently, the types of dwellings to be considered were selected. Since the work looks at RES implementation in the practical sense, it was deemed appropriate to only consider the prominent types of households. Based on the Malta Census of Population and Housing of 2011, 93.3% of the island’s residential building stock comprises terraced houses, maisonettes (lower floor apartment with own private entrance), flats, and penthouses (top floor apartment with full roof ownership) [
31]. The dominance of flats and penthouses continued in the 2021 census results with 48.4% being flats and penthouses, followed by maisonettes (23.9 per cent), and terraced houses (22.7 per cent) [
32]. Hence, these four types of dwellings were selected for consideration in the project.
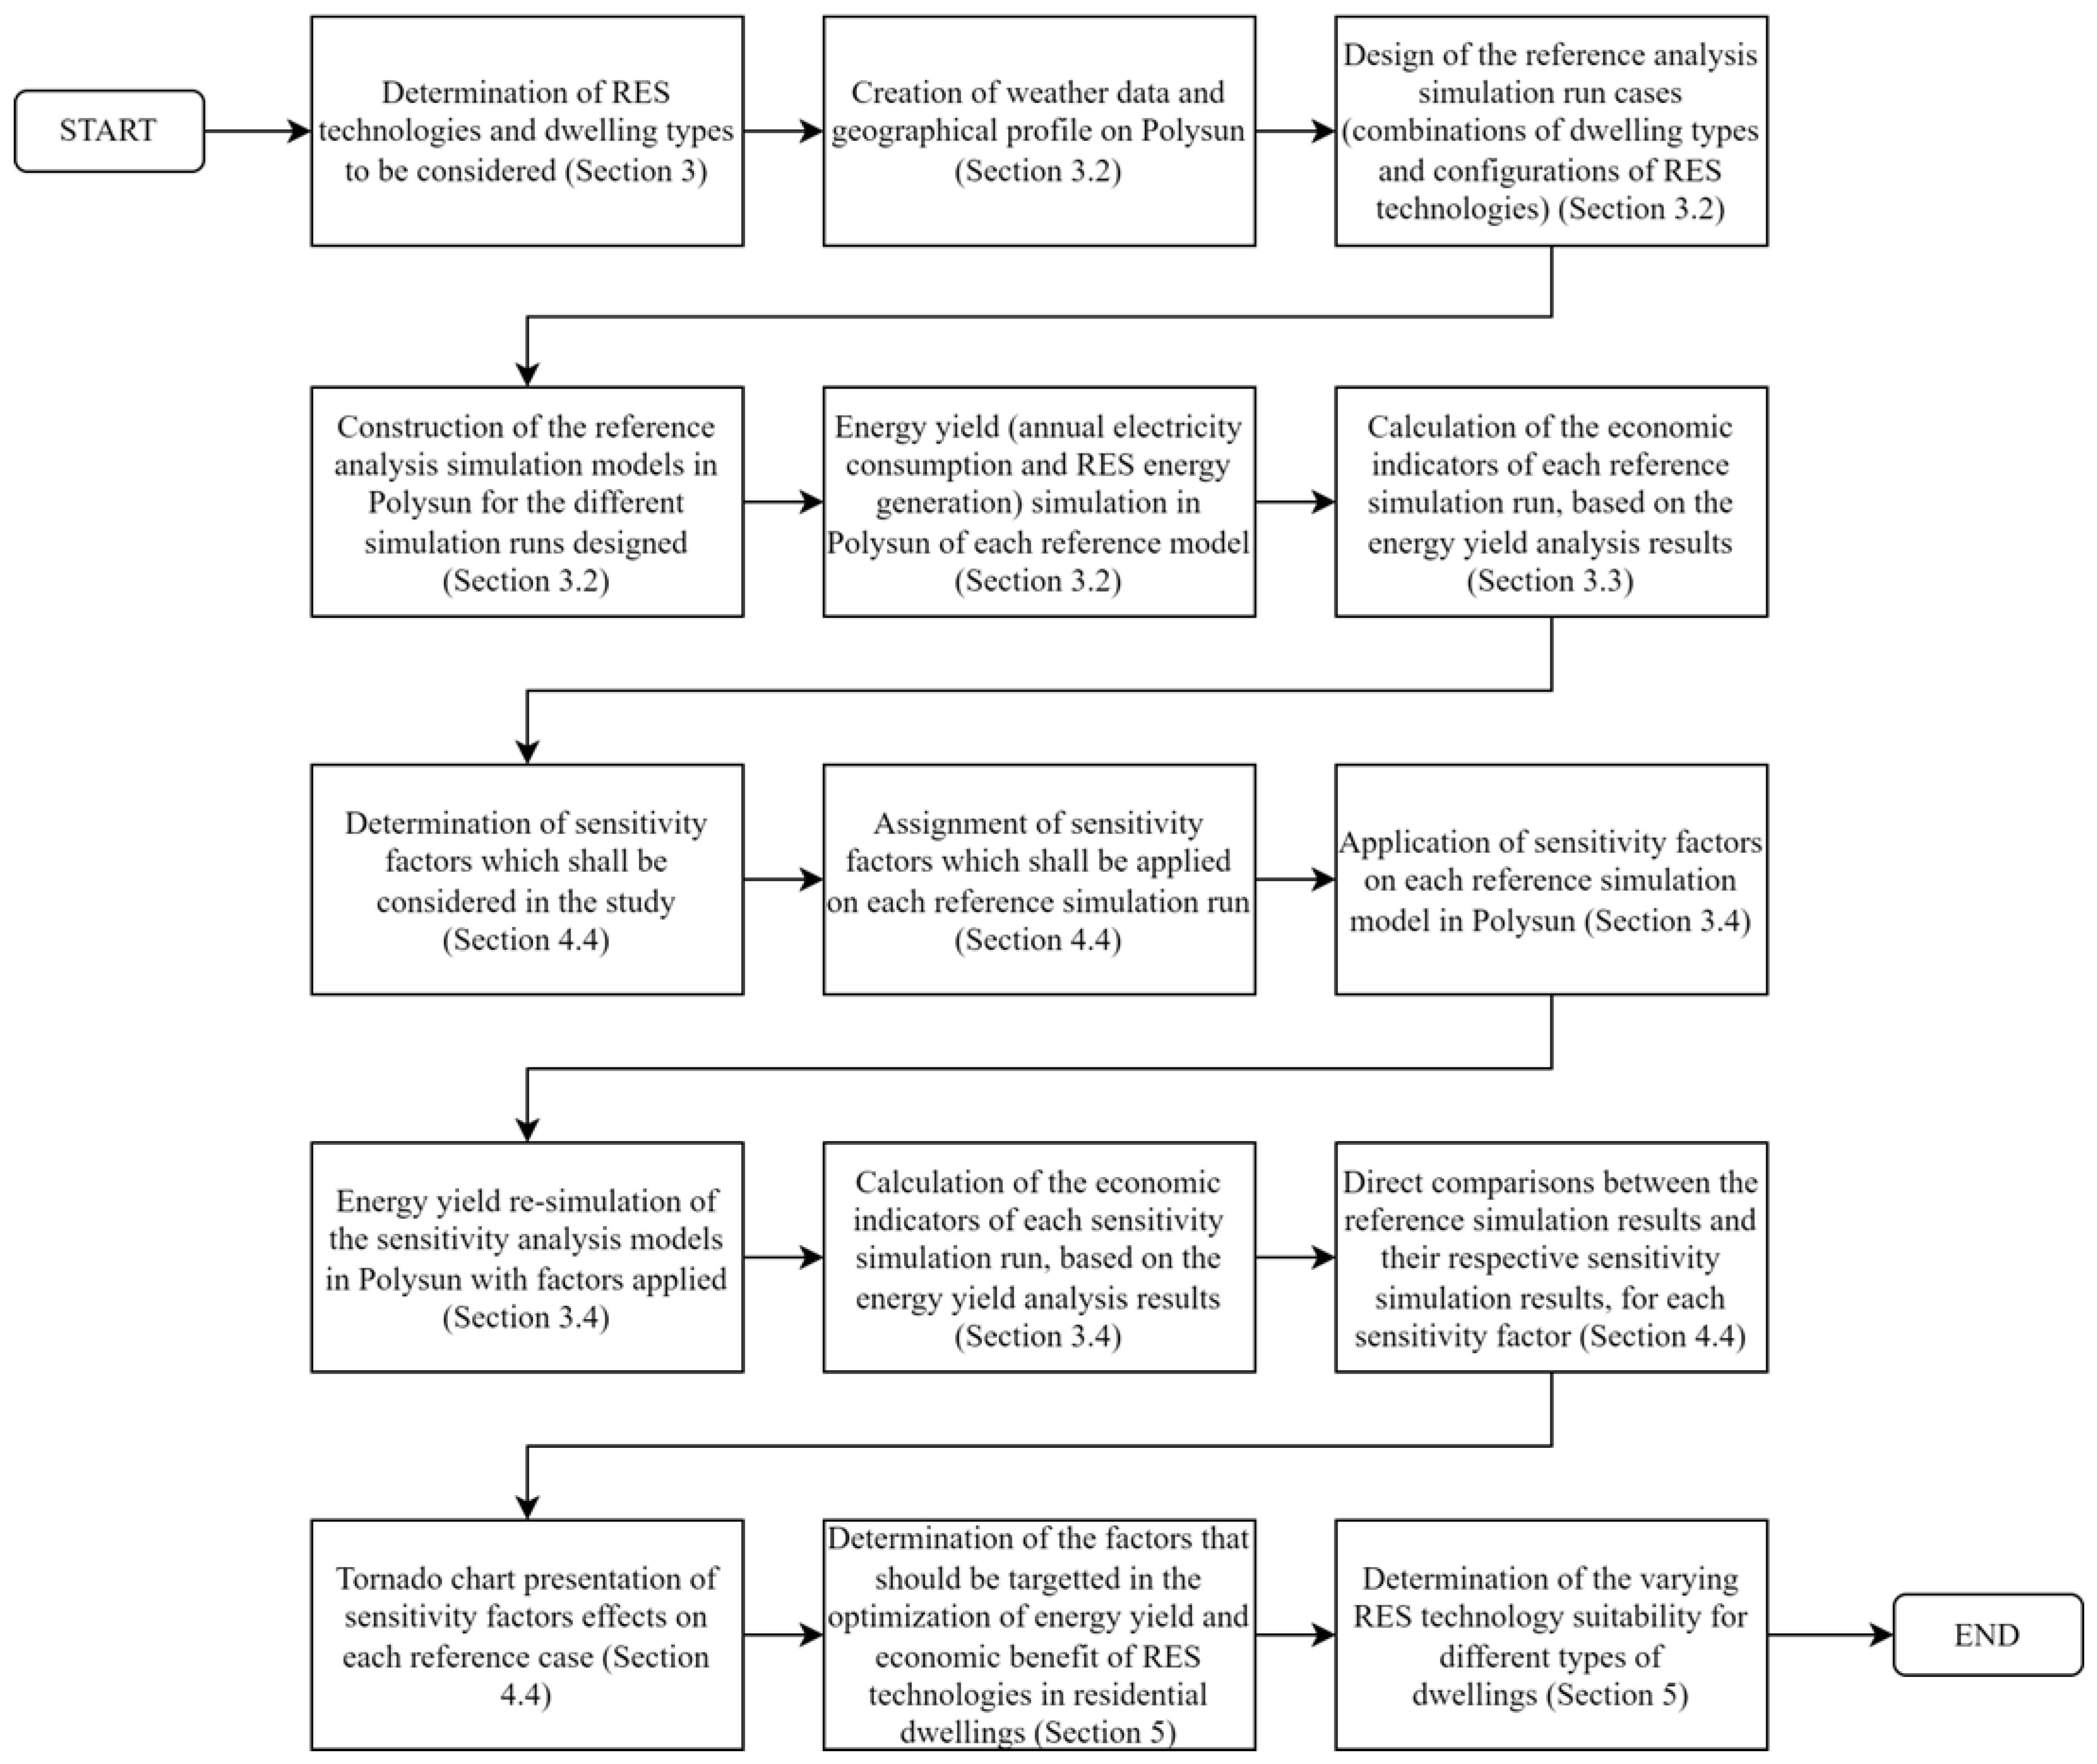
The analysis was divided into three main sections: the energy yield analysis, the economic benefit analysis, and the sensitivity analysis. The analyses were conducted through the application of a software package, Polysun, which is dedicated to modelling RES technology technical performance.
Figure 1 summarizes the complete methodology applied throughout the study.
The principal criterion driving the selection of the software was adequacy rather than complexity, which depends on the list of available functions, and the required data to perform the analysis and generate results. The ideal software for this project was to have the minimal number of functions to generate an acceptably accurate result for the yearly RES performance of the systems being considered. The next criterion was the need for the software to appropriately analyse diverse renewable energy systems to a sufficient level of detail. For example, solar PVs and SWH require further detailing compared with HPWH to analyse since their performance depends on a larger number of factors, and hence, the analysis is more complicated to generate.
Given the nature of the application, the software was required to generate the RES analysis in the context of a residential building model. From reviews and accuracy analysis studies conducted on RES simulation tools, two software were identified as promising, RETscreen v9.0 and Polysun v2022.8 [
33]. Apart from these, DesignBuilder v7.0.2.004 was also considered as it has proven to be an effective tool in the energy analysis of buildings, albeit not being dedicated for planning implementation of RES [
34].
Table 2 summarizes the selection criteria along with the software candidates. The complexity of RETScreen and Polysun was set as “medium” given these both require the user to input a larger series of parameters which have a direct impact on the generated result. Hence, they require the user to have a deeper understanding of what role each input plays in the simulation calculations performed by the software.
Based on the research conducted, Polysun [
33] was deemed highly adequate for the purposes of the study. The software is the only one considered out of the three that is capable of simulating the technical and economic performance of all three RES technologies considered in the study. It also allows for the simulation of shading impact on solar RESs, and can simulate a combination of RES technologies. Although the software was deemed adequate, it does not mean it comes without limitations. From literature findings, the software was reported to impose direct restrictions on the maximum volume of DHW storages as well as the maximum heat transfer coefficient of heat exchangers [
35]. However, these restrictions did not impact the simulations planned to achieve the purpose of the study.
3.1. Data Collection
Given the lack of specific data on the use of renewable energy in dwellings, a questionnaire was devised to collect an indicative set of data on salient inputs that are required for the study. For example, the average number of occupants and the average energy consumption per dwelling type were needed, which together with other available data, were used to run the Polysun software. Although the questionnaire was not representative of the whole population, the scope here was to converge to reasonable figures that can be correlated to previous old publications to ensure that the results represent current trends. The demographic factors for this study were not of particular concern because Malta is a very small country and dwelling types are homogenous across the different regions when it comes to lifestyles and energy consumption.
In the survey, the questions presented requested the participant to disclose the following:
Type of dwelling they live in.
How many occupants live in the dwelling.
The electricity consumption (as seen in their bi-monthly bill).
Presence of solar PV in the dwelling.
How water is heated (electric boiler, gas boiler, SWH, or HPWH).
Usage pattern of water heating system throughout the different seasons of the year.
The questionnaire was distributed as randomly as possible and focused on gathering data from all types of dwellings considered at the time of the study. The survey was made publicly available in an online Google form format through multiple platforms, namely, social media, email, and word of mouth. Participants were informed on the subject matter through an introductory and informed consent letter and the responses remained anonymous, given that no personal information was collected. Each question presented was supported by brief explanations as to what was required from the respondents. The average electricity consumption and average occupancy level values used throughout the technical and economic analyses were derived directly from the responses collected. Correlations were also made between the dwelling type, presence of RES in dwellings, occupancy levels, as well as the electricity consumption. The questionnaire was duly approved by the University’s Ethics Board and holds reference number ENG-2022-00057. The survey can be accessed directly to view the full set of questions presented to participants in
Supplementary File S1. The questionnaire responses were inputted and converted into values in MS Excel
TM v2210 and statistically analyzed using graphical representations.
3.2. Energy Yield Analysis
Multiple iterations of technical analyses were performed, each time considering different configurations of RES technologies. Location and weather data were required by the software to characterize the site being studied. The location was set as Mosta (35.912° N, 14.421° E), one of the largest towns, as it lies approximately at the centre of the Maltese archipelago, which spans only 27 km. The weather data were obtained from the study mentioned previously [
4], which established the typical meteorological year (TMY) for the Maltese islands. The different configurations were reflective of the practicality in implementing different RES technologies in the types of dwellings being considered.
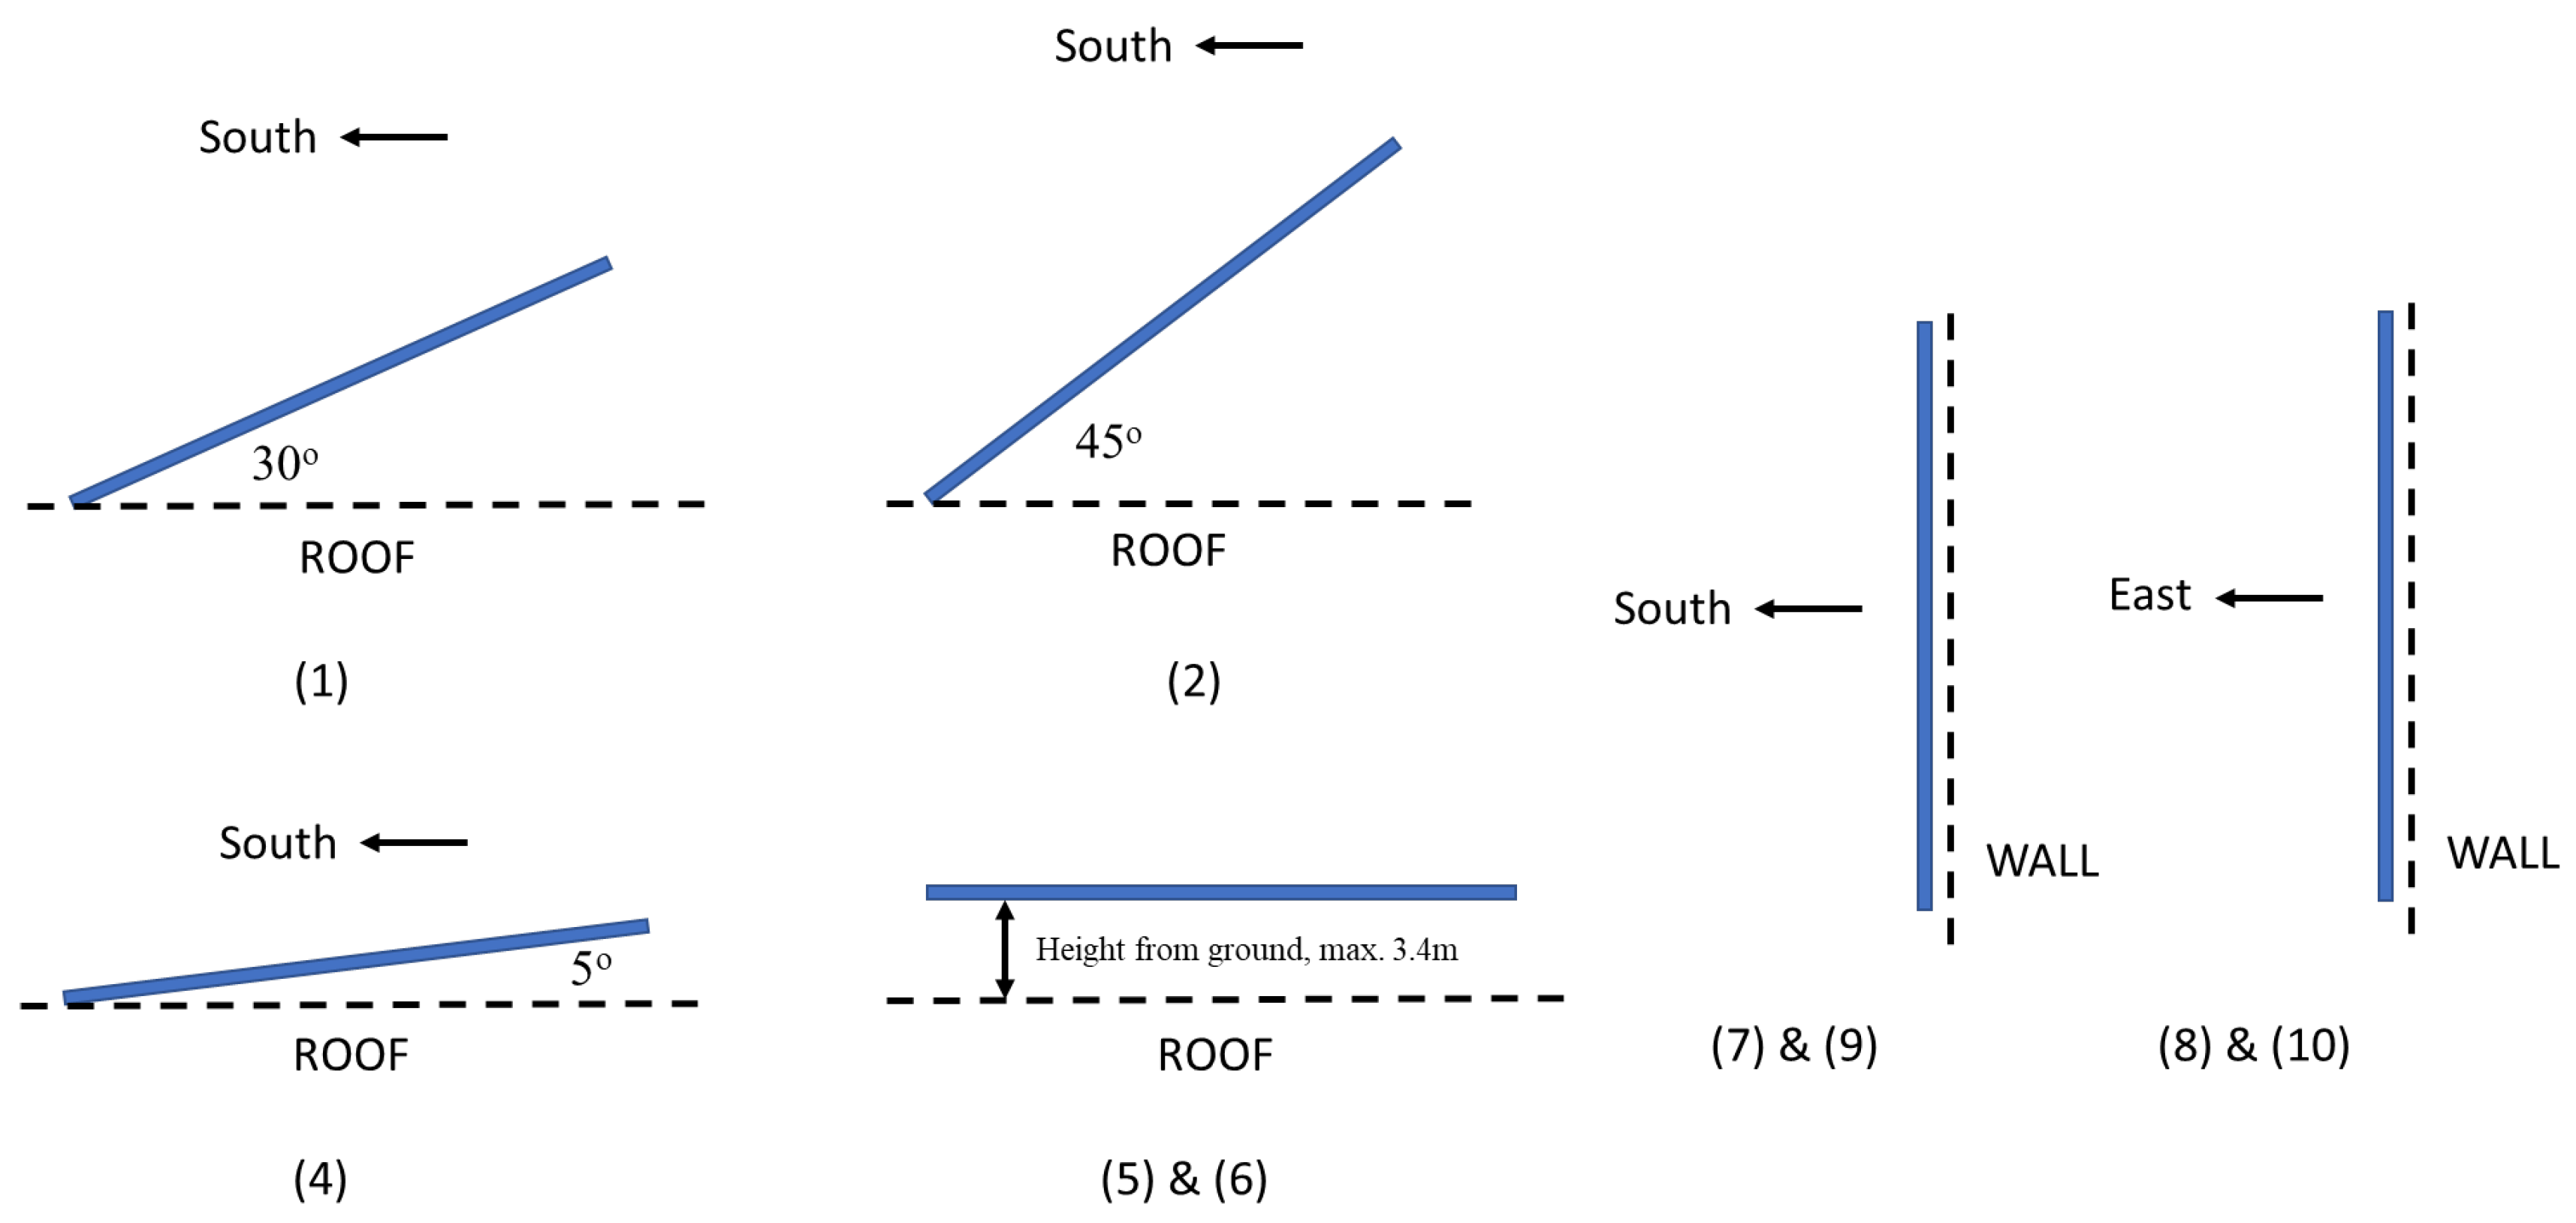
Table 3 summarizes the simulation runs conducted. It should be noted that this set of simulations was considered as the reference case throughout the rest of the study. The “key characteristics” were chosen for each type of dwelling based on the optimal configuration and the expected or acceptable method of renewable energy installation, taking into consideration existing regulations and spatial planning restrictions.
Figure 2 illustrates the positioning of the solar PV and SWH collectors with reference to the configurations described above.
Simulation Software Methodology and Considerations
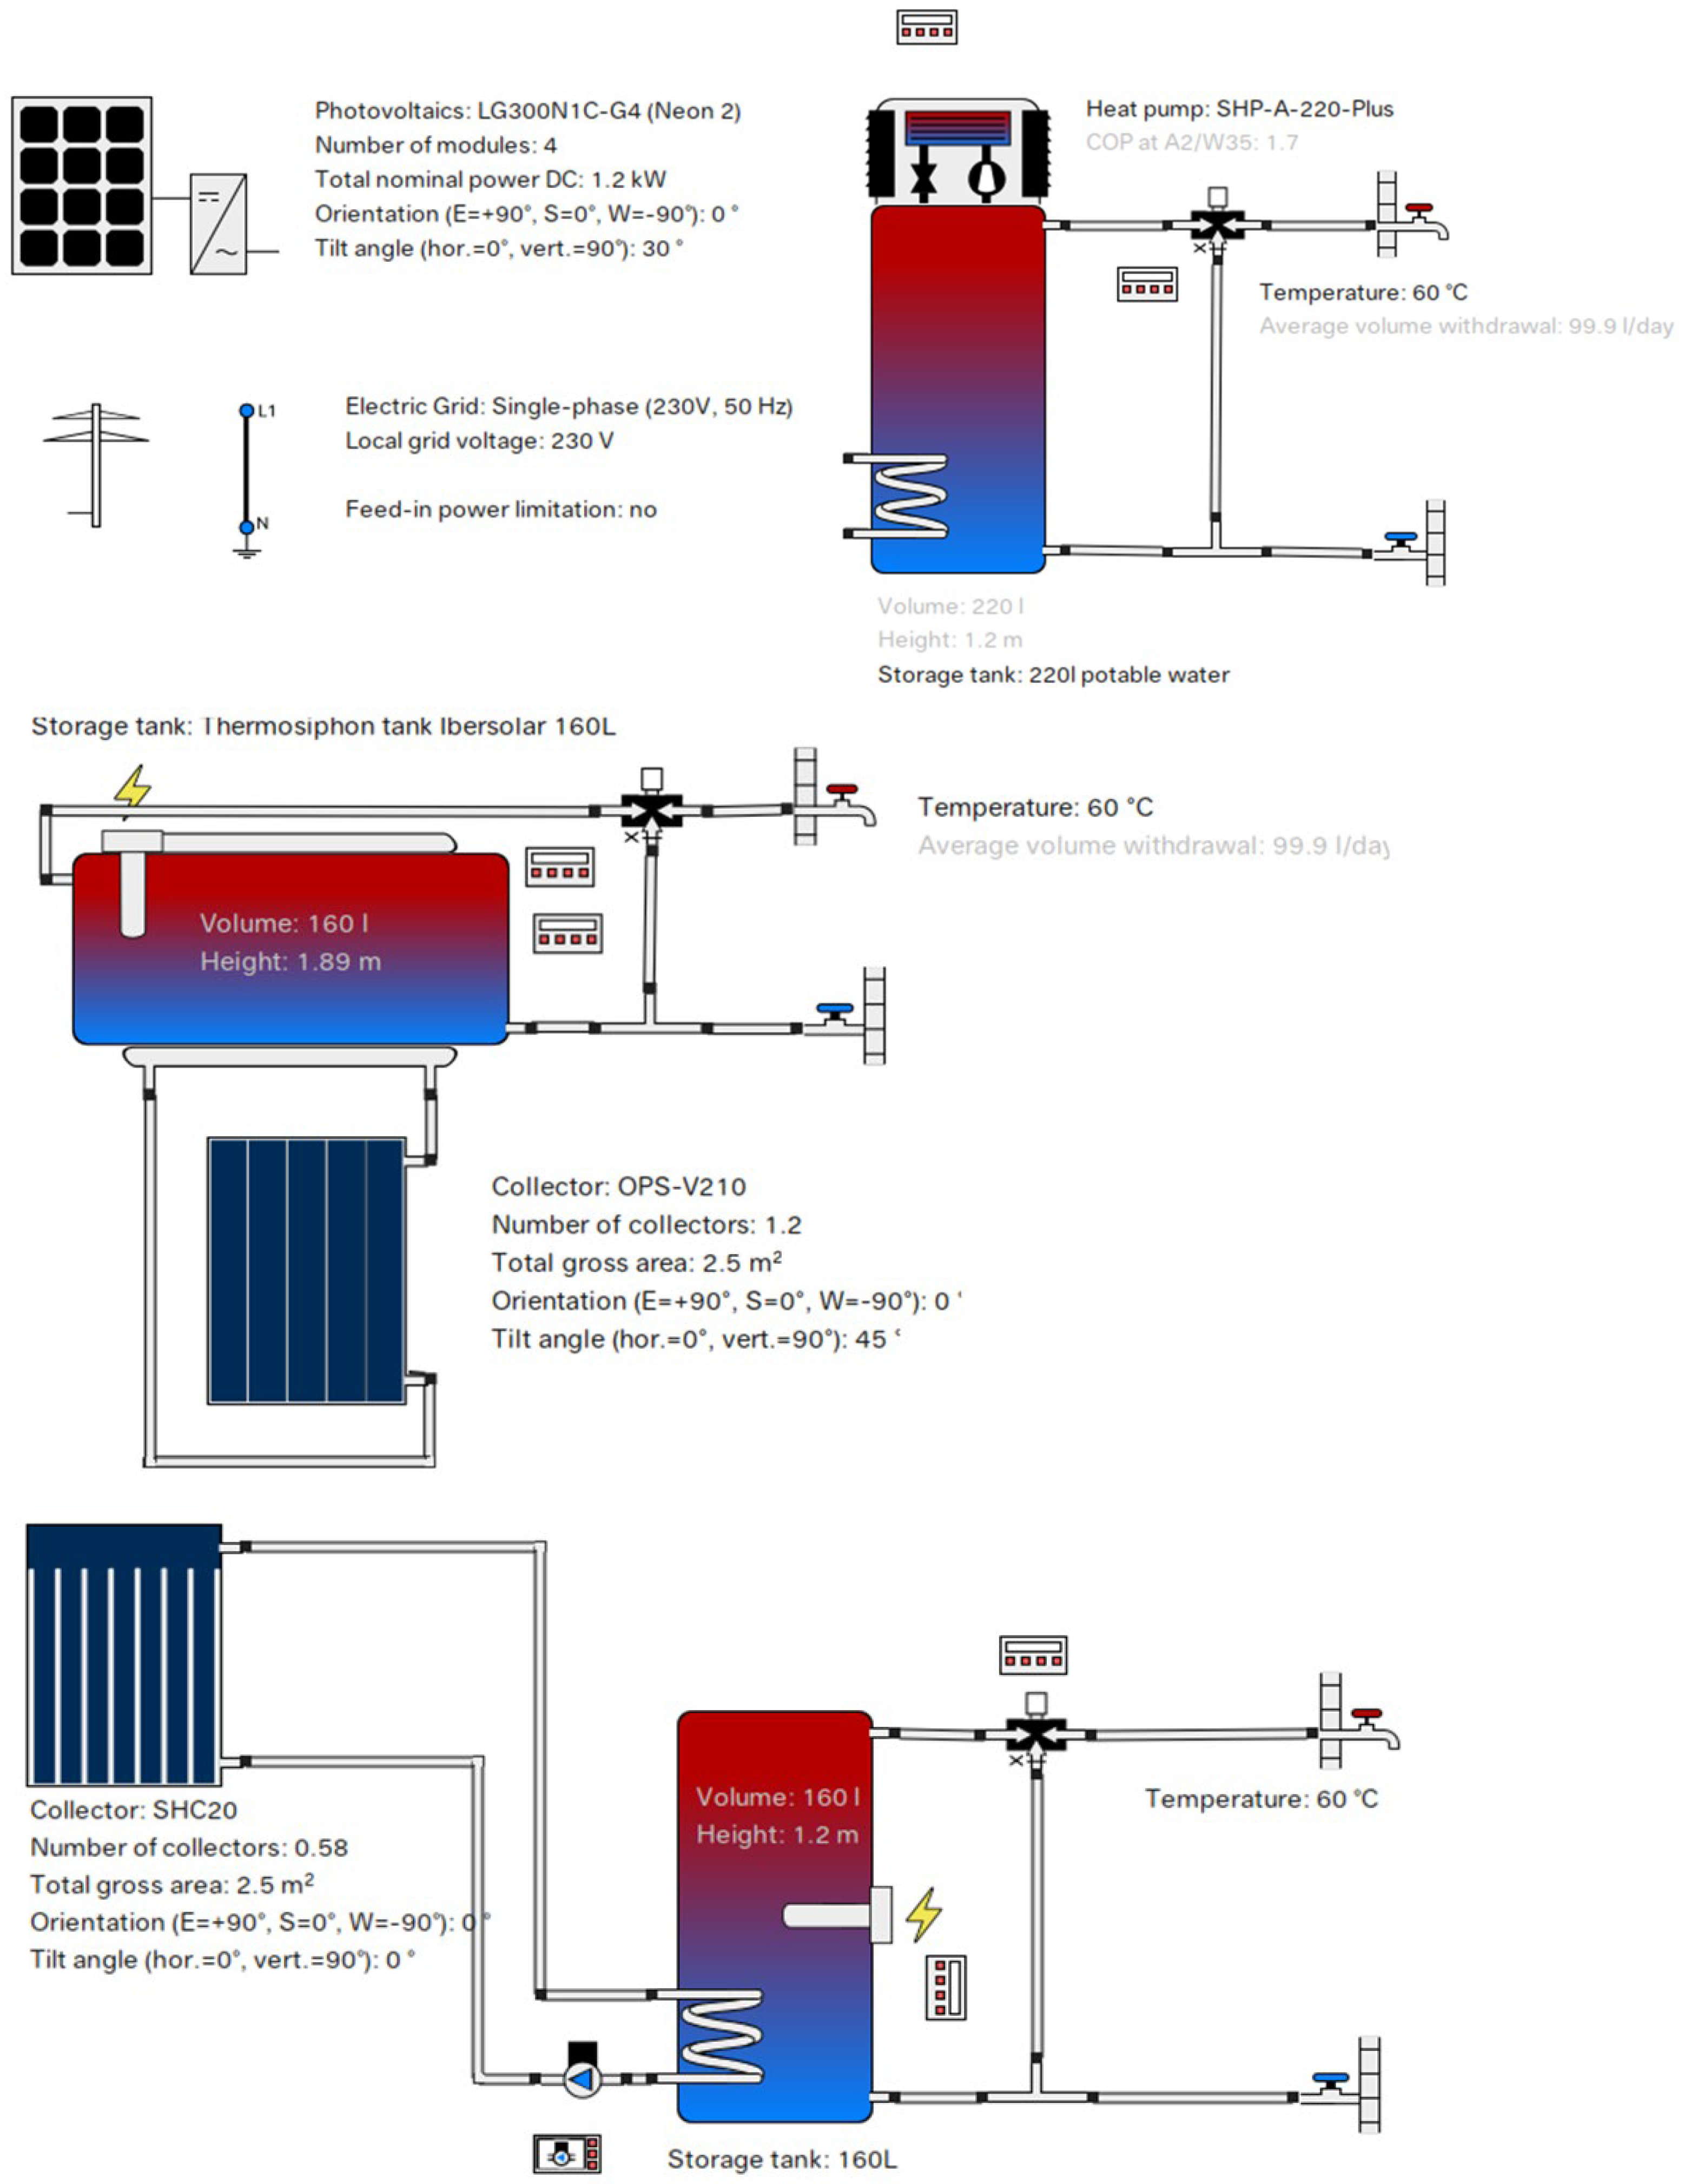
Being the software of choice, the formulation of the project methodology had to account for the methodology of Polysun as well. Polysun makes use of several input parameters to generate a set of energy characteristics across a period of one year for the RES setup modelled. These inputs were categorized into three sections, the RES unit model, the residential system, and the ambient conditions. For each RES technology analysed, Polysun required information regarding the specific model to be studied. Hence, a reference model selected from commercially available units in Malta was assigned for each respective simulation type; refer to
Table 4. The selection of each model was applied based on the typical technical characteristics of installed RES technologies in dwellings.
The characteristics of each reference model were necessary as input to the model in the Polysun software and the subsequent calculation of the energy yield. These attributes were kept constant across different analyses performed for each RES technology. For instance, different solar PV configurations were modelled using the same PV module array characteristics. Likewise, SWH and HPWH technologies were modelled with a set of common features. The inlet cold water temperature specified for the Polysun software was assumed to be the mean annual sea water temperature, which is 20 °C [
5]. Additionally, the average occupancy across the various types of dwellings being studied was determined as 3.39 occupants per household, extracted from the questionnaire responses. Hence, at a typical rate of 30–40 L/day/occupant residential hot water consumption in Malta [
40], the total average DHW consumption for each dwelling was taken as 120 L/day for the months of January to May and October to December. The summer months of June to September were simulated with a lower daily average DHW consumption of 60 L/day due to the relatively warmer weather. The simulation models were built as stand-alone systems as would be found in dwellings.
Figure 3 shows simulation model examples generated on Polysun for each of the different RES technologies considered.
Apart from the reference models, the results obtained were also highly dependent on the weather data. Polysun requires six specific meteorological parameters to characterize the natural phenomena driving the performance of RES technologies, namely: Global Horizontal Solar Radiation (Gh) [W/m
2], Diffuse Horizontal Solar Radiation (Dh) [W/m
2], Long Wave Solar Radiation (Lh) [W/m
2], ambient temperature (Tamb) [°C], Wind Speed [m/s], and Relative Humidity [%]. All these parameters, excluding Lh, were available for the typical meteorological year (TMY) of Malta and, as such, were used to build the weather profiles considered in the analysis. Throughout the software orientation stage, it was found that Lh had a negligible effect on solar PV and SWH simulations. This could possibly be attributed to the fact that glass covers used in the reference models block long wave radiation completely. Hence, the values of Lh generated within Polysun using Meteonorm [
41] data for Malta were deemed as a satisfactory substitute.
Rooftop installations, as in the case of terraced houses and penthouses, were deemed flexible enough to allow the RES designer to circumvent shading impact across the whole year. On the other hand, backyard RESs in maisonettes and façade installations for apartments were modelled to receive direct solar radiation for only four hours per day of the year in the reference scenario. This meant that for the remaining period of sun hours, the radiation incident on PV and SWH collectors was entirely made up of the diffuse component. Hence, the weather file global radiation parameters were equated to the diffuse radiation values for every hourly record, excluding those four hours of high solar elevation. The modification is based on the premise that during this period of the day when the sun is highest in the sky (10:00–14:00), it is generally less likely for shading to occur.
3.3. Economic Benefit Analysis
The approach for determining the economic feasibility of the simulation runs was based on well-known methodologies as explained in
Section 2.4, namely the discounted life cycle cost (
LCC), levelized cost of electricity (
LCOE), net present value (
NPV), discounted payback period (
PBP), and internal rate of return (
IRR). A lifetime of 20 years was considered for each RES configuration while accounting for procurement, installation, maintenance, and replacement costs throughout this period. The methodology adopted depended on the type of RES technology being analysed, as seen in the following sections. A safe and typically used discount rate of 6% was taken across the entire economic analysis, based on the relevant literature concerning RES projects in European countries [
42].
3.3.1. Solar PV Economic Analysis
In Malta, energy storage and self-consumption of solar PV-generated electricity is uncommon. As such, the standard case on which the calculation of the economic parameters was based refers to dwellings which feed all the electricity generated to the national grid operator (Enemalta Plc, Marsa, Malta). Two sets of parameters were obtained for each configuration, depending on the fiscal support mechanism opted for by the investor. Existing schemes allow investors to opt for either a capital grant combined with a EUR 0.105/kWh feed-in tariff, or else a EUR 0.15/kWh feed-in tariff by itself, applicable across a period of 20 years of operation.
Since solar PV systems are intended to generate electricity, their economic analysis also included the calculation of the LCOE for each configuration simulated. With reference to the calculated economic parameters, the financial feasibility ultimately depended on the amount of electricity generated from each configuration as determined by Polysun. A comparison with a reference case is required to establish the economic benefit. With regards to solar PV, this reference scenario is simply no renewable energy generation, and thus, zero annual revenue.
3.3.2. SWH Economic Analysis
With regards to SWH technologies, two types of RES systems were considered for water heating purposes, GFPC and ETC systems. While the relevant grant is applicable to both technologies, costs vary, with ETC technology being generally slightly more expensive. As such, this was considered in the calculation of economic parameters for SWH systems.
The economic benefit of SWH systems stems from the energy savings experienced, rather than direct renewable energy production as in the case of solar PV systems. The amount of energy saved depends on the solar fraction (SF), which indicates the portion of the energy required to heat the DHW that is fulfilled by solar radiation. This figure is one of the main outputs of the Polysun SWH simulations and, thus, was referred to directly from the system results for each configuration considered. The establishment of financial feasibility was conducted against a reference case where a typical electrical resistance water heater is used, given that studies have shown this to be the most prominent technology used to heat domestic water in Malta [
43].
In order to calculate the savings from using less electricity, the electricity tariff for the average Maltese dwelling was obtained using the data gathered from the questionnaire. First, the yearly average electricity consumption for each type of Maltese dwelling was calculated. Upon observation, these were deemed to be relatively close to one another, and as such, a correlation between type of dwelling and electricity consumption pattern was not necessary. Therefore, the global average consumption was calculated to be 5572 kWh/year and referenced throughout the analysis. The two relevant residential cumulative consumption tariff bands could then be identified as those seen in
Table 5 [
44].
By applying a weighted average calculation, the electricity tariff for the resulting consumption value was found to be 0.1208 EUR/kWh. The multiplication of the energy saved (kWh) as obtained from the respective SWH and HPWH simulations in Polysun by this rate (EUR/kWh) yielded the expected savings (EUR) for each respective case scenario.
Another variation from solar PV systems is the requirement for replacing the GFPC or ETC units throughout the lifetime of their application. While solar PV systems are normally guaranteed or expected to last for at least 20 years, SWH units are typically replaced every 10 to 15 years, as observed by local retailers. In this study, a replacement cost accounting for decommissioning of the old system, along with procurement and installation of the new system, was considered at the 11th year of the economic analysis.
3.3.3. HPWH Economic Analysis
HPWH technology was treated in a similar manner as SWH technology for the purposes of the economic analysis. As such, the appropriate set of costs (apart from grants) was considered, with a single replacement being made at the 11th year of the unit lifetime. Maintenance costs refer directly to air filter cleaning or replacement and were taken as lower than for SWH systems. As with the rest of the analysis, decisions pertaining to costs along with maintenance and replacement requirements were made with reference to prices and recommendations from various local retailers.
3.4. Sensitivity Analysis
The last step of this study involved a sensitivity analysis to further determine the influence of specific factors on energy yield and economic feasibility, as well as to explore potentially better configurations. In this case, the methodology was categorized by a sensitivity parameter. It should be noted that due to the variety across household RES configurations, the decisions pertaining to modified factors were made on a case-by-case basis. Hence, some sensitivity simulation runs on particular parameters were common across a number of configurations, while others were deemed applicable to only a single reference case. A sensitivity analysis was conducted for each of the following: shading, fiscal support mechanisms, discount rate, electricity export and consumption tariff rates, solar PV bifacial technology, solar PV self-consumption with energy storage, SWH collector area, and outdoor HPWH systems.
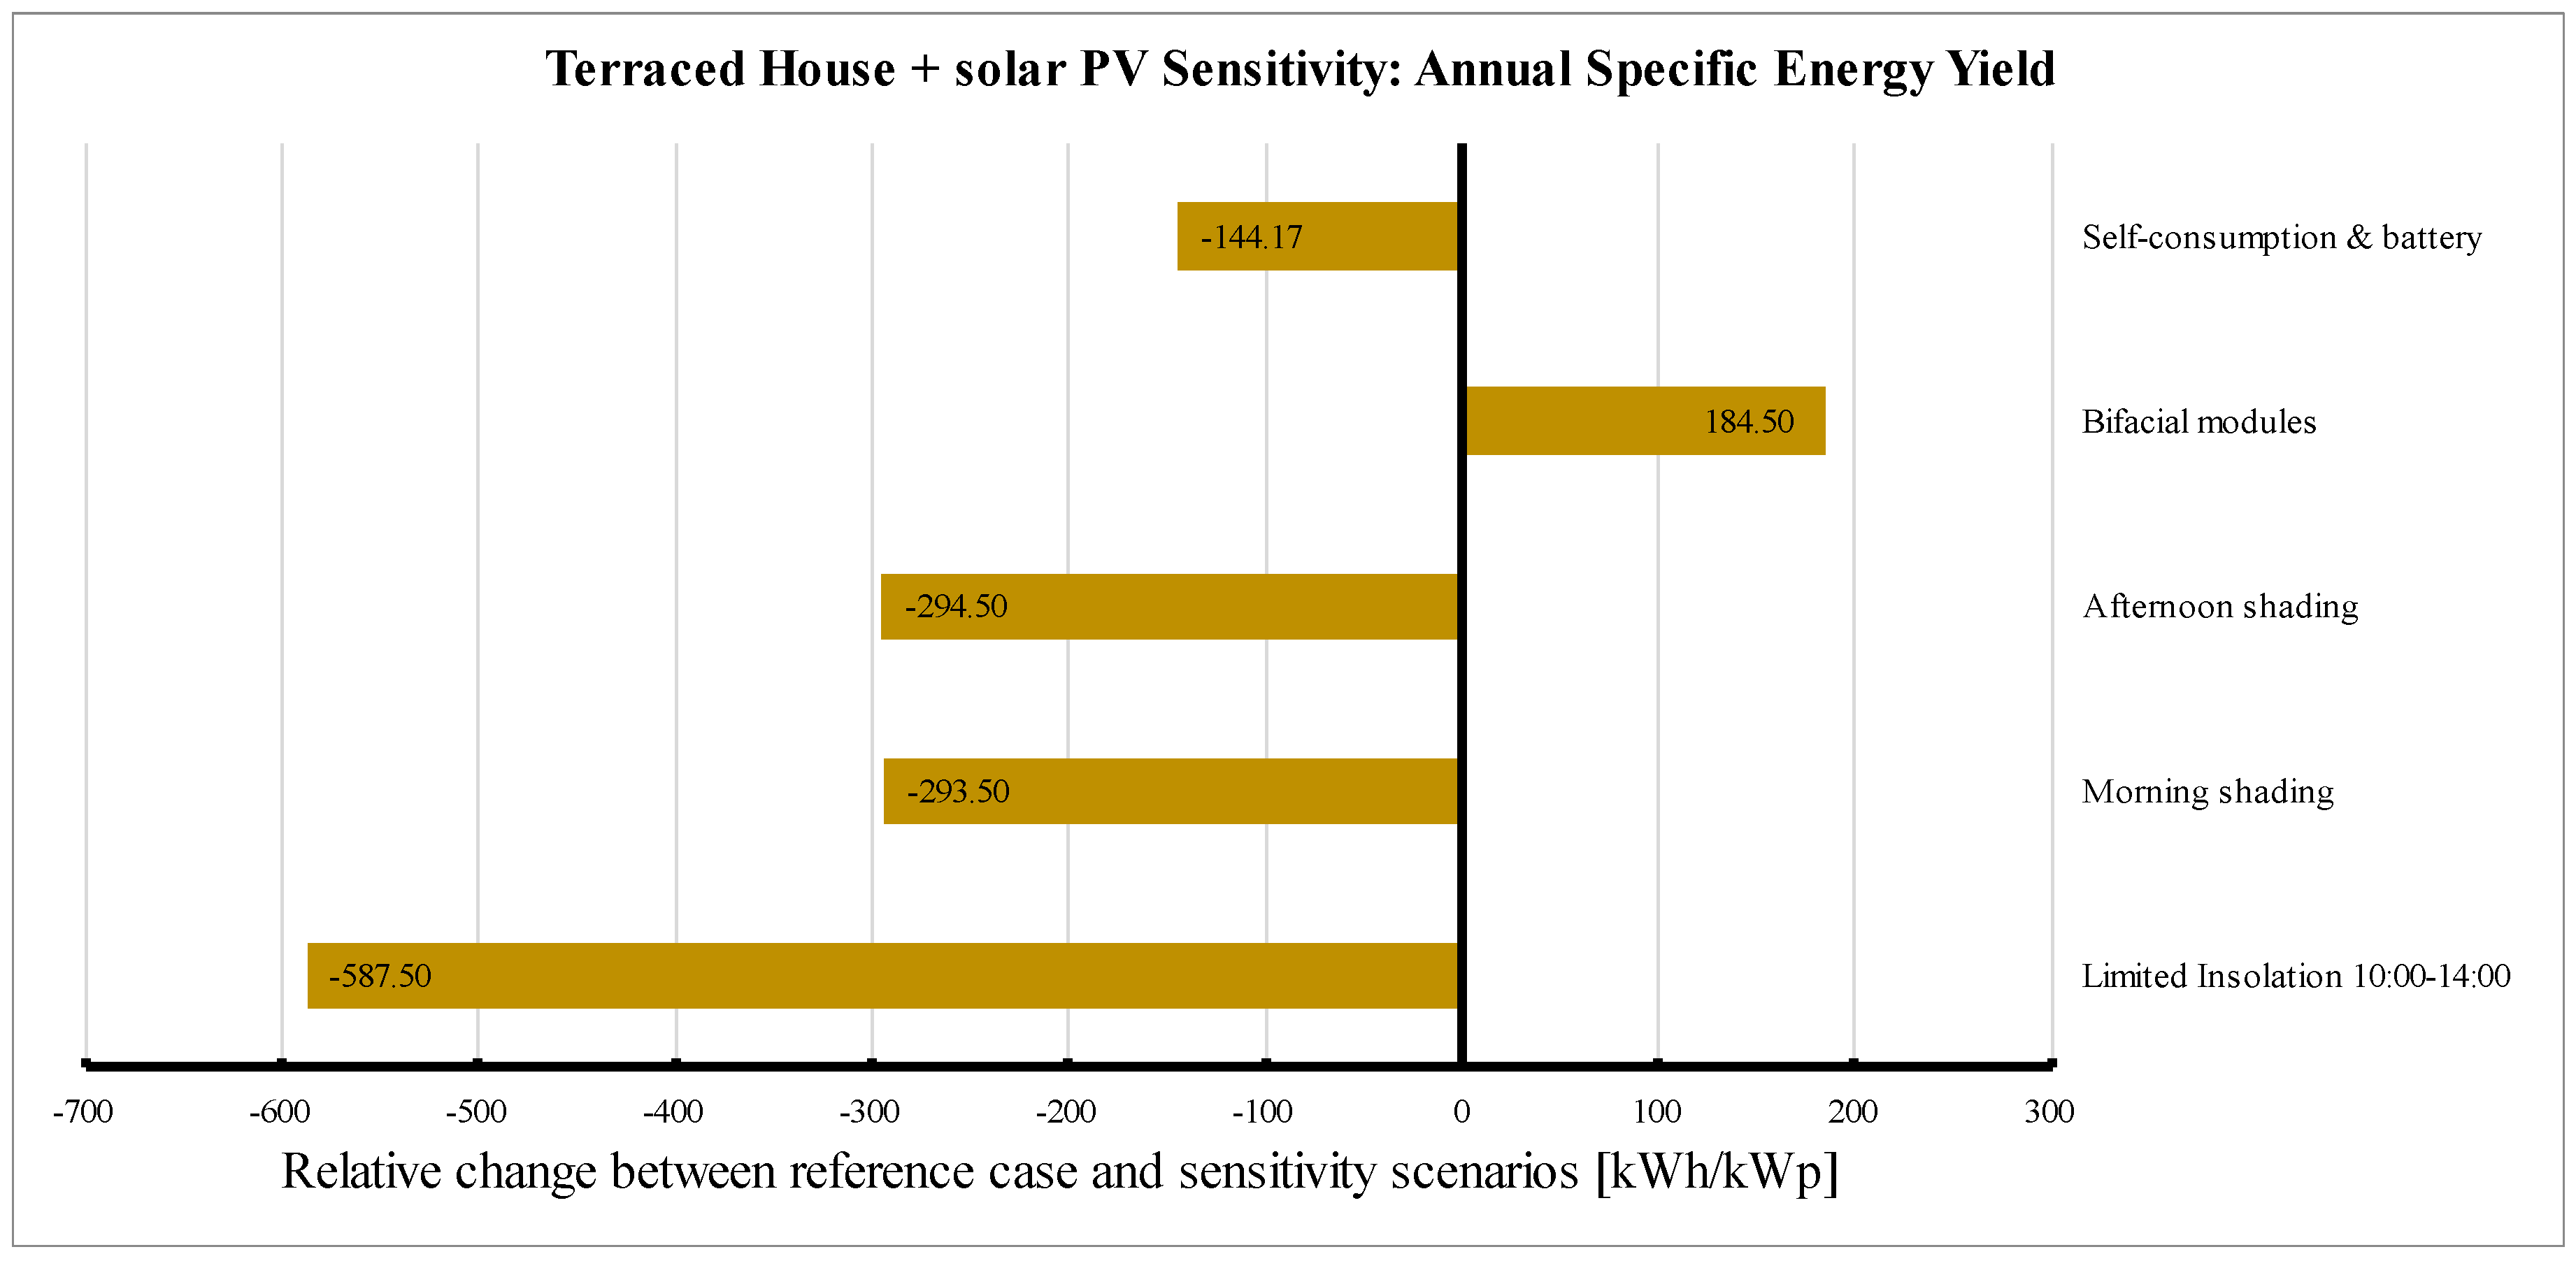
Having determined the sensitivity factors to be considered in the study, each reference simulation run was assigned a list of sensitivity factors, depending on the relevance of each factor in the respective RES configurations. These parameters were then modified accordingly in each reference simulation model in Polysun, and a new set of sensitivity simulation results was obtained. The energy yield and economic values of the sensitivity analysis were directly compared to those of the reference analysis. The absolute value changes of every parameter were presented in the form of tornado charts, as seen in
Section 4.4. This presentation allowed for a simple determination of which sensitivity factors had the greatest impact on the energy yield and economic benefit of different RES configurations in different dwelling types.
4. Results
The set of results obtained was the product of the four main tasks performed in the study, namely the data collection (questionnaire), the energy yield analysis, the economic benefit analysis, and the sensitivity analysis. These tasks reflected directly the first four objectives set at the start of the study. By correlating and comparing the outcomes, the potential for improvement in the energy yield and economic benefit in the scenarios considered was examined, targeting the final objective of the project. In line with the main discussion, recommendations were also made with regards to how the conclusions derived may be applied in practice.
4.1. Questionnaire Observations
A total of 290 respondents participated in the questionnaire, five of which represented dwelling types that were not considered in the study. Given that “dwelling type” was treated as a major factor throughout the project, this relatively small group of responses was ignored. As such, the observations from the questionnaire were presented in the form of relevant statistics based on 285 valid responses. This sample represents a confidence level of 90% with a 5% margin of error for a main residential dwelling population of 215,691 [
32]. This also implies that the dwelling types which were considered in the study do indeed make up most of the residential building stock in Malta, in line with preliminary findings. The following is the list of the major statistics generated from the data collected:
The distribution of the considered dwelling types, as represented by Maltese residents in the responses. Compared to the distribution found in the Malta Census of Population and Housing [
31], the terraced house group is slightly larger than the expected case. The reason for this could be that complete randomization of participants was not possible throughout the questionnaire publication phase. The correlation between the results obtained for the remaining types of dwellings matched very closely with the 2011 census results, which gives sufficient confidence that the questionnaire sample, although not representative of the whole dwelling population, can be considered as sufficient to safely generalize the outcome results of this study.
The distribution of occupancy levels throughout Maltese dwellings, based on the responses received, averaged at 3.39 occupants per dwelling.
The distribution of the different electricity consumption brackets was derived by asking respondents to choose from a set of bi-monthly consumption brackets, or else, provide the exact amount as seen on their latest bi-monthly electricity bill.
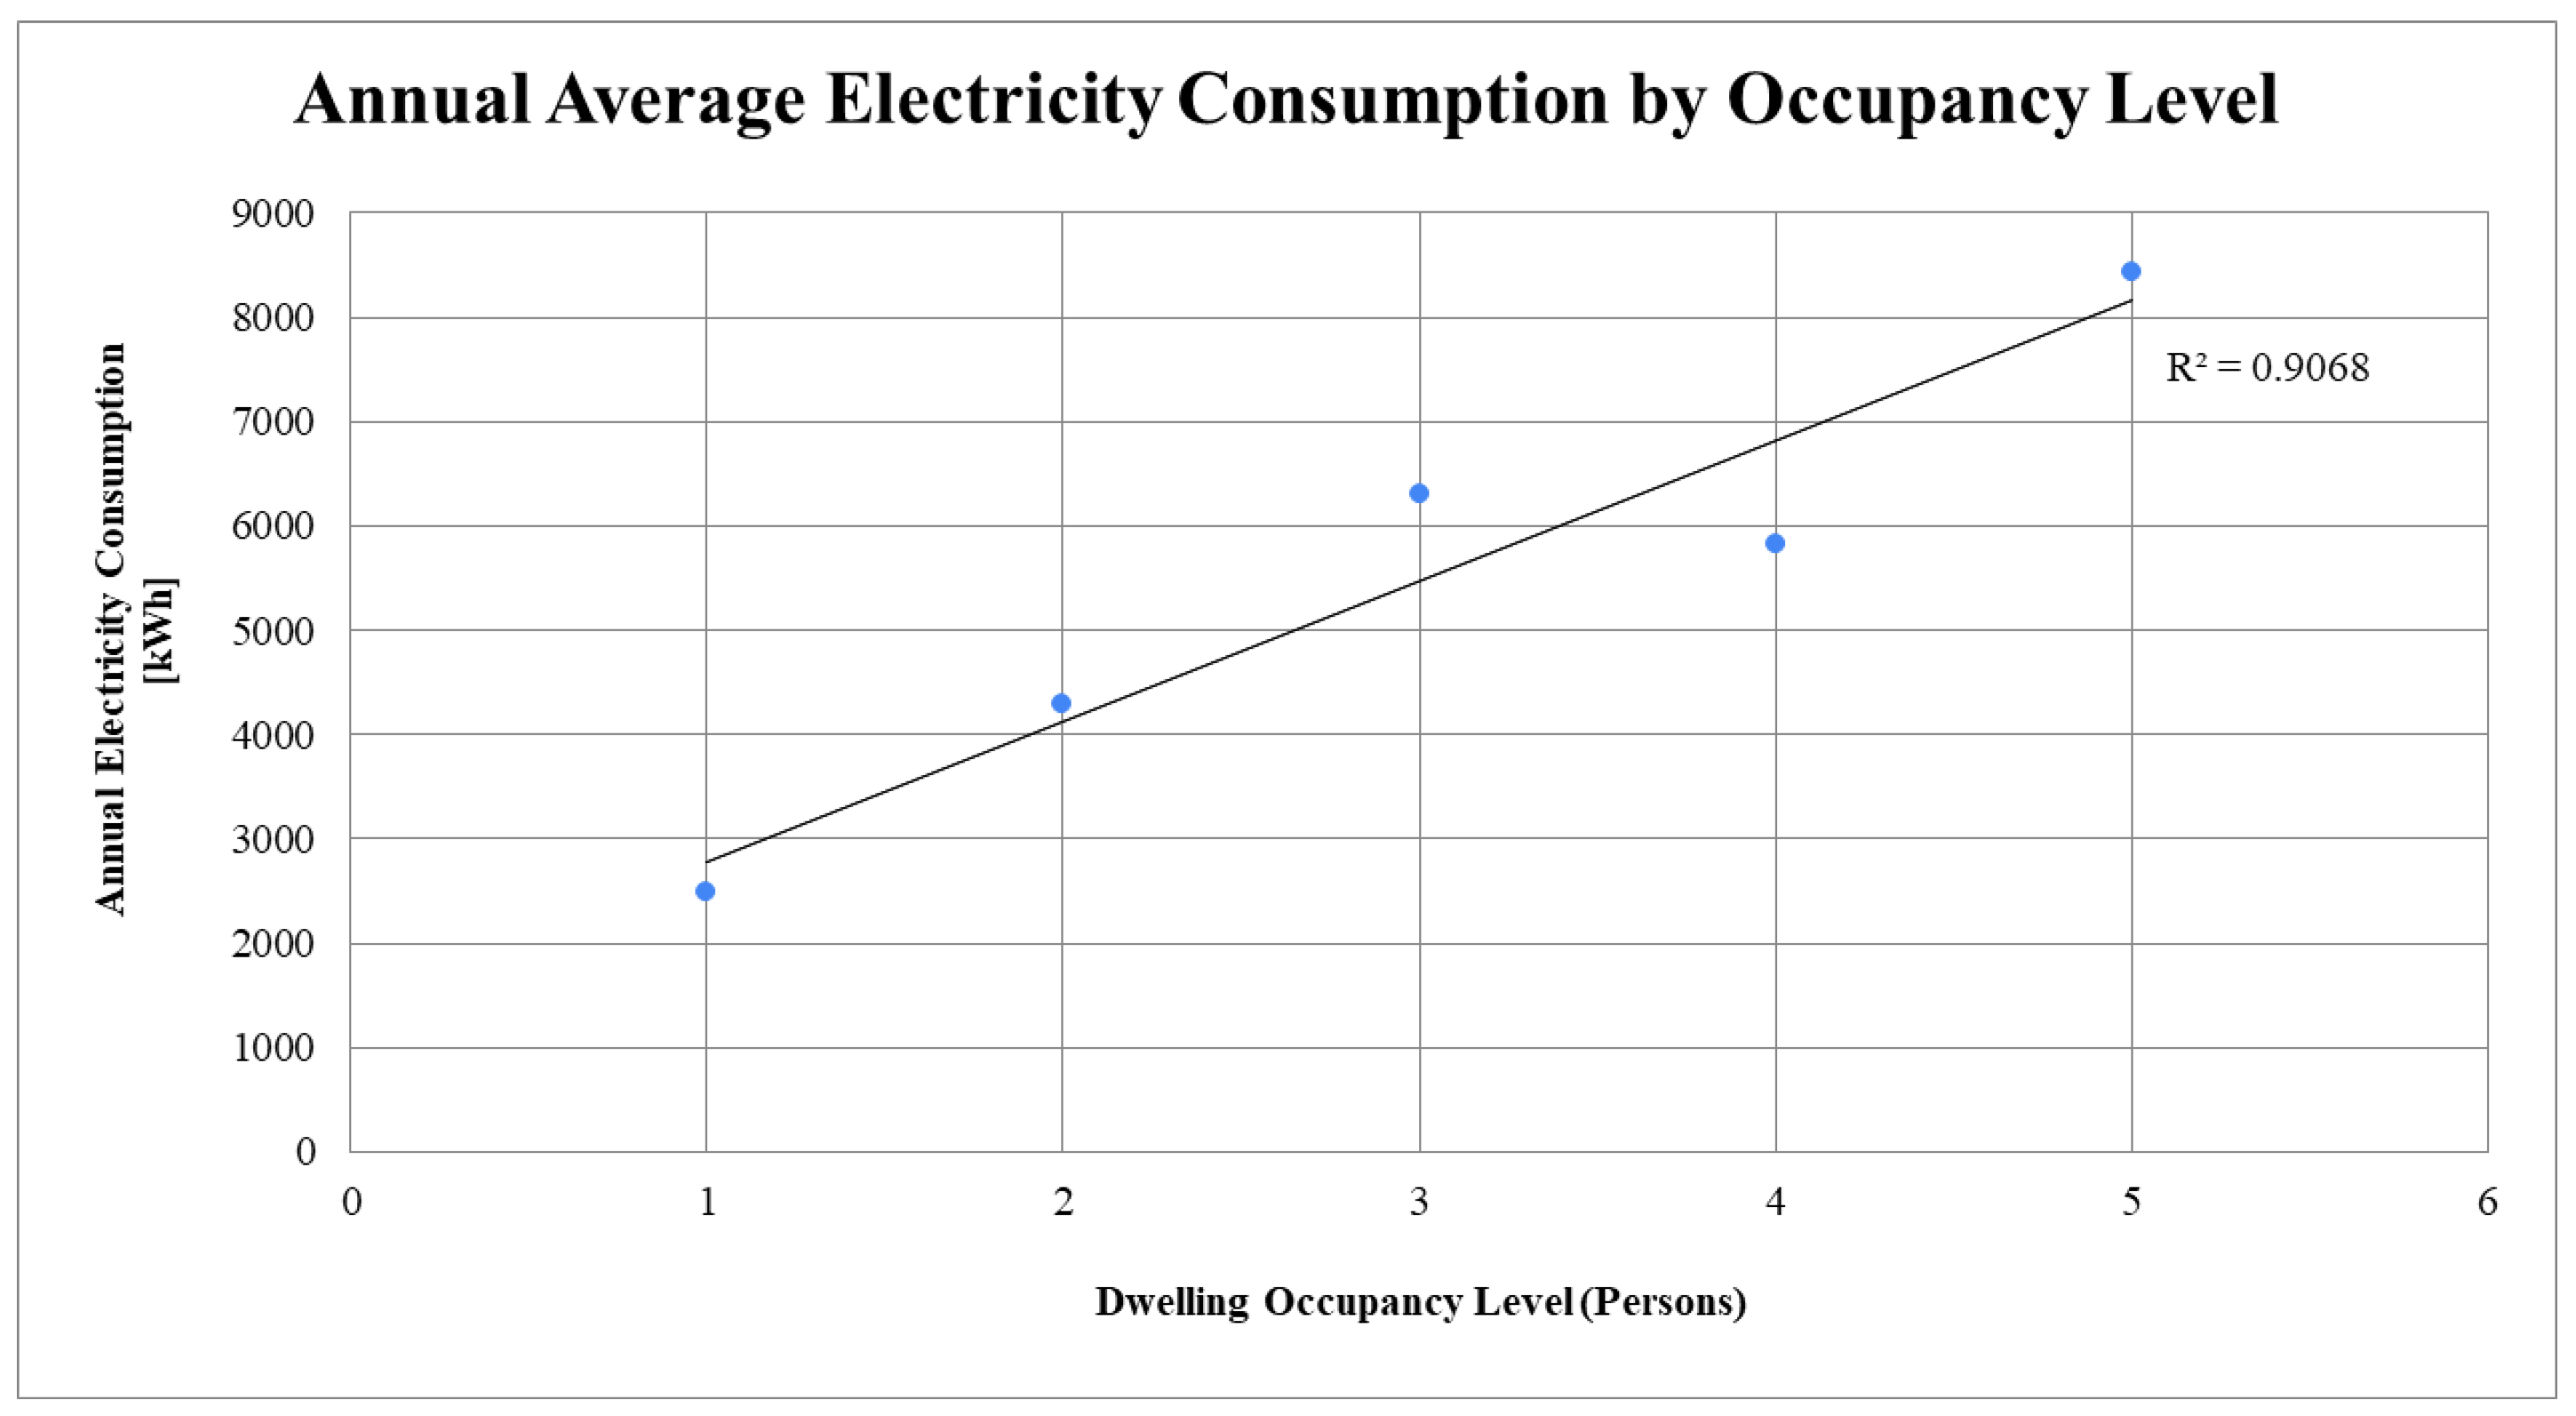
By combining the above three results, the annual electricity consumption vis-à-vis dwelling type and occupancy level was estimated. It was found that electricity consumption does not vary much across different dwelling types. On the other hand, occupancy level was found to be almost directly proportional to electricity consumption, as shown in the results of
Figure 4. Each point represents the average annual electricity consumption of the dwellings with the corresponding number of occupants, as derived from the questionnaire. A clear dispersion from the straight-line trend in the below figure may be seen in the points representing an occupancy of three or four persons. This dispersion was attributed to the random nature with which questionnaire responses were collected. Given that the purpose of the questionnaire results in this study was only to provide supportive indications, no further analysis was carried out vis-à-vis this anomaly.
Figure 4.
Characteristic of annual average electricity consumption against dwelling occupancy level.
Figure 4.
Characteristic of annual average electricity consumption against dwelling occupancy level.
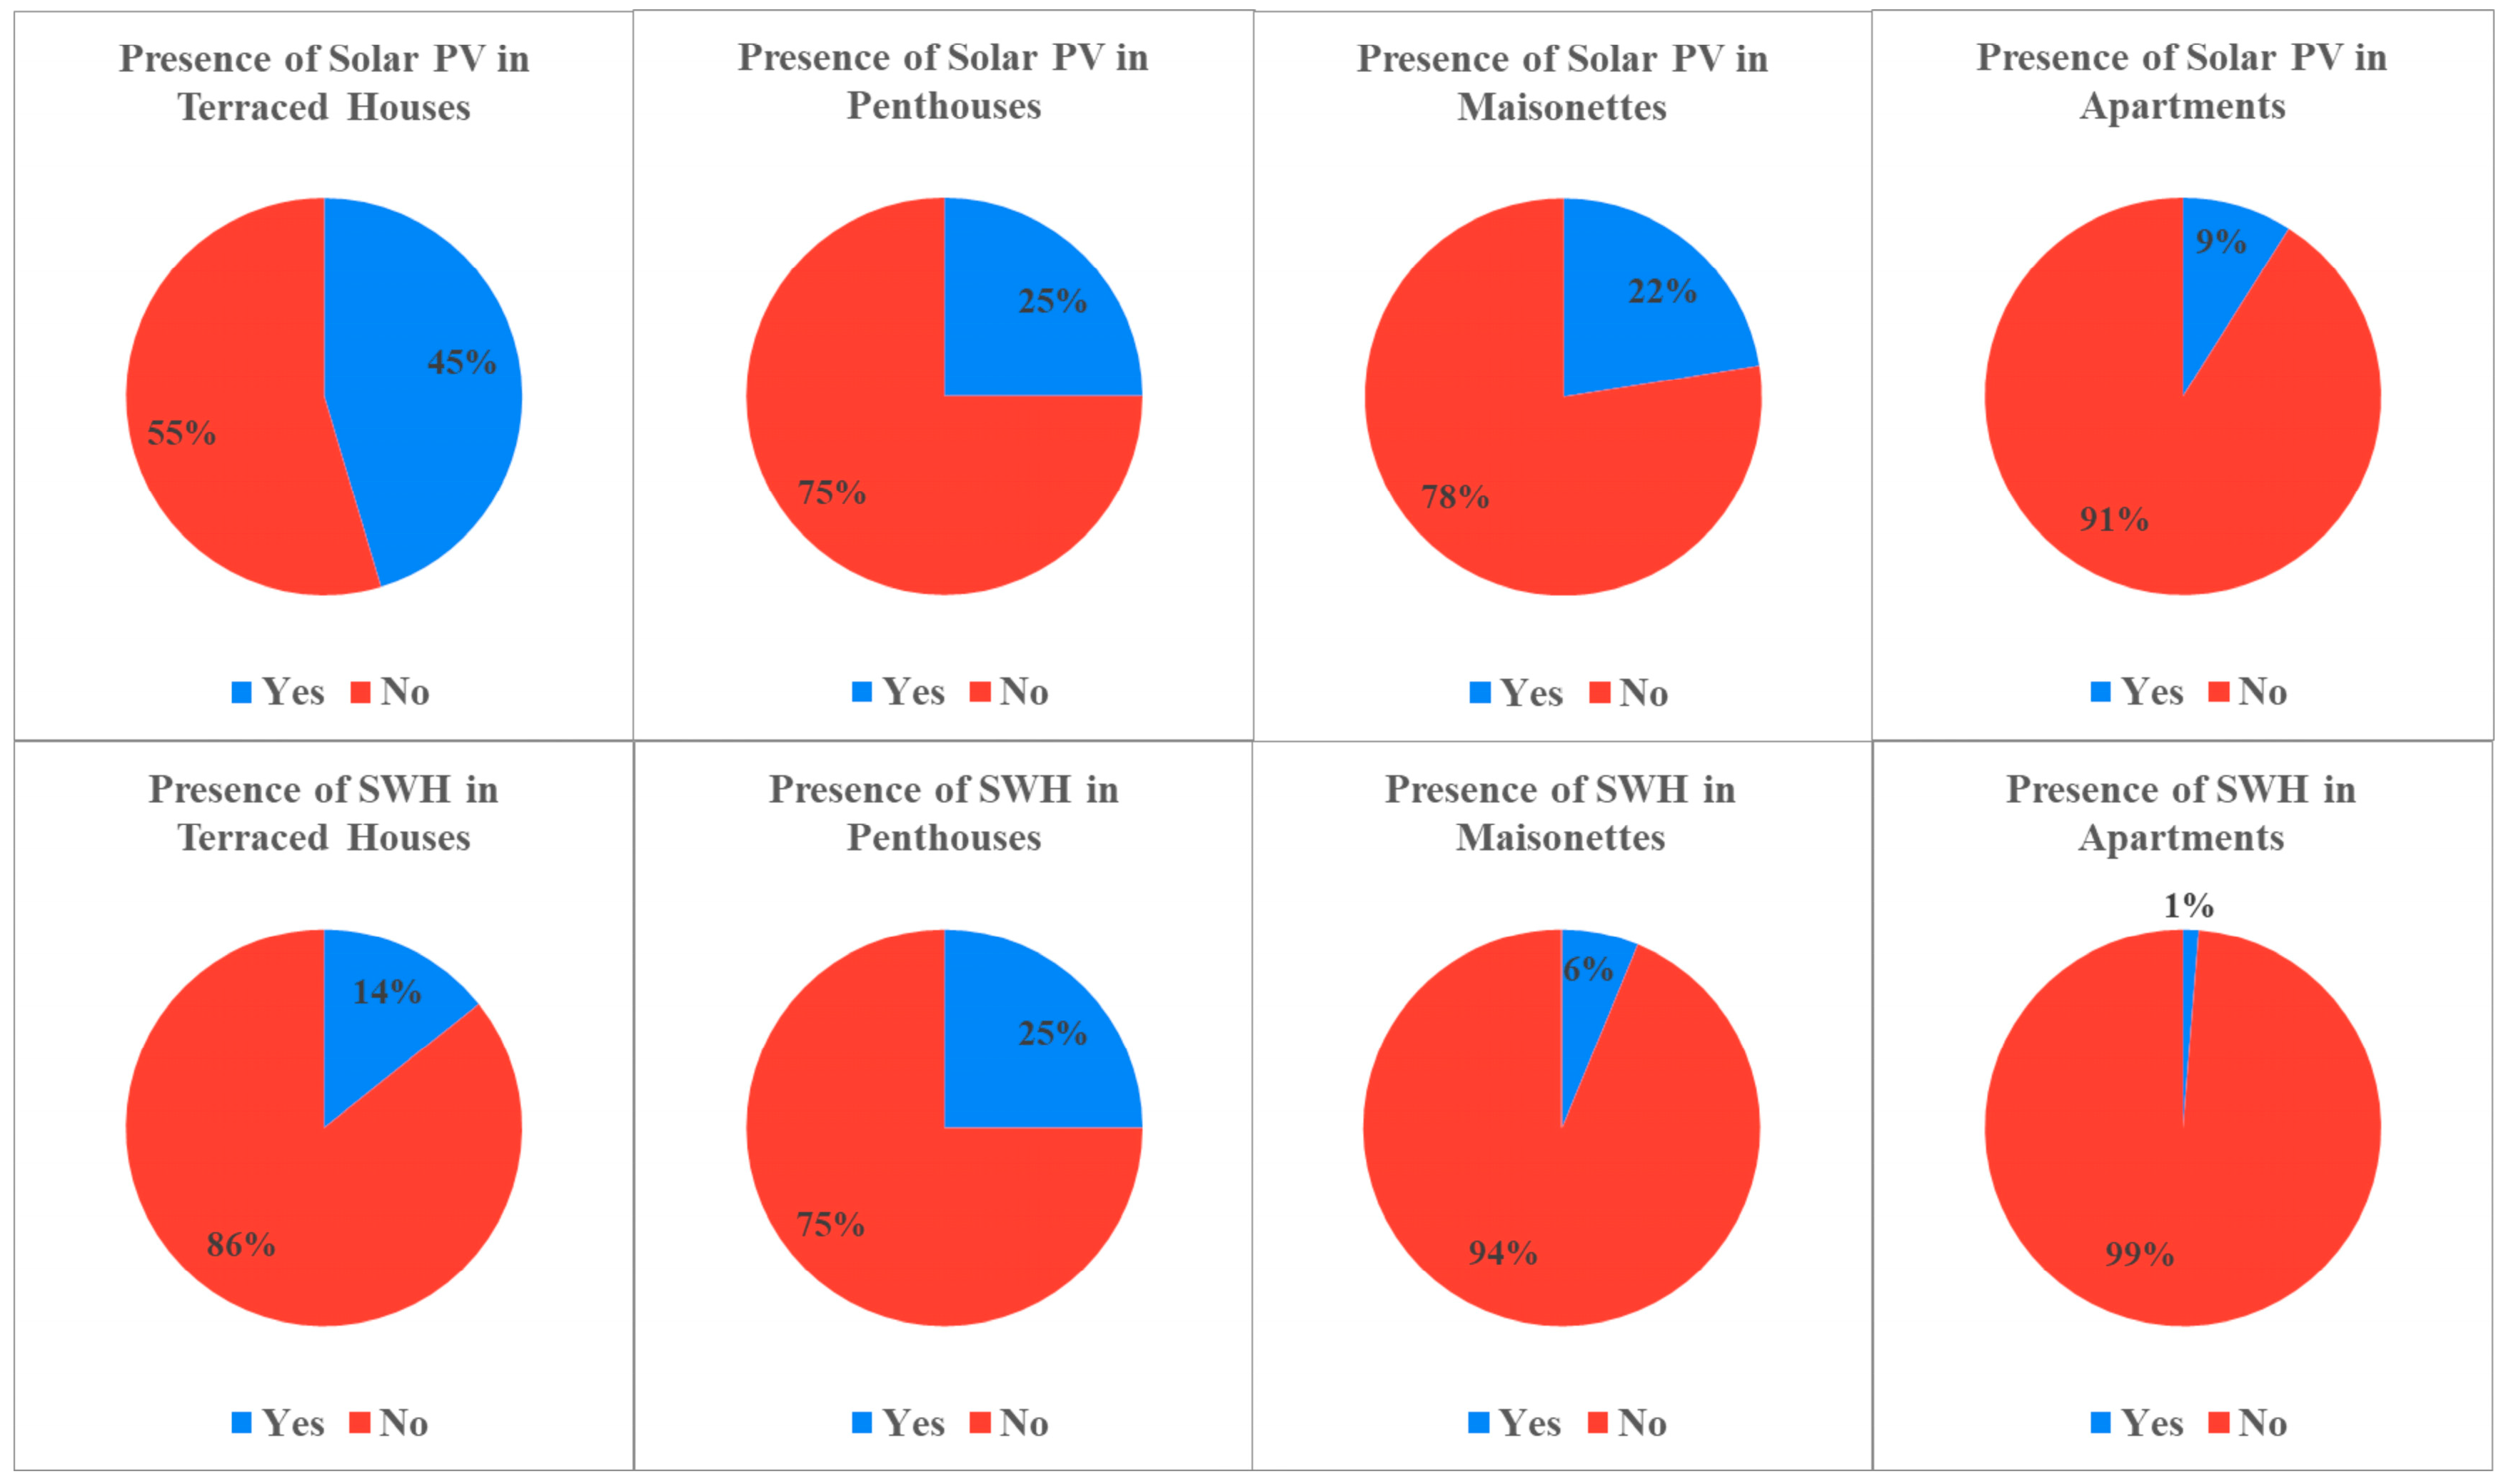
From the questionnaire responses, the untapped potential of RES technologies in Maltese residential buildings was clarified. Rooftop installations are typically the most economically beneficial, and therefore, terraced houses and penthouses exhibit a higher potential for having both solar PV and SWH installations, as seen in
Figure 5.
4.2. Reference Energy Yield Results
A total of five simulation runs were dedicated to solar PV systems, as highlighted in the methodology section.
Table 6 lists them with reference to their allocated simulation run number along with their resulting specific annual energy yield. Each value refers to the actual electrical energy that makes it to the electrical grid, after accounting for all the relevant losses.
In line with various pieces of relevant literature, the 30° inclination configuration for the rooftop PV modules results in the maximum energy yield per kWp installed, in the case of Malta [
10]. Hence, by varying elevation, orientation, and shading conditions from this optimal configuration, lesser yields were obtained from the other simulations. These results laid out the baseline for what is expected in the practical application of solar PVs in different types of Maltese dwellings.
With regards to SWH simulations, the annual backup electricity consumption as modelled by Polysun based on the different occupancy levels for each dwelling type was considered as the reference scenario for each configuration. This value refers to the electricity consumed by the auxiliary heater within the SWH system to fulfil the water heating demand for days when the solar input is not sufficient. Hence, by subtracting each respective auxiliary electricity amount from the case where an electrical water heater with a COP of 1 is used (2716 kWh annually, simulated using Polysun), the net energy savings may be obtained. The annual electricity consumption values and energy savings for each SWH reference case are listed in
Table 7.
The terraced house/penthouse configuration was modelled at the optimal orientation and elevation, as well as for thermosiphon system (no energy required to drive a water pump). Hence, it is understandable that it resulted in the lowest requirement for electricity and being able to sustain the water heating demand almost entirely throughout the summer months. Such performance, however, can only be expected from a reasonably sized installation that circumvents shading across the whole year. Comparatively, the rest of the simulations resulted in considerably higher electricity demand in order to fulfil the water heating requirements set, resulting in lower energy savings. This lower performance was largely attributed to the shading factor set within the analysis models.
The nature of the output of the reference HPWH system simulation is the same as that for the SWH cases, i.e., the annual electricity consumption of an electric resistance boiler. However, the result of this simulation was treated separately since the analysis depended on a completely different reference model and was not directly dependent on solar radiation. The HPWH system resulted in a net annual energy saving of 1942 kWh (annual heating demand of 2716 kWh—HPWH consumption of 774 kWh).
4.3. Reference Economic Benefit Results
The economic benefit of each RES technology considered was derived from the energy yield results outlined in the previous section. A set of indicators was calculated for each case, to quantify the economic viability and allow for comparisons to be made. The value of each of these indicators was directly dependent on the energy revenue generated from a solar PV system or else on the energy saved by implementing a RES water heating system, be it based on either SWH or HPWH technology.
Table 8 shows the economic results for the application of PV configurations. The
NPV is undoubtedly the most important indicator and was calculated using Equation (2), featured and explained in
Section 2.4. For instance, in simulation run 1 (1.2 kWp solar PV system and grant + FIT case), the
NPV was calculated as follows:
It is imperative to note that Cn decreases each year across the 20-year lifespan of the installation, given that the energy yield of the solar PV system decreases due to the degradation of PV cell efficiency.
Table 8.
The economic parameters calculated using the energy yield results of the solar PV simulations.
Table 8.
The economic parameters calculated using the energy yield results of the solar PV simulations.
| | Run No. | NPV (EUR) | IRR (%) | LCOE (EUR/kWh) | PBP (Years) |
|---|
| (Grant & low FIT = 0.105 EUR/kWh) | 1 | 778.90 | 15.61 | 0.0688 | 7 |
| 4 | 506.36 | 12.46 | 0.0782 | 8 |
| 5 | −229.20 | 2.63 | 0.1242 | N/A |
| 7 | −547.45 | −2.95 | 0.1667 | N/A |
| 8 | −1015.98 | −16.15 | 0.3352 | N/A |
| (High FIT = 0.15 EUR/kWh) | 1 | 846.76 | 11.50 | 0.1106 | 10 |
| 4 | 457.41 | 9.06 | 0.1258 | 11 |
| 5 | −593.38 | 1.48 | 0.1998 | N/A |
| 7 | −1048.02 | −2.76 | 0.2681 | N/A |
| 8 | −1717.35 | −12.45 | 0.5391 | N/A |
With regards to water heating RES technologies, the same set of indicators, excluding the
LCOE, was worked out for each of the respective reference cases. The results can be seen in
Table 9.
4.4. Sensitivity Analysis Results
Three main values were featured to outline the changes resulting from applying the sensitivity factors to each reference scenario. The change in energy yield from solar PV and RES water heating installations was represented by the annual specific energy yield in [kWh/kWp] and the annual energy savings in [kWh], respectively, in line with reference results. With regards to economic benefit, however, since several parameters were calculated, the NPV was isolated to represent the change in financial feasibility from each sensitivity iteration.
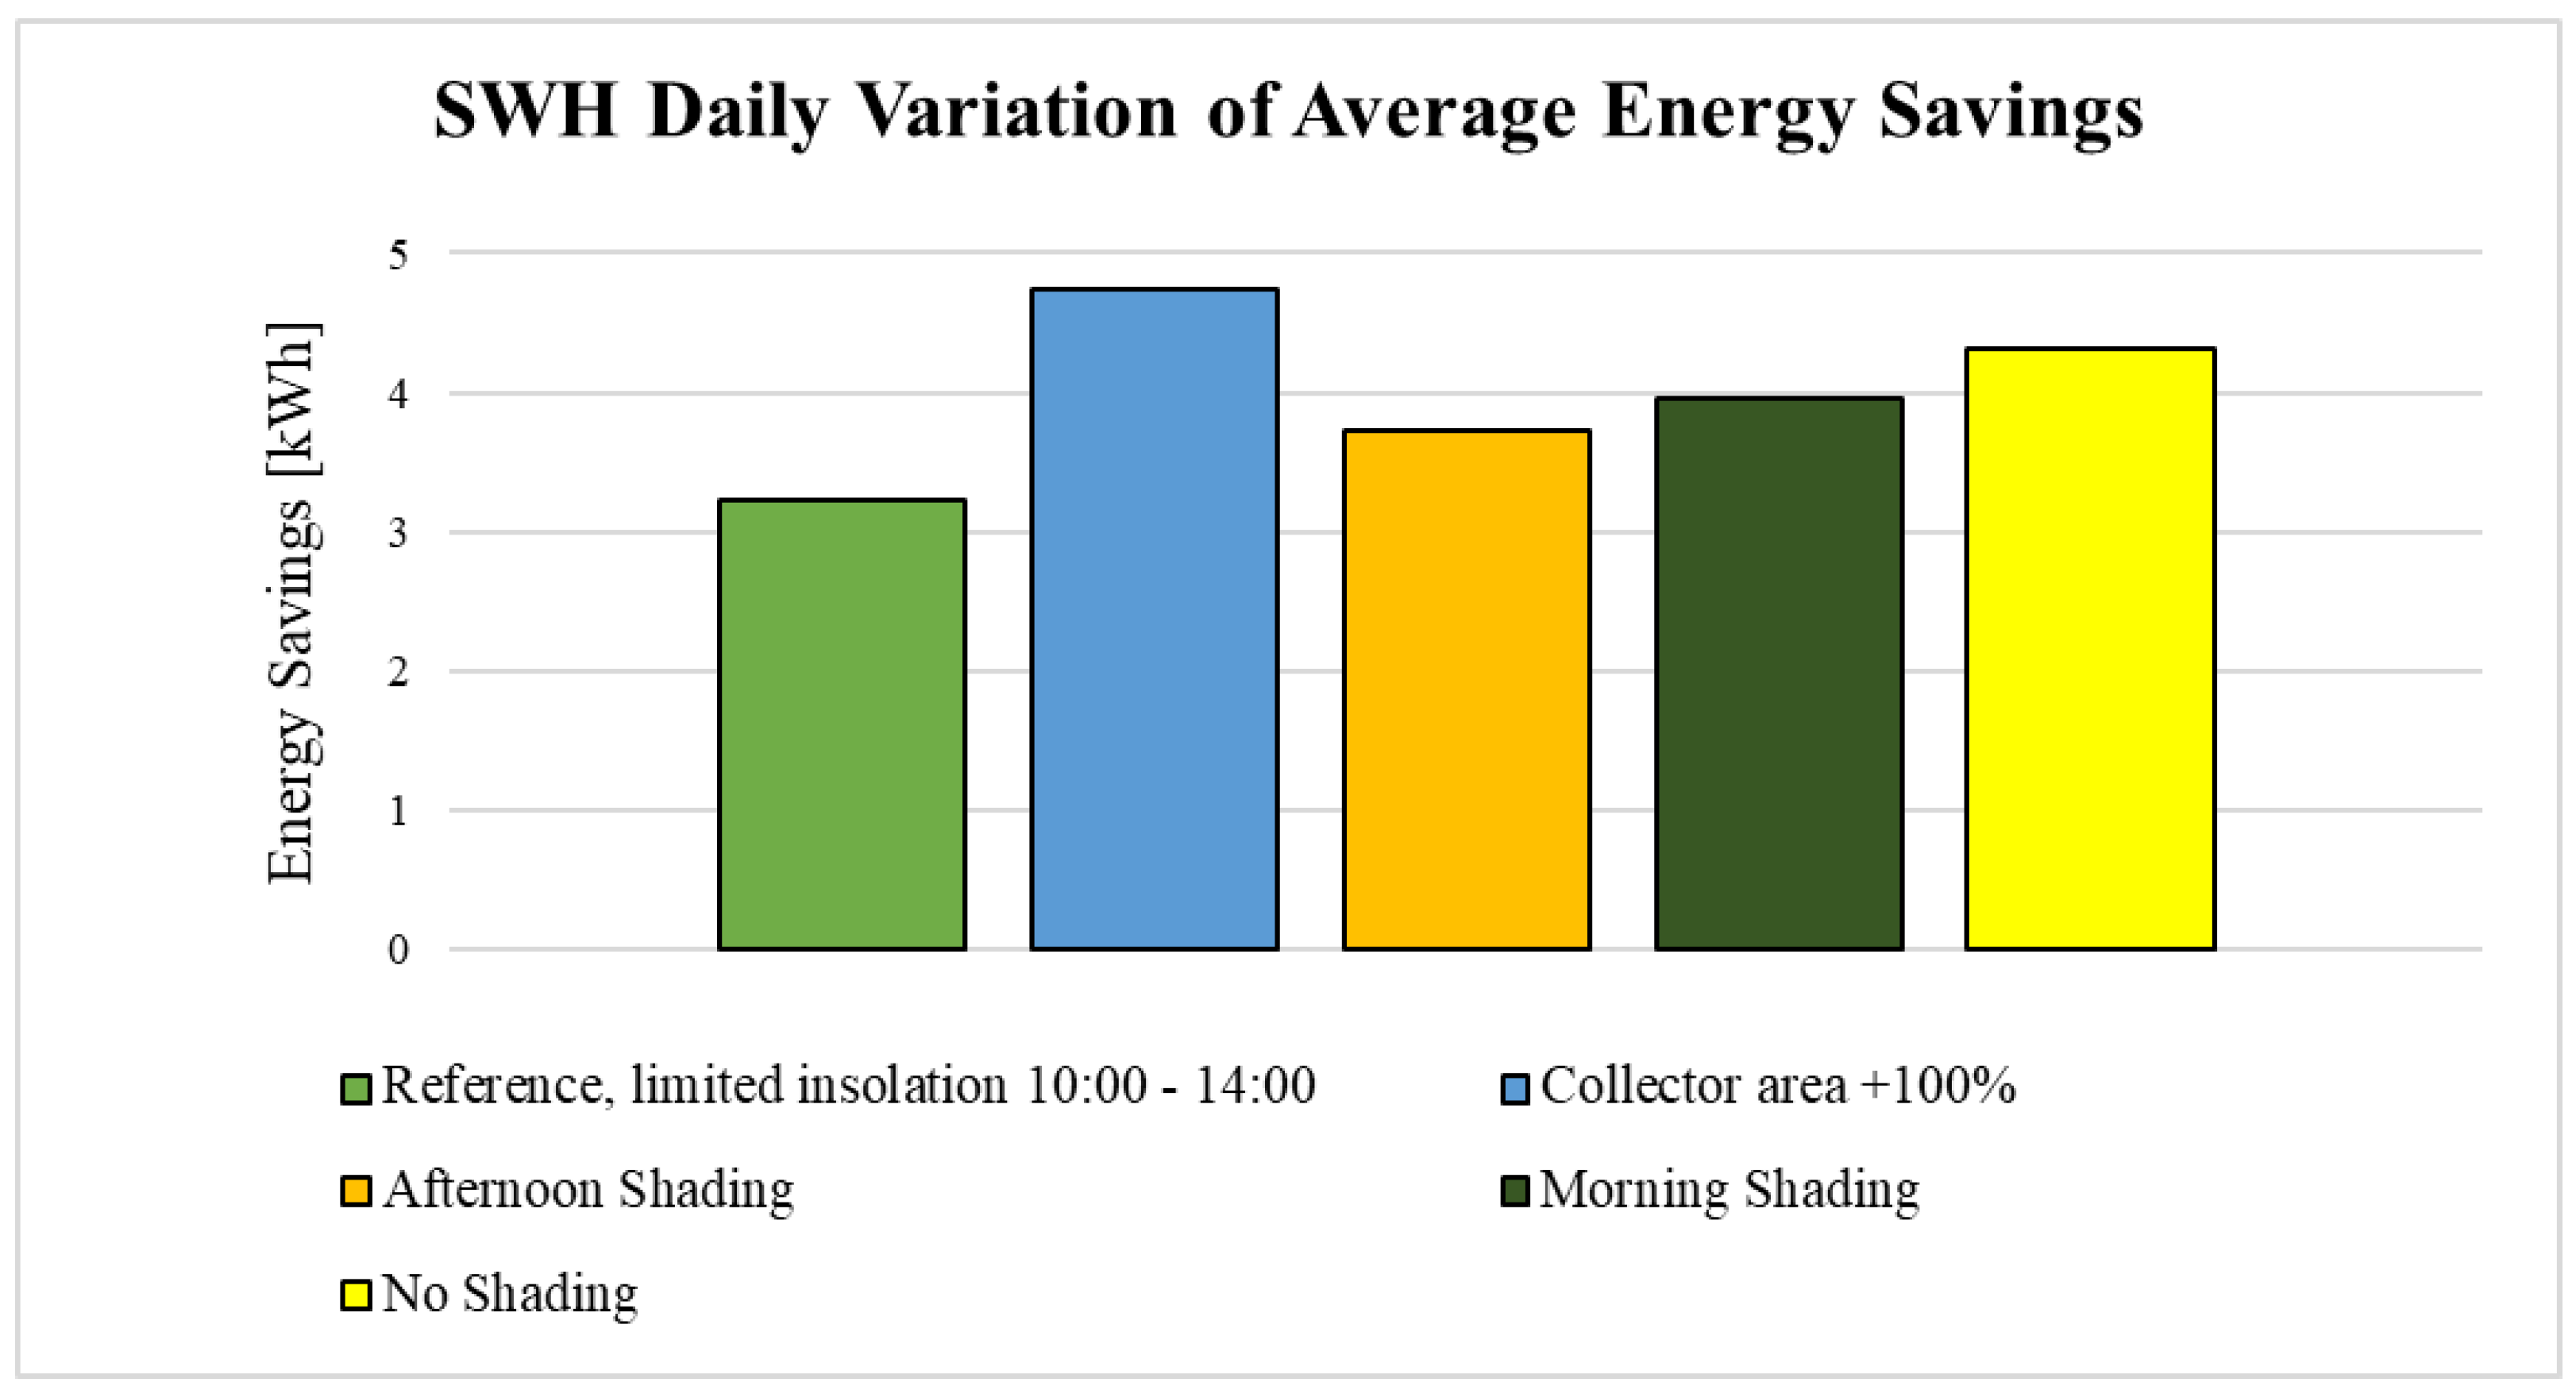
Figure 6 and
Figure 7 are presented to visualize the variation resulting from applying different sensitivity factors on the reference scenario. In
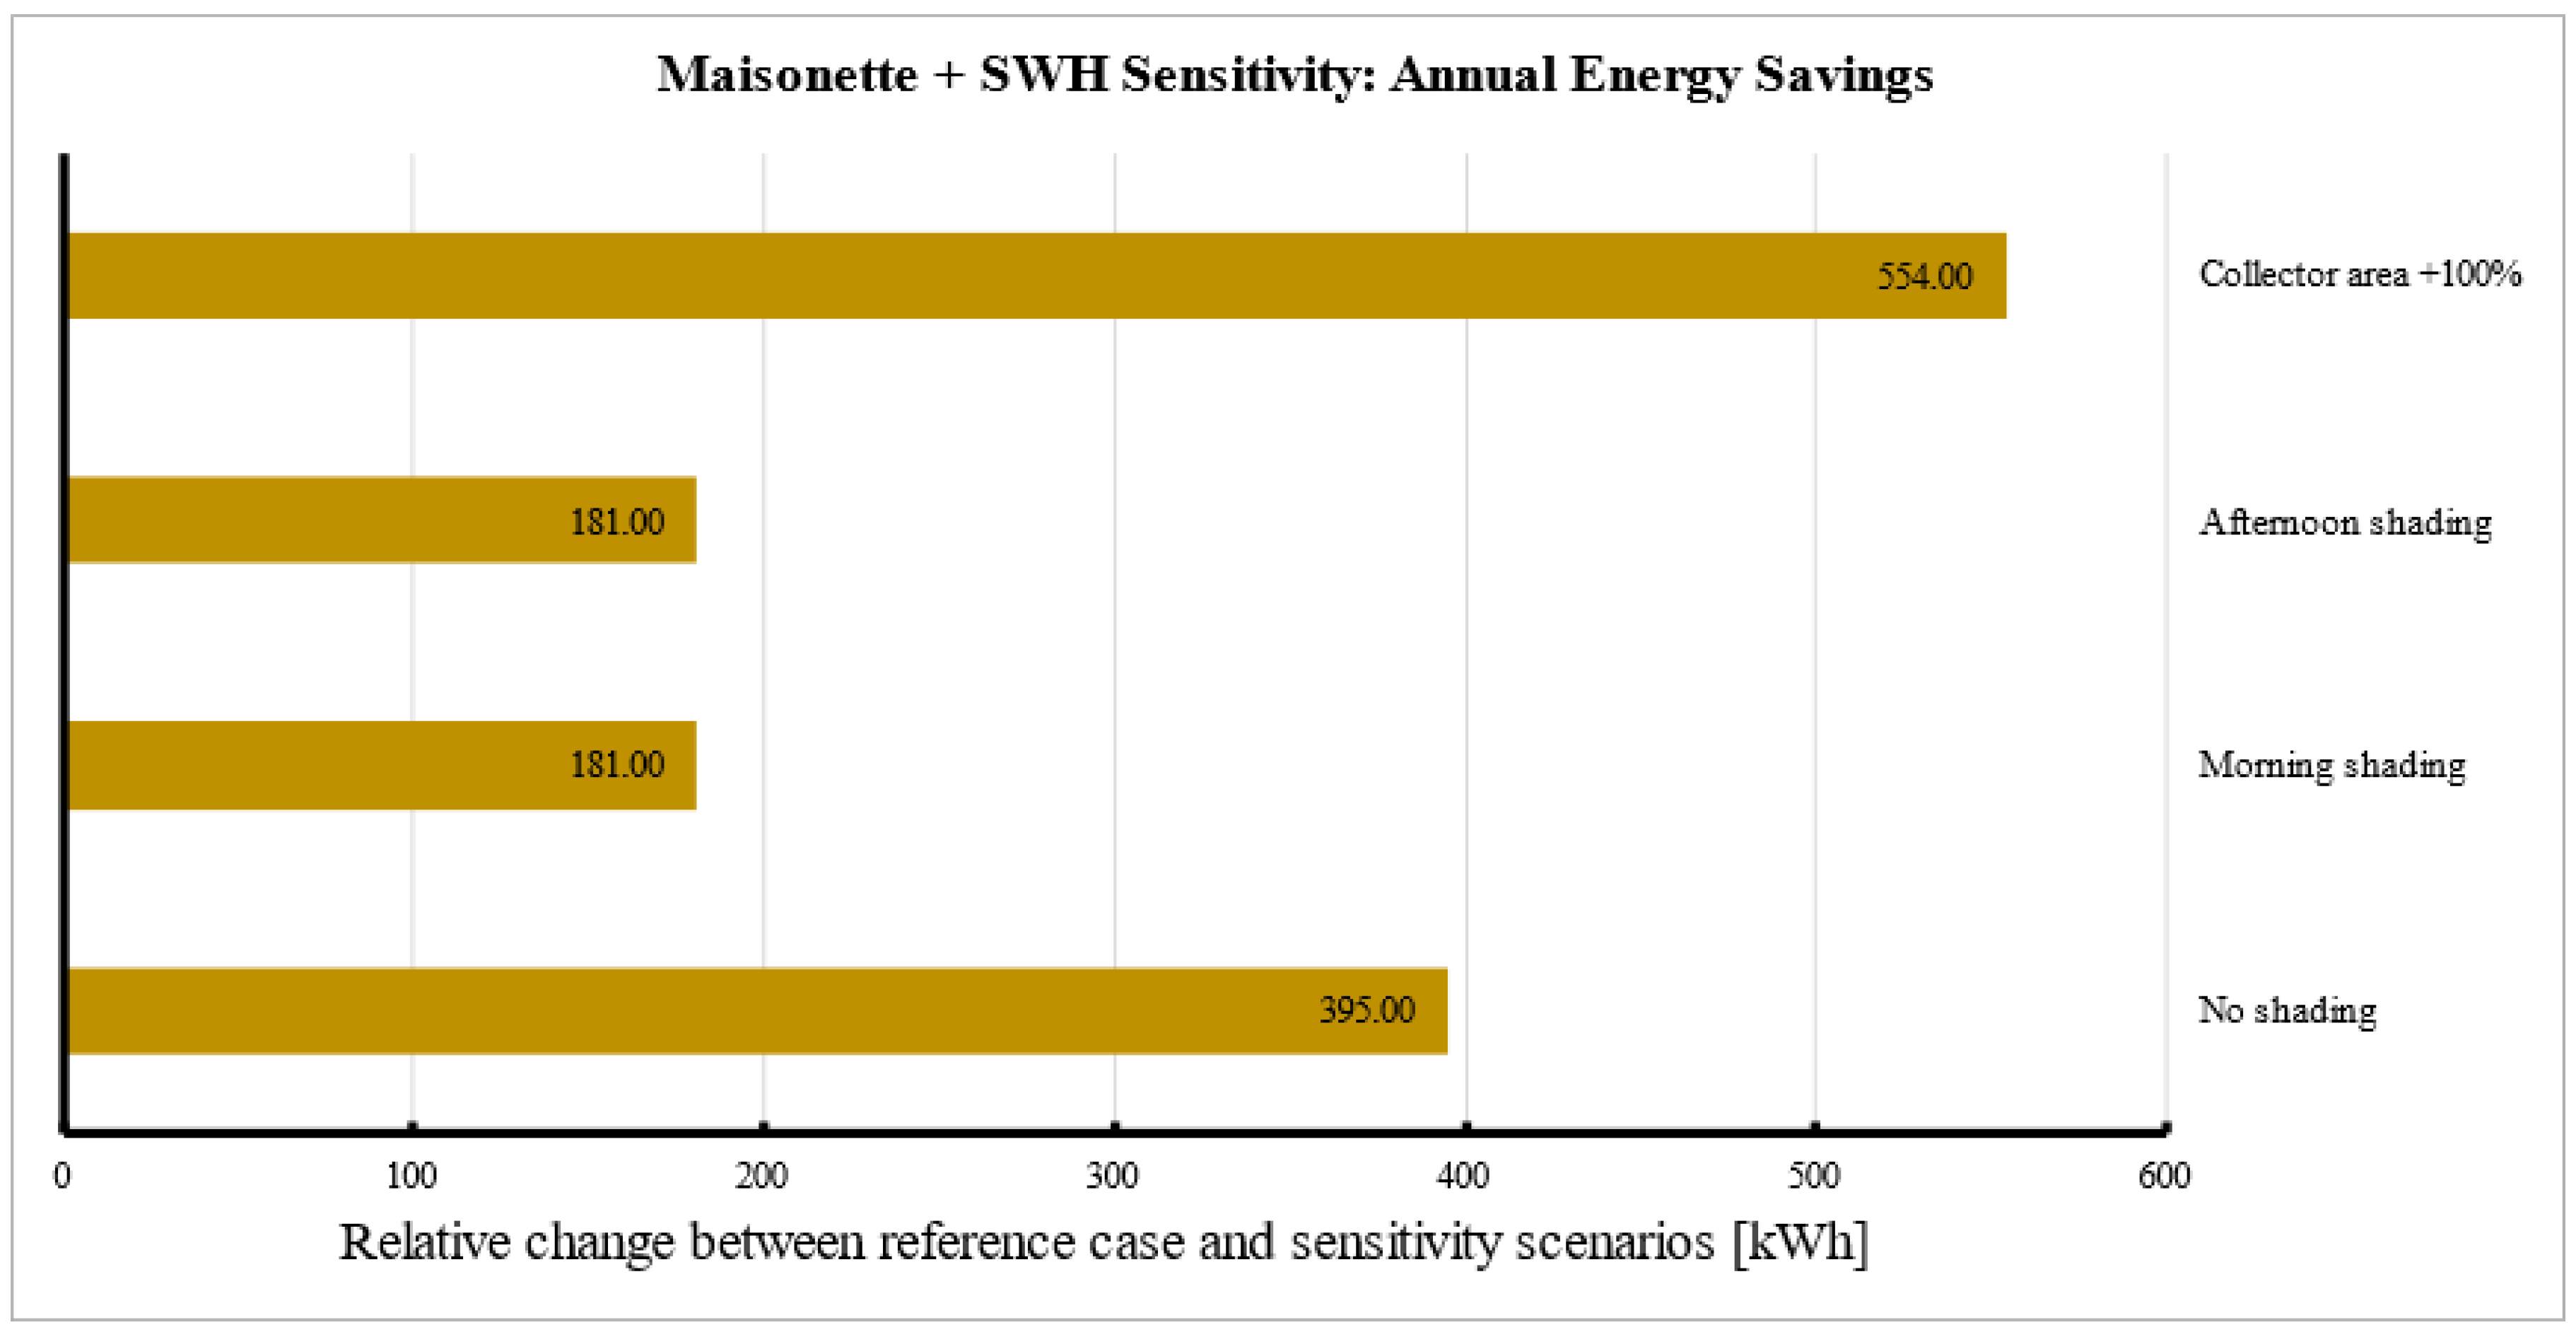
Figure 6, the average results for the first day of each season were used to plot the graphs (21 June, 21 September, 21 December, and 21 March). In
Figure 7 the “Collector area + 100%” means that the solar panel area was doubled for that scenario to cater for the limited hours of sunshine due to shading.
The sensitivity factors for solar PV configurations were set as shading, bifacial modules, discount rate, fiscal support mechanisms, electricity export rate, and self-consumption. From the sensitivity analysis of reference case 1, it was concluded that self-consumption using a battery storage system, results in an 8.62% decrease in annual specific energy yield, as shown in
Figure 8. On the other hand, bifacial systems resulted in a significant increase in energy generation, at the cost of a lower
NPV resulting from the higher cost of the technology.
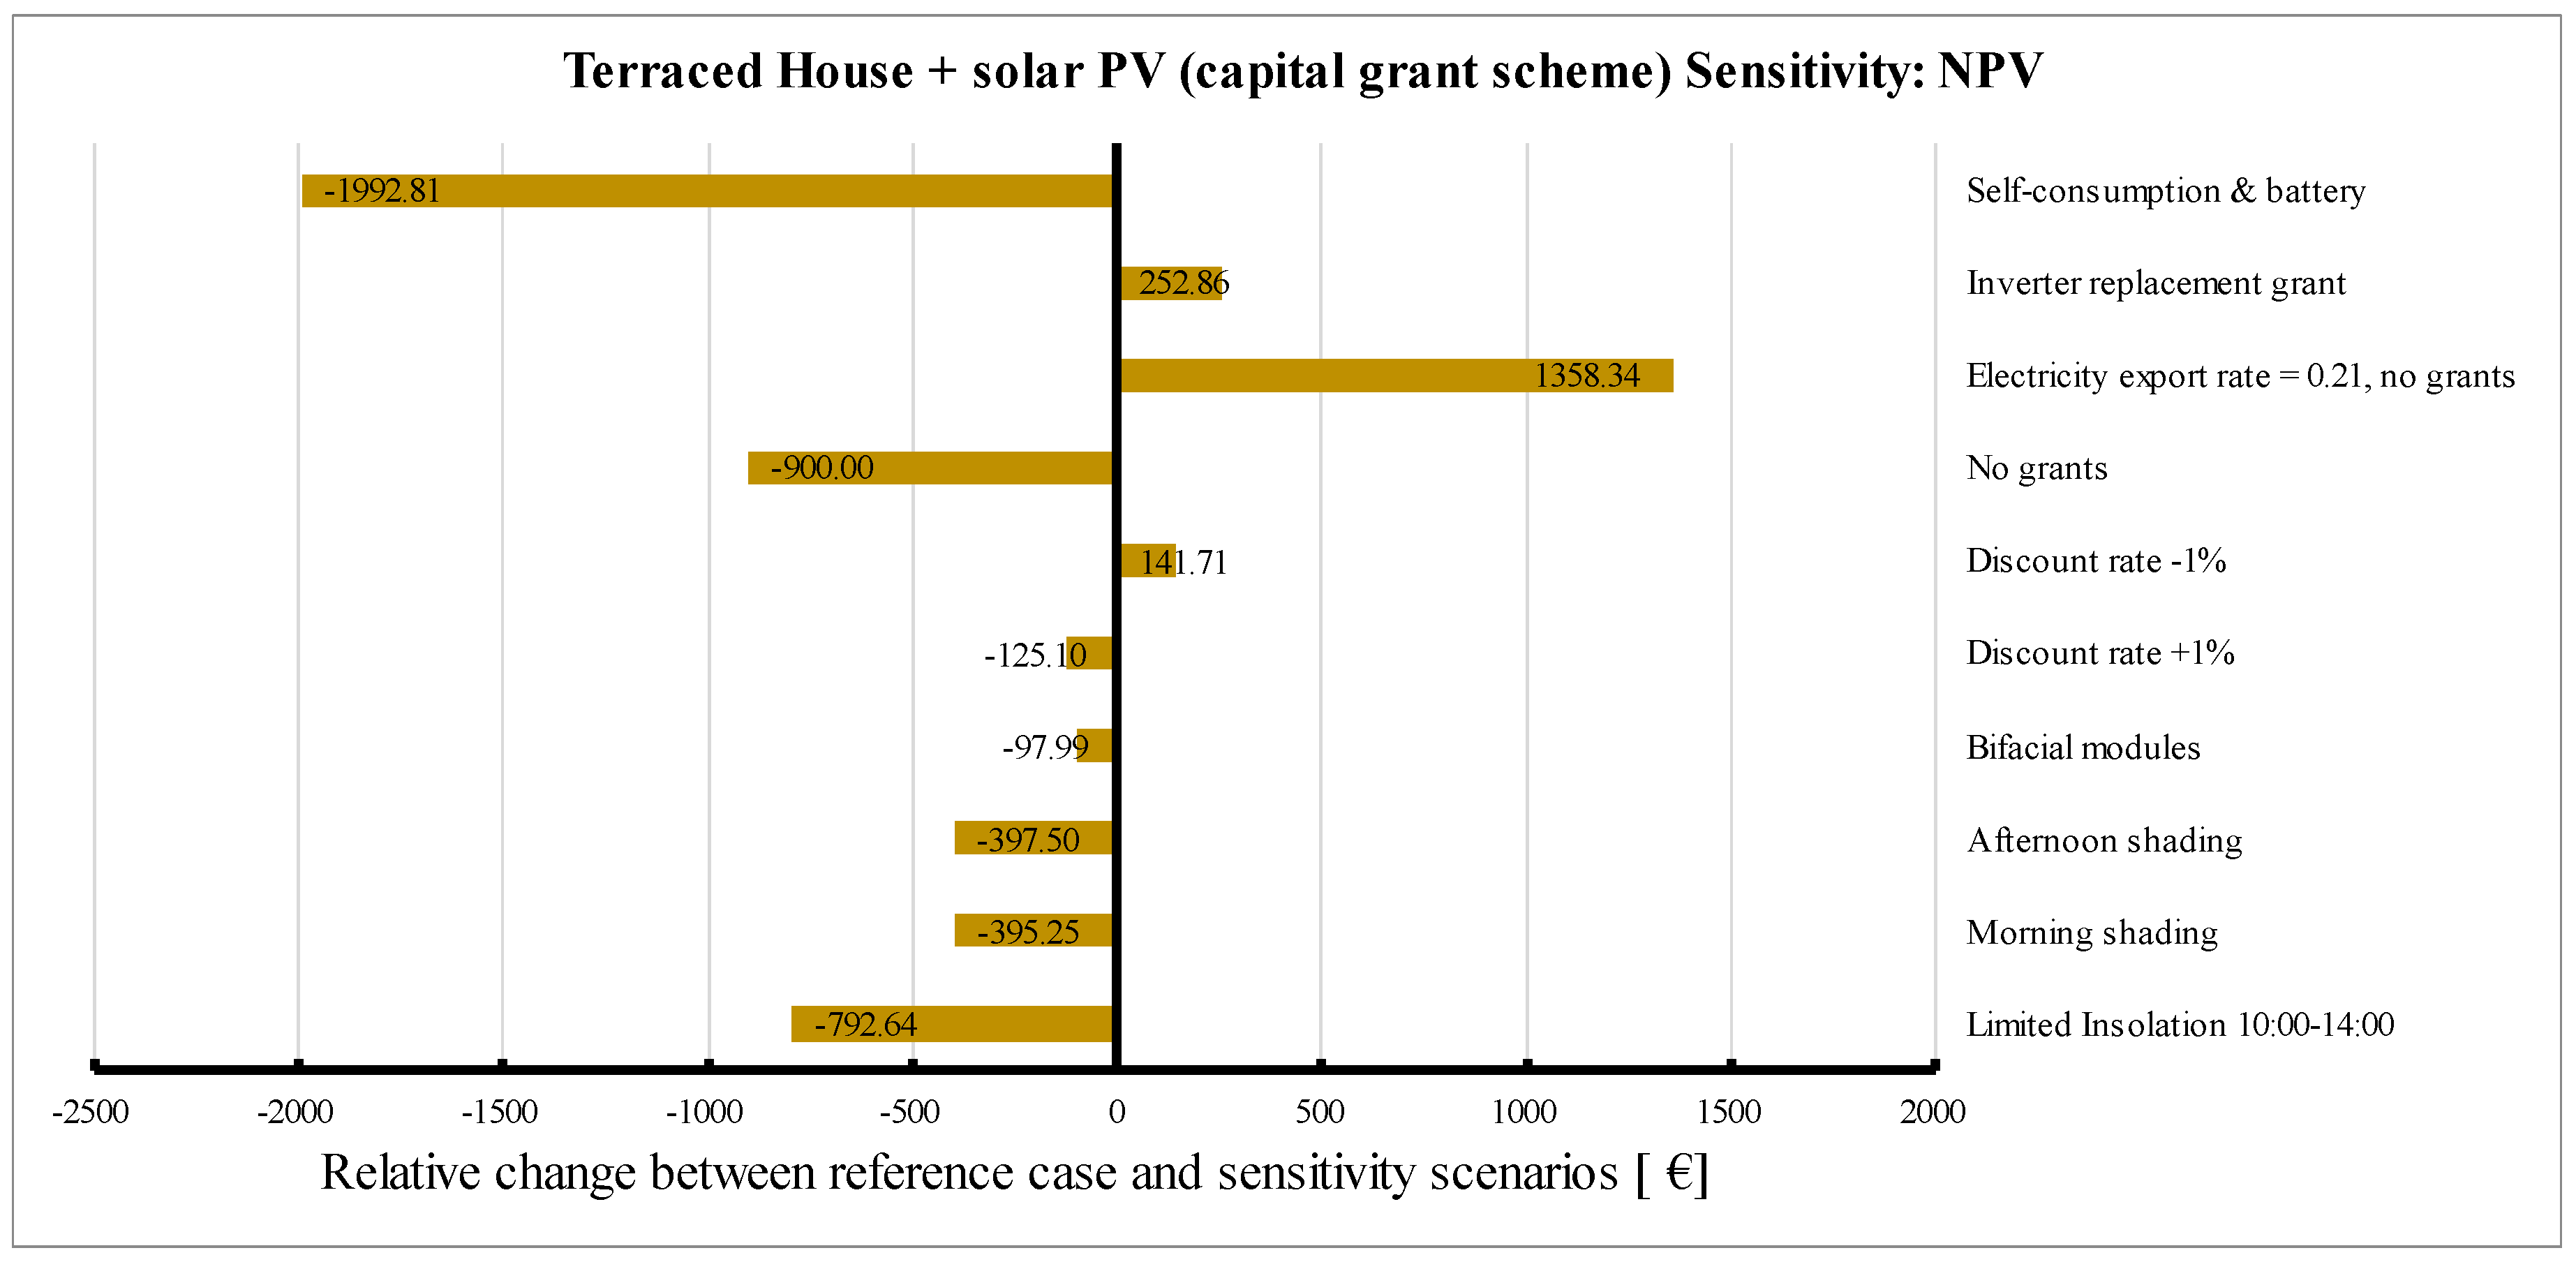
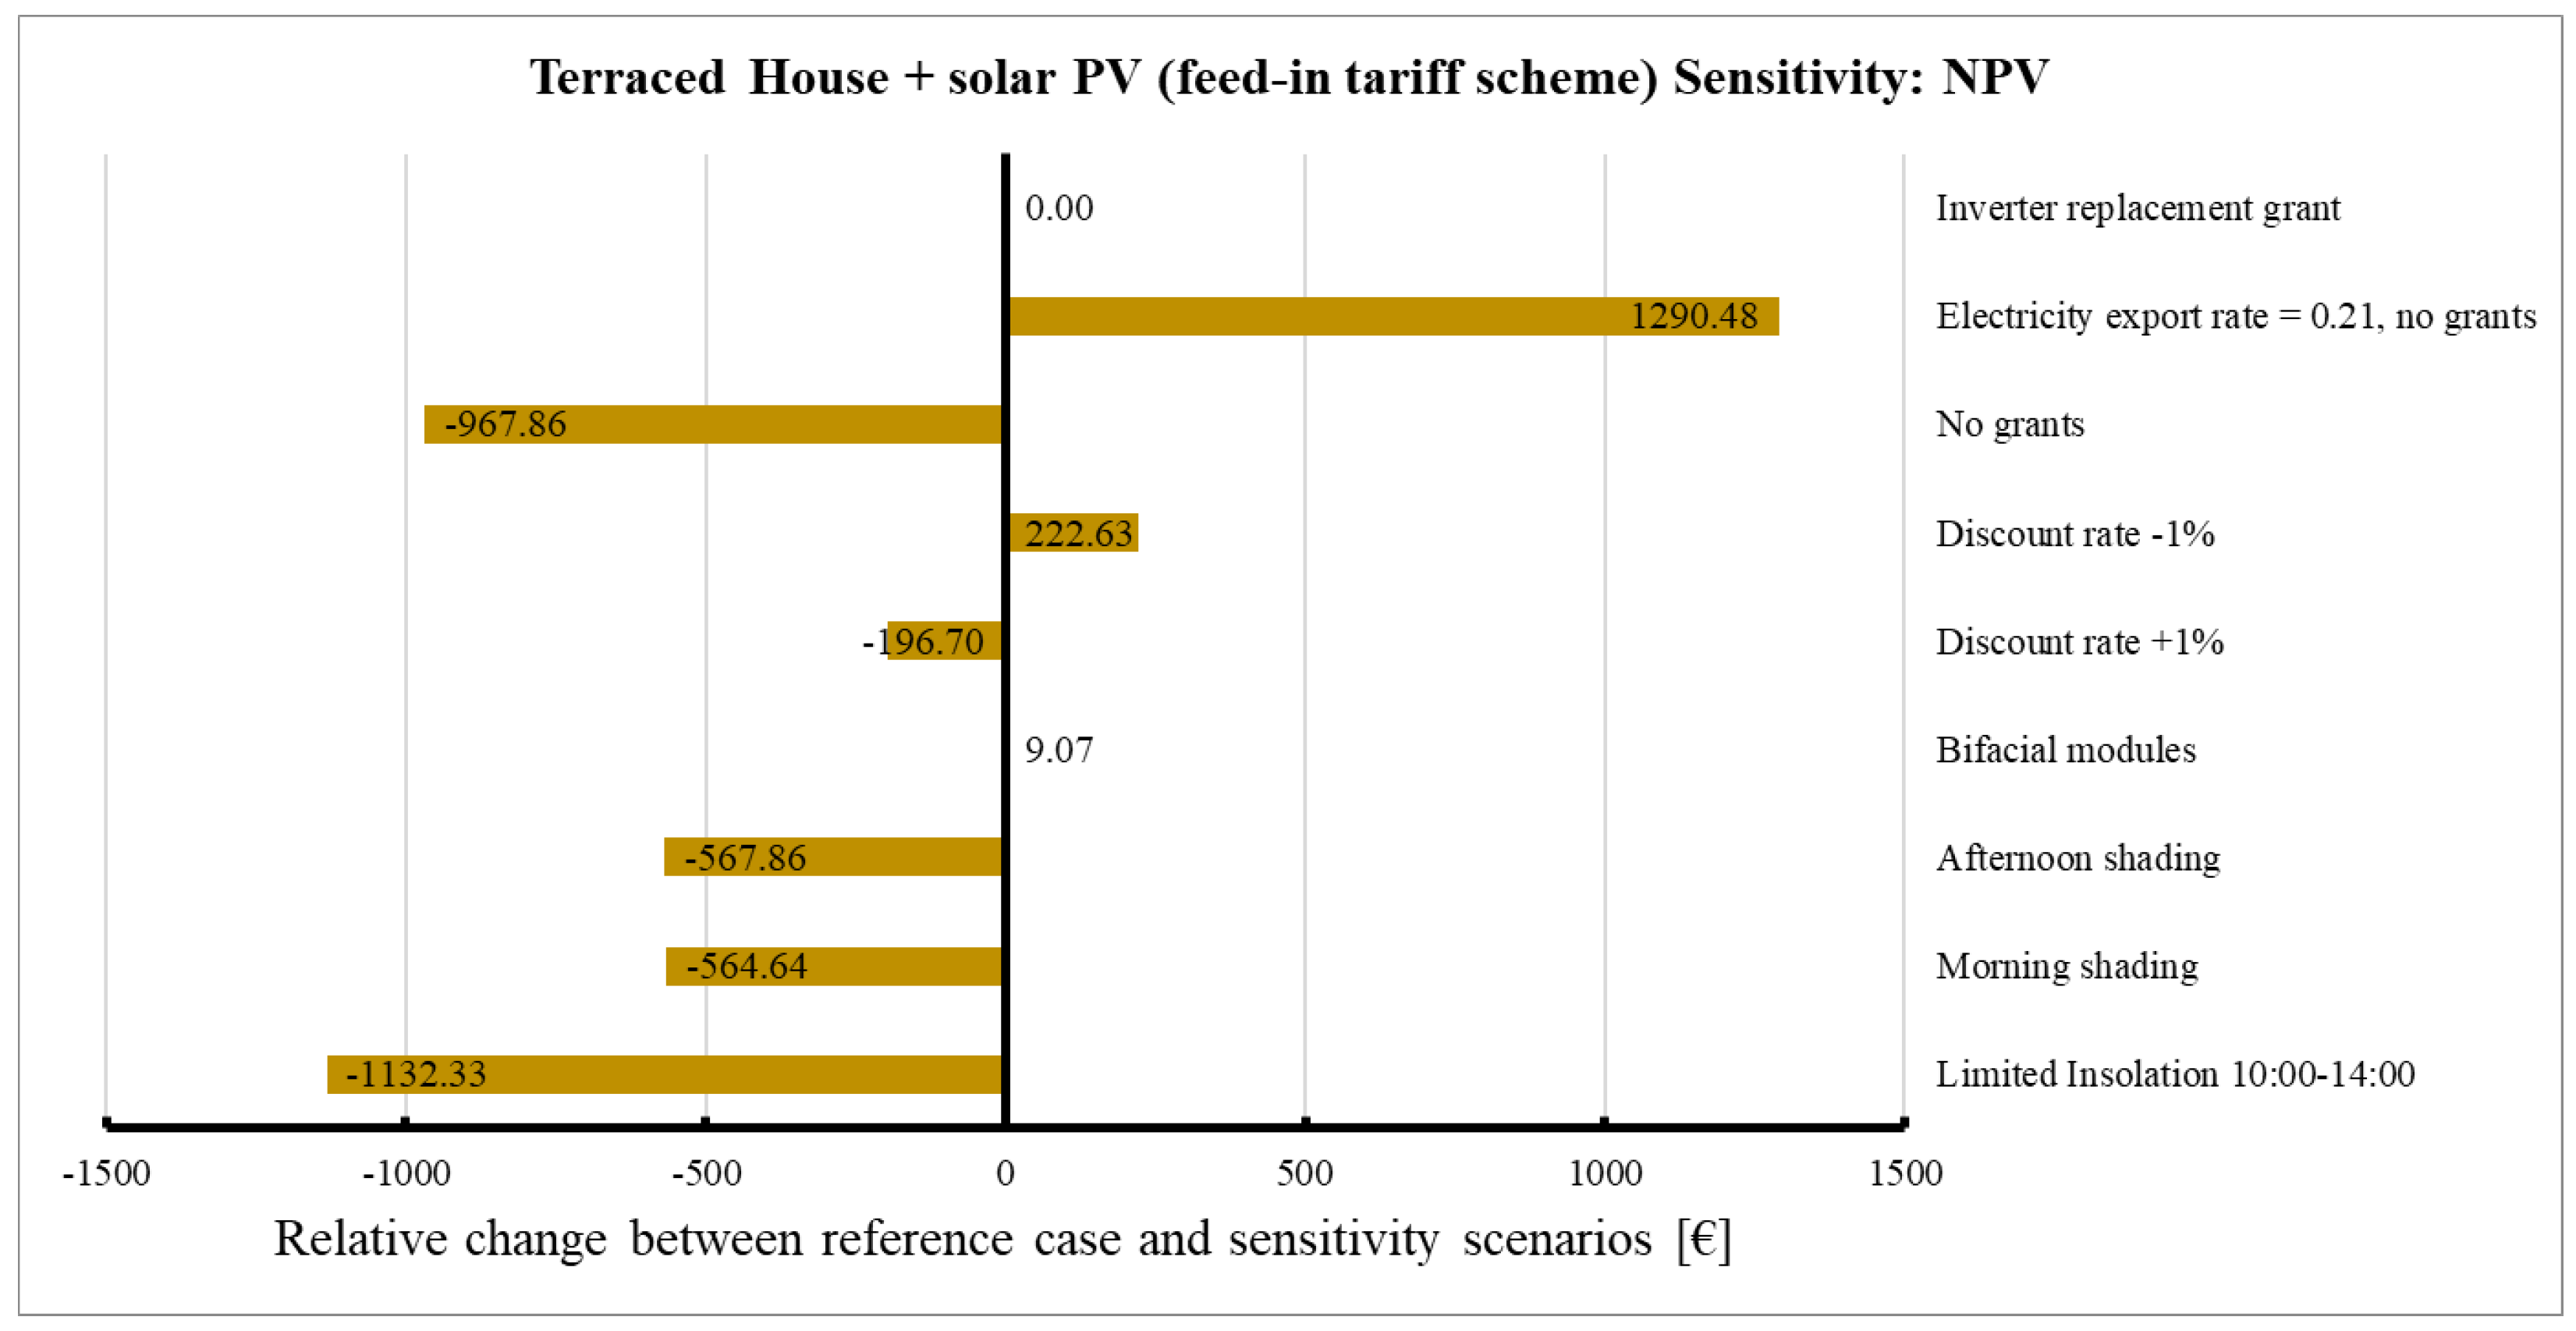
When comparing
Figure 9 and
Figure 10, varying the discount rate generally resulted in a higher impact when opting for the FIT scheme (
Figure 10) across the solar PV configurations analysed.
Since SWH, like solar PVs, depends directly on solar radiation levels, shading conditions were considered as major sensitivity factors. Apart from shading, the sensitivity analysis for SWH reference cases included the discount rate, fiscal support mechanisms, collector area, and electricity consumption rate. In line with preliminary research conducted across all solar PV and SWH configurations, the effect of shading was found to be critical for both technologies for technical performance and economic feasibility. One observation with regards to the solar collector area was that doubling the collector area does not result in a proportional increase in the annual energy savings, as can be seen in
Figure 11, depicting the absolute relative changes from the reference scenario of simulation run 6.
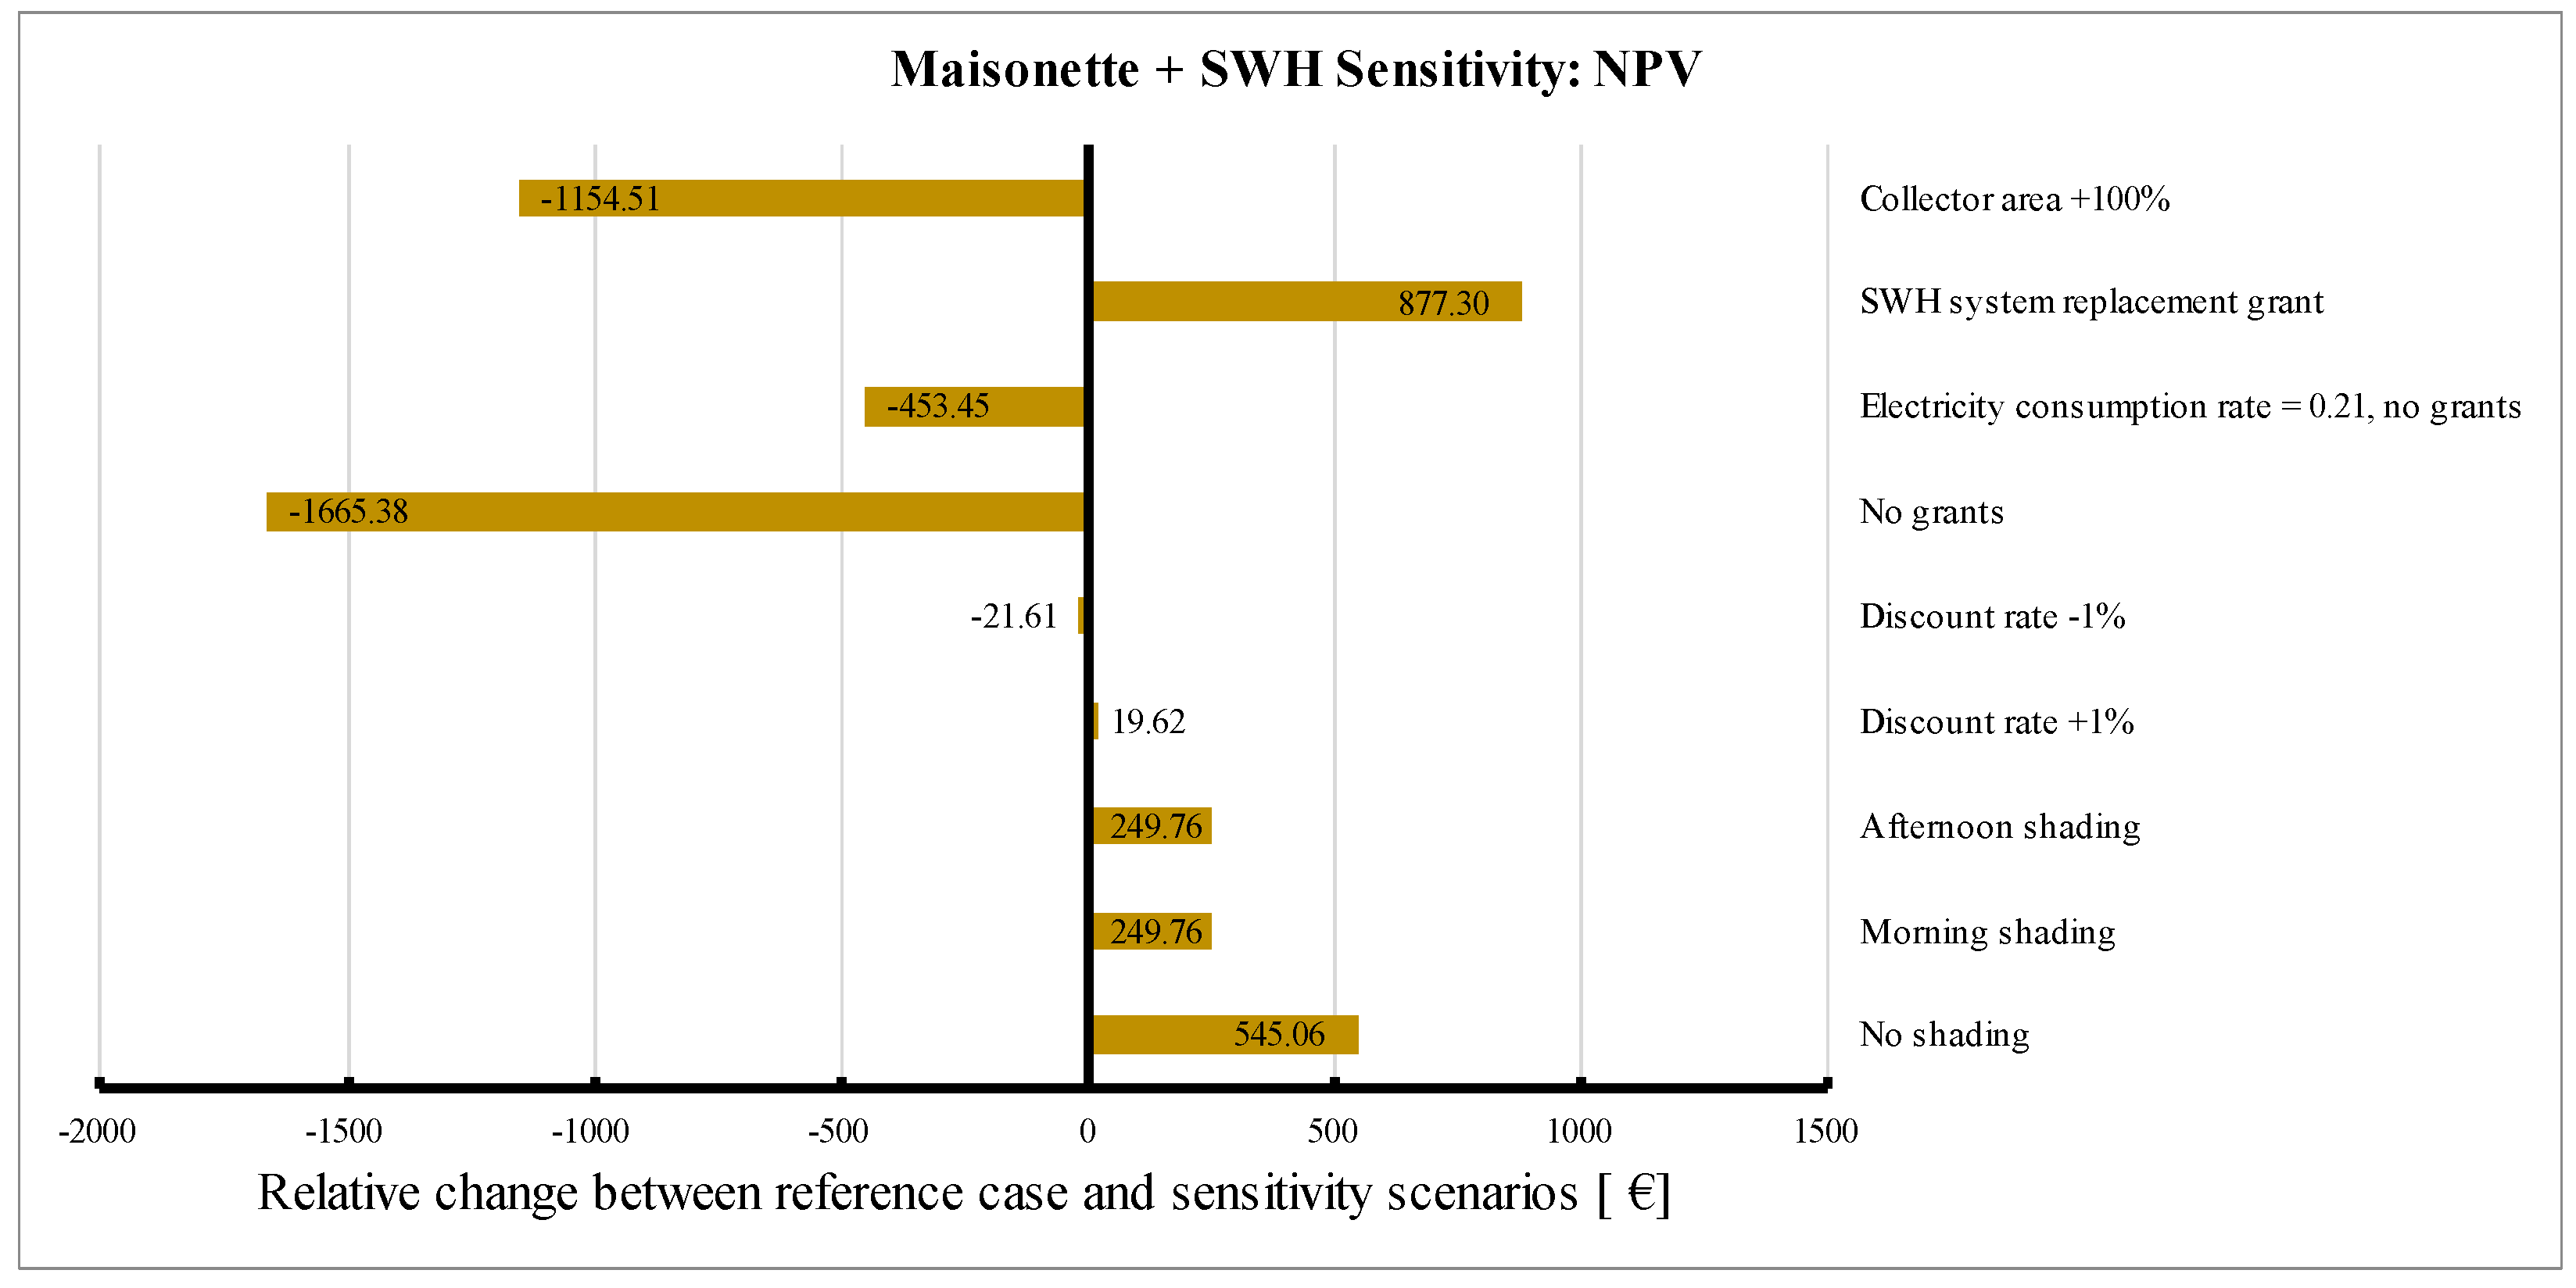
As such, the significant reduction in
NPV observed reflects the added capital costs of a larger collector, which are higher than the increase in monetized energy savings throughout a twenty-year lifetime. Moreover, it was shown that south-facing, ETC installations generally perform better with larger sizes of collector. Overall, the SWH configurations were deemed to be more economically dependent on capital grants than in the case of solar PV systems. In fact, when excluding the grants, the effect on the
NPV was far more devastating. When simulating the higher electricity consumption tariff with no grants, the impact of the electricity energy consumption by the backup heater during low solar irradiation periods for all SWH configurations was mostly negative (refer to
Figure 12). The absence of grants for this case also negatively impacts the
NPV for solar heating. When comparing this scenario to the PV sensitivity analyses of
Figure 9 and
Figure 10, it is clear that PVs is more advantageous.
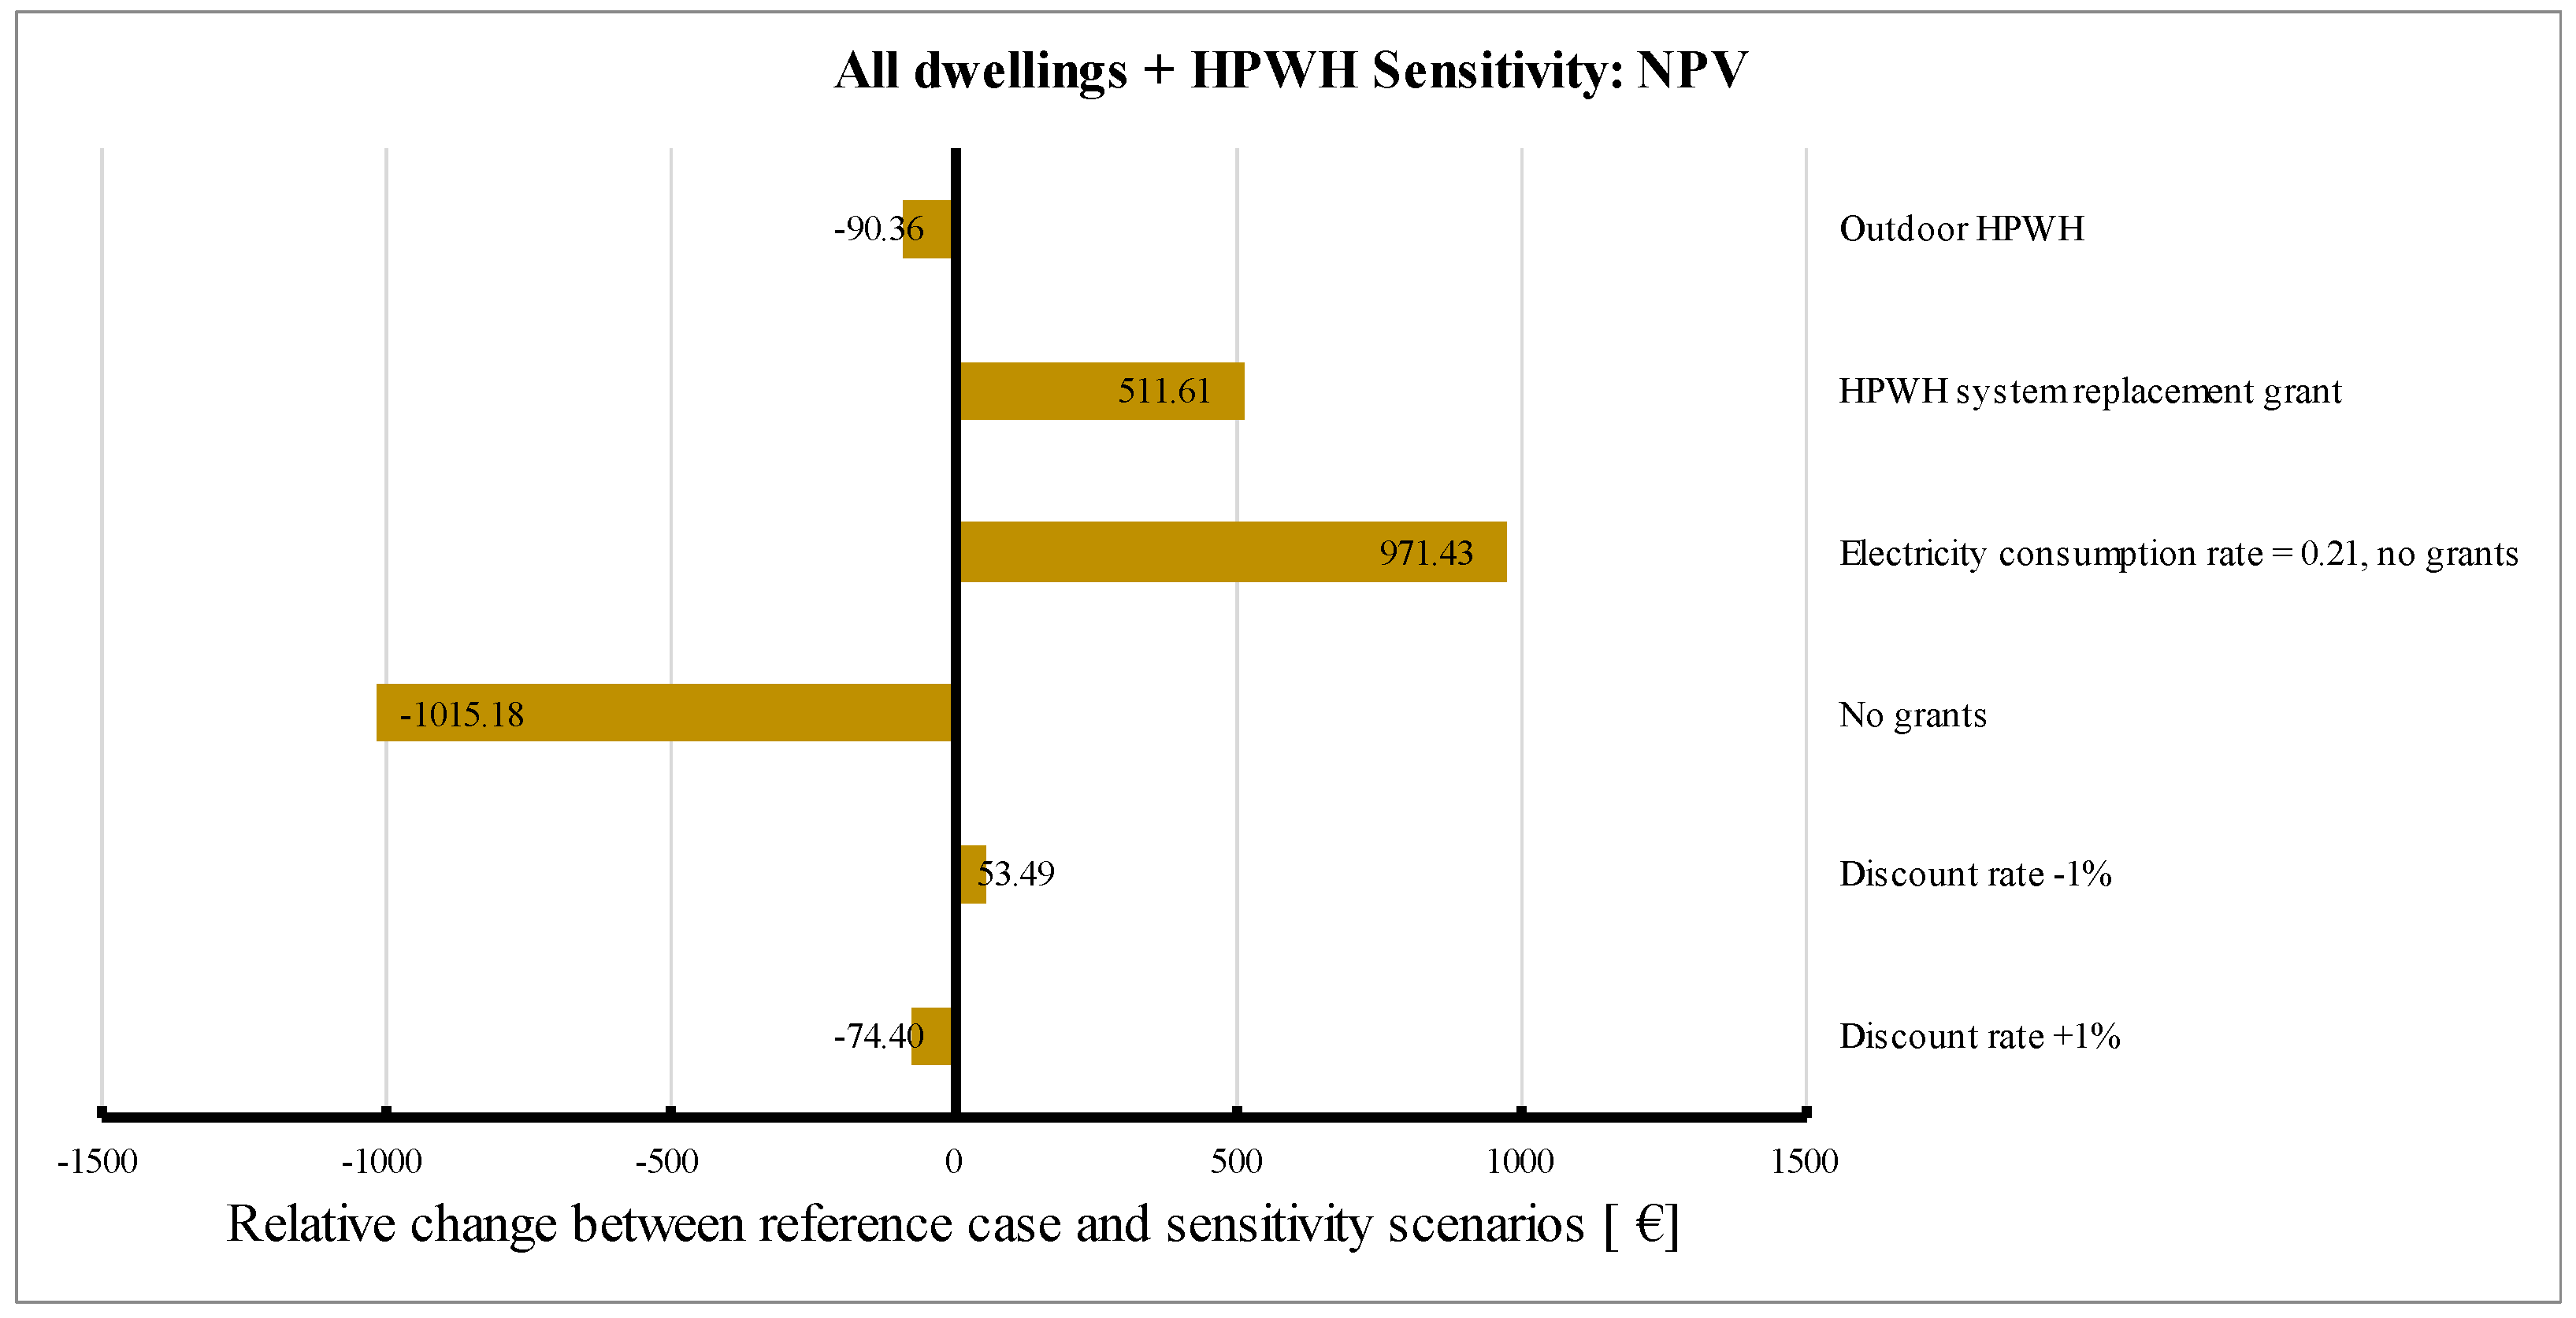
The sensitivity of the reference HPWH system was analysed with respect to the discount rate, local fiscal support mechanisms, electricity consumption rate, and location of installation. The HPWH configuration was originally modelled for all dwelling types being considered in the study as the same indoor system. This is because HPWH units can be placed practically anywhere as long as there is sufficient space and fresh air supply. Outdoor installation of the HPWH system is the only factor which caused a change in the annual energy savings. However, since the effect obtained was only a decrease of 6 kWh, the reference case was not deemed sensitive to the location of the system, at least with regards to energy yield. For this reason, only the economic sensitivity analysis graph, highlighting absolute relative changes in the
NPV for the reference case, is presented in
Figure 13.
5. Discussion
Having outlined the results of the observations and analyses conducted, the final step in the study was to highlight their combined implications in the context of practical application of residential RES technologies. The considerations that need to be taken to maximize the energy and financial yields for residential RES in dwellings are discussed.
Even though the reference results indicate that terraced house and penthouse SWH systems are better value compared to solar PV systems, they are considerably less popular than PVs (refer to
Figure 5). This factor was attributed to the grant scheme variations throughout the past decade or so, which were relatively higher for solar PVs than for SWH. The responses also align with the lower reference energy yield simulated from solar PV and SWH installations in maisonettes and apartments. Due to a consequentially lower economic benefit, fewer homeowners choose to install RESs in sub-optimal arrangements. On the other hand, being only represented by four responses, HPWH technology may be considered as almost non-existent in Maltese households.
Table 10 was generated to summarize the energy yield and economic benefit effectiveness for each type of dwelling, as obtained from the reference analysis results. As expected, solar technologies proved most effective economically for dwelling types with sufficient space for implementation, while HPWH excelled in dwelling types that generally lack outdoor space. In general, the simulated performance of HPWH indicates that the technology is severely underutilized.
A major issue hindering the widespread implementation of residential rooftop RESs is shading or fear of potential shading from third-party properties. Currently, there is no legislation compensating private investors if a third party develops property that would result in the shading of installed solar RES technologies in adjacent dwellings. The literature highlights that relevant legislation, as present in other EU countries, should be enacted in line with the existing promotional fiscal support schemes [
45]. This would ensure that private property investors are compensated accordingly if their solar RES energy yield is threatened by future developments. In this study, the impact that shading has on multiple configurations has been modelled and found to be significant enough to render a residential RES project economically unfeasible. It was also shown that even though a solar RES installation may be shaded throughout specific periods of the day, the overall energy yield and associated monetary benefit might still be high enough to generate a positive return on investment across the project’s lifetime, thanks to the abundance of sunshine in Malta amounting to 1825 kWh/m
2 per year [
4]. Hence, available space and shading conditions should be considered on a case-by-case basis, since a dedicated configuration can lead to a profitable installation, even if it might not seem to be so at first glance.
With regards to fiscal support schemes, the continual availability of sufficient financial assistance not only serves as an effective market stimulator but also allows for reinvestment when replacement is required. Here, it should be highlighted that no configuration simulated would be economically viable if no fiscal support is available at the current base tariffs of energy exportation and consumption. Therefore, it is important for policymakers to strike a balance across the fiscal support schemes made available for different RES technologies.
Another observation was made regarding occupancy levels and hot water demand. A direct relationship has been demonstrated to exist between the dwelling occupancy level, electricity consumption, and the water heating demand. The residential electricity consumption tariff bands in Malta are set up such that the average annual tariff increases if pre-determined thresholds are exceeded by the household. Hence, for a high occupancy dwelling, the annual average electricity consumption tariff becomes higher than that used in the reference economic benefit analysis. This, coupled with a continuous water heating requirement, results in more attractive energy savings when using either SWH or HPWH. As such, SWH and HPWH should certainly be considered for higher occupancy dwellings.
Regarding self-consumption and the implementation of energy storage technologies, the results obtained clearly highlight that based on current market conditions, investment in such systems does not make economic sense. While the impact of charging/discharging cycles on energy yield was found to be relatively low, the capital cost of even a small energy storage system is too high to render any configuration modelled profitable. Nonetheless, energy storage systems still offer the opportunity for homeowners to become independent of the national electrical grid. Moreover, combining self-consumption and energy storage with elevated electricity tariff conditions for high energy consumers might result in a more favorable result.
Another factor brought to light throughout the analysis is the unequitable distribution of fiscal support to different configurations of dwellings and RES technologies, and the impact this has on comparisons made across different scenarios. Hence, as presented by the sensitivity iteration where the grants were excluded, the impact of fiscal support on NPV is constant across the same systems, even if they are installed differently and in varying conditions. By referring to the return on the investment of typically high-yielding and low-yielding configurations, local policymakers could revise existing schemes and allocate available funds to promote investment equitably, if the outputs are relatively substantial. For example, allocating higher grants to partially shaded roofs or for systems that must be placed in non-optimal positions such as horizontally or vertically, could accelerate the penetration of RESs in more dwellings.
6. Conclusions
The main aim of this study was to explore how the implementation of RES technologies may be optimized to achieve a higher energy yield and economic benefit from the Maltese residential building stock. However, the results achieved in this study may be considered as relevant to any project focusing on the implementation of RES technologies in central Mediterranean dwellings. Several conclusions were made:
HPWH is severely underutilized, especially in dwellings with limited space available for the optimal installation of solar RESs.
Although shading plays a major role in the performance of solar RESs, shaded configurations should be considered case-by-case in an informed manner, as these can be economically viable.
Residential RES systems in Malta are economically feasible largely due to the fiscal support schemes in place. Providing these schemes more equitably across different configurations would positively impact the adoption of RESs by maisonettes and apartments.
Higher occupancy dwellings benefit more from HPWH and SWH technologies than the average household.
At the time of the study, energy storage systems are still considered economically infeasible, even considering local fiscal support.
With reference to the subject matter, the arguments formulated in the discussion section serve as optimization proposals which are applicable in the practical sense. These attempt to answer frequently asked questions regarding the adequate implementation of RES technologies in households. Hence, the significance of the work is derived from its practicality, as it may be confidently referenced to reflect actual expectations by anyone examining the RES potential in central Mediterranean dwellings. The study has achieved this through the quantification of the technical and economic viability of different RES configurations and dwelling type combinations.
The methodology has been well detailed to allow for the replication of such a study in any location. A direct continuation to this work could be through the combination of the sensitivity factors highlighted. While in the analysis each factor was applied separately from the rest, another analysis could examine the effect that multiple factors have when they are applied together. These compounding results could then be numerically presented in the form of a matrix which would serve as the main deliverable of the project. Essentially, the matrix would map out the combined changes in sensitivity factors and correlate their magnitudes to the effect on the techno-economic performance of residential RES systems.
The main limitation of the analysis was the fact that one set of household characteristics was considered, based on averaged values as obtained from the data collected from both the literature and the questionnaire. Hence, each reference and sensitivity scenario featured the average occupancy, energy consumption, and water consumption values (among other factors), irrespective of dwelling type and RES configuration. This certainly had an impact on the accuracy of the quantitative results obtained. However, due to the nature of the study, such a decrease in accuracy did not affect the outcome sought, as the results attained could be confidently used as clear indications.


