Article

Study on the Coupling Coordination Degree and Driving Mechanism of “Production-Living-Ecological” Space in Ecologically Fragile Areas: A Case Study of the Turpan–Hami Basin

1
School of Information Science & Engineering, Shandong Agricultural University, Tai’an 271018, China
2
Technology and Engineering Center for Space Utilization, Chinese Academy of Sciences, Beijing 100094, China
3
Institute of Aerospace Information Innovation, Chinese Academy of Sciences, Beijing 100094, China
4
College of Earth Sciences, Guilin University of Technology, Guilin 541004, China
5
School of Marine Technology and Geomatics, Jiangsu Ocean University, Lianyungang 222005, China
6
School of Surveying and Geoinformation Engineering, East China University of Technology, Nanchang 330013, China
*
Authors to whom correspondence should be addressed.
Sustainability 2024, 16(20), 9054; https://doi.org/10.3390/su16209054
Submission received: 30 July 2024 / Revised: 16 September 2024 / Accepted: 9 October 2024 / Published: 19 October 2024

Abstract

:
One of the key conditions for achieving superior regional growth is ensuring the harmonious development of both the layout and functions of territorial space. Territorial space, which includes production space, living space, and ecological space, serves as a critical system and venue for economic, cultural, and social activities in a region. The harmonized growth of production–living–ecological space (PLES) is essential for attaining sustainable development goals. Research on PLES offers a fresh perspective on promoting sustainable development of the spatial domain and the sustainable use of resources. However, studies on PLE functions in ecologically fragile areas are lacking. Therefore, in this study, which adopts a PLES perspective, land-use data are used to classify land according to the dominant functions of production, ecology, and living. Integration of point-of-interest (POI) data with socio-economic data was established to spatially describe indicators at the grid level and create a scoring system for PLES indicators in ecologically fragile areas. Finally, the entropy weight method, holistic assessment methods, coupling coordination degree model (CCDM), and geodetector were employed to explore the coupling coordination relationships and factors influencing PLESs in the Turpan–Hami Basin from 2010 to 2020. The results indicate that the Turpan–Hami Basin consists predominantly of potential ecological space, mainly in the central and northern regions, which are characterized by the Gobi Desert and bare rock landforms. Over the past decade, the PLES framework has seen a notable rise in the allocation of residential and ecological areas, whereas the portion dedicated to production spaces has diminished. The overall coupling coordination degree (CCD) of PLES in the Turpan–Hami Basin is at a coordinated level and gradually increasing. The most significant impact on the degree of PLES coupling coordination is exerted by population and natural factors. The research findings provide theoretical support for the sustainable utilization of resources in the Turpan–Hami Basin and other ecologically fragile areas while also offering scientific evidence to promote the coupling coordination of PLES, thereby contributing to high-quality regional development.

1. Introduction

Since the beginning of the 21st century, China has made notable advancements in socio-economic development. However, the accelerated processes of industrialization and urbanization have intensified rivalry and conflicts between human activities and natural systems, triggering a series of global issues, including climate disruption, energy shortages, and food security [1]. China is currently undergoing a pivotal transition period regarding the development of high-quality regional economies. During this process, the issue of land use has become increasingly prominent, representing a core challenge that demands urgent resolution [2]. Territorial space is a multifaceted entity that encompasses a range of functions and applications, providing both a bedrock and conduits for human, social, and economic advancement. Since the 17th National Congress, the country has placed significant emphasis on the coordination of territorial spatial planning and regional development. A series of policies have been proposed with the objectives of enhancing ecological civilization, optimizing spatial development, advancing major function-oriented zoning strategies, and establishing related protection systems. The 18th National Congress of the Communist Party of China placed great emphasis on the importance of optimizing the pattern of territorial spatial development as a fundamental measure for advancing ecological civilization. The objective is to facilitate the creation of productive and efficient work environments, loveable and sustainable communities, and aesthetically pleasing natural habitats characterized by clear streams and verdant mountains [3,4,5]. The effective mitigation of conflicts between human activities and the natural environment and the achievement of coordinated territorial development have become pivotal issues in the field of regional development research.
The production–living–ecological space (PLES) concept is an exhaustive framework that encompasses a multitude of spatial domains within human society and serves as a pivotal conduit for economic and social advancement [6]. These three spaces are independent entities, yet they are closely interconnected, reflecting the complex and intricate coupling relationships between natural systems and socio-economic systems [7]. Research on PLES has its roots in European discussions on agricultural multifunctionality [8,9]; it draws upon theories and methodologies from a range of disciplines, including ecology, geography, and planning, to present a multifaceted and interdisciplinary research field [10]. Currently, numerous developed countries, including the European Union and Japan, have repeatedly engaged in spatial planning initiatives [11,12]. Germany has consistently pursued theoretical exploration and development in this field to provide robust support for effective spatial planning. Concurrently, the Netherlands has conducted a comprehensive assessment of the development requirements of diverse regions in spatial planning, thereby ensuring the comprehensiveness and practicality of the plans [13,14]. Currently, scholars worldwide have devised multiple classifications pertaining to the environmental and landscape roles of land, with the objective of elucidating the diverse values associated with this natural resource. Researchers such as Groot have emphasized the multiple functions of natural systems [15], and Willemen has explored the interactions among landscape functions [16]. Within the framework of sustainable development, some scholars have proposed assessment systems that integrate land multifunctionality, emphasizing the pivotal role of ecological value in supporting production services. These studies offer a theoretical basis and practical instructions for comprehending and utilizing PLES [17,18]. In China, PLES research has considered its definition, spatiotemporal changes, classification evaluation, and functional interactions, providing important perspectives for understanding and optimizing territorial space. For example, researchers such as Liu Jilai have developed PLES classification methods and analyzed the changing trends in China’s PLES structure [19]. From an integrated perspective, synthesizing land functions, ecological services, and landscape roles, Li Guangdong and colleagues developed a classification framework for urban PLES functions. Furthermore, they have incorporated assessments of ecosystem service value into the calculation of spatial function values [20]. Huang Jinchuan and colleagues provided an in-depth explanation of the definition and core elements of PLES [21]. Gao Xing and colleagues focused on the concept of PLES, examining the practices of the New Area of Xiong’an in terms of land-use function transformation and its ecological and environmental impacts [22].
Based on differences in land-use functions, an evaluation index system was established to quantify the characteristics of production, living, and ecological functions. This system demonstrates strong regional specificity and comprehensive integration in its assessment framework, providing distinct advantages in functional identification [23]. The interactions among the elements of PLES represent a typical complex coupled system. The coupling coordination degree model (CCDM) can be employed to assess the degree of coordination among multiple subsystems within complex systems. Based on the established evaluation framework, CCDM can be utilized to analyze land-use changes and predict future trends [24]. In recent years, the CCDM has demonstrated unique advantages in evaluating the complex interactions among ecological, economic, and social systems [25]. The CCDM quantifies the coordination among system elements, accurately reflecting the effectiveness of their interactions. Through this model, the interactions and interdependencies among different systems can be quantified, providing a scientific basis for understanding and optimizing them. The CCDM has been widely applied in research fields such as urban ecology [26,27], soil and vegetation [28], and urbanization [29], yielding significant results [30]. In recent years, research on the coupling coordination of PLES has garnered increasing attention from scholars, though the body of work remains relatively limited. A deep understanding of the coupling coordination between PLES functions is crucial for achieving regional sustainable development goals, making it a key research focus and a leading topic in international human–environment system science and sustainability science. However, the selection of indicator factors in existing evaluation systems tends to be overly generalized, with limited integration of ecological models in the research [31]. This gap urgently needs to be addressed to advance more comprehensive studies on sustainable development. Additionally, the existing research primarily focuses on the spatiotemporal distribution and evolutionary characteristics of coupling relationships [32,33]. Particularly, further research is needed to thoroughly comprehend the interactions between the changes in the degree of coupling coordination between regional socio-economic systems and ecosystems and the factors that influence these changes. A comprehensive examination of these intricate interactions can facilitate a more nuanced comprehension of the interconnections between disparate systems. This, in turn, can offer a scientific foundation and efficacious strategies for the coordinated advancement of regional PLESs.
At present, as the research continues to deepen, studies on PLES are becoming more specific and refined, with the research scale gradually narrowing from national [34] to provincial and municipal levels [35,36] and further down to district and county levels [37,38], even reaching the village level [39]. However, relatively little research has been conducted at the grid scale, and comparative studies across different scales are also lacking. Moreover, most of the domestic research is concentrated on individual cities and economically developed regions [40,41], with minimal attention being given to the evaluation of the PLE functions in ecologically fragile arid areas in the western regions [42]. Specifically, existing studies lack sufficient comprehensiveness in examining how PLES functions interact with intensive human activities in these ecologically fragile western regions. This study on the spatial development of the Turpan–Hami Basin offers valuable insights for optimizing land spatial planning in the arid and ecologically fragile regions of Northwest China while also providing a practical case for land-use planning at the county level. The methodology developed in this research has broader applicability and can serve as a reference for spatial planning in other ecologically fragile regions. Moreover, the study holds significant theoretical and practical implications for promoting coordinated urban–rural development and advancing the Western Development Strategy in China.
Accordingly, the Turpan–Hami Basin is adopted as the research area and assessed from a PLES perspective. First, land-use data from 2010, 2015, and 2020 are used to delineate the PLES of the Turpan–Hami Basin. The INVEST model is used to evaluate and quantify the ecological indicators of the Turpan–Hami Basin. A combined evaluation index system for PLE functions in the Turpan–Hami Basin is constructed by integrating local policies and regional characteristics with POI data and socio-economic data. This system enables the quantitative visualization of the indicators at the kilometer grid scale. Based on this foundation, the entropy weight method, land-use transfer matrix, comprehensive evaluation methods, and CCDM are employed to analyze the spatiotemporal characteristics of PLES in the Turpan–Hami Basin from 2010 to 2020 and the CCD of the PLE functions. Furthermore, the research contrasts these metrics at the county and grid scales and employs the geodetector to analyze the extent to which various factors influence the CCD of the PLE functions in the Turpan–Hami Basin. This research endeavors to (1) examine the spatial distribution patterns of PLES in the Turpan–Hami Basin for the years 2010, 2015, and 2020; (2) construct an evaluation index system for the PLE functions in the Turpan–Hami Basin and investigate the coupling coordination relationships within PLES; and (3) examine the influencing factors and driving mechanisms behind these coupling coordination relationships. As a result of the research, optimal land use can be achieved, and high-quality, sustainable development can be promoted in vulnerable ecological areas.

2. Materials and Methods
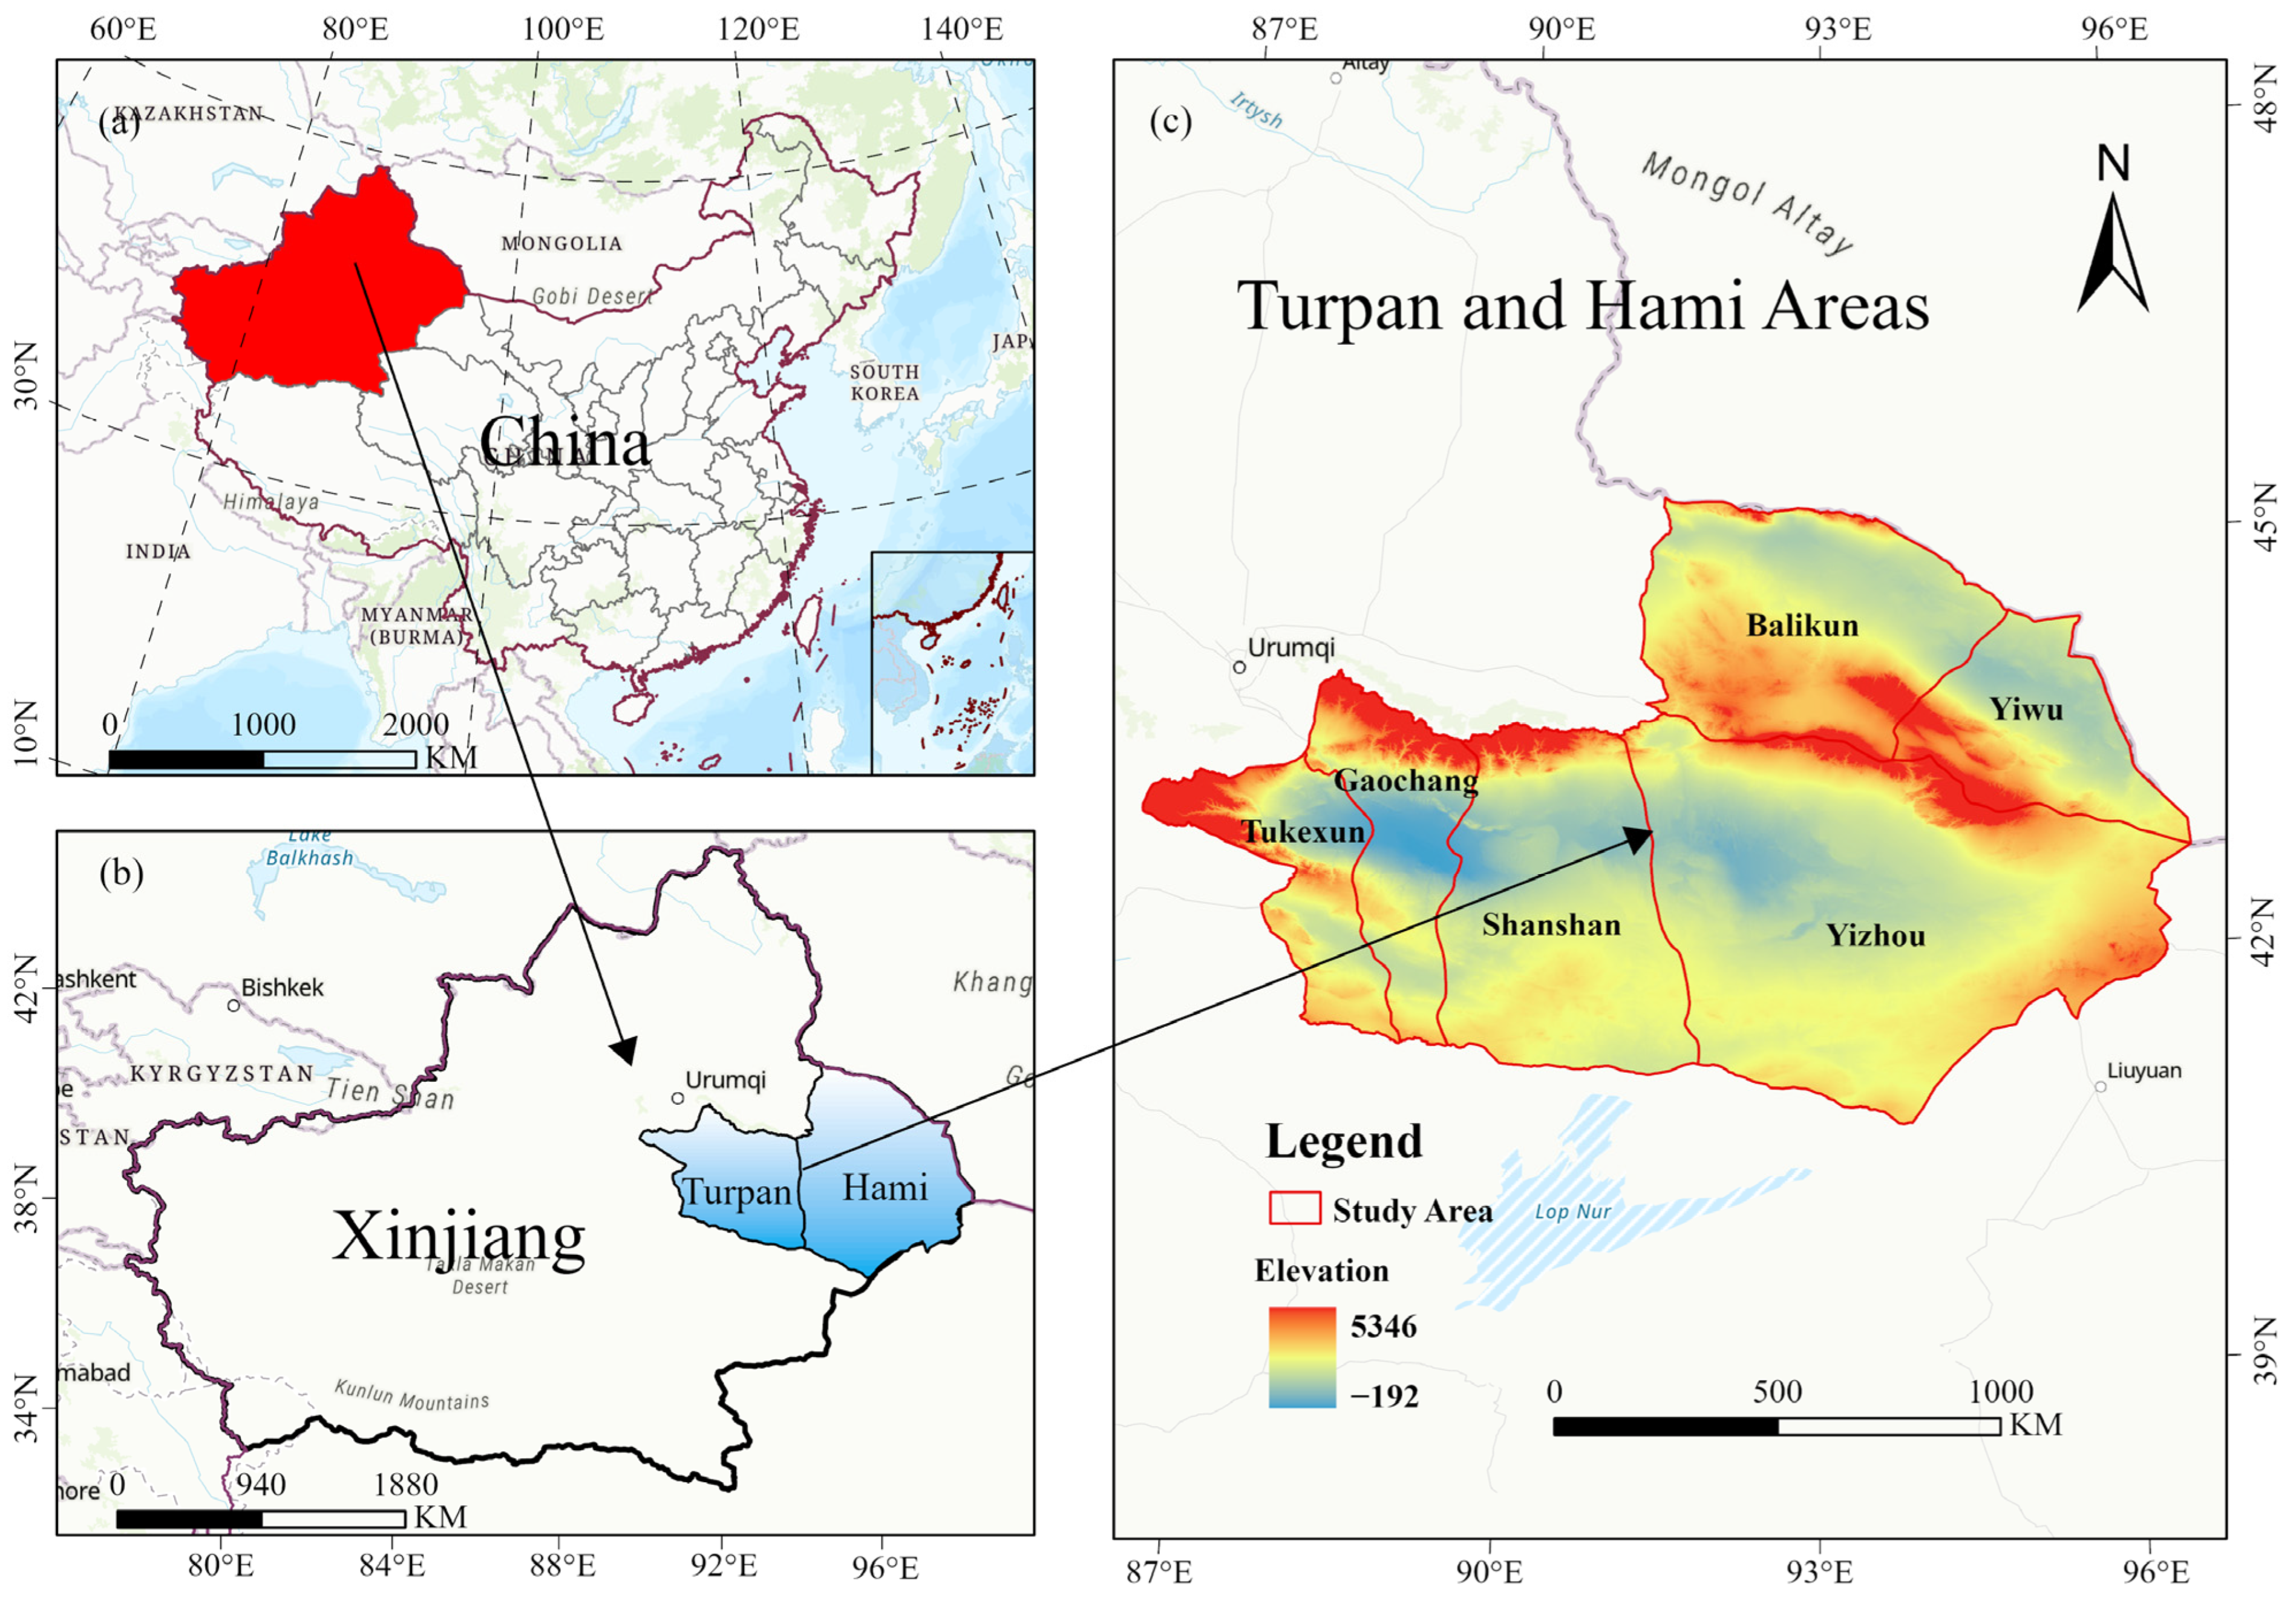
2.1. Study Area

The Turpan–Hami Basin, commonly designated as the Turpan Basin and Hami Basin, is situated in the northeastern region of Xinjiang, China (86°44′55″~96°25′0″ E, 40°49′13″~45°3′21″ N) and extends in an east–west direction (Figure 1). The basin comprises two districts (Gaochang, Yizhou) and four counties (Tuokexun, Shanshan, Balikun, and Yiwu). Surrounded by mountains, the basin stretches 660 km from east to west and 60 to 100 km from north to south, covering a total area of approximately 53,500 km2. The average elevation is approximately 1173.36 m, with a maximum elevation difference of 5538 m, creating a significant topographical contrast between the high mountains in the north and the low mountains in the south.
The Turpan–Hami Basin is distinguished by a typical continental arid climate, with strong solar radiation and a long duration of sunshine. The average temperature ranges from approximately 10.00 °C to 14.50 °C. The annual average precipitation is approximately 20 mm, whereas the annual evaporation exceeds 3000 mm. Owing to the sparse and uneven distribution of precipitation coupled with intense evaporation, the region suffers from extreme water scarcity, very low vegetation coverage, and a highly fragile ecological environment.
Despite the extreme climatic challenges, the Turpan–Hami Basin is home to a plethora of natural resources and a distinctive ecosystem. As one of the three major oil and gas basins in Xinjiang, the Turpan–Hami Basin is endowed with substantial reserves of coal, oil, and natural gas, which significantly drive regional economic development. Furthermore, the basin is characterized by extensive pastures that are well-suited for livestock farming.

2.2. Data

This study employed a multi-source data approach, integrating land-use/land-cover data, meteorological data, POI data, elevation data, and social statistics over a five-year period from 2010 to 2020 (Table 1).

2.3. Method

2.3.1. Categorization of Land Use Within PLES

The basis for the formulation of territorial strategies for spatial planning and management is the land-use classification studies carried out with PLES. The productive space designation is reserved for areas where industrial, agricultural, and commercial activities are concentrated, as these are the primary sources of economic vitality within the region [21]; this space includes paddy land, dry land, industrial and mining land, etc. Living space includes the environment in which residents live their daily lives and socialize and aims to provide a safe, comfortable, and convenient living environment for urban residents [40]; this space includes urban land and rural settlements. Ecological space denotes land capable of delivering ecological services, either directly or indirectly, such as ecological regulation and biological support. This space is crucial for the regulation, maintenance, and protection of ecological security [43] and includes forestland, grassland, water bodies, and other unused land. To objectively evaluate the main function of the land, the actual situation of the study area was considered, and on the basis of previous studies [19,20,44], a systematic classification was carried out according to the multiple functionalities of the land and its dominant functional characteristics to construct the PLES classification system of the Turpan–Hami Basin (Table 2).

2.3.2. Land-Use Transfer Matrix

The land-use transfer matrix represents a valuable analytical instrument that is employed extensively in ecological and geographical studies. By quantifying the conversion relationships between disparate land-use categories, crucial data for a better understanding of land dynamics alterations and their ecological ramifications can be obtained [45]. The mathematical model is expressed as follows:
S i j = S 11 S 12 S 1 n S 21 S 22 S 2 n S n 1 S n 2 S n n
The variable S i j represents the total area of category i PLES at the study’s inception, which transitions to category j PLES by the study’s conclusion. The value of n denotes the number of types of PLES utilization.

2.3.3. Construction of a PLE Functional Evaluation Indicator System for Ecologically Vulnerable Areas

The PLE functional evaluation index system is a multidimensional composite system. The system encompasses the three spatial functional subsystems of production, living, and ecology, with the objective of providing a comprehensive assessment of the coordinated development and interaction of these subsystems. In this study, production functions are categorized mainly into agricultural and economic aspects. The agricultural production function reflects the capacity to supply agricultural and livestock products and the level of agricultural development in the region; the non-agricultural production function assesses the region’s economic development. The living function focuses on evaluating the security and welfare of the population, where security is manifested through the accessibility of medical services and cultural education, and social welfare reflects the material and cultural living standards and quality of life of the population. The ecological functions primarily focus on achieving ecological protection objectives. In this context, the INVEST model is used to quantify indicators such as water yield, carbon storage, soil retention, and habitat quality, serving as parameters for assessing ecological functions.
The indicator evaluation system is constructed with strong regional relevance in mind, and the localized indicator system provides a solid foundation for the in-depth study of coupled coordinated evolution, offering a detailed and systematic theoretical framework. In accordance with the Opinions of the State Council of the Central Committee of the Communist Party of China on Accelerating the Promotion of Ecological Civilization, the Five-Year Plans of Turpan–Hami Basin, the National Statistical Bulletin, and relevant academic literature, 31 indicators were selected on the basis of the geographic characteristics of the Turpan–Hami Basin and the availability of complete and long-term data. The objective was to provide a comprehensive evaluation of the PLE functions of the Turpan–Hami area and construct a comprehensive evaluation system that reflects the integrated advancement of PLE functions in ecologically fragile areas (Table 3).
1.
Data Standardization
In the evaluation of the PLES functions, multidimensional data such as economic, social, spatial, and ecological data are included. To achieve comparability among different data types, an extreme difference standardization method was adopted to eliminate the quantitative attributes of the data, ensuring that the indicators could be analyzed on the basis of a unified comparative benchmark in the comprehensive evaluation process. The formula is shown below:
X i j = x i j x i j m i n x i j m a x x i j m i n ( P o s i t i v e   i n d i c a t o r )
X i j = x i j m a x x i j x i j m a x x i j m i n ( N e g a t i v e   i n d i c a t o r )
where x i j is the j th indicator for the i t h spatial function; x i j m a x and x i j m i n are the maximum and minimum values, and X i j is the value resulting from data normalization on the basis of the positive and negative attributes of the indicator.
2.
Entropy weighting method to determine weights
In this study, to reduce the potential influence of subjective judgment on the analysis results, the entropy weight method was used to assign weights to the evaluation indicators. This method enhances the objectivity and scientific validity of the evaluation results by automatically determining the importance of each indicator through the calculation of data information entropy [46]. The corresponding formula is articulated as follows:
P i j = X i j i = 1 n X i j
e j = 1 l n n i = 1 n p i j l n p i j
g j = 1 e j
W j 1 = g j i = 1 n g j
where P i j is the weight, X i j represents the processed data, e j represents the information entropy, g j represents the entropy redundancy and W j 1 represents the weighting factor assigned to each indicator.
3.
Constructing a comprehensive evaluation model
F ( x ) , G ( y ) , and Z ( m ) are expressed as the comprehensive evaluation values of the production function, living function, and ecological function, respectively. The formulas are as follows:
F x = i = 1 p a x i
G y = i = 1 q b g i
Z m = i = 1 r c z i
where p , q , and r represent the number of indicators within the three distinct systems; a , b , and c indicate the respective weights assigned to these indicators; and x i , g i and z i denote the standardized values of the indicators.

2.3.4. Coupled Coordination Degree Model

The coupled coordination degree model effectively assesses the interaction and coordination of the three major PLE functions [47]. By quantifying the degree of interaction between different systems, the model provides a key indicator of the state of development of the system. The application of this model can accurately evaluate and promote the coordinated development of the constituent elements in PLES [48], thus improving the overall efficiency and functional integration of the system. The formula is shown as follows:
C = 3 × F ( x ) × G ( y ) × Z ( m ) ( F x + G y + Z ( m ) ) 3 1 3
T = α F ( x ) + β G ( y ) + γ Z ( m )
D = C × T
where C is the coupling degree, and the larger the value, the stronger the PLES interaction and the better the coupling; C 0,1 [49]. T is a comprehensive coordination index. α , β , and γ are the to-be-determined weighting coefficients and α + β + γ = 1 ; in this study, α = β = γ = 1 / 3 . D is the extent of the coupling coordination.
The CCD values are classified into six types, as listed in Table 4.

2.3.5. Geodetector

Geodetector is an advanced statistical method that is based on spatial statistics and spatial autocorrelation theory and is dedicated to resolving spatial anisotropy [50]. Through geodetector, the influence of each driving factor on the spatial distribution characteristics and its significance can be accurately assessed, revealing the strength of the interaction between the factors and demonstrating important application value in risk detection and assessment.
Within this research, the influencing factors were discretized on a grid scale and processed through sampling for tabulation. The geodetector method was employed to evaluate the impact magnitude of each factorization on the degree of coupling coordination of PLES through factor detection and interaction detection. It was also used to identify and assess the key drivers affecting the extent of the coupling coordination by comparing the influences of different factors on the extent of the coupling coordination.
1.
Factor detection
Identifying the explanatory power of a single factor (X) on the spatial divergence of the target variable (Y).
q = 1 h = 1 1 N h σ h 2 N σ 2
where q denotes the spatial variability of the impact factors, with a value range of [0, 1]; as the value of the independent variable X increases, so too does its explanatory power and its contribution to the dependent variable Y. N and σ 2 represent the sample size and population variance, respectively, and N h and σ h 2 denote the sample size and variance of subregion h , respectively.
2.
Interaction detection
The effect of the interaction of two or more factors on the target variable is assessed. The effect on the target variable is explained by comparing the q-values of the individual and combined factors. The types of interactions are shown in Table 5.

3. Results

3.1. Analysis of the PLE Function Evaluation Index System in the Turpan–Hami Basin

The entropy weight method was used to calculate the weights of the indicators, as shown in Table 3. The results show that the agricultural production functions and non-agricultural production functions account for 60% and 40% of the production functions, respectively, reflecting the dominance of agriculture in production activities. Among the non-agricultural production function indicators, GDP per capita has the largest proportion, indicating that GDP per capita largely reflects the extent of economic development and the prosperity of production activities in the region. Additionally, cotton production and grain production constitute a large share of agricultural production, which is due mainly to the natural geographic conditions of the Turpan–Hami Basin, as it provides favorable environmental conditions for the cultivation of cotton and grain crops. The weight of the total sown area of crops is similar to that of the effective irrigated area of farmland, both being 0.525, indicating that these two indicators are of comparable importance in agricultural production. An efficient irrigation system is crucial for improving crop survival rates and yields, thereby enhancing agricultural productivity and sustainability. In terms of living functions, there is a small difference between the basic living security functions and social welfare security functions, accounting for 47% and 53%, respectively. Additionally, two key indicators—the resident fixed asset investment and aggregate retail sales of consumer goods—reflect residents’ quality of life and consumption capacity, with weights of 0.135 and 0.178, respectively. A higher level of resident fixed asset investment indicates significant investment in housing and other long-term assets, typically associated with higher living standards and stronger economic capacity. The increase in aggregate retail sales of consumer goods directly reflects the activity level of consumer behavior, serving as a critical indicator of residents’ consumption capacity and quality of life. The weight of carbon storage is 0.39, and the weight of habitat quality is 0.242. These high values indicate the significant role that these two ecosystem services play in local environmental management. Carbon storage is a key factor in global and regional climate regulation, while good habitat quality is directly related to biodiversity conservation and ecosystem health. These results suggest that carbon storage and habitat quality play important roles in adapting to climate change, maintaining biodiversity, and securing the continued provision of ecosystem services.

3.2. Evolutionary Characteristics of the Spatial and Temporal Dynamics of PLES in the Turpan–Hami Basin

Based on the Turpan–Hami Basin PLES classification system, this study reclassified the land-use types in the Turpan–Hami Basin from 2010 to 2020 (Table 6). The responses indicate that PLES in the Turpan–Hami Basin is dominated by ecological space. The potential ecological space is widely distributed, accounting for 77.7% on average, and is dominated by the Gobi desert and bare rock landforms, which are basically stable and have high ecological protection value. Forestland ecological space and grassland ecological space are the next most common spaces, with average proportions of 28.9% and 19.9%, respectively. Woodland ecological space is distributed mainly in high-elevation and steep terrain areas, which are rich in vegetation cover. Grassland ecological space is distributed mainly on the periphery of agricultural areas and more arid areas; these grasslands play important roles in maintaining the ecological balance and supporting biodiversity. Production and living spaces, with a total share of 19%, are located mainly in flat areas, where the flat terrain and fertile soil provide good conditions for agricultural and construction activities. Water ecological space is mainly occupied by the river channels, lakes, and surrounding areas of the Turpan–Hami Basin; its distribution area is small, averaging 18.2%, which is in line with the lack of water resources in ecologically fragile areas (Figure 2).
In this work, the PLES area data of the Turpan–Hami Basin were input into the land-use transfer matrix to illustrate the PLES transitions between 2010 and 2020 (Table 7), and these transitions were subsequently visualized and analyzed (Figure 3). The results revealed that production space decreased by 312.69 square kilometers during the last ten years and gradually shifted to ecological space and living space. Living space increased by 82.69 square kilometers, whereas ecological space increased by 230 square kilometers. This change reflects the ecological restoration and land management policies implemented by the government. With increasing awareness of environmental protection, ecological protection has become an important task in all areas. As an ecologically sensitive area, the Turpan–Hami Basin has implemented a series of ecological protection measures to curb desertification and soil erosion and enhance the ecological service function of the region; these measures include large-scale afforestation, grassland restoration, and wetland protection, all of which have overtaken the original production space. These ecological protection measures improve not only vegetation coverage and ecosystem stability but also regional climatic conditions while enhancing overall environmental quality. In addition, as urbanization progresses, the growing demand for land has led to a greater conversion of more production space into residential living space. The expansion of urban living space not only results in an increase in residential and commercial land but also promotes the development of infrastructure and public services. This trend of urban expansion reflects the need for population growth and economic development and places greater demands on urban planners to find an optimal balance between ecological protection and urban development.

3.3. Evaluation and Analysis of PLE Functions in Turpan–Hami Basin

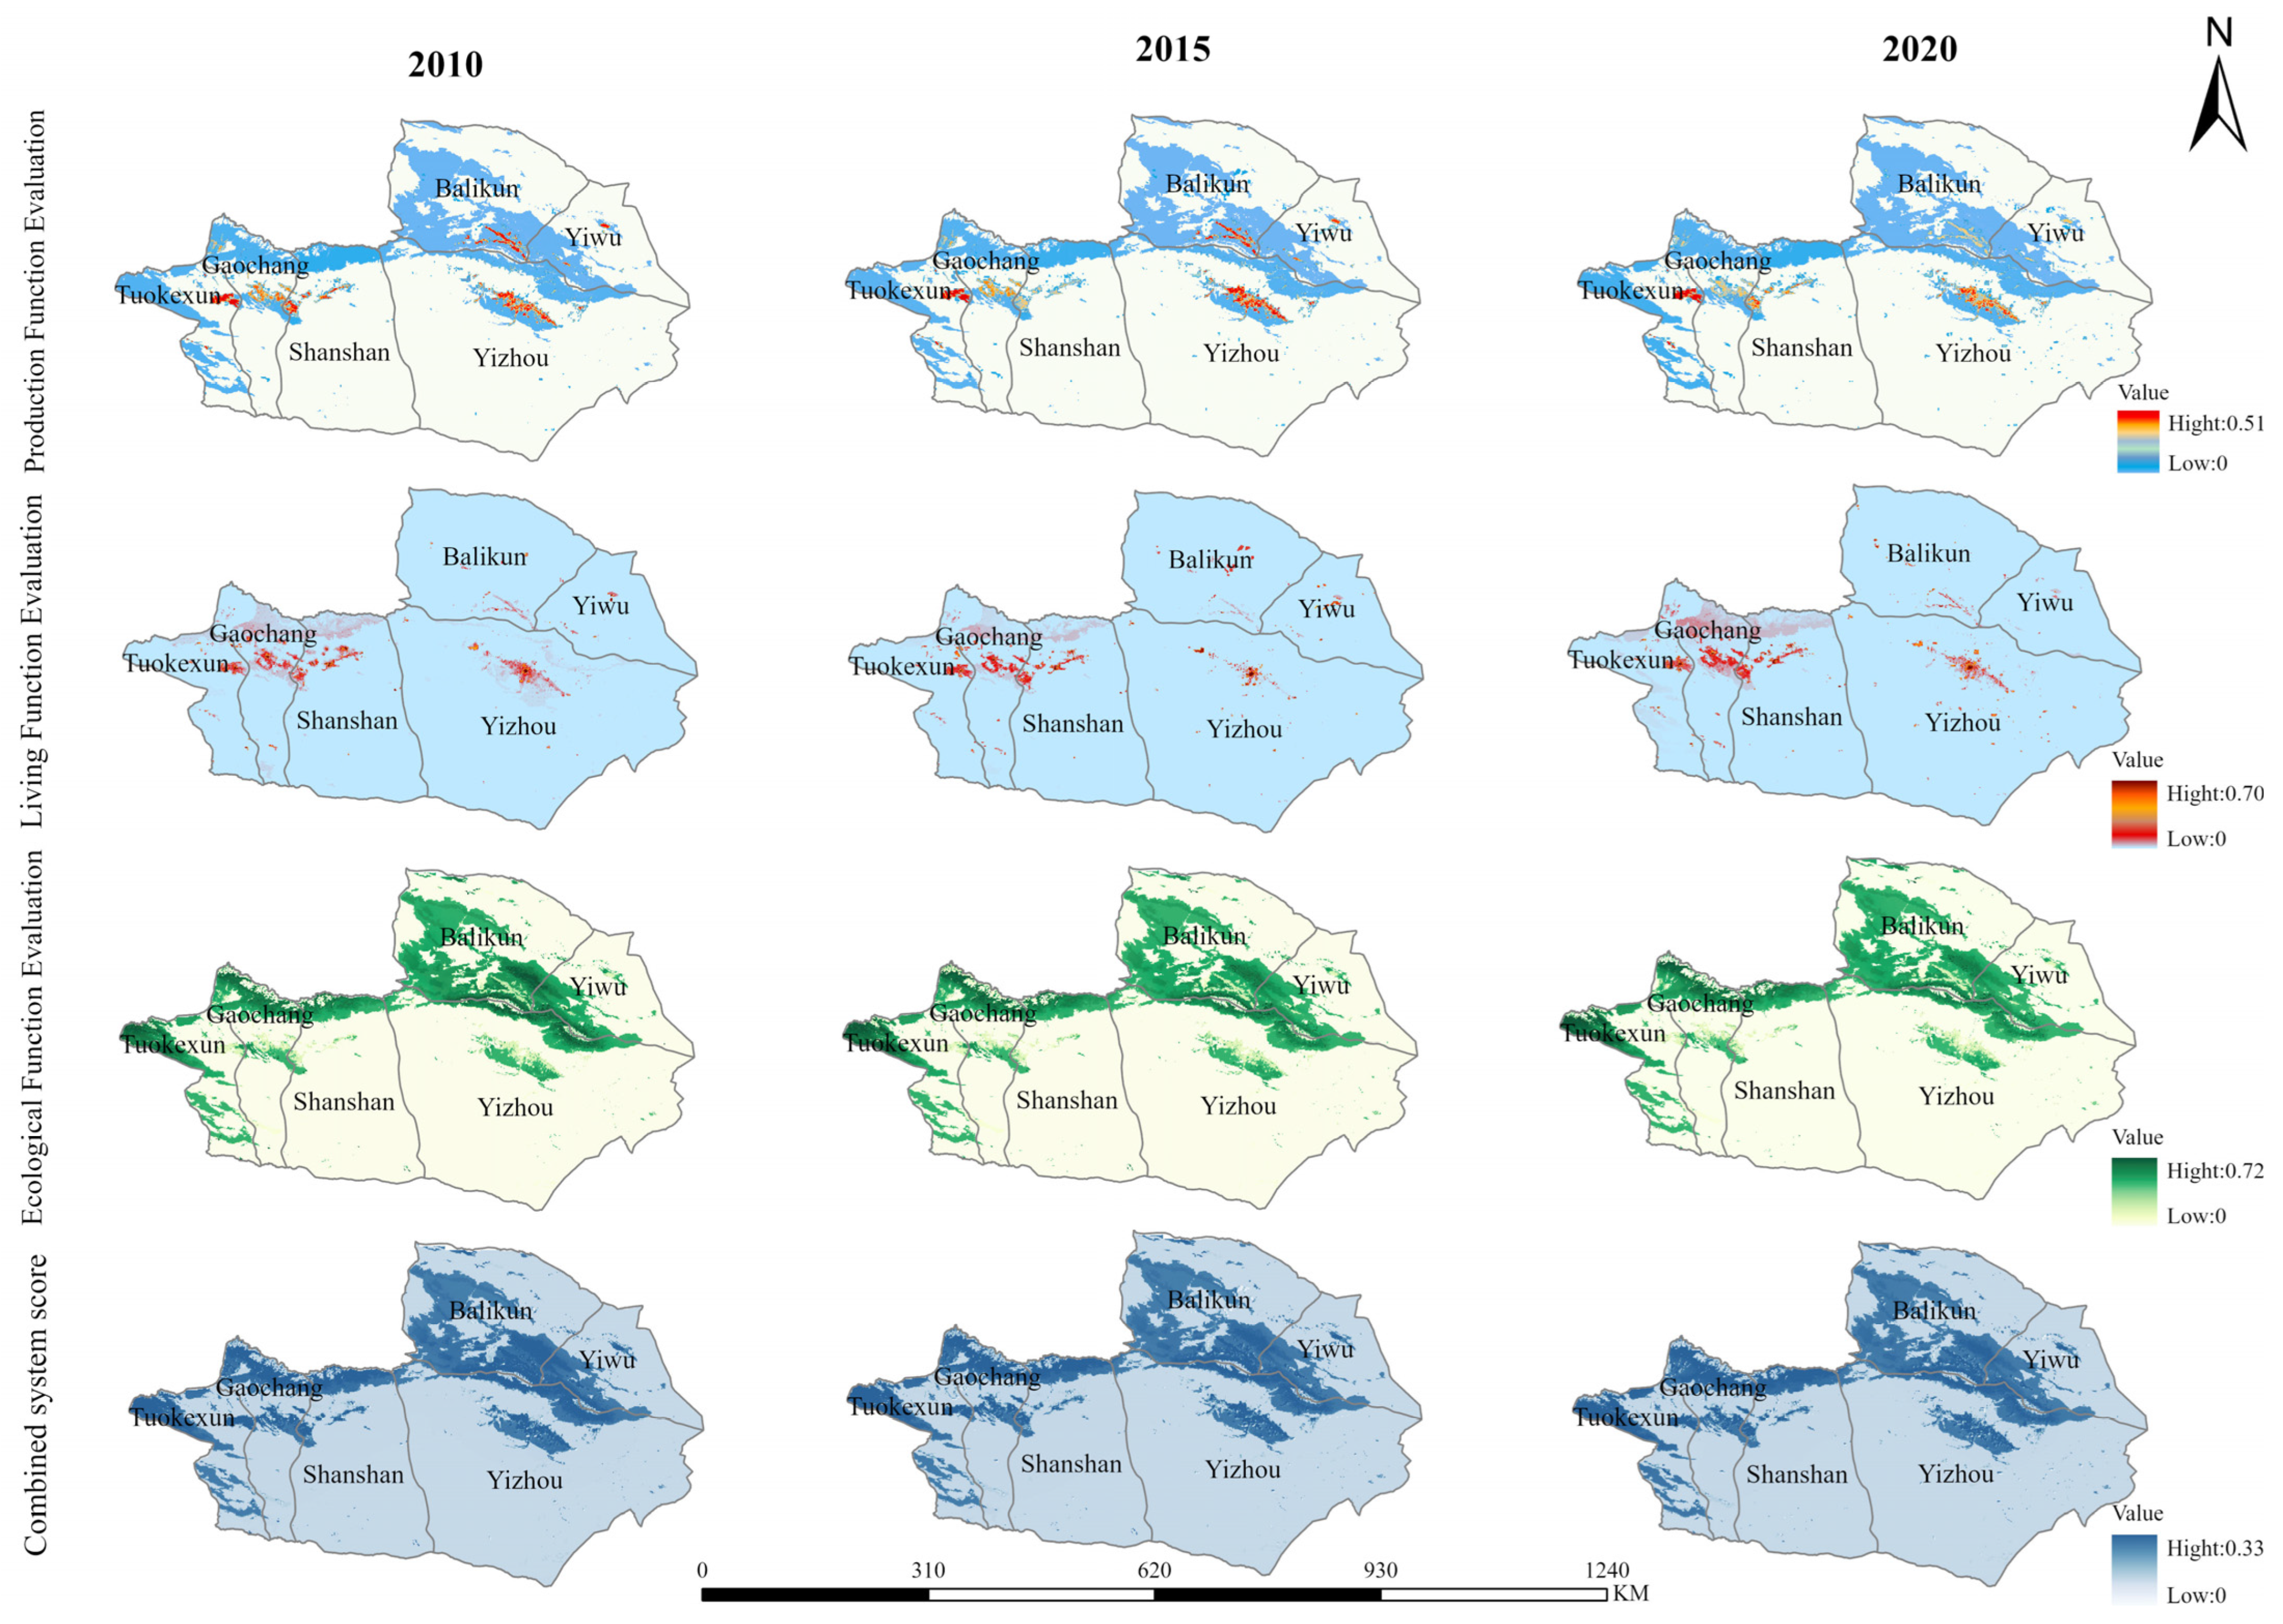
3.3.1. Analysis of the Functional Spatial Evolution of PLE at the Grid Scale

To conduct a comprehensive assessment of the distribution and transformation of PLES in the Turpan–Hami Basin, the PLE functions assessment index system is used to determine its PLE function assessment value and extensive assessment value (Table 3) (Figure 4). The figure shows that from 2010 to 2020, the geographical distribution of each space was similar to the comprehensive score; the production function evaluation value was generally lower than the living function evaluation value and the ecological function evaluation value. This finding indicates that the development level of production activities in the study area was relatively low.
The production function space in 2010 was concentrated mainly in the central and northern regions of the Turpan–Hami Basin, where the density of production activities was high. These regions are the main locations for agricultural, industrial, and mining production activities. By 2015, the production function space had expanded slightly, but the overall distribution remained concentrated, especially in the original high-functionality areas. By 2020, the production function space had expanded further, especially in the northern region, reflecting the further development of agricultural, industrial, and mining production activities.
In 2010, the living function space was concentrated mainly in the southern and central urban areas of the basin, which are densely populated areas with better living facilities. By 2015, the living function space had expanded, especially along major transport routes, reflecting the advancement of urbanization. By 2020, the living function space had expanded further, especially in the southern region, where urbanization and infrastructure development significantly increased living space.
As the year 2010 progressed, the ecological function space was concentrated in the western and northern high-altitude regions of the basin, where the ecosystem is stable and the vegetation cover is high. By 2015, the ecological function space had further expanded, particularly in the northern and western regions of the basin, indicating that ecological protection measures had strengthened during that period. By 2020, the ecological function space had expanded further, reflecting the implementation of ecological restoration measures in the region, which had yielded significant results and improved the overall condition of the ecosystem.
The PLE functions evaluation value was calculated comprehensively, and the maximum value of the comprehensive evaluation value increased from 0.32 in 2010 to 0.33 in 2020. This value decreased in the middle of this period before increasing, resulting in a small increase overall, demonstrating that the sustainable extent of development PLES in the Turpan–Hami Basin still needs improvement. In general, the areas with higher values are primarily situated in proximity to oases and mountainous regions, specifically in the northeast of Turpan City, the center of Gaochang District, the northeast of Yizhou District, and the south of Yiwu County. On the other hand, the desert areas in southern China contain mainly low-value land.

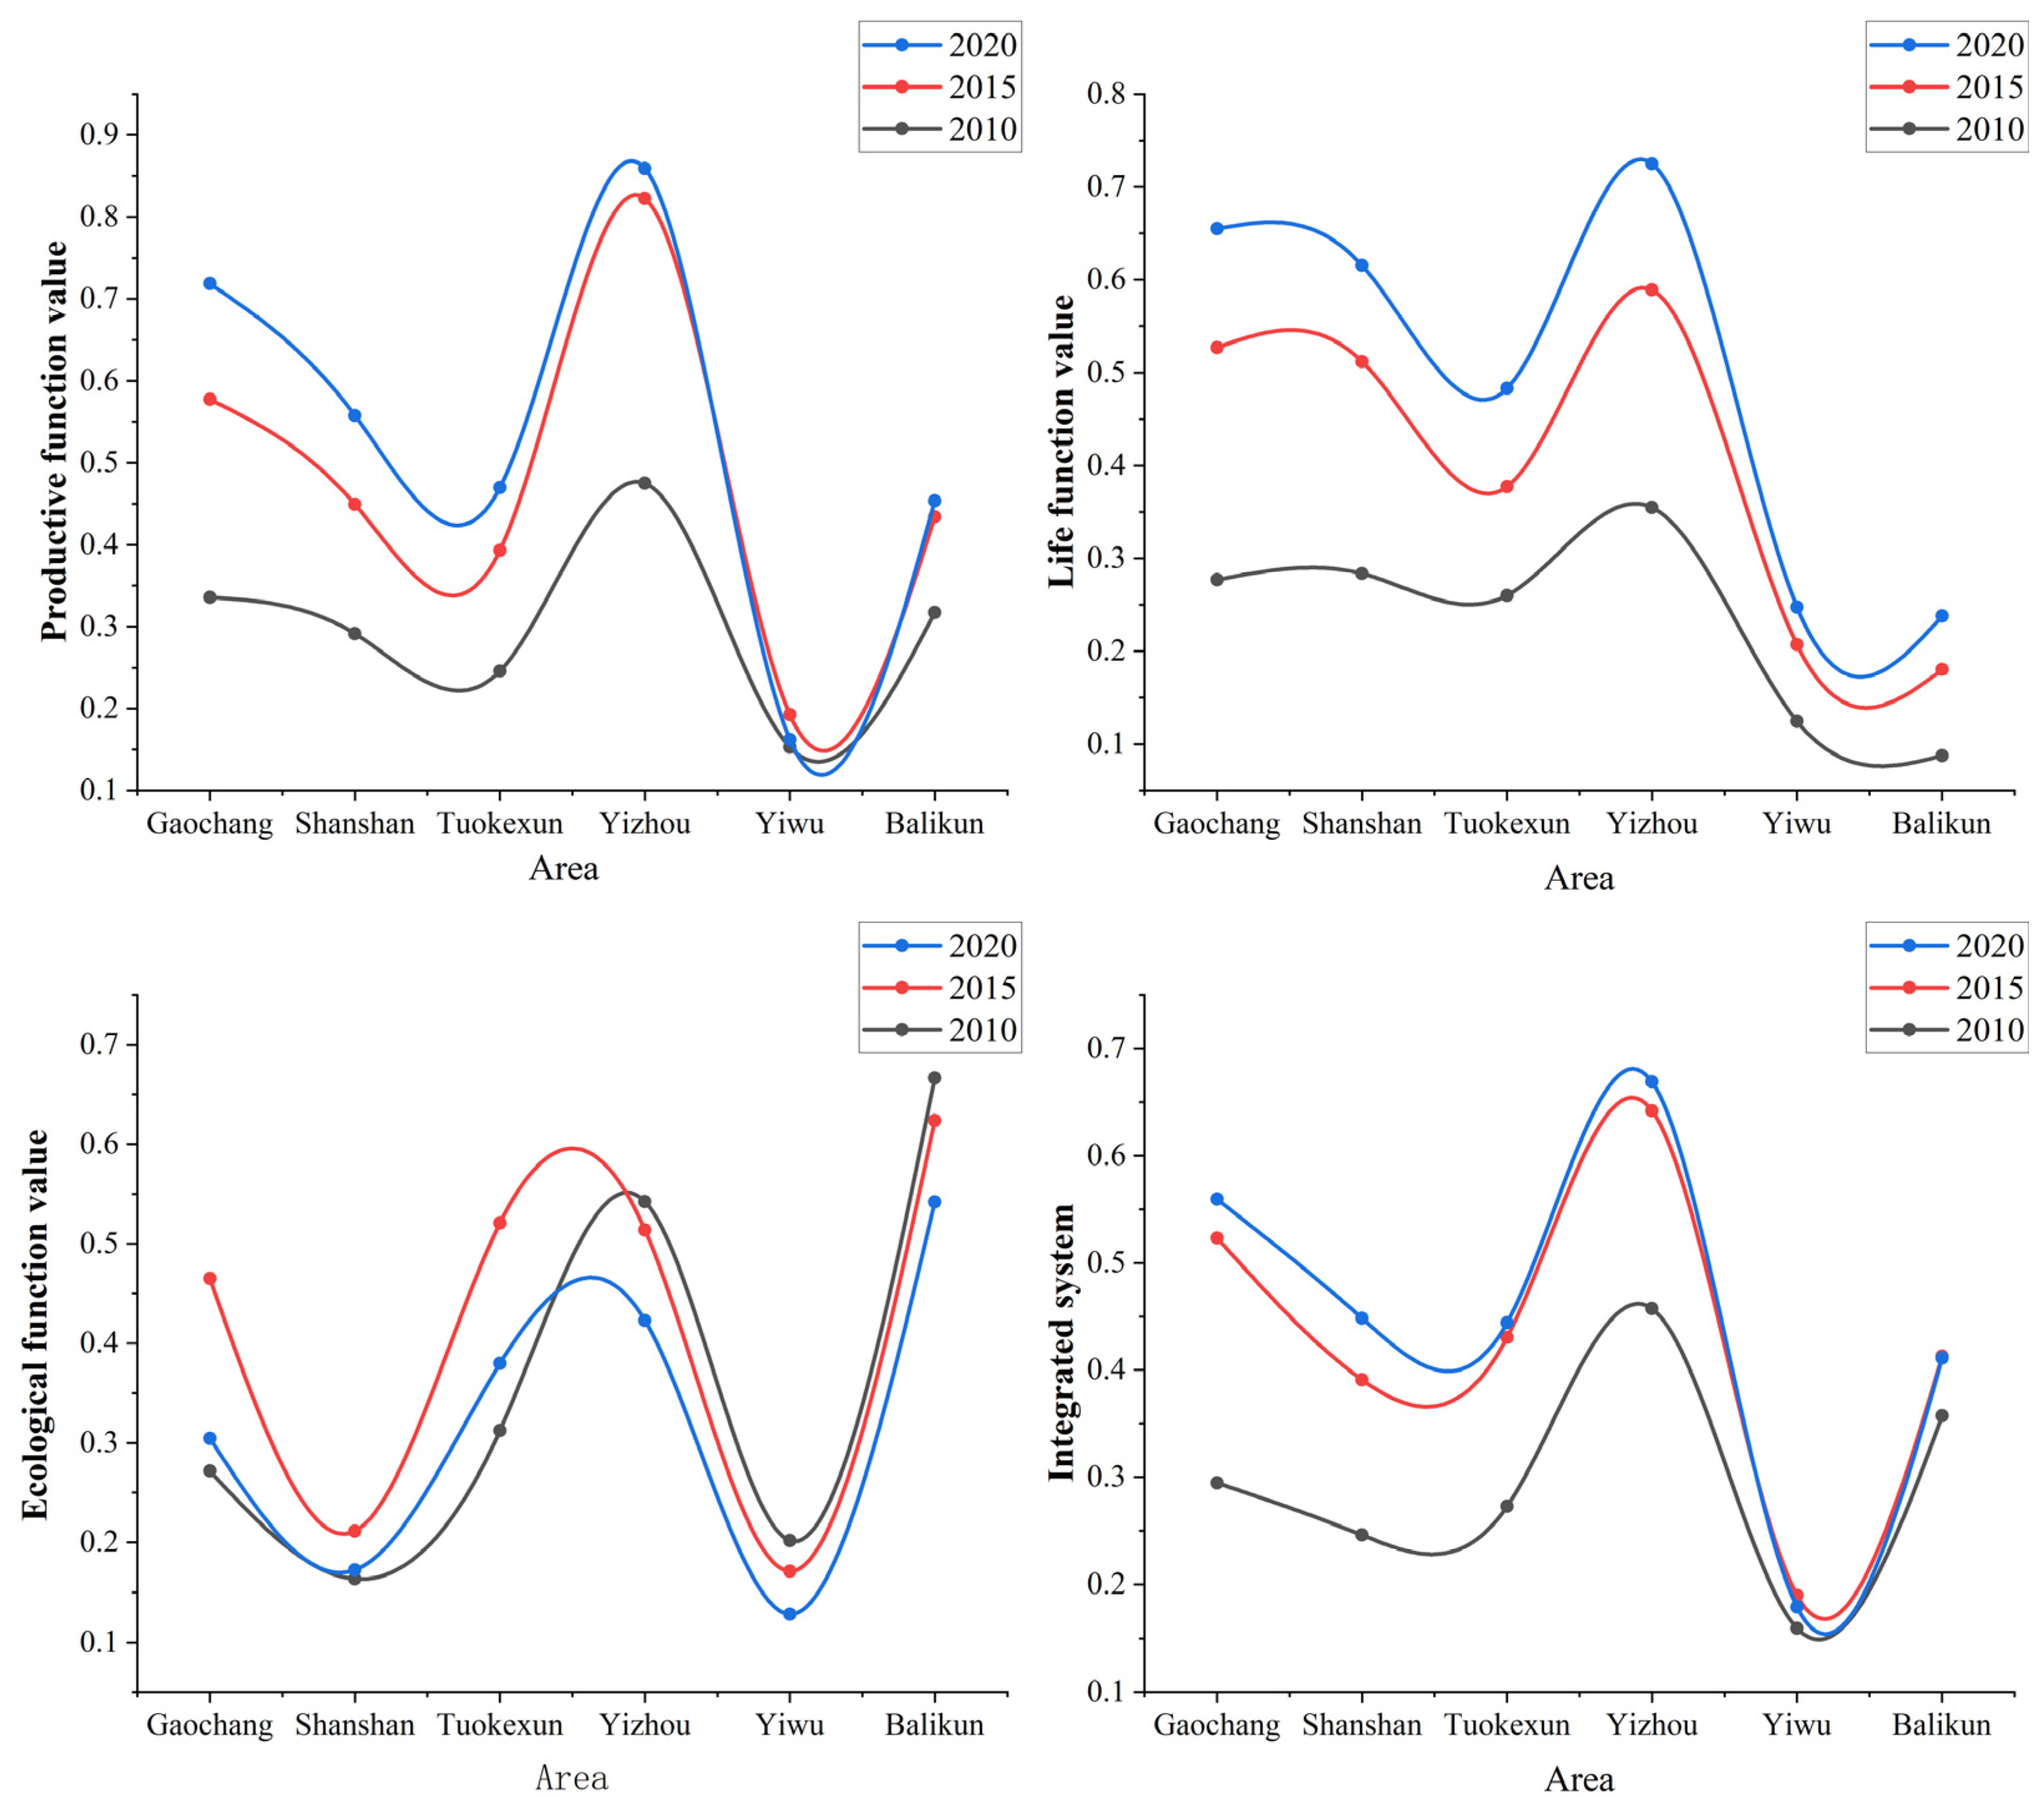
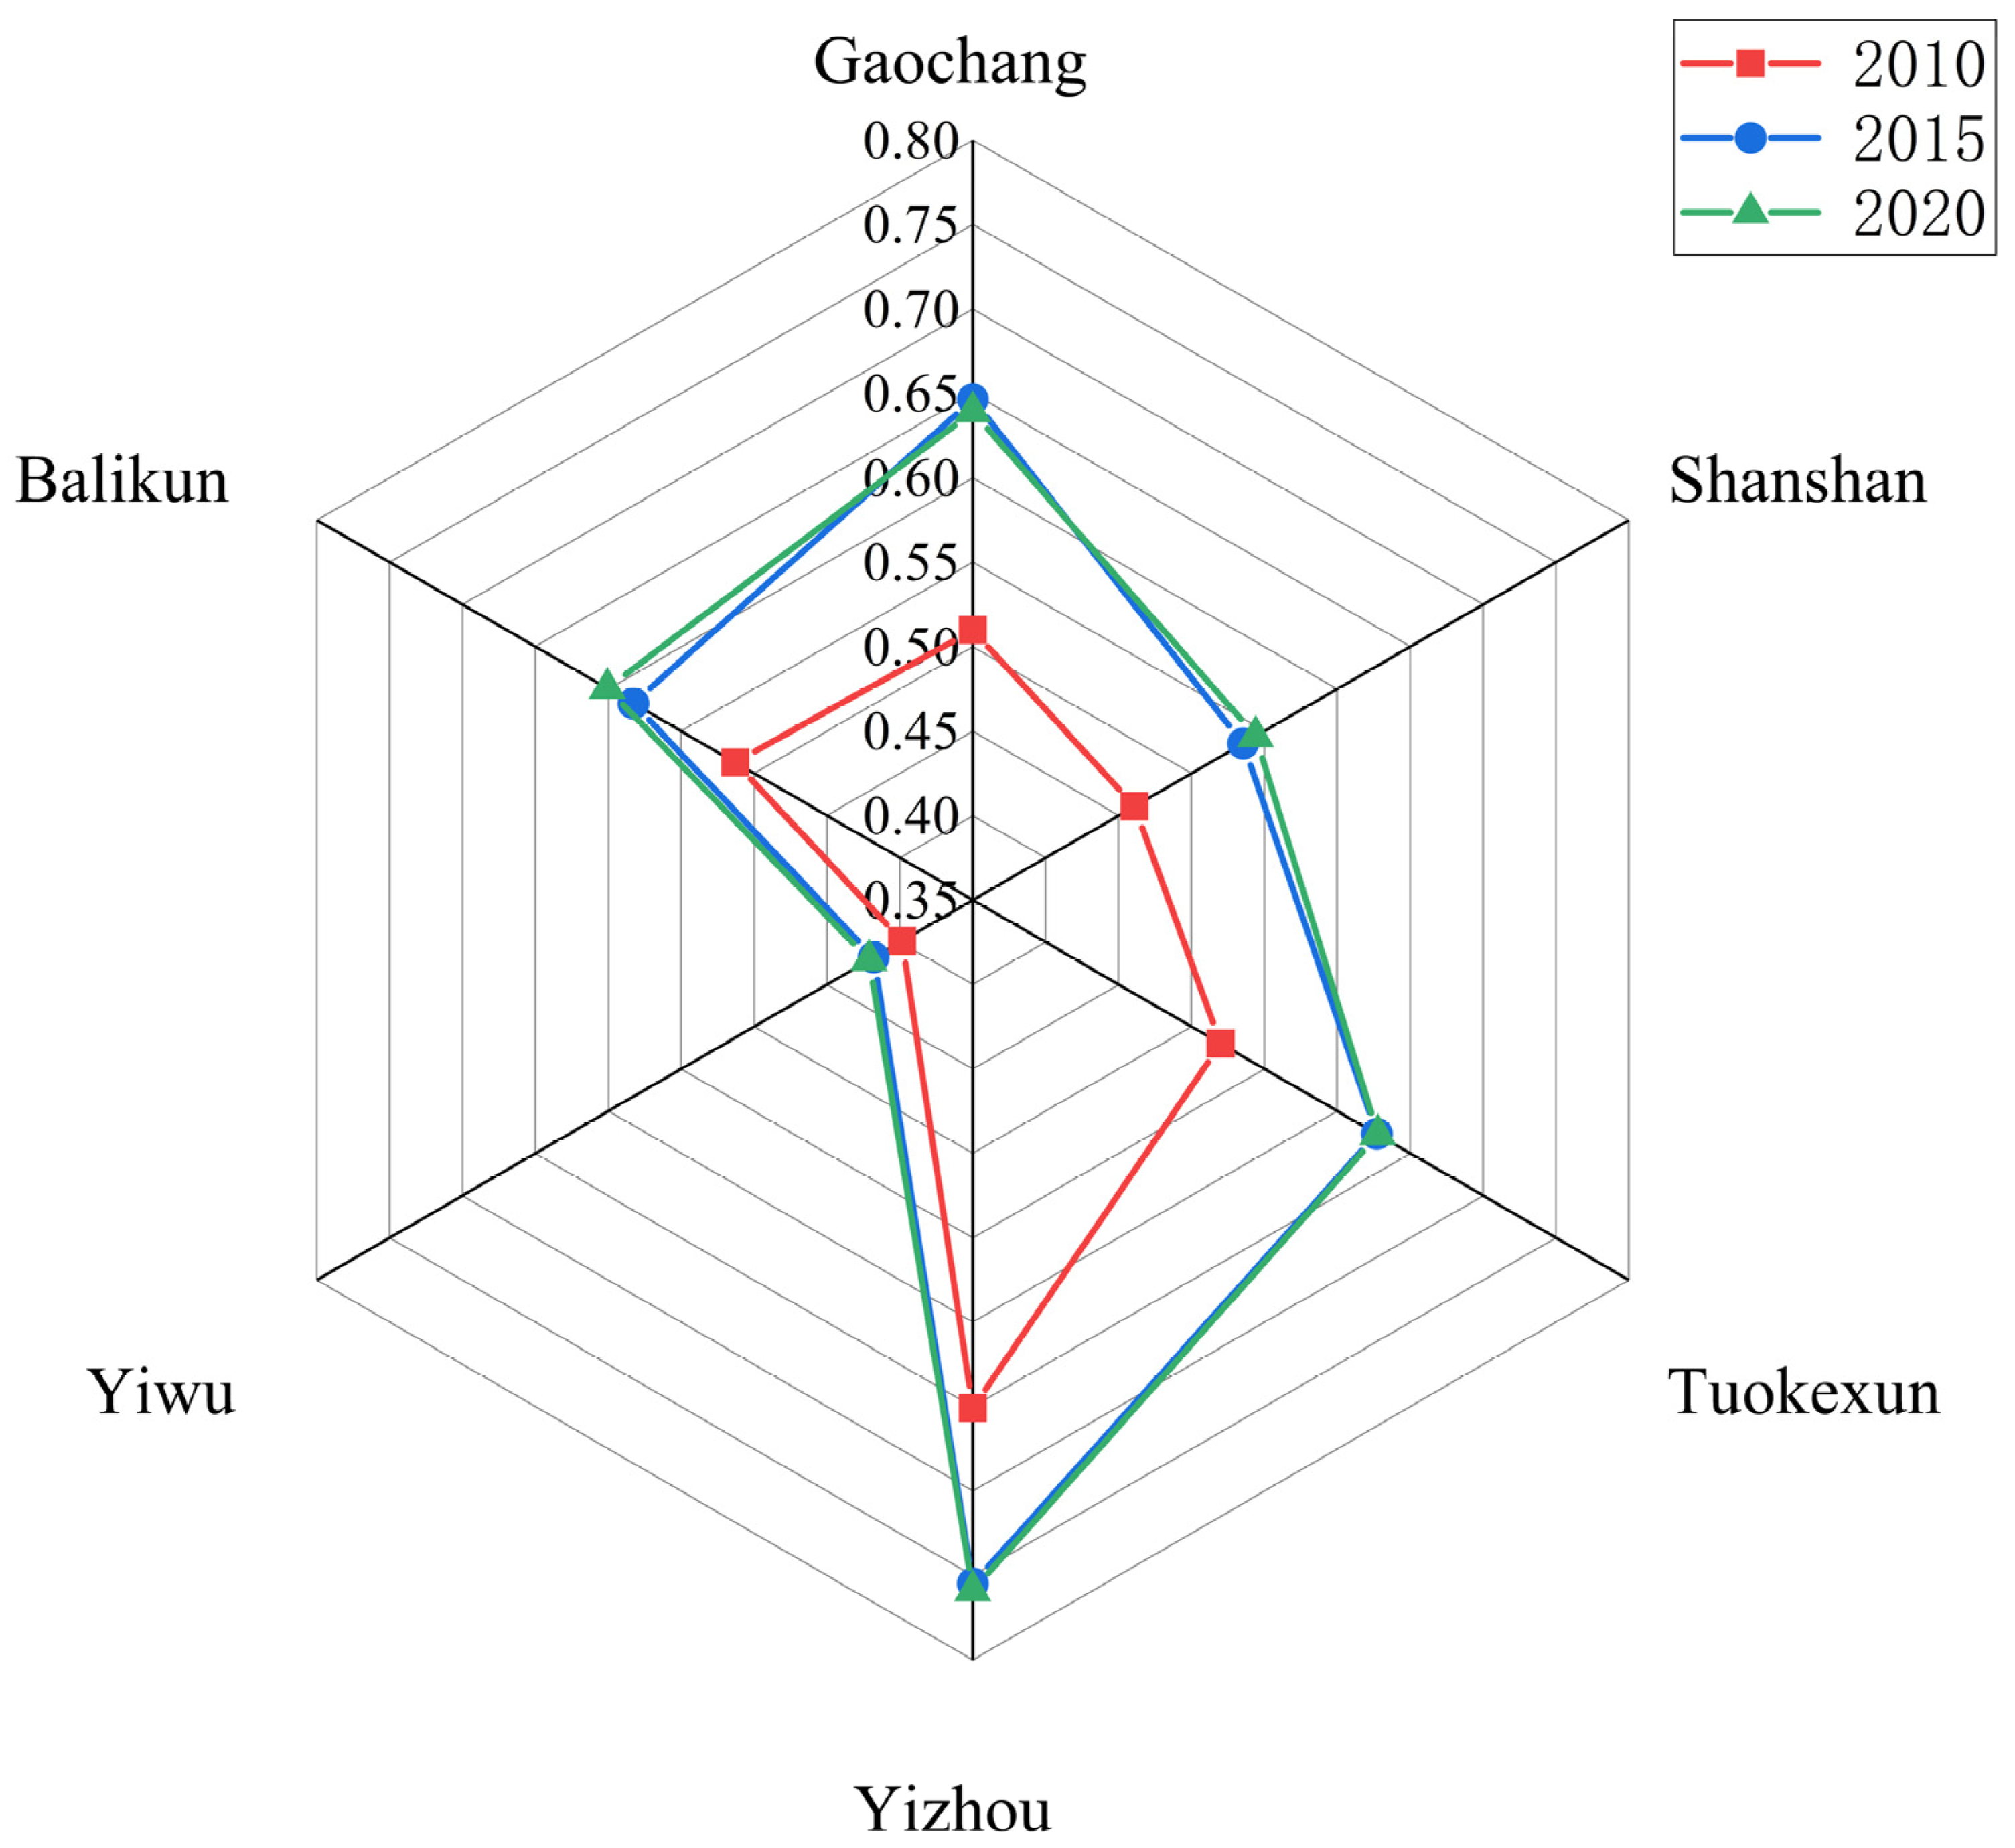
3.3.2. Analysis at the County Scale of the Spatial Evolution Pattern of PLE Functions

The production function among the districts and counties exhibited varying trends over the past decade (Figure 5). Yizhou district demonstrated significant growth in production function, with a production function assessment value of 0.47 in 2010, increasing to 0.82 in 2015 and reaching a maximum value of 0.85 in that year, which was well above the values observed in other districts and counties. This pattern is predominantly due to increases in productivity due to policy implementations, advancements in industrialization, and the swift advancement of the regional economy. In contrast, the development of production functions in the Yiwu and Balikun counties has been relatively slow, especially in Yiwu, where production levels are significantly lower than those in other districts and counties. As a whole, the production level in the Turpan–Hami Basin has maintained stable growth, which is closely related to national policy support and rational regional planning. Policy implementation has improved production efficiency and promoted industrialization, thus contributing to the overall increase in production levels in the region.
Between 2010 and 2020, all districts and counties showed an increasing trend in living function, with the Gaochang and Yizhou districts showing the fastest growth. The assessed value of the living function in Gaochang district rose from 0.28 in 2010 to 0.65 in 2020, and that in Yizhou district rose from 0.35 in 2010 to 0.72 in 2020, indicating that these two districts have high levels of development. This significant growth is largely attributable to the substantial amount of infrastructure development in the Turpan–Hami Basin during this period, which has benefited from investments in transport, healthcare, and education. These investments have not only improved the living standards for residents but also enhanced their livelihood security. In addition, China’s continued overall economic growth has had a positive impact on the Turpan–Hami Basin, enhancing the living standards of its residents.
During the last decade, there have been significant differences in the development of ecological functions in the districts and counties of the Turpan–Hami Basin. The ecological function assessment values of the Gaochang, Shanshan, and Tuokexun counties in Turpan increased between 2010 and 2015 and peaked in 2015. However, the ecological function assessment value in 2020 was still higher than that in 2010, even though it began to decline after 2015. This phenomenon is attributed mainly to a series of ecological protection and restoration measures, such as returning farmland to forests and grasslands, desert management, and water resource management, which were implemented between 2010 and 2015. These measures have significantly improved the local ecological environment and increased vegetation cover and ecological indicators. In contrast, the Yizhou, Yiwu, and Balikun counties in the Hami region experienced a continuous decline in ecological functions between 2010 and 2020. Although the initial ecological protection measures may have been effective, the need for economic growth coupled with the unsustainability of some of the governance measures, as well as the increasing pressure on the environment from resource extraction and urban expansion, have led to the destruction of vegetation and land degradation, increasing the value of the assessment of ecological function.
At the county level, the exhaustive appraisal value of each region generally increased annually. The Balikun and Yiwu counties demonstrated an inverted U-shaped trend, yet the rate of decline was not statistically significant and did not exhibit a notable change. Other districts and counties showed a continuous growth trend and slowed after peaking in 2015. Among these districts, the Yizhou district of Hami City consistently had the highest composite assessment value over the last decade, whereas the three-year average for Yiwu County of Hami City was the lowest of all districts and counties. This trend reflects the asynchronous coordination of economic development and ecological protection among the counties and reveals the impact of differences in resource allocation and policy implementation among regions on the comprehensive assessment value.

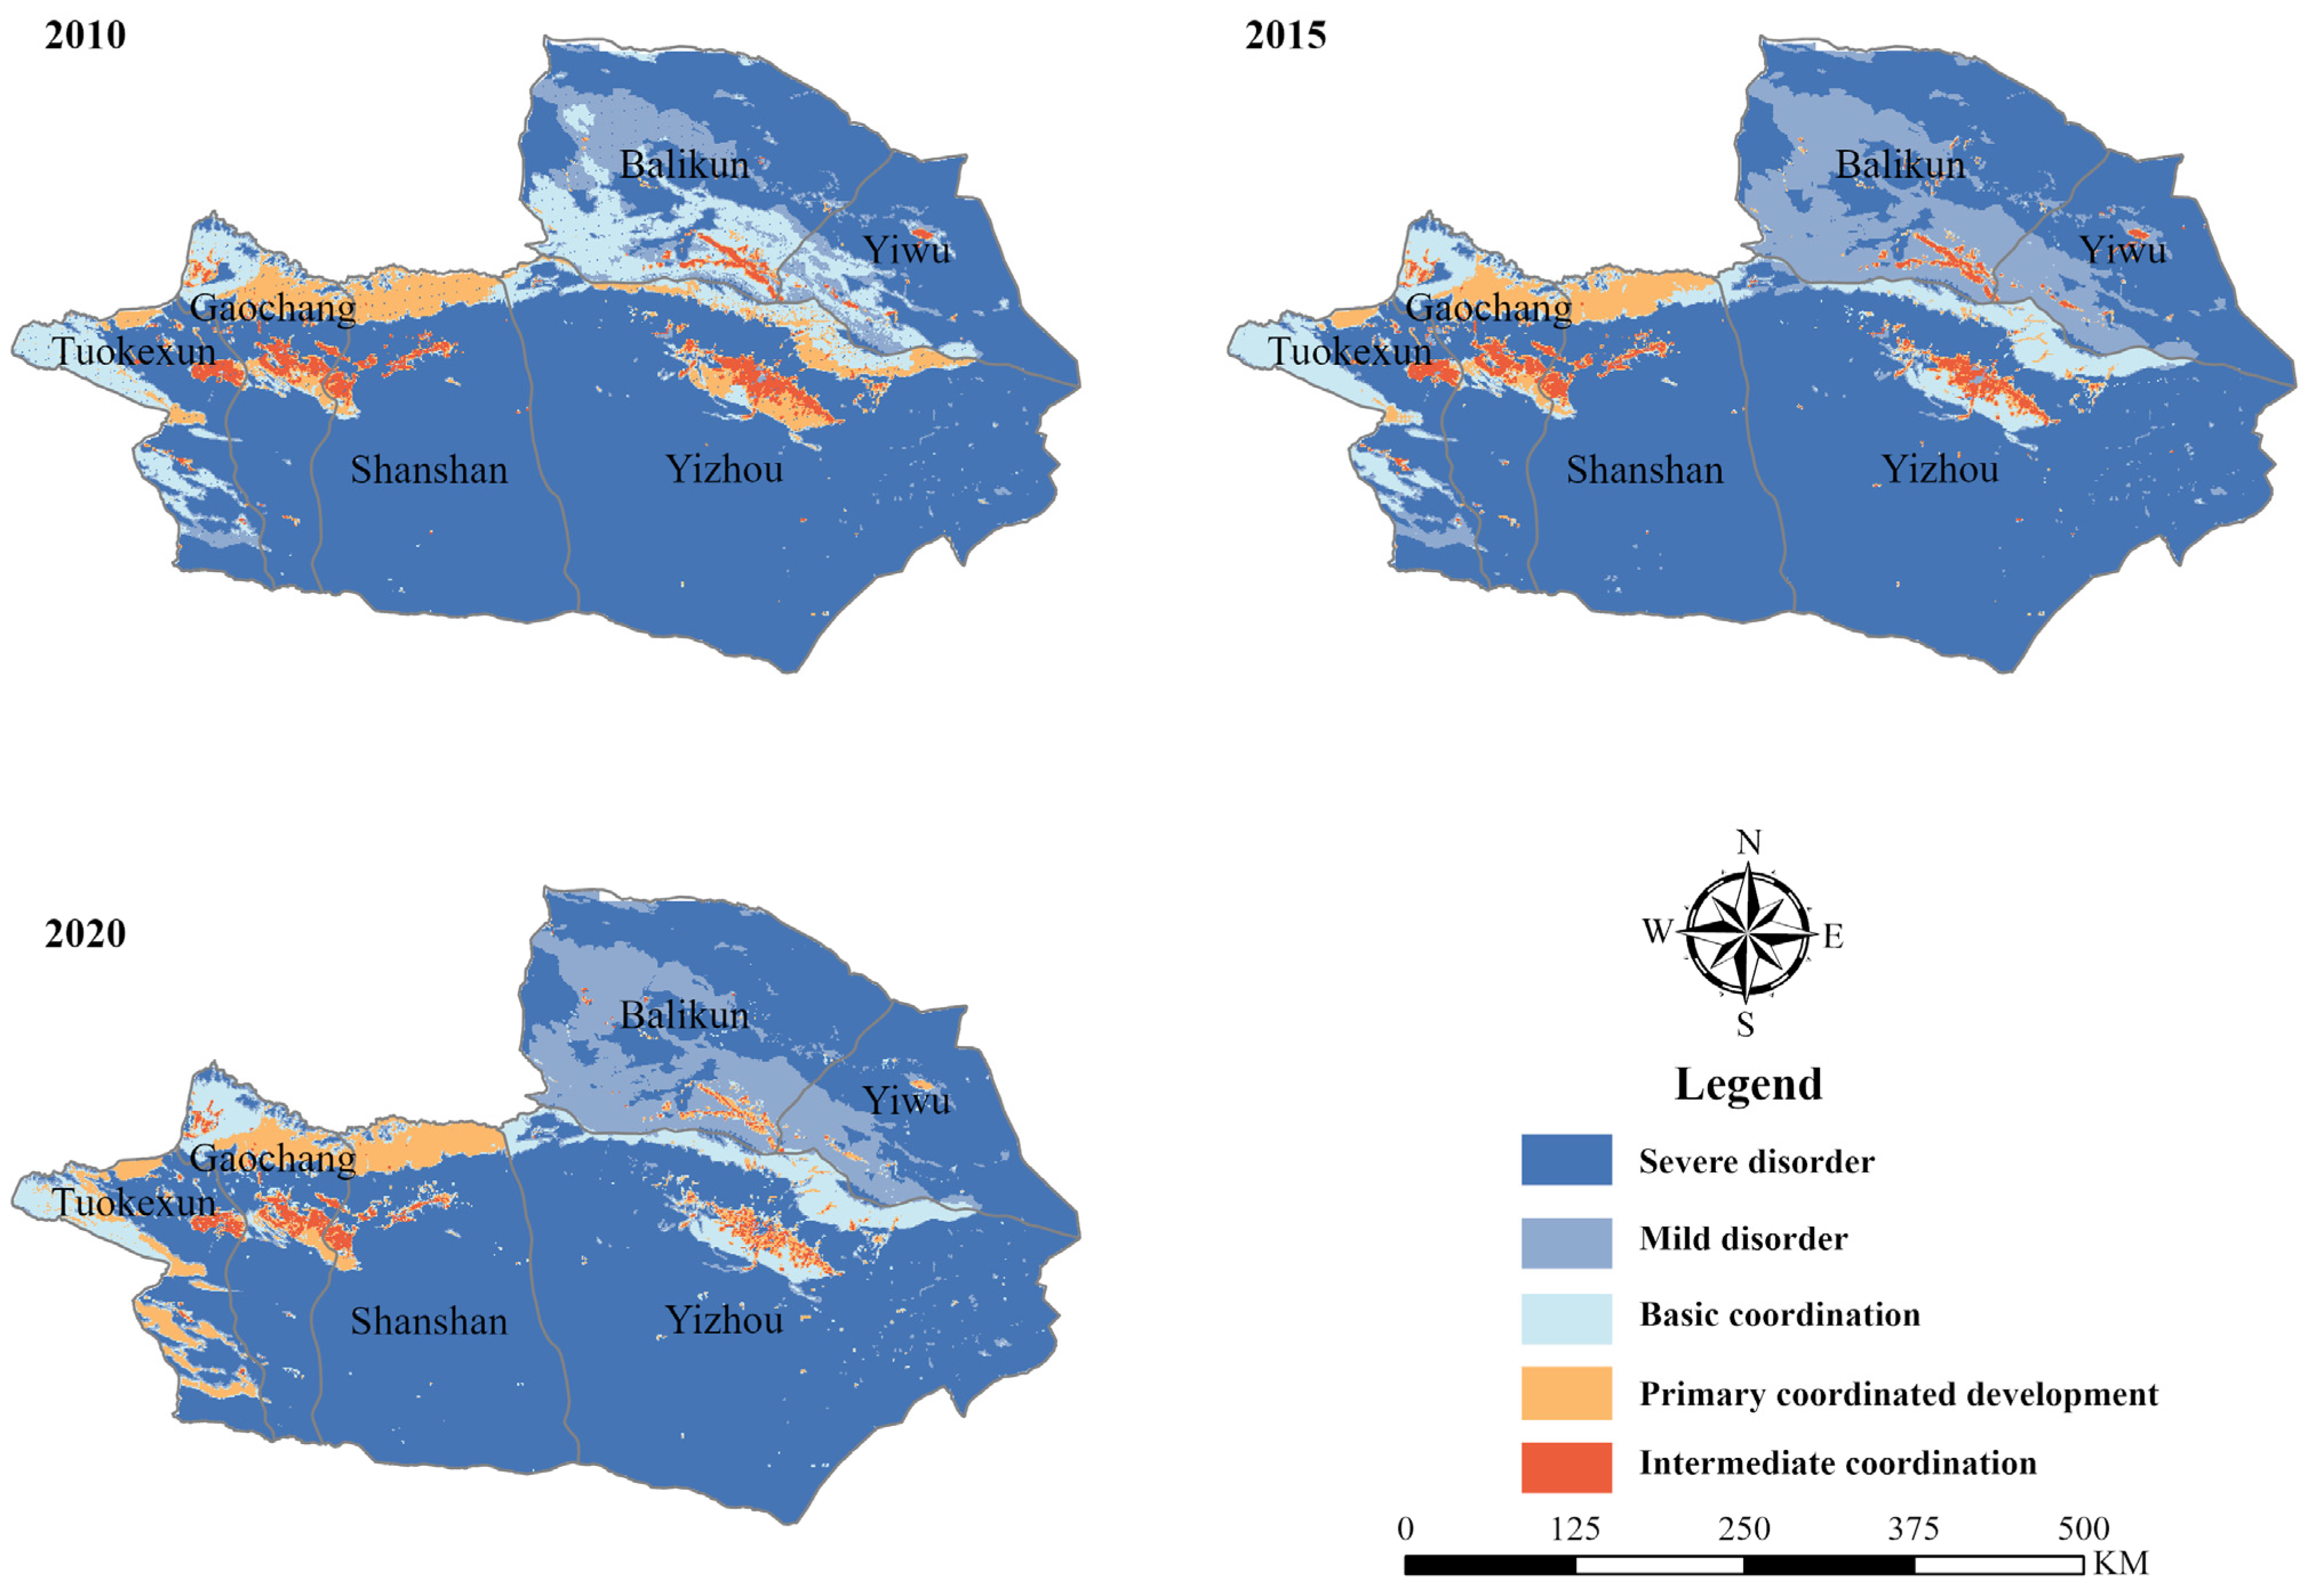
3.4. Spatiotemporal Analysis of PLES Coupling Harmonization in the Turpan–Hami Basin

In this work, we normalized the PLES data to the [0, 1] interval at the granularity of the grid scale to calculate the CCD of the PLES in the Turpan–Hami Basin from 2010 to 2020 and explored its spatial distribution characteristics (Figure 6).
The figure shows that there are five types of coupled coordination in the Turpan–Hami Basin from 2010 to 2020: severe disorder, mild disorder, basic coordination, primary coordinated development, and intermediate coordination. The central and northern regions of the Turpan–Hami Basin are mostly deserts, with lagging economic development and fragile ecological environments, resulting in a low degree of coordination between systems. These regions have experienced severe dissonance in the past decade, which results mainly from natural factors.
By 2015, the coupling coordination in the Turpan–Hami Basin had improved. The severely dislocated areas in the Balikun and Tuokexun counties decreased, and some areas transformed into mildly dislocated areas or those with basic coordination status. The mildly dysfunctional and basically coordinated areas in Shanshan County and Gaochang District had increased significantly, whereas primary coordinated development and intermediate coordinated areas had begun to appear in the Gaochang and Yizhou districts, indicating that the ecological protection and economic development of these areas had achieved remarkable results.
By 2020, the overall coordination of the Turpan–Hami Basin had significantly increased. The severely dislocated areas had been significantly reduced, and the mildly dislocated and basic coordination areas had expanded significantly, covering most of the Balikun, Shanshan, and Yiwu counties. The primary and intermediate coordination areas in the Gaochang and Yizhou districts had further expanded, demonstrating a high degree of coordinated development of the ecological, economic, and social systems in these areas. This change reflects the continued effectiveness of policy interventions and resource management, which have significantly improved the local environment and quality of life of the population.
In general, from 2010 to 2020, the spatial coupling and coordination of the three PLESs in the Turpan–Hami Basin gradually increased. Severely dysfunctional areas decreased annually, and mildly dysfunctional and primary coordinated development areas gradually increased, indicating that the ecological protection and economic development policies in the region are gradually working. The expansion of intermediate and basic coordination areas further indicates that significant progress has been made in PLES coordination in the region.
To comprehensively analyze the dynamic changes in the level of integrated, coordinated development across various districts and counties, we constructed a radar chart that illustrates the variations in the degree of integrated, coordinated development in the Turpan–Hami Basin from 2010 to 2020 (Figure 7).
As shown in the illustration, the degree of district and county coordination in the Turpan–Hami Basin expanded significantly between 2010 and 2015 due to distorted policies and resource allocations. Yizhou District maintained a high level of coordination throughout the period, showing a steady upward trend, whereas Yiwu County was at the lowest level of coupling coordination, with small changes due to the limitations of the natural environment and economic development. Between 2015 and 2020, because of policy convergence, increasing pressures on resources and the environment, and the plateauing of economic growth, the growth rate of the districts and counties slowed, and some districts even experienced small declines. The Gaochang and Yizhou districts gradually stabilized their growth rates despite maintaining a high level of coupling coordination.
In the future, to further improve the extent of coupling coordination of districts and counties, more refined and differentiated policies should be formulated. This approach can optimize the allocation of resources, strengthen environmental governance, and promote high-quality economic development in response to the specific problems and challenges of districts and counties, thus achieving comprehensive and coordinated development of the economy, society, and ecology.

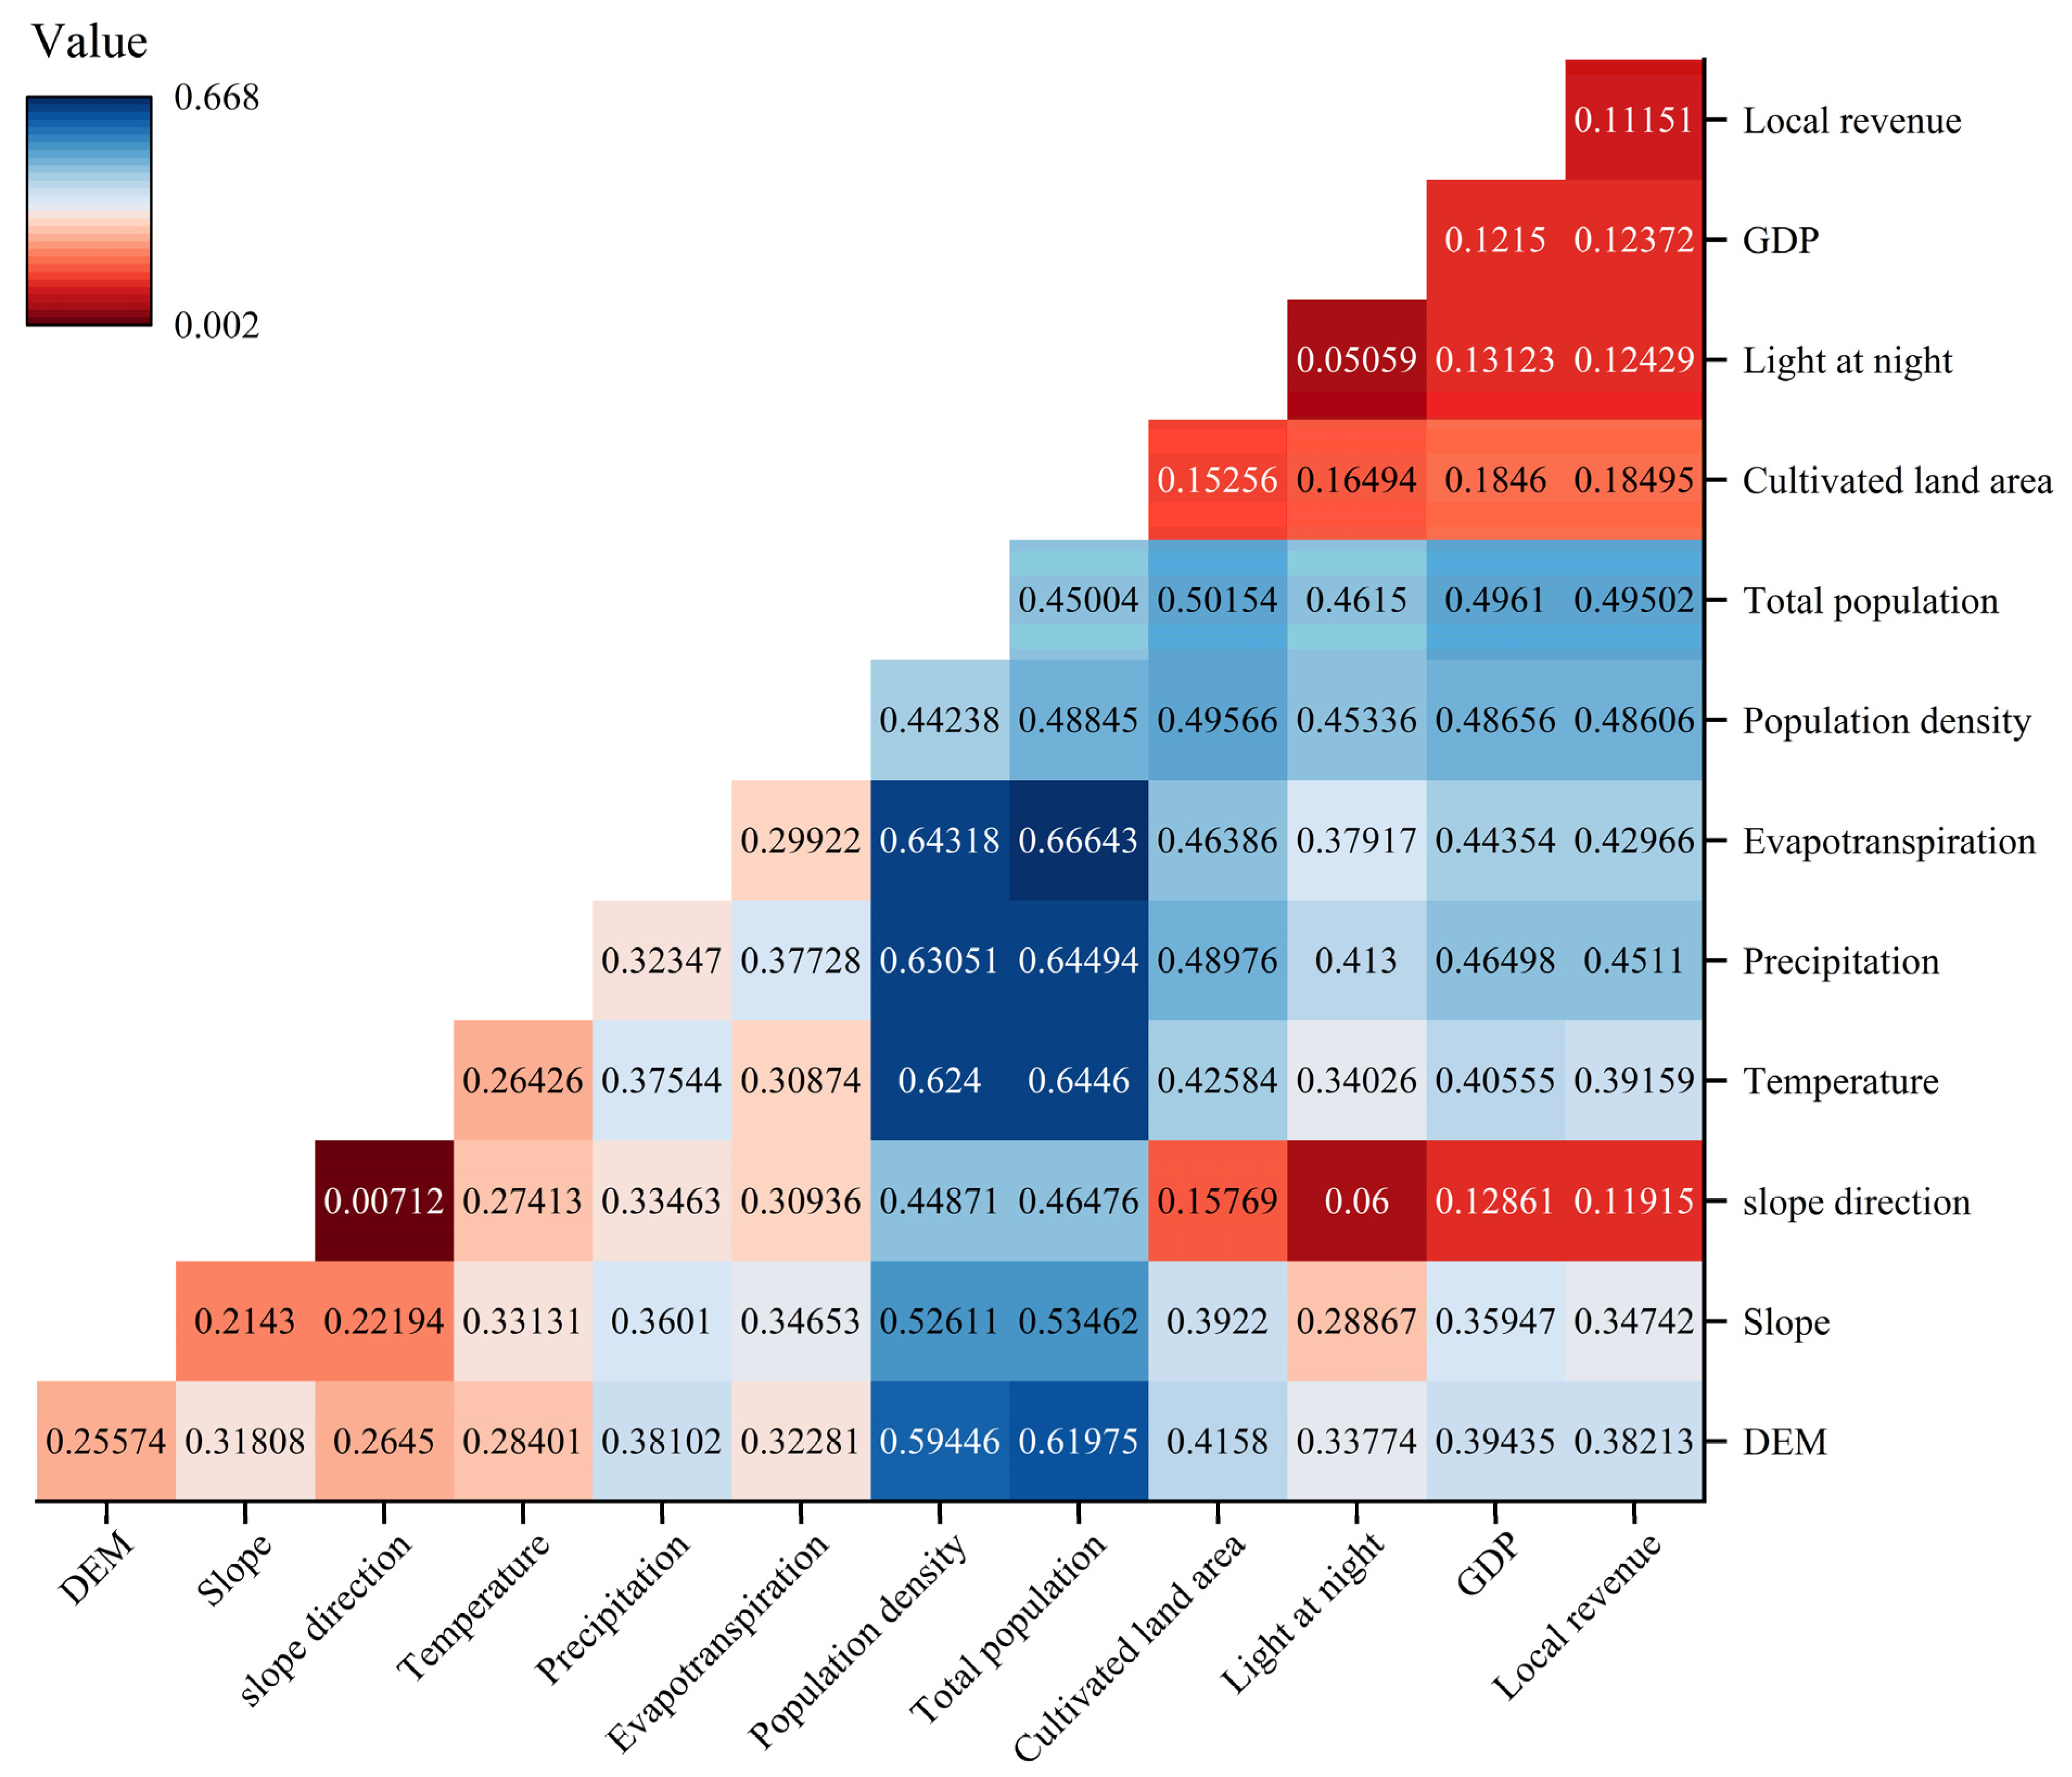
3.5. Analysis of the Drivers of PLES Coupling Coherence in the Turpan–Hami Basin

In this study, based on the coupled coordination theory, the influence of natural factors, socio-economic development, and other aspects were integrated into the current situation of the Turpan–Hami Basin region. Geodetector was used for factor detection and interaction to further explore 12 factors, including DEM (X1), slope (X2), slope direction (X3), temperature (X4), precipitation (X5), evapotranspiration (X6), population density (X7), total population (X8), cultivated land area (X9), light at night (X10), GDP (X11), and local revenue (X12), and the factors influencing the CCD of the PLES.
Figure 8 shows the results of factor detection. The results indicate that the population density and total population had the highest explanatory power for the extent of coupling coordination, which indicates that these two factors had the greatest influence on the degree of regional coupling coordination. These factors are followed by precipitation, evapotranspiration, temperature, and DEM, which also had high explanatory power, indicating that they had a more substantial effect on the extent of coupling coordination. Slope direction and light at night had the lowest explanatory power for coupling coordination, indicating that these factors had less influence on regional coupling coordination. The p-value of all the factors is 0, which indicates that the effects of these factors are statistically significant.
The results of the interaction detection are shown in Figure 9. According to the type of interaction detected (Table 5), the interaction between evapotranspiration and the total population has the highest q-value of 0.67, which is a two-factor enhancement type, implying that the interaction between the ET of water resources and the total population significantly affects the coordinated development of the region. In addition, the precipitation and total population are also of the same two-factor enhancement type, indicating that the densely populated region has sufficient precipitation to support its agricultural and ecological needs, reflecting the key role of water resources in ensuring the coordinated development of ecological and human activities. In terms of economic factors, the interaction between GDP and local fiscal revenues shows nonlinear weakening, indicating that economic growth has not been effectively translated into local government revenues, which may be due to the quality of economic growth, inappropriate tax policies, or mismanagement of public funds. This weak coupling suggests that the relationship between the economy and government finance needs to be strengthened to promote more balanced and inclusive development. The pattern of divergence of PLES coupling coordination in space and time in the Turpan–Hami Basin is the result of multiple factors, reflecting the synergistic effects of the complex regional environment and human activities. This finding emphasizes the importance of integrating natural geographic and socio-economic factors into assessments of coordinated regional development to fully understand their dynamic changes and interrelationships.

4. Discussion

4.1. Development of PLES in the Turpan–Hami Basin and Spatiotemporal Variations in Coupling Coherence

The evolution of PLES in the Turpan–Hami Basin has been significantly influenced by human natural resource exploitation activities and ecological construction projects [51]. In the past decade, with the acceleration of urbanization and infrastructure development, the upgrading of agricultural technology, and the restructuring of industry in the region, some inefficient productive land has been further converted into living land, especially in the southern and central towns, which are conveniently located. Moreover, policies have increasingly focused on ecological restoration and environmental protection, implementing various effective measures such as returning farmland to forests, afforestation, desertification control, and ecological compensation mechanisms [52,53]. These efforts have significantly improved environmental quality and further expanded ecological spaces. The measures taken not only improved the ecological environment of the region but also ensured its sustainable development.
Studying the coupled and coordinated relationships of PLES in territorial space is a key step in optimizing the territorial spatial configuration of ecologically fragile areas and promoting coordinated and sustainable development [54]. The assessment results of the PLE functions provide a crucial foundation for studying balance, agglomeration patterns, and coupling coordination. This indicator system has been widely applied in identifying and analyzing the PLE functions [55,56]. Building on prior studies [57], this research delves into the coupling and coordination dynamics of production–living–ecological space (PLES) in the Turpan–Hami Basin from 2010 to 2020, comparing the grid and county-level scales and introducing ecological modeling. Using GIS 10.8 spatial analysis, this study reveals the spatiotemporal evolution of these relationships, enhancing our understanding of regional developmental trends and interactions within PLES. From the grid spatial analysis, the PLES coupling coordination in the Turpan–Hami Basin showed a gradual optimization trend from 2010 to 2020. The number of severely dislocated regions decreased annually, and the number of mildly dislocated and primary coordinated development regions gradually increased, indicating that the ecological protection and economic development policies in these regions are gradually working. The expansion of intermediate and basic coordination areas further indicates that the region has made remarkable progress in terms of ecological restoration, economic development, and social coordination, similar to the conclusions drawn in previous studies [58]. Analyzed at the county scale, the coupled coordination of the Gaochang and Yizhou districts increased significantly between 2010 and 2020, suggesting that the Gaochang and Yizhou districts have achieved significant results in terms of policy support, infrastructure development, and industrial upgrading, which have driven the enhancement of the PLE functions in the region. Shanshan and Tuokexun also showed an increasing trend in coupling coordination, but the magnitude was relatively small. This finding reflects the fact that some development has occurred in these regions, but the overall rate of enhancement has been relatively slow, which is related to the local economic base and resource endowment. Yiwu County, which is located in a more remote and harsh natural area, has a weak industrial base, lacks sufficient investment, and has low industrial diversity. These factors have kept its CCD at a low level; thus, its policy support and resource inputs need to be further strengthened to achieve the goal of sustainable development.

4.2. Analysis of Drivers of PLES Coupling Coherence in the Turpan–Hami Basin

The dynamic trade-offs in territorial spatial functions are closely linked with the complexities of human–natural factors, categorized into natural resource factors, locational factors, and socio-economic factors [59]. This study employs a geodetector to analyze the drivers and their interrelationships affecting PLES coupling coherence in the Turpan–Hami Basin. It assesses the response of coupling coherence to 12 natural and socio-economic determinants, exploring the coordinated development patterns among PLESs.
This study found that population and natural factors have a more significant impact on the PLES coupling coordination degree than economic factors. Consistent with numerous studies, population has been identified as a primary driving factor of the changes in arid regions [60]. The main reason for this difference is the uneven population distribution in the Turpan–Hami Basin, where most of the population is concentrated in oasis areas, resulting in more intense human activities in these regions. In the process of urbanization and industrialization, high population density areas typically receive more infrastructure investment and social service support, which in turn enhances the living function of the region. In addition, densely populated areas are more likely to form economies of scale and promote economic development, which further enhances the coupled coordination of the region. Natural factors such as topography and water resources also have a significant effect on the degree of coupled coordination of PLESs. Water resources are among the most crucial limiting factors for development in arid regions [61]. Higher altitudes and sloping areas are suitable for ecological space development, whereas flat areas are more suitable for agriculture and urbanization. Precipitation and evapotranspiration, as key links in the water cycle system, have a direct impact on regional ecosystems and agricultural production. The Turpan–Hami Basin is in an ecologically fragile region; the Gobi Desert occupies most of the area, and there are fewer oases. The oasis areas have abundant precipitation, good vegetation cover, and high ecosystem stability, whereas the Gobi Desert areas have high ET and require more water management and deployment.
Furthermore, the interplay between natural and demographic variables exerts a pronounced influence on the extent of coupled coordination. The interactions among ET, mean annual precipitation, and population density indicate that the combination of water resources and population density largely affects the degree of coordination of the PLES in a region. Regions with favorable topographic conditions and abundant water resources are more likely to attract population concentration and promote economic activities and infrastructure development, thus enhancing the coordination of production and living functions. In regions characterized by complex topography and lower population density, these areas tend to be designated as ecological spaces to support ecological balance and environmental protection efforts.
The spatial and temporal divergence pattern of PLES coupling coordination in the Turpan–Hami Basin is shaped by the combined influence of multiple factors. This in-depth analysis of these factors and their interactions provides a scientific basis for policy formulation for regional sustainable development.

4.3. Contributions and Limitations

In this research, a functional indicator evaluation system for PLE was established in ecologically fragile areas, utilizing multi-source data and integrating ecological models. We applied CCDM and geodetector methods to perform quantitative comparative analyses on the PLES of the Turpan–Hami Basin across grid and county scales, which innovatively highlighted the dynamics within the region. The analysis uncovered key factors influencing the coupling and coordination of PLES, enhancing our understanding of inter-regional interactions and their relative importance. This approach not only sheds light on the complexities within such fragile ecosystems but also provides a new methodological framework for similar studies in other regions.
Nevertheless, this study has its limitations. It only uses land-use data from 2010, 2015, and 2020, potentially missing finer temporal dynamics of land-use change. Additionally, although this study identifies crucial drivers of PLES coupling coordination, it lacks a detailed assessment of the impact of specific policies.
Future research could benefit from using more frequent time-series data to capture a more detailed picture of land-use dynamics. Integrating both quantitative and qualitative methods, including local knowledge and stakeholder insights, could offer a deeper understanding of PLES dynamics and the efficacy of policy interventions. This comprehensive approach will better equip policymakers and researchers to foster sustainable development in ecologically sensitive areas.

5. Conclusions

To further understand the spatiotemporal characteristics of PLES coupling coordination in ecologically fragile areas from a systematic perspective and provide insights for future development and management of such regions, this study focuses on the Turpan–Hami Basin. By incorporating multi-source data and ecological models into the quantification process, a PLE function evaluation index system for typical ecologically fragile areas was constructed. The CCD was measured and compared at both grid and county scales, providing a more accurate reflection of the regional PLES distribution characteristics. Additionally, the geodetector was used to analyze the driving factors influencing PLES coupling coordination, offering strategies for land spatial coordination, sustainable development, and spatial layout optimization in ecologically fragile areas. The principal findings of this research are described below:
(1)
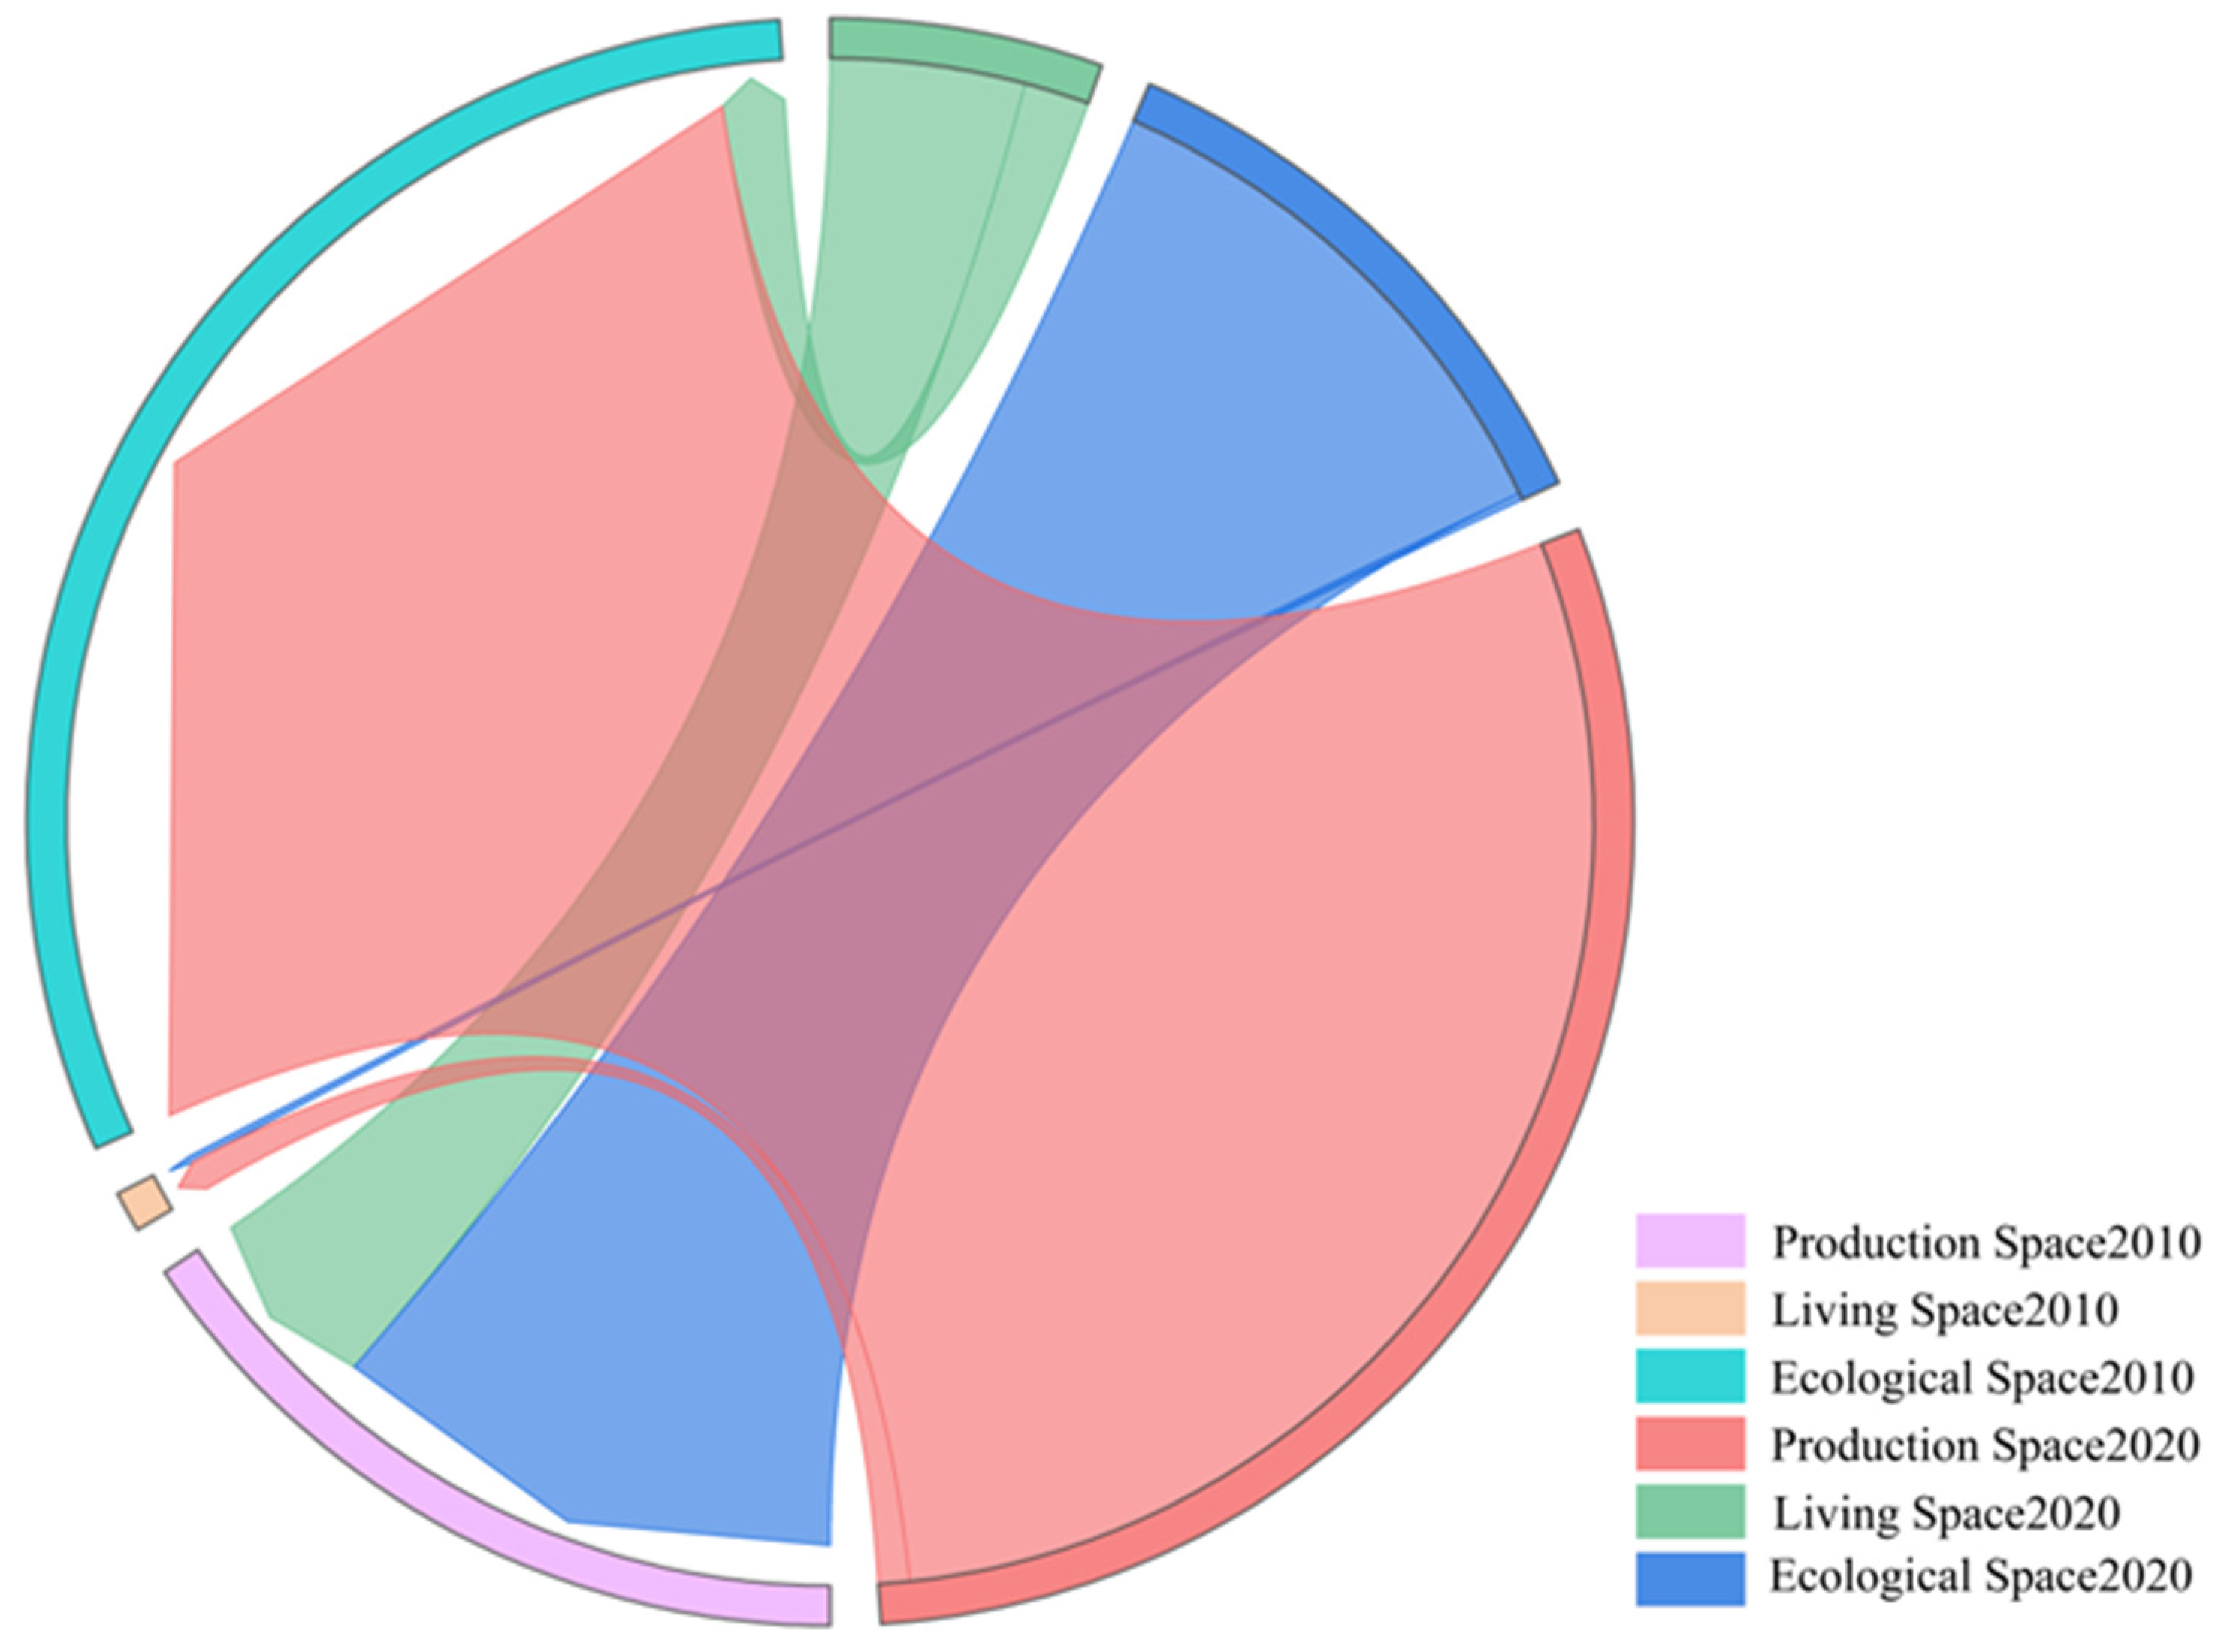
Over the past decade, the Turpan–Hami Basin has seen its production spaces gradually transition to living and ecological spaces, reflecting the progress of urbanization, improvement in living conditions, and effective implementation of ecological protection measures. Overall, the CCD of the PLES in the basin is high and trending upwards, particularly in regions with better transportation and faster urbanization, such as the Gaochang and Yizhou districts.
(2)
Evapotranspiration and total population are key driving factors affecting the CCD of the PLES in the region, with their interaction significantly impacting coordinated regional development. This study highlights the critical role of areas with dense water resources and concentrated populations in fostering coordinated development, suggesting that future regional planning should focus on balancing economic growth with resource utilization.
Through comprehensive analyses, we not only revealed the spatial pattern and evolutionary characteristics of PLES coupling coordination in the Turpan–Hami Basin but also identified the main influencing factors and their action mechanisms. The results provide not only a scientific foundation for the sustainable exploitation of the Turpan–Hami Basin but also a useful reference for the exploitation of other ecologically fragile regions. Through scientific planning and effective management, the connectivity and linkage of the region can be further improved, and harmonious progress of the economy, society, and ecology can be promoted.

Author Contributions

Conceptualization, Y.G. and Q.Z.; methodology, Y.G.; software, Y.G., F.Z., Z.L., D.Z. and X.Z.; validation, Y.G., K.Z., Q.Z. and F.Z.; formal analysis, L.B. and Q.Z.; data curation, Y.G., Y.K., W.Y. and Z.Q.; writing—original draft preparation, Y.G.; writing—review and editing, Y.G., K.Z., Q.Z., F.Z. and Q.W.; supervision, Q.Z. All authors have read and agreed to the published version of the manuscript.

Funding

This research was funded by the Third Xinjiang Comprehensive Scientific Research Projection Comprehensive Evaluation and Sustainable Utilization of Land Resources in the Turpan–Hami Basin (2022xjkk1105).

Institutional Review Board Statement

Not applicable.

Informed Consent Statement

Not applicable.

Data Availability Statement

No new data were created or analyzed in this study. Data sharing is not applicable to this article.

Conflicts of Interest

The authors declare no conflicts of interest.

References

  1. Grimm, N.B.; Faeth, S.H.; Golubiewski, N.E.; Redman, C.L.; Wu, J.; Bai, X.; Briggs, J.M. Global change and the ecology of cities. Science 2008, 319, 756–760. [Google Scholar] [CrossRef]
  2. Lilin, Z.; Yansui, L.; Yongsheng, W. Research progress and prospect of land-use conflicts in China. Prog. Geogr. 2020, 39, 298–309. [Google Scholar] [CrossRef]
  3. Shidong, L.; Moucheng, L.; Yingfa, C. Beautiful Ecology: Theoretical Exploration Index Evaluation and Development Strategy; Science Press: Beijing, China, 2017. [Google Scholar]
  4. Li, J.; Sun, W.; Li, M.; Meng, L. Coupling coordination degree of production, living and ecological spaces and its influencing factors in the Yellow River Basin. J. Clean. Prod. 2021, 298, 126803. [Google Scholar] [CrossRef]
  5. Zhang, R.; Li, S.; Wei, B.; Zhou, X. Characterizing Production-Living-Ecological Space Evolution and Its Driving Factors: A Case Study of the Chaohu Lake Basin in China from 2000 to 2020. ISPRS Int. J. Geo-Inf. 2022, 11, 447. [Google Scholar] [CrossRef]
  6. Lin, G.; Jiang, D.; Fu, J.; Zhao, Y. A Review on the Overall Optimization of Production–Living–Ecological Space: Theoretical Basis and Conceptual Framework. Land 2022, 11, 345. [Google Scholar] [CrossRef]
  7. Cui, X.; Fang, C.; Liu, H.; Liu, X. Assessing sustainability of urbanization by a coordinated development index for an Urbanization-Resources-Environment complex system: A case study of Jing-Jin-Ji region, China. Ecol. Indic. 2019, 96, 383–391. [Google Scholar] [CrossRef]
  8. Yue, B. An analysis on the EU’s multifunctional agriculture. J. Huazhong Agric. Univ. (Soc. Sci.) 2006, 2, 31–34. [Google Scholar] [CrossRef]
  9. Wei, L.; Zhang, Y.; Wang, L.; Mi, X.; Wu, X.; Cheng, Z. Spatiotemporal Evolution Patterns of “Production-Living-Ecological” Spaces and the Coordination Level and Optimization of the Functions in Jilin Province. Sustainability 2021, 13, 13192. [Google Scholar] [CrossRef]
  10. Sun, Y.; Huang, R.; Chen, P.; Zhang, L. Classification and function evaluation of “production-life-ecology space”—Taking Jilin Province as an example. Jiangsu J. Agric. Sci. 2020, 48, 298–304+309. [Google Scholar] [CrossRef]
  11. Yu-Mei, C.; Lin-Sheng, G.U.; Jing-Yu, L.I.; Shu-Kun, P. Evolvement and Inspiration of National Land Comprehensive Development Planning in Japan. China Land Sci. 2008, 22, 76–80. [Google Scholar] [CrossRef]
  12. Kariminejad, N.; Hosseinalizadeh, M.; Pourghasemi, H.R.; Bernatek-Jakiel, A.; Campetella, G.; Ownegh, M. Evaluation of factors affecting gully headcut location using summary statistics and the maximum entropy model: Golestan Province, NE Iran. Sci. Total Environ. 2019, 677, 281–298. [Google Scholar] [CrossRef] [PubMed]
  13. Houkai, W.; Chunliang, G. China’s Trends in Regional Coordinated Development and Ideas on Policy Adjustment %J Henan Social Sciences. Henan Soc. Sci. 2012, 20, 73–81. [Google Scholar] [CrossRef]
  14. Jie, F.; Kan, Z.; Wei, S.; Dong, C. Scientific values and research innovations of Human-economic Geography in construction of ecological civilization. Prog. Geogr. 2013, 32, 147–160. [Google Scholar] [CrossRef]
  15. Groot, R.D. Function-analysis and valuation as a tool to assess land use conflicts in planning for sustainable, multi-functional landscapes. Landsc. Urban Plan. 2006, 75, 175–186. [Google Scholar] [CrossRef]
  16. Willemen, L.; Hein, L.; van Mensvoort, M.E.; Verburg, P.H. Space for people, plants, and livestock? Quantifying interactions among multiple landscape functions in a Dutch rural region. Ecol. Indic. 2010, 10, 62–73. [Google Scholar] [CrossRef]
  17. Ricketts, T.H.; Daily, G.C.; Ehrlich, P.R.; Michener, C.D. Economic value of tropical forest to coffee production. Proc. Natl. Acad. Sci. USA 2004, 101, 12579–12582. [Google Scholar] [CrossRef] [PubMed]
  18. Paracchini, M.L.; Pacini, C.; Jones, M.L.M.; Pérez-Soba, M. An aggregation framework to link indicators associated with multifunctional land use to the stakeholder evaluation of policy options. Ecol. Indic. 2011, 11, 71–80. [Google Scholar] [CrossRef]
  19. Liu, J.; Liu, Y.; Li, Y. Classification evaluation and spatial-temporal analysis of “production-living-ecological” spaces in China. Acta Geogr. Sin. 2017, 72, 1290–1304. [Google Scholar] [CrossRef]
  20. Li, G.; Fang, C. Quantitative function identification and analysis of urban ecological-production-living spaces. Acta Geogr. Sin. 2016, 71, 49–65. [Google Scholar] [CrossRef]
  21. Huang, J.; Lin, H.; Qi, X. A literature review on optimization of spatial development pattern based on ecological-production-living space. Prog. Hum. Geogr. 2017, 36, 378–391. [Google Scholar] [CrossRef]
  22. Gao, X.; Liu, Z.; Li, C. Land use Function Transformation and ecological environment effect in Xiongan New Area based on production-living-ecological space. Acta Ecol. Sin. 2020, 40, 1–10. [Google Scholar]
  23. Jia, Y.; Liu, J.; Fu, L.; Chen, Y.; Liu, K. Spatial Coupling and Coordination Relationship and Evaluation Analysis of “Production-living-ecology” Space in Rural Revitalization in Shandong Province. J. Nat. Sci. Hunan Norm. Univ. 2022, 50, 3. [Google Scholar] [CrossRef]
  24. Yushu, G.; Shuailong, G.; Changle, M.; Jianxin, Y.; Guanghuan, W.; Lixing, Y. Analysis on Spatial-temporal Pattern of Land Use Change and Coupling Coordination Degree in Huize County from the Perspective of “Production-Living-Ecological Space”. West. For. Sci. 2024, 53, 142–151. [Google Scholar] [CrossRef]
  25. Ding, L.; Zhao, W.; Huang, Y.; Cheng, S.; Liu, C. Research on the Coupling Coordination Relationship between Urbanization and the Air Environment: A Case Study of the Area of Wuhan. Atmosphere 2015, 6, 1539–1558. [Google Scholar] [CrossRef]
  26. Liu, N.; Liu, C.; Xia, Y.; Da, B. Examining the coordination between urbanization and eco-environment using coupling and spatial analyses: A case study in China. Ecol. Indic. 2018, 93, 1163–1175. [Google Scholar] [CrossRef]
  27. Liu, W.; Jiao, F.; Ren, L.; Xu, X.; Wang, J.; Wang, X. Coupling coordination relationship between urbanization and atmospheric environment security in Jinan City. J. Clean. Prod. 2018, 204, 1–11. [Google Scholar] [CrossRef]
  28. Shen, L.; Huang, Y.; Huang, Z.; Lou, Y.; Ye, G.; Wong, S.-W. Improved coupling analysis on the coordination between socio-economy and carbon emission. Ecol. Indic. 2018, 94, 357–366. [Google Scholar] [CrossRef]
  29. Guo, A.; Zhao, Z.; Yuan, Y.; Wang, Y.; Li, X.; Xu, R. Quantitative correlations between soil and plants in reclaimed mining dumps using a coupling coordination degree model. R. Soc. Open Sci. 2018, 5, 180484. [Google Scholar] [CrossRef] [PubMed]
  30. Han, H.; Li, H. Coupling coordination evaluation between population and land urbanization in Ha-Chang urban agglomeration. Sustainability 2020, 12, 357. [Google Scholar] [CrossRef]
  31. Jiaqi, C.; Yilin, L.; Junsan, Z.; Bingui, Q. Spatiotemporal Characteristics and Influencing Factors of Functional Coupling and Coordination of ‘Production-Living-Ecological’ Spaces in Kunming City. Res. Soil Water Conserv. 2024, 31, 299–310+319. [Google Scholar] [CrossRef]
  32. Xu, S.; He, W.; Shen, J.; Degefu, D.M.; Yuan, L.; Kong, Y. Coupling and coordination degrees of the core water-energy-food nexus in China. Int. J. Environ. Res. Public Health 2019, 16, 1648. [Google Scholar] [CrossRef] [PubMed]
  33. Wang, L.; Wang, J.; Ding, J.; Li, X. Estimation and Spatiotemporal Evolution Analysis of Actual Evapotranspiration in Turpan and Hami Cities Based on Multi-Source Data. Remote Sens. 2023, 15, 2565. [Google Scholar] [CrossRef]
  34. Cui, X.; Xu, N.; Chen, W.; Wang, G.; Liang, J.; Pan, S.; Duan, B. Spatio-temporal variation and influencing factors of the coupling coordination degree of production-living-ecological space in China. Int. J. Environ. Res. Public Health 2022, 19, 10370. [Google Scholar] [CrossRef] [PubMed]
  35. Bao, S.; Lu, L.; Zhi, J.; Li, J. An Optimization Strategy for Provincial “Production–Living–Ecological” Spaces under the Guidance of Major Function-Oriented Zoning in China. Sustainability 2024, 16, 2248. [Google Scholar] [CrossRef]
  36. Yi, Z.; Jianglong, T.; Jianji, Z. Research on the Spatial Coupling Harmonious Degree Spatial-Spatial Evolution of “Production-Living-Ecological Space” in Ganzhou Based on PLUS-MarKov Prediction Model. Jiangxi Sci. 2024, 42, 303–310+416. [Google Scholar] [CrossRef]
  37. Liang, T.; Yang, F.; Luo, Y.; Fang, M.; Huang, X.; Zhang, Z.; Wen, C.; Ren, X. The Synchronous Development Pattern and Type Division of Functional Coupling Coordination and Human Activity Intensity Based on the “Production–Living–Ecological” Space Perspective: A Case Study of Wanzhou District. Land 2022, 11, 1897. [Google Scholar] [CrossRef]
  38. Li, Y.; Zhang, S.; Zhao, J.; Zhang, G.; Qu, G.; Ma, S.; Liu, X. Spatiotemporal evolution and Sustainably comprehensive zoning optimization of production–living–ecological functions in the Mountain–Flatland areas. Heliyon 2024, 10, e23425. [Google Scholar] [CrossRef]
  39. Zhou, H.; Wu, X.; Nie, H.; Wang, X.; Zang, S. Coupling coordination analysis and obstacle factors identification of rural living-production-ecological functions in a farming-pastoral ecotone. Ecol. Indic. 2024, 158, 111398. [Google Scholar] [CrossRef]
  40. Zou, L.; Wang, J.; Hu, X. An classification systems of production-living-ecological land on the county level: Theory building and empirical research. China Land Sci. 2018, 32, 59–66. [Google Scholar] [CrossRef]
  41. Geng-ying, J.; Xiao-zhong, Y.; Zhi-qiang, H.; Xiao, Z.; Lin, L. Evolution characteristics and possible impact factors for the changing pattern and function of “Production-Living-Ecological” space in Wuyuan county. J. Nat. Resour. 2021, 36, 1252–1267. [Google Scholar] [CrossRef]
  42. Liao, G.; He, P.; Gao, X.; Lin, Z.; Huang, C.; Zhou, W.; Deng, O.; Xu, C.; Deng, L. Land use optimization of rural production–living–ecological space at different scales based on the BP–ANN and CLUE–S models. Ecol. Indic. 2022, 137, 108710. [Google Scholar] [CrossRef]
  43. Yu, Z.; Xu, E.; Zhang, H.; Shang, E. Spatio-temporal coordination and conflict of production-living-ecology land functions in the beijing-tianjin-hebei region, china. Land 2020, 9, 170. [Google Scholar] [CrossRef]
  44. Hongq, Z.; Erqi, X.; Huiyi, Z. An ecological-living-industrial land classification system and its spatial distribution in China. China. Resour. Sci. 2015, 37, 1332–1338. [Google Scholar] [CrossRef]
  45. Zhu, H.; Li, X. Discussion on the index method of regional land use change. Acta Geogr. Sin. 2003, 58, 643–650. [Google Scholar] [CrossRef]
  46. Dong, Q.; Zhong, K.; Liao, Y.; Xiong, R.; Wang, F.; Pang, M. Coupling coordination degree of environment, energy, and economic growth in resource-based provinces of China. Resour. Policy 2023, 81, 103308. [Google Scholar] [CrossRef]
  47. Li, Y.; Li, Y.; Zhou, Y.; Shi, Y.; Zhu, X. Investigation of a coupling model of coordination between urbanization and the environment. J. Environ. Manag. 2012, 98, 127–133. [Google Scholar] [CrossRef]
  48. Yang, Y.; Bao, W.; Liu, Y. Coupling coordination analysis of rural production-living-ecological space in the Beijing-Tianjin-Hebei region. Ecol. Indic. 2020, 117, 106512. [Google Scholar] [CrossRef]
  49. Yang, M.; Jiao, M.; Zhang, J. Coupling coordination and interactive response analysis of ecological environment and urban resilience in the Yangtze River Economic Belt. J. Environ. Res. Public Health 2022, 19, 11988. [Google Scholar] [CrossRef]
  50. Wang, J.; Xu, C. Geodetector: Principle and prospective. Acta Geogr. Sin. 2017, 72, 116–134. [Google Scholar] [CrossRef]
  51. Wu, Q.; Meng, J. Analysis of the Evolution and Driving Factors of Production-Living-Ecological Space Pattern in the Heihe River Basin from 1980 to 2020, China. J. Peking Univ. 2023, 59, 970–980. [Google Scholar] [CrossRef]
  52. Lyu, Y.; Shi, P.; Han, G.; Liu, L.; Guo, L.; Hu, X.; Zhang, G. Desertification Control Practices in China. Sustainability 2020, 12, 3258. [Google Scholar] [CrossRef]
  53. Xia, N.; Hai, W.; Tang, M.; Song, J.; Quan, W.; Zhang, B.; Ma, Y. Spatiotemporal evolution law and driving mechanism of production–living–ecological space from 2000 to 2020 in Xinjiang, China. Ecol. Indic. 2023, 154, 110807. [Google Scholar] [CrossRef]
  54. Gong, Z.; Yuan, Y.; Qie, L.; Huang, S.; Xie, X.; Zhong, R.; Pu, L. Spatiotemporal Differentiation and Coupling Coordination Relationship of the Production-Living-Ecological Function at County Scale: A Case Study of Jiangsu Province. Land 2023, 12, 2027. [Google Scholar] [CrossRef]
  55. Zhao, J.; Zhao, Y. Synergy/trade-offs and differential optimization of production, living, and ecological functions in the Yangtze River economic Belt, China. Ecol. Indic. 2023, 147, 109925. [Google Scholar] [CrossRef]
  56. Meng, J.; Cheng, H.; Li, F.; Han, Z.; Wei, C.; Wu, Y.; You, N.W.; Zhu, L. Spatial-temporal trade-offs of land multi-functionality and function zoning at finer township scale in the middle reaches of the Heihe River. Land Use Policy 2022, 115, 106019. [Google Scholar] [CrossRef]
  57. Huang, M.; Li, Y.; Li, M.; Chen, S.; Zeng, C.; Zhang, B.; Xia, C. Coupling response of human activity intensity and landscape pattern in the Three Gorges Reservoir Area. Acta Ecol. Sin. 2022, 42, 3959–3973. [Google Scholar] [CrossRef]
  58. Kou, Y.; Chen, S.; Zhou, K.; Qiu, Z.; He, J.; Shi, X.; Zhou, X.; Zhang, Q. Spatiotemporal Patterns and Coupling Coordination Analysis of Multiscale Social–Economic–Ecological Effects in Ecologically Vulnerable Areas Based on Multi-Source Data: A Case Study of the Tuha Region, Xinjiang Province. Land 2024, 13, 282. [Google Scholar] [CrossRef]
  59. Fan, Y.; Jin, X.; Gan, L.; Jessup, L.H.; Pijanowski, B.C.; Lin, J.; Yang, Q.; Lyu, L. Dynamics of spatial associations among multiple land use functions and their driving mechanisms: A case study of the Yangtze River Delta region, China. Environ. Impact Assess. Rev. 2022, 97, 106858. [Google Scholar] [CrossRef]
  60. Zhou, D.; Wang, X.; Shi, M. Human driving forces of oasis expansion in northwestern China during the last decade—A case study of the Heihe River basin. Land Degrad. Dev. 2017, 28, 412–420. [Google Scholar] [CrossRef]
  61. Yang, L.; Guan, Q.; Lin, J.; Tian, J.; Tan, Z.; Li, H. Evolution of NDVI secular trends and responses to climate change: A perspective from nonlinearity and nonstationarity characteristics. Remote Sens. Environ. 2021, 254, 112247. [Google Scholar] [CrossRef]
Figure 1. Study area’s geographic context. (a) Geographic location of Xinjiang; (b) geographic location of the Turpan–Hami Basin; (c) geographic information of the Turpan–Hami Basin and district counties.
Sustainability 16 09054 g001
Figure 2. Turpan–Hami Basin PLES spatial classification (2010–2020).
Sustainability 16 09054 g002
Figure 3. PLES land area transfer map from 2010 to 2020.
Sustainability 16 09054 g003
Figure 4. Temporal and spatial distributions of grid-scale PLE function evaluations from 2010 to 2020.
Sustainability 16 09054 g004
Figure 5. County PLE functional evaluation map.
Sustainability 16 09054 g005
Figure 6. Spatial distribution characteristics of PLES coupling coordination in the Turpan–Hami Basin from 2010 to 2020.
Sustainability 16 09054 g006
Figure 7. CCD of districts and counties in the Turpan–Hami Basin.
Sustainability 16 09054 g007
Figure 8. Detection results of the PLES CCD drivers in the Turpan–Hami Basin from 2000 to 2020.
Sustainability 16 09054 g008
Figure 9. Interaction detection results of the PLES coupling coherence drivers in the Turpan–Hami Basin from 2000 to 2020.
Sustainability 16 09054 g009
Table 1. Data sources.
DataTimeResolutionData Sources
DEM202030 mGeospatial Data Cloud (http://www.gscloud.cn, retrieved on 15 January 2024)
Land use2010~202030 mResource and Environmental Science Data Center of Chinese Academy of Sciences (http://www.resdc.cn, retrieved on 23 April 2024)
China Soil Database20201 kmWorld Soil Database(HWSD) (https://soilgrids.org, retrieved on 23 April 2024)
Population Density2010~20201 kmResource and Environmental Science Data Center of Chinese Academy of Sciences (http://www.resdc.cn, retrieved on 23 April 2024)
Annual Precipitation2010~20201 kmNational Earth System Science Data Center (http://gre.geodata.cn, retrieved on 28 April 2024)
Evapotranspiration2010~20201 kmNational Earth System Science Data Center (http://gre.geodata.cn, retrieved on 28 April 2024)
Temperature2010~20201 kmNational Earth System Science Data Center (http://gre.geodata.cn, retrieved on 28 April 2024)
Social statistical data2010~2020\Xinjiang Statistical Yearbook, Turpan Statistical Yearbook, Hami Statistical Yearbook
POI2010~2020\GaoDe
Table 2. Table of PLES spatial classification system in the Turpan–Hami Basin.
Primary
Classification
Secondary
Classification
CodeLand Use Classification
Productive spaceAgricultural
production space
11/12Paddy land, dry land
Industrial and
mining production space
53Industrial and mining land
Living spaceUrban living space51Urban land
Rural living space52Rural settlement
Ecological spaceWoodland
Ecological space
21/22/23/24Forestland, shrubland, open forestland, other forestland
Grassland
Ecological space
31/32/33High coverage grassland, medium cover grassland, ground cover grassland
Water ecological space41/42/43/44/46River channels, lakes, reservoirs, ponds, floodplain
Potential ecological space61/62/63/64/65/66/67Sandy land, Gobi Desert, saline-alkali land,
marshland, bare land, bare rocky land, other unused land
Table 3. Assessment index framework for PLE functions.
System LevelRule LayerIndicator LayerDirectionWeight
Production FunctionAgricultural Production Function (60%)Grain Yield+0.111
Cotton Yield+0.127
Effective Irrigated Area of Farmland+0.052
Number of Livestock at Year-end+0.025
Total Sown Area of Crops+0.052
Cultivated Land Area+0.053
Aggregate Power of Agricultural Machinery+0.066
Fruit Yield+0.053
Rural Fertilizer Usage0.017
Gross Production Value of Agriculture, Forestry, Animal Husbandry, and Fisheries+0.039
Non-Agricultural
Production Function (40%)
Aggregate Social Fixed Asset Investment+0.074
GDP+0.072
Per Capita GDP+0.081
Proportion of Primary Industry Output Value to GDP+0.045
Proportion of Secondary Industry Output Value to GDP+0.019
Proportion of Tertiary Industry Output Value to GDP+0.038
Local Fiscal Revenue+0.076
Living
Function
Basic Livelihood Security Function (47%)Number of Hospital Beds per 10,000 Population+0.071
Number of Healthcare Technicians per 10,000
Population
+0.097
Fiscal Expenditure on Healthcare+0.086
Fiscal Expenditure on Education+0.078
Resident Fixed Asset Investment+0.135
Social Welfare Security Function (53%)Aggregate Retail Sales of Consumer Goods+0.178
Total Population-0.036
Average Wage of Employees on Duty+0.094
Total Rural Economic Income+0.108
Total Employment in Society+0.116
Ecological FunctionEcological Protection
Function (100%)
Water Yield+0.217
Carbon Storage+0.393
Soil Retention+0.147
Habitat Quality+0.242
Table 4. Categorization of coupling coordination degrees.
Developmental StageValue RangeType of Coupling
Low-degree coupling coordination[0,0.2)Severe disorder
[0.2,0.4)Mild disorder
Moderate coupling coordination[0.4,0.6)Basic coordination
High coupling coordination[0.6,0.7)Primary coordinated development
[0.7,0.8)Intermediate coordination
[0.8,1)Quality and coordinated development
Table 5. Relationship types.
Criterion of IntervalInteraction
q(X1∩X2) < min[q(X1), q(X2)]Nonlinear weakening
min[q(X1), q(X2)] < q(X1∩X2) < max[q(X1), q(X2)]Single-factor nonlinear weakening
q(X1∩X2) > max[q(X1), q(X2)]Dual factor enhancement
q(X1∩X2) = q(X1) + q(X2)Independence
q(X1∩X2) > q(X1) + q(X2)Nonlinear enhancement
Table 6. Area of PLES land types (Unit: km2).
Classify201020152020
Agricultural production space3,543,4763,551,9283,497,885
Industrial and mining production space370,597762,868738,207
Urban living space111,825119,647157,791
Rural living space153,527164,144212,309
Forestland ecological space695,974688,754651,241
Grassland ecological space46,720,16246,670,53946,656,402
Water ecological space416,995417,304446,866
Potential ecological space182,789,717182,417,840182,441,484
Table 7. PLES land area transfer table.
20102020
Production SpaceLiving SpaceEcological SpaceTransfer Out
Production space3209.9682.69230.00312.69
Living space13.31222.532.9816.29
Ecological space589.2127.87206,933.88617.08
Transfer in602.52110.57232.98\
Disclaimer/Publisher’s Note: The statements, opinions and data contained in all publications are solely those of the individual author(s) and contributor(s) and not of MDPI and/or the editor(s). MDPI and/or the editor(s) disclaim responsibility for any injury to people or property resulting from any ideas, methods, instructions or products referred to in the content.

