
Choosing Recovery Strategies for Waste Electronics: How Product Modularity Influences Cooperation and Competition


Abstract
1. Introduction
- What is the optimal modularity level for each recovery strategy?
- How does the TPR influence product modularity, manufacturer’s profits, and collection quantity?
- Faced with a TPR, which recovery scenario yields greater benefits for both the manufacturer and the environment?
2. Literature Review
2.1. Collecting Competition and Cooperation
2.2. Modularity’s Impact on Recovery
2.3. Recovery Options
3. Assumptions
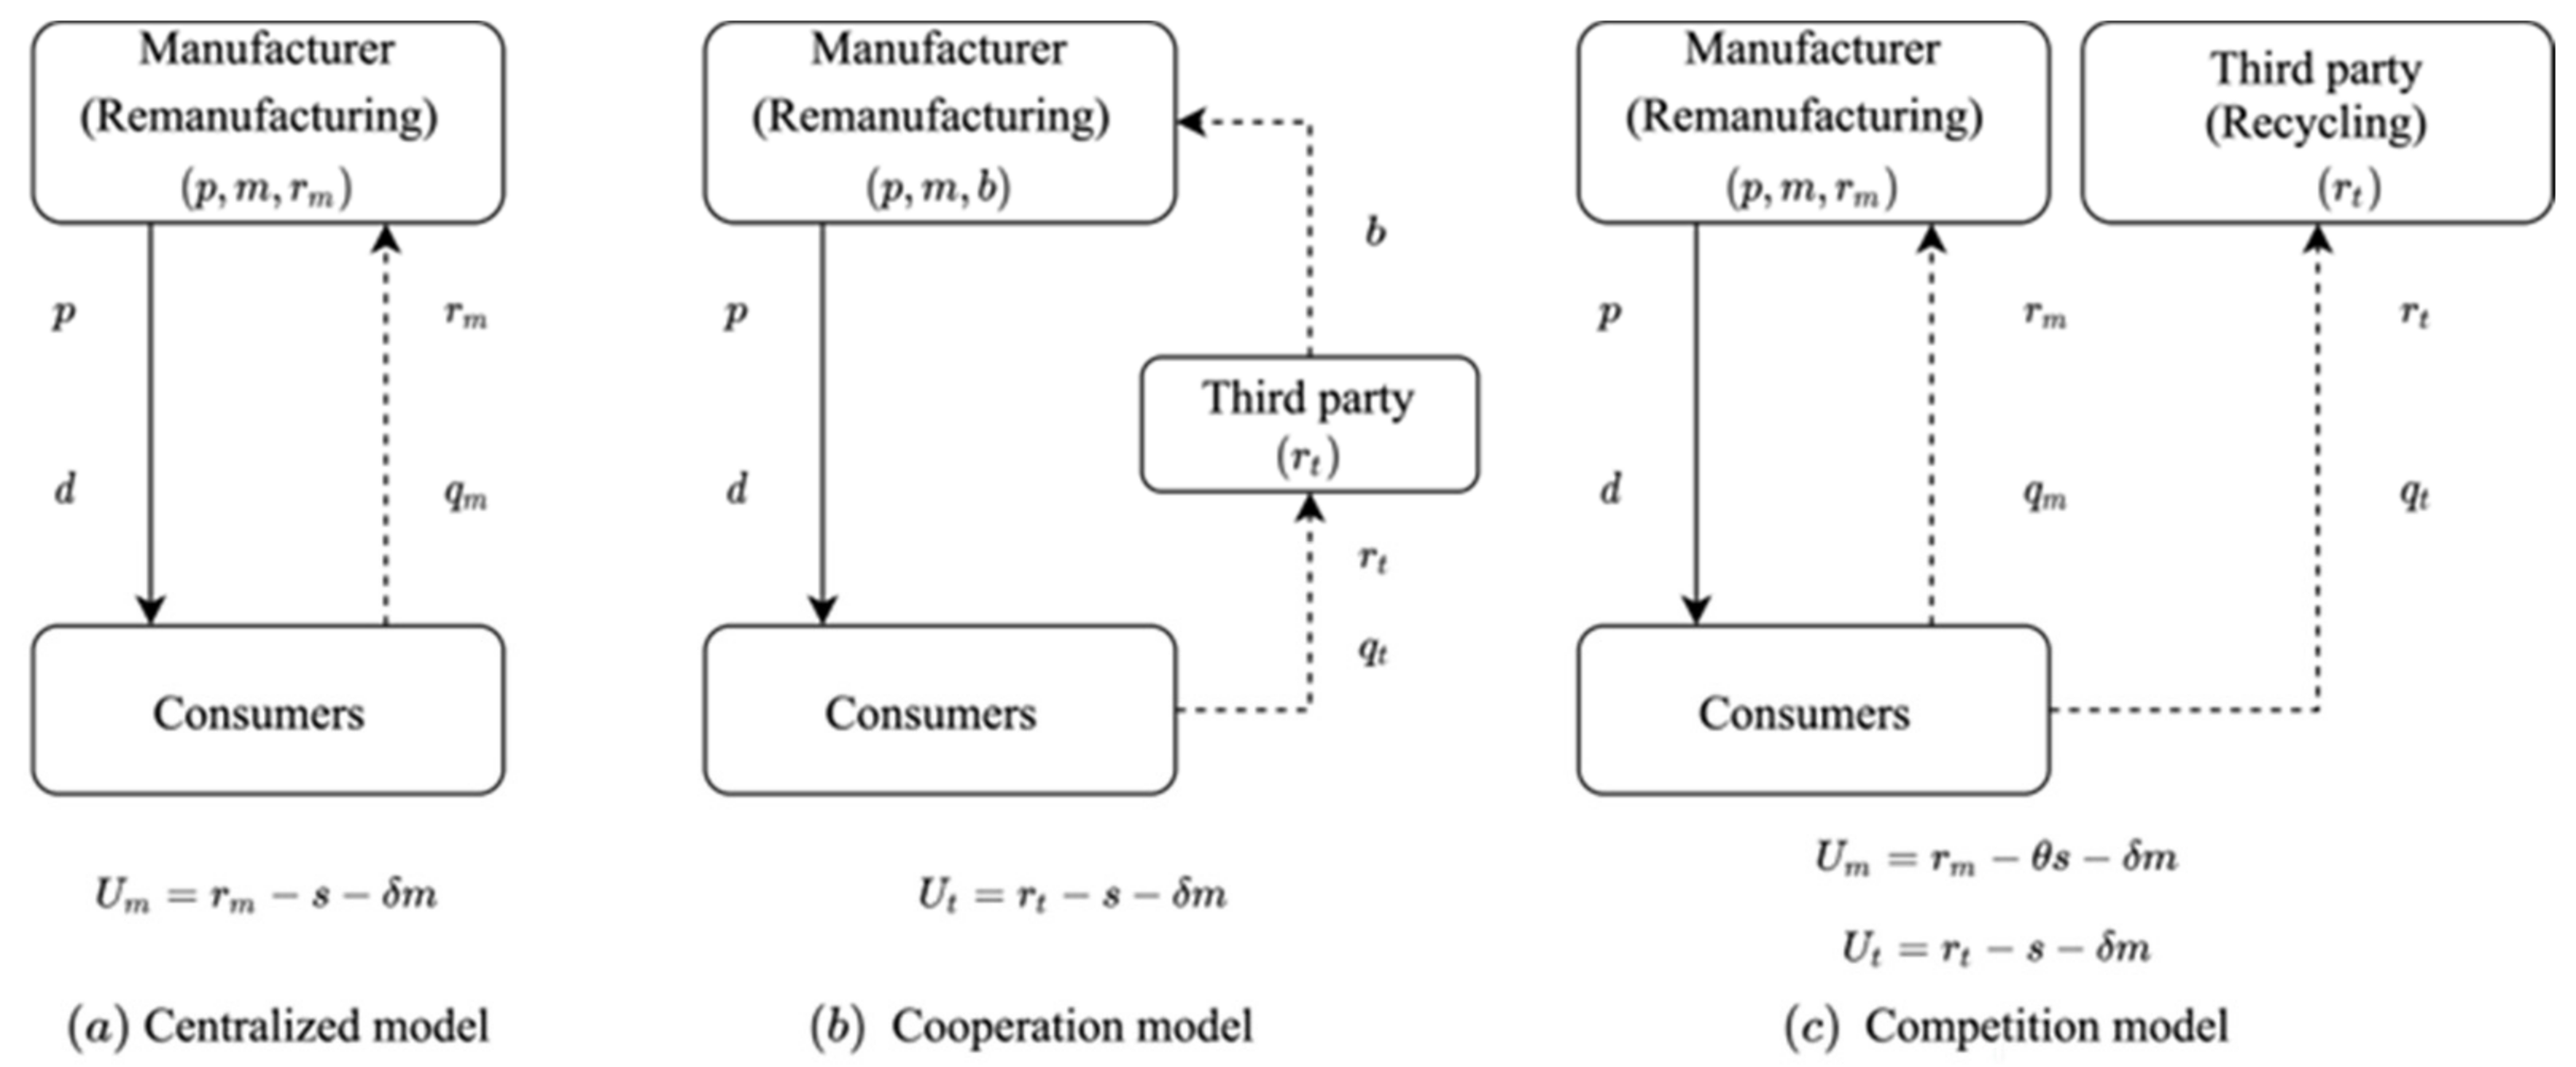
4. Models
4.1. Centralized Strategy
4.2. Cooperation Strategy
4.3. Competition Strategy
4.3.1. The Manufacturer and the TPR Coexist in the Collecting Market
4.3.2. The Manufacturer Monopolizes the Recovery Market
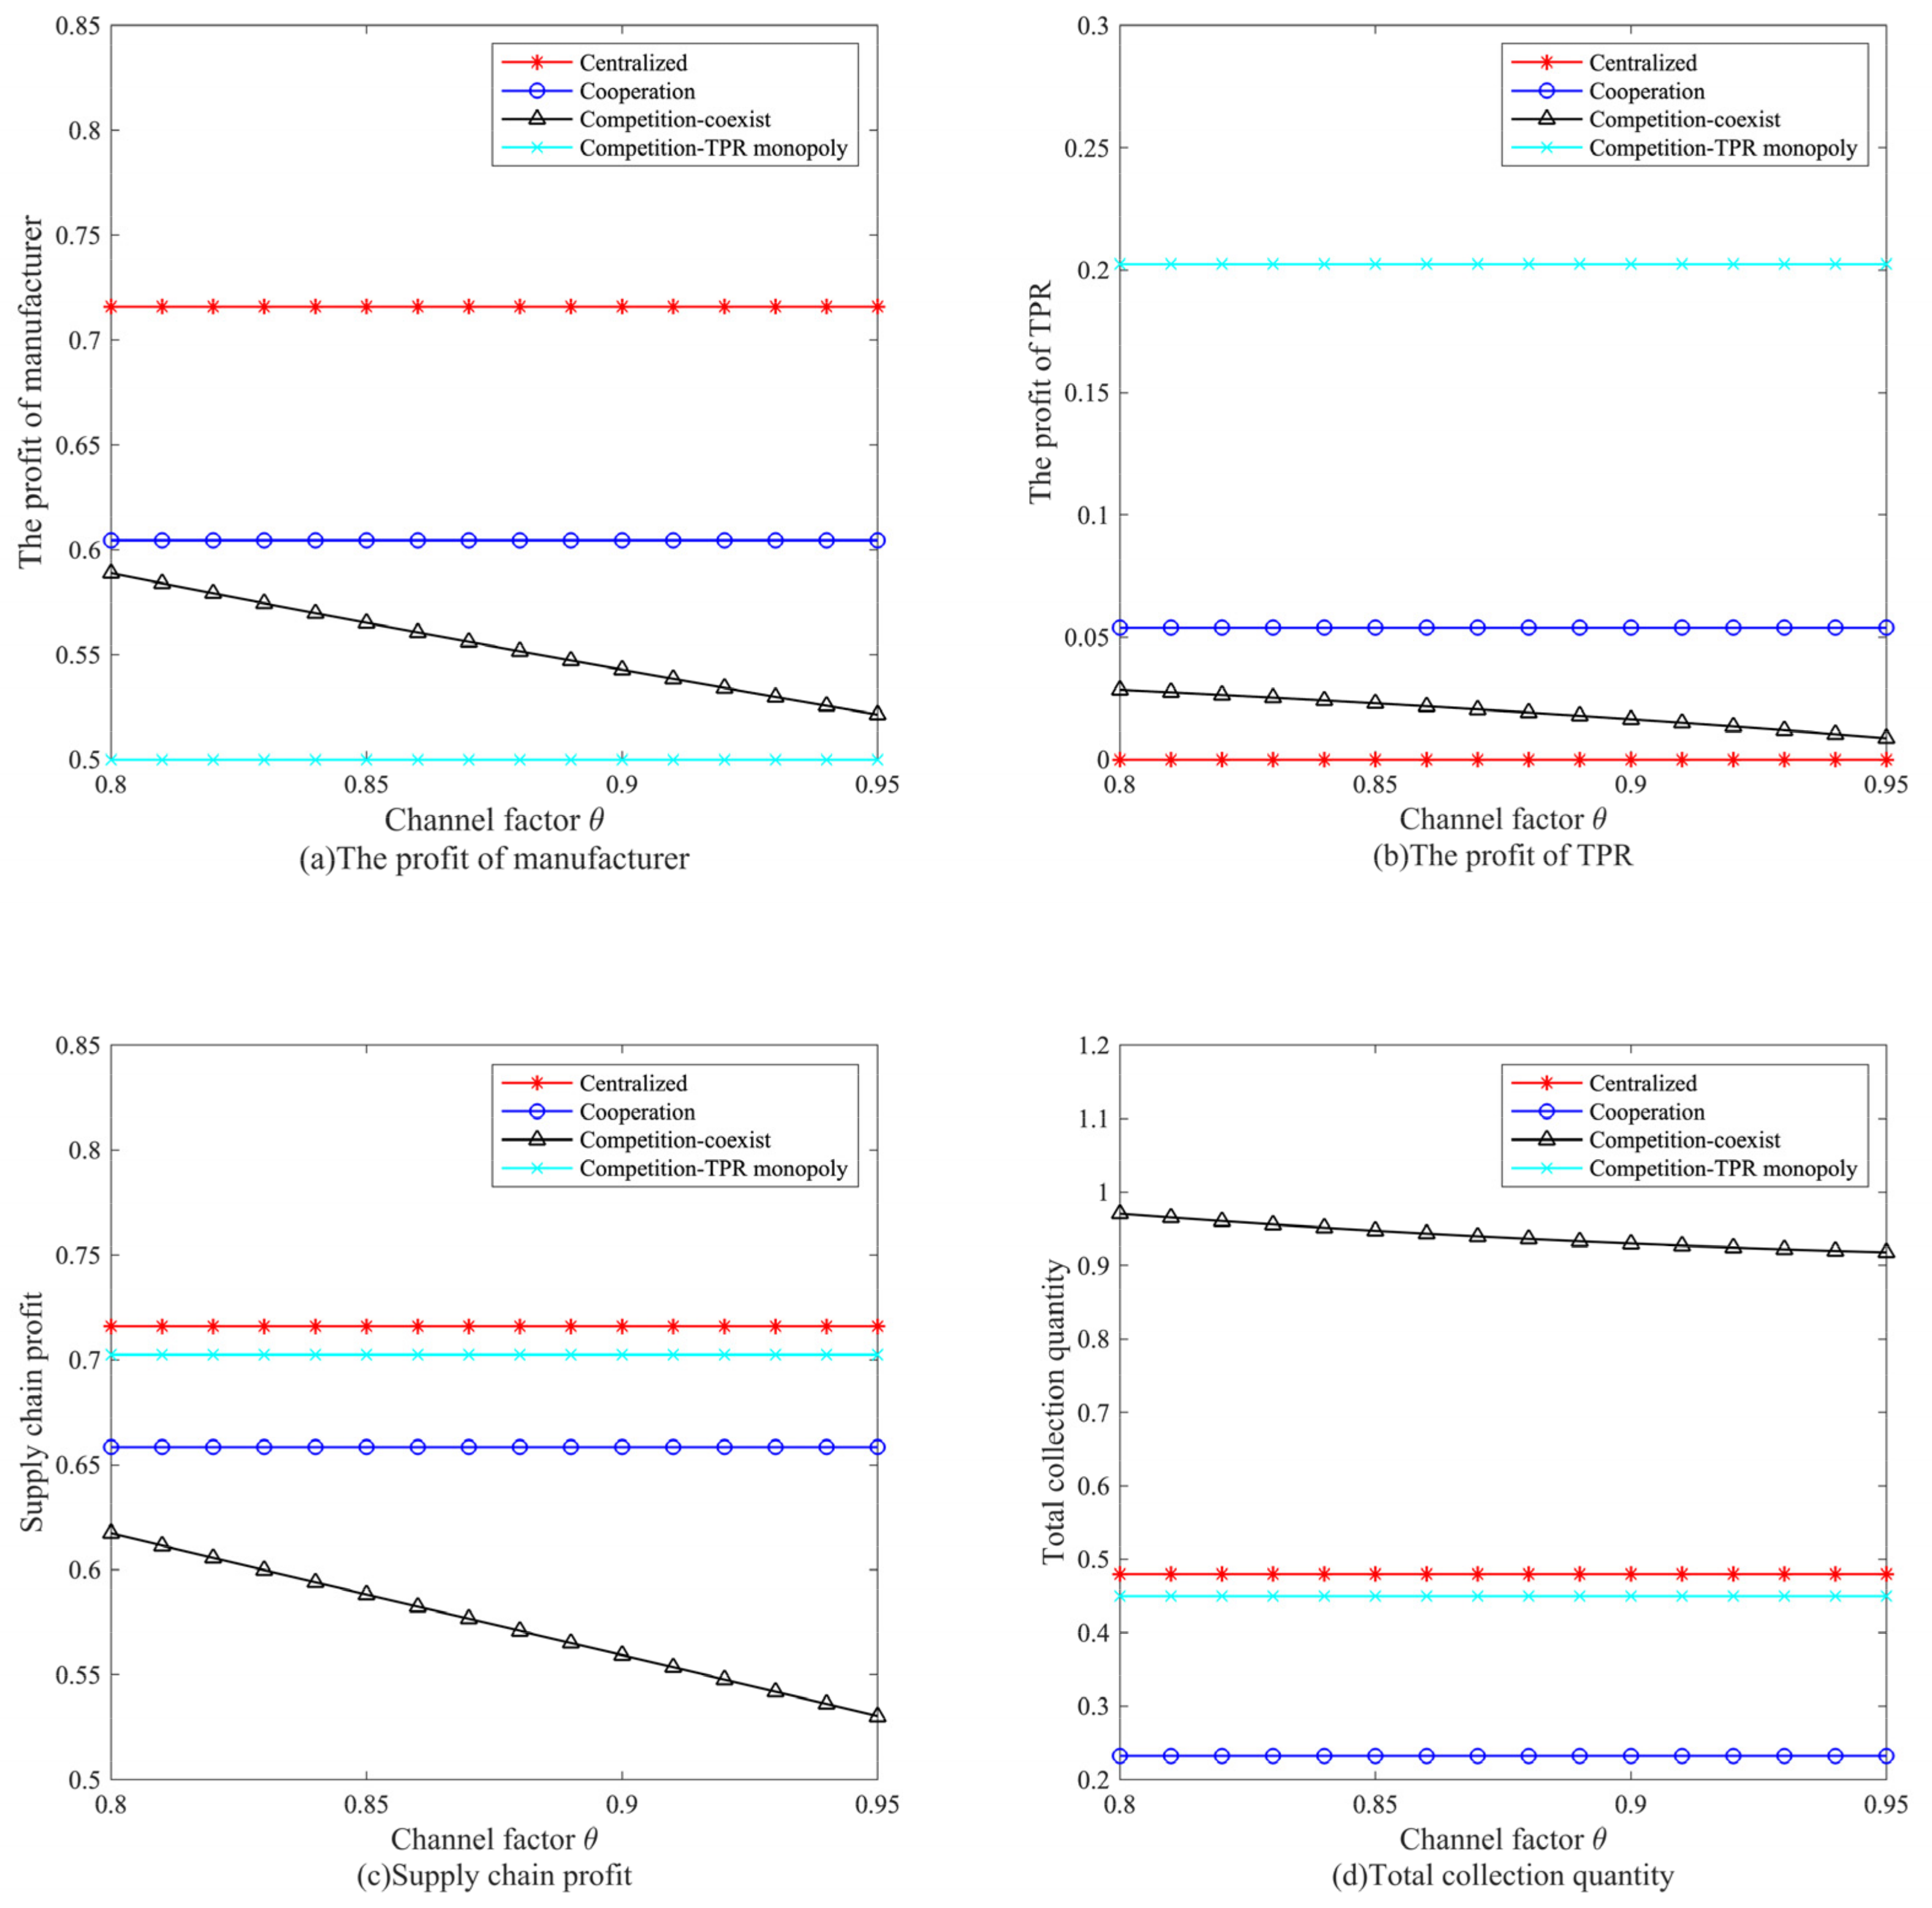
5. Comparative Analysis
6. Numerical Study
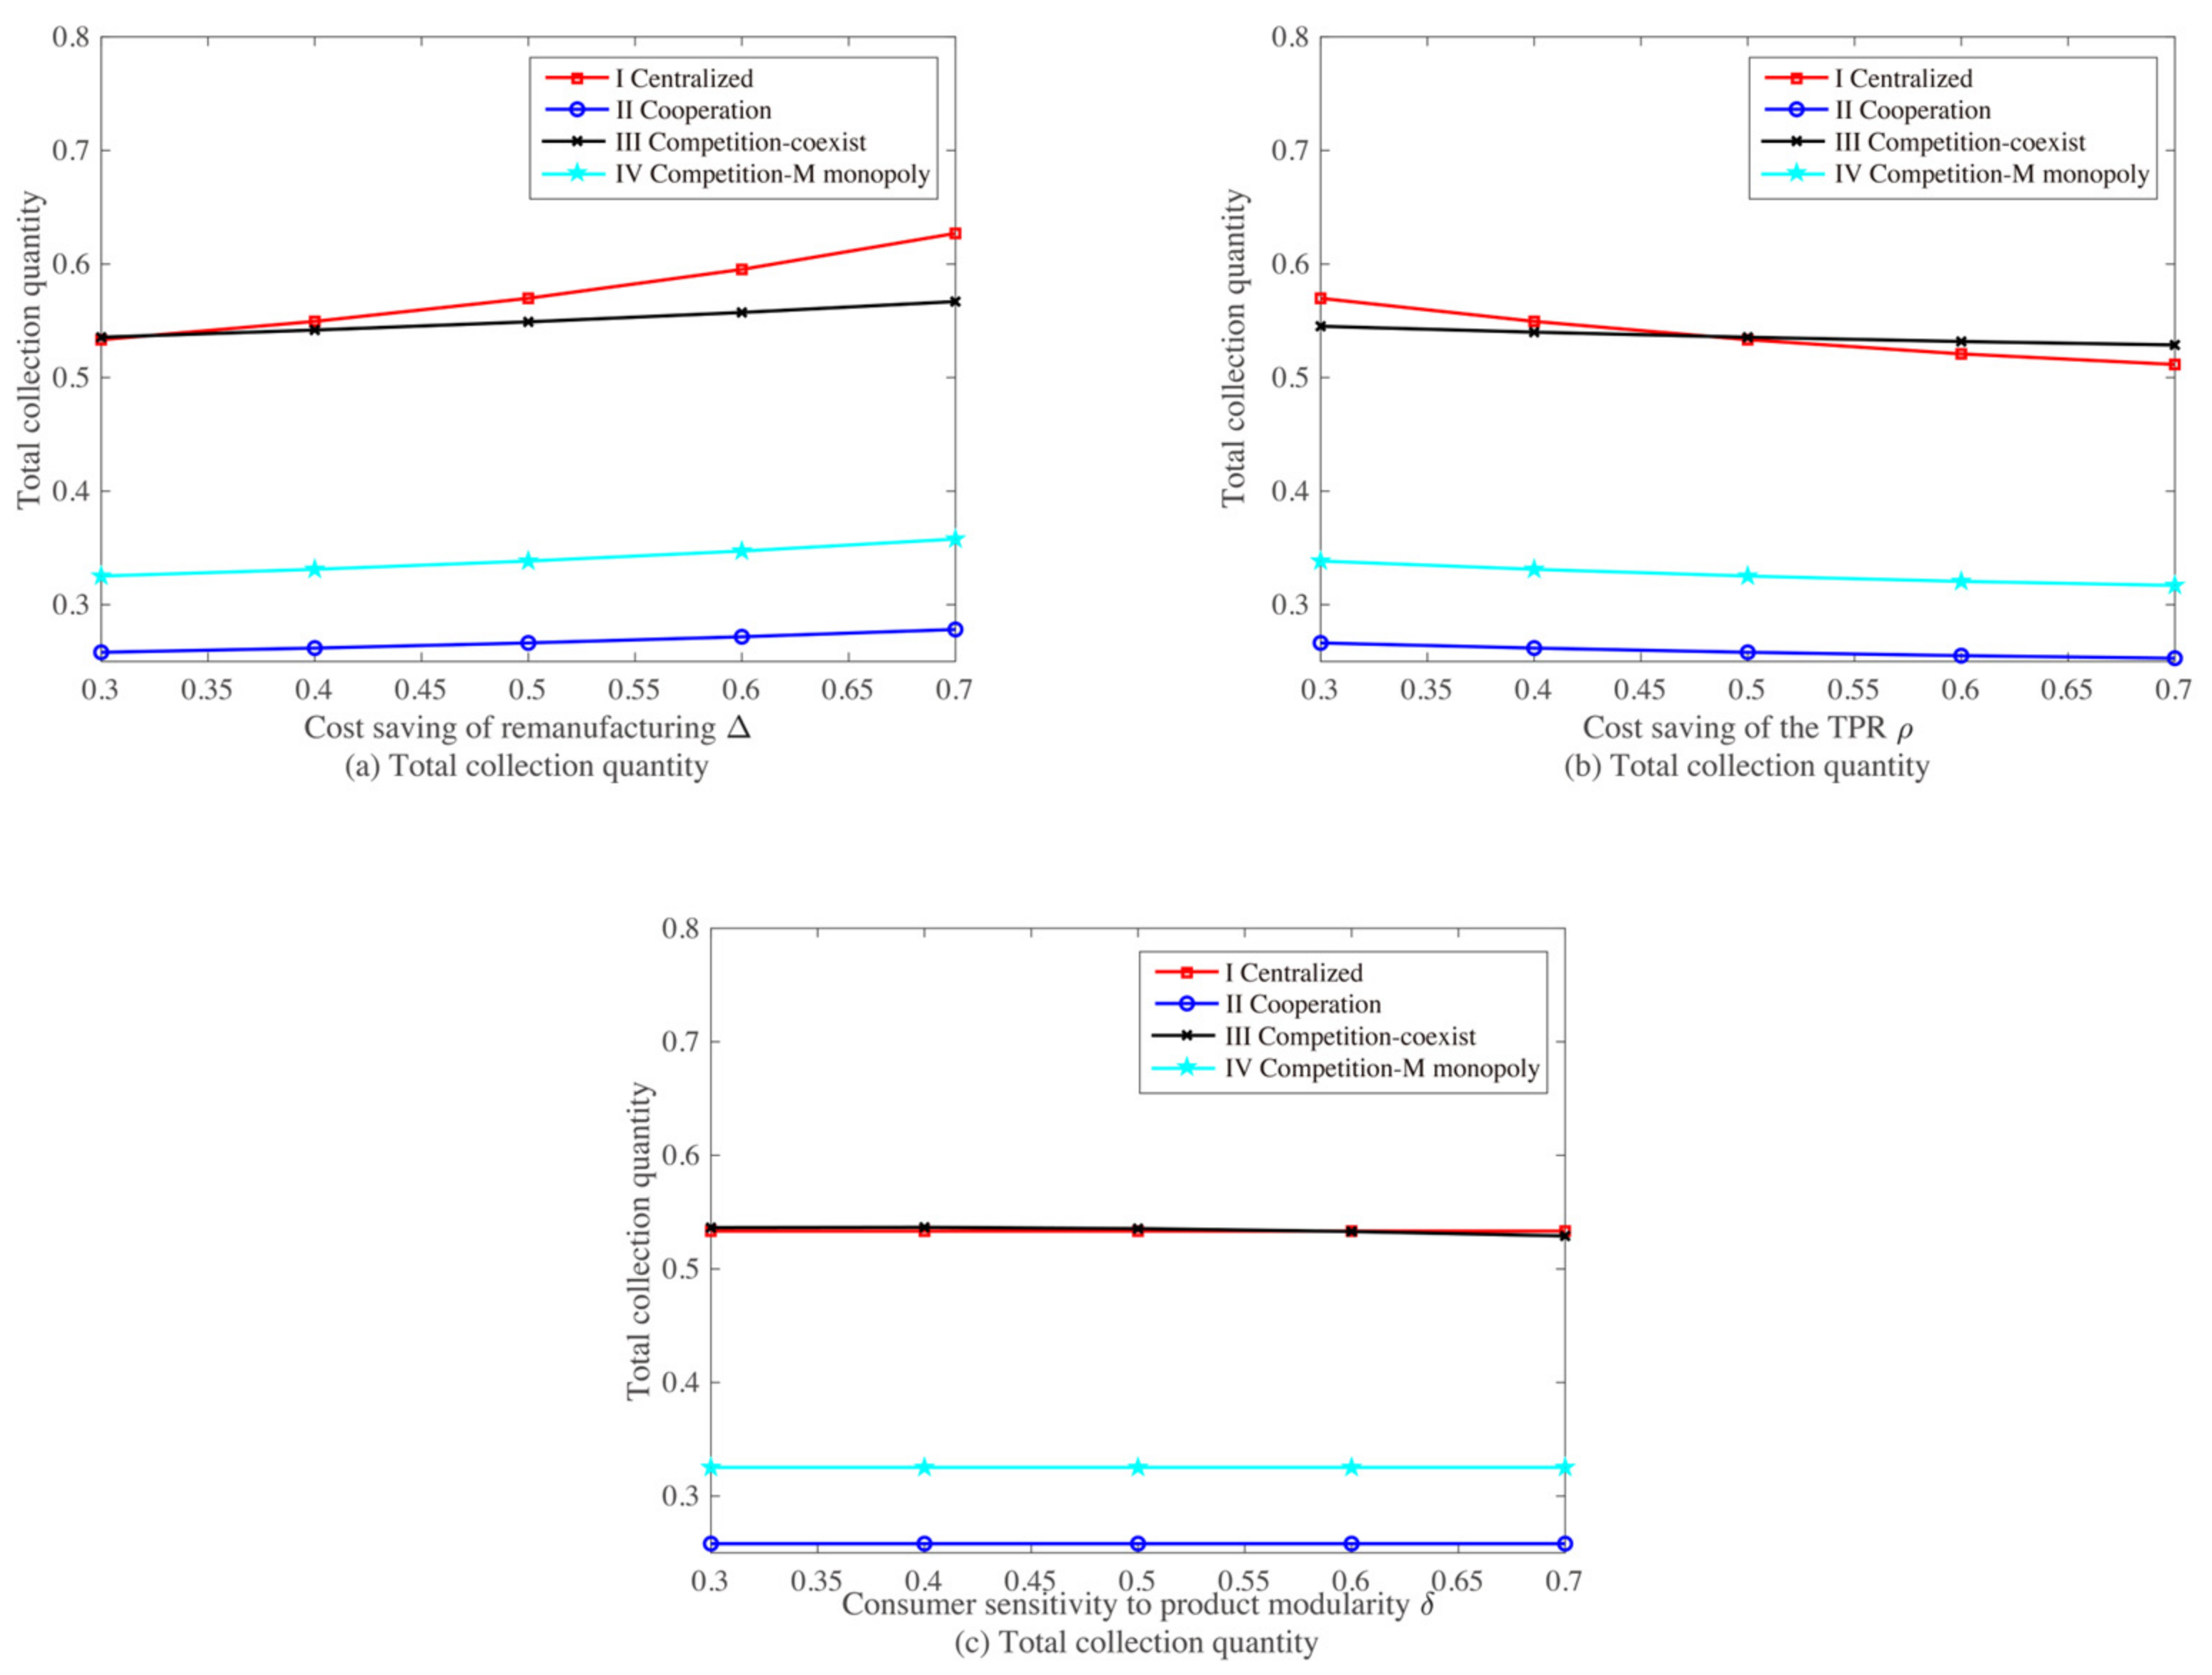
6.1. Comparison of the Recovery Strategies
6.2. Modularity’s Effect on Members’ Profits and Collection Quantity
7. Extensions
7.1. Extension 1: Consumers Prefer the Manufacturer Collecting Channel ()
7.2. Extension 2: Modularity’s Impact on Production Cost
8. Conclusions
9. Limitations of This Study
Author Contributions
Funding
Institutional Review Board Statement
Informed Consent Statement
Data Availability Statement
Conflicts of Interest
Appendix A
Appendix B
Appendix C
Appendix D
Appendix E
Appendix F
Appendix G
Appendix H

| Recovery Strategies | ||||||||||
|---|---|---|---|---|---|---|---|---|---|---|
| 1. Centralized | 0.3 | 2 | 0.199 | 0.630 | \ | 0.570 | \ | 0.785 | \ | 0.785 |
| 0.4 | 2 | 0.165 | 0.615 | \ | 0.549 | \ | 0.774 | \ | 0.774 | |
| 0.5 | 2 | 0.133 | 0.600 | \ | 0.533 | \ | 0.767 | \ | 0.767 | |
| 0.6 | 2 | 0.104 | 0.583 | \ | 0.521 | \ | 0.760 | \ | 0.760 | |
| 0.7 | 2 | 0.077 | 0.565 | \ | 0.512 | \ | 0.756 | \ | 0.756 | |
| 2. Cooperation | 0.3 | 2 | 0.093 | 0.561 | 0.294 | \ | 0.266 | 0.633 | 0.071 | 0.704 |
| 0.4 | 2 | 0.078 | 0.555 | 0.293 | \ | 0.262 | 0.631 | 0.069 | 0.700 | |
| 0.5 | 2 | 0.065 | 0.548 | 0.290 | \ | 0.258 | 0.629 | 0.067 | 0.696 | |
| 0.6 | 2 | 0.051 | 0.541 | 0.286 | \ | 0.255 | 0.628 | 0.065 | 0.693 | |
| 0.7 | 2 | 0.038 | 0.532 | 0.279 | \ | 0.253 | 0.626 | 0.064 | 0.690 | |
| 3.1 Competition | 0.3 | 2 | 0.043 | 0.756 | 0.558 | 0.329 | 0.216 | 0.593 | 0.017 | 0.610 |
| (Coexist) | 0.4 | 2 | 0.039 | 0.752 | 0.555 | 0.328 | 0.212 | 0.592 | 0.017 | 0.609 |
| 0.5 | 2 | 0.034 | 0.749 | 0.553 | 0.327 | 0.208 | 0.592 | 0.016 | 0.608 | |
| 0.6 | 2 | 0.030 | 0.745 | 0.550 | 0.326 | 0.206 | 0.592 | 0.016 | 0.608 | |
| 0.7 | 2 | 0.025 | 0.741 | 0.546 | 0.325 | 0.204 | 0.591 | 0.016 | 0.607 | |
| 3.2 Competition | 0.3 | 2 | 0.118 | 0.577 | \ | 0.338 | \ | 0.669 | \ | 0.669 |
| (M monopoly) | 0.4 | 2 | 0.100 | 0.570 | \ | 0.331 | \ | 0.666 | \ | 0.666 |
| 0.5 | 2 | 0.081 | 0.561 | \ | 0.325 | \ | 0.662 | \ | 0.662 | |
| 0.6 | 2 | 0.064 | 0.551 | \ | 0.321 | \ | 0.660 | \ | 0.660 | |
| 0.7 | 2 | 0.048 | 0.540 | \ | 0.317 | \ | 0.658 | \ | 0.658 | |
| 1. Centralized | 1 | 2 | 0.133 | 0.600 | \ | 0.533 | \ | 0.767 | \ | 0.767 |
| 1.1 | 2 | 0.165 | 0.632 | \ | 0.550 | \ | 0.775 | \ | 0.775 | |
| 1.2 | 2 | 0.199 | 0.670 | \ | 0.570 | \ | 0.785 | \ | 0.785 | |
| 1.3 | 2 | 0.238 | 0.714 | \ | 0.595 | \ | 0.798 | \ | 0.798 | |
| 1.4 | 2 | 0.282 | 0.768 | \ | 0.627 | \ | 0.814 | \ | 0.814 | |
| 2. Cooperation | 1 | 2 | 0.065 | 0.548 | 0.290 | \ | 0.258 | 0.629 | 0.067 | 0.696 |
| 1.1 | 2 | 0.079 | 0.563 | 0.301 | \ | 0.262 | 0.631 | 0.069 | 0.700 | |
| 1.2 | 2 | 0.093 | 0.579 | 0.313 | \ | 0.266 | 0.633 | 0.071 | 0.704 | |
| 1.3 | 2 | 0.109 | 0.598 | 0.326 | \ | 0.272 | 0.636 | 0.074 | 0.710 | |
| 1.4 | 2 | 0.125 | 0.619 | 0.341 | \ | 0.278 | 0.639 | 0.077 | 0.716 | |
| 3.1 Competition | 1 | 2 | 0.034 | 0.749 | 0.557 | 0.327 | 0.209 | 0.592 | 0.016 | 0.608 |
| (Coexist) | 1.1 | 2 | 0.051 | 0.767 | 0.568 | 0.332 | 0.210 | 0.594 | 0.017 | 0.610 |
| 1.2 | 2 | 0.069 | 0.787 | 0.584 | 0.339 | 0.210 | 0.596 | 0.017 | 0.612 | |
| 1.3 | 2 | 0.089 | 0.811 | 0.602 | 0.349 | 0.209 | 0.598 | 0.016 | 0.615 | |
| 1.4 | 2 | 0.110 | 0.839 | 0.622 | 0.361 | 0.206 | 0.602 | 0.016 | 0.618 | |
| 3.2 Competition | 1 | 2 | 0.081 | 0.561 | \ | 0.325 | \ | 0.662 | \ | 0.662 |
| (M monopoly) | 1.1 | 2 | 0.100 | 0.580 | \ | 0.331 | \ | 0.666 | \ | 0.666 |
| 1.2 | 2 | 0.118 | 0.601 | \ | 0.338 | \ | 0.669 | \ | 0.669 | |
| 1.3 | 2 | 0.139 | 0.625 | \ | 0.347 | \ | 0.674 | \ | 0.674 | |
| 1.4 | 2 | 0.161 | 0.653 | \ | 0.358 | \ | 0.679 | \ | 0.679 | |
| 1. Centralized | 0.7 | 2 | 0.133 | 0.60 | \ | 0.533 | \ | 0.767 | \ | 0.767 |
| 0.8 | 2 | 0.133 | 0.60 | \ | 0.533 | \ | 0.767 | \ | 0.767 | |
| 0.9 | 2 | 0.133 | 0.60 | \ | 0.533 | \ | 0.767 | \ | 0.767 | |
| 1.0 | 2 | 0.133 | 0.60 | \ | 0.533 | \ | 0.767 | \ | 0.767 | |
| 1.1 | 2 | 0.133 | 0.60 | \ | 0.533 | \ | 0.767 | \ | 0.767 | |
| 2. Cooperation | 0.7 | 2 | 0.065 | 0.548 | 0.290 | \ | 0.258 | 0.629 | 0.067 | 0.696 |
| 0.8 | 2 | 0.065 | 0.548 | 0.290 | \ | 0.258 | 0.629 | 0.067 | 0.696 | |
| 0.9 | 2 | 0.065 | 0.548 | 0.290 | \ | 0.258 | 0.629 | 0.067 | 0.696 | |
| 1.0 | 2 | 0.065 | 0.548 | 0.290 | \ | 0.258 | 0.629 | 0.067 | 0.696 | |
| 1.1 | 2 | 0.065 | 0.548 | 0.290 | \ | 0.258 | 0.629 | 0.067 | 0.696 | |
| 3.1 Competition | 0.7 | 2 | 0.059 | 0.767 | 0.566 | 0.335 | 0.201 | 0.594 | 0.015 | 0.609 |
| (Coexist) | 0.8 | 2 | 0.047 | 0.758 | 0.560 | 0.330 | 0.206 | 0.593 | 0.016 | 0.609 |
| 0.9 | 2 | 0.034 | 0.749 | 0.553 | 0.327 | 0.209 | 0.592 | 0.016 | 0.608 | |
| 1.0 | 2 | 0.022 | 0.739 | 0.544 | 0.325 | 0.208 | 0.592 | 0.016 | 0.608 | |
| 1.1 | 2 | 0.010 | 0.728 | 0.534 | 0.323 | 0.206 | 0.591 | 0.016 | 0.607 | |
| 3.2 Competition | 0.7 | 2 | 0.081 | 0.561 | \ | 0.325 | \ | 0.663 | \ | 0.663 |
| (M monopoly) | 0.8 | 2 | 0.081 | 0.561 | \ | 0.325 | \ | 0.663 | \ | 0.663 |
| 0.9 | 2 | 0.081 | 0.561 | \ | 0.325 | \ | 0.663 | \ | 0.663 | |
| 1.0 | 2 | 0.081 | 0.561 | \ | 0.325 | \ | 0.663 | \ | 0.663 | |
| 1.1 | 2 | 0.081 | 0.561 | \ | 0.325 | \ | 0.663 | \ | 0.663 |
Appendix I
Appendix J
- (1)
- Centralized strategy:
- (2)
- Cooperation strategy:
- (3)
- Competition–coexist: The manufacturer and the TPR coexist in the collecting market.
- (4)
- Competition–monopoly: The manufacturer monopolizes the recovery market.
References
- Baldé, C.P.; Kuehr, R.; Yamamoto, T. The Global E-Waste Monitor 2024. Available online: https://ewastemonitor.info/wp-content/uploads/2024/03/GEM_2024_18-03_web_page_per_page_web.pdf (accessed on 26 June 2024).
- De Giovanni, P.; Zaccour, G. Optimal Quality Improvements and Pricing Strategies with Active and Passive Product Returns. Omega 2019, 88, 248–262. [Google Scholar] [CrossRef]
- Wang, J.; He, S. Optimal Decisions of Modularity, Prices and Return Policy in a Dual-Channel Supply Chain under Mass Customization. Transp. Res. Part E Logist. Transp. Rev. 2022, 160, 102675. [Google Scholar] [CrossRef]
- Wang, J.; He, S. Government Interventions in Closed-Loop Supply Chains with Modularity Design. Int. J. Prod. Econ. 2023, 264, 108965. [Google Scholar] [CrossRef]
- Xerox Xerox’s Modular Copiers. Available online: https://www.modularmanagement.com/blog/product-design-for-circular-economy (accessed on 28 July 2024).
- Fairphone Fairphone Impact Report 2023. Available online: https://www.fairphone.com/wp-content/uploads/2022/06/Fairphone-Impact-Report-2021.pdf (accessed on 22 July 2024).
- Wang, N.; He, Q.; Jiang, B. Hybrid Closed-Loop Supply Chains with Competition in Recycling and Product Markets. Int. J. Prod. Econ. 2019, 217, 246–258. [Google Scholar] [CrossRef]
- He, Q.; Wang, N.; Browning, T.R.; Jiang, B. Competitive Collection with Convenience-Perceived Customers. Eur. J. Oper. Res. 2022, 303, 239–254. [Google Scholar] [CrossRef]
- Ma, Z.-J.; Zhou, Q.; Dai, Y.; Guan, G.-F. To License or Not to License Remanufacturing Business? Sustainability 2018, 10, 347. [Google Scholar] [CrossRef]
- Wei, J.; Chen, W.; Liu, G. How Manufacturer’s Integration Strategies Affect Closed-Loop Supply Chain Performance. Int. J. Prod. Res. 2021, 59, 4287–4305. [Google Scholar] [CrossRef]
- Chen, C.-K.; Ulya, M.A. Analyses of the Reward-Penalty Mechanism in Green Closed-Loop Supply Chains with Product Remanufacturing. Int. J. Prod. Econ. 2019, 210, 211–223. [Google Scholar] [CrossRef]
- TES TES Wins Microsoft Authorized Refurbisher Partner Innovation Award. Available online: https://www.sktes.com/awards-recognition?hsCtaTracking=41f2631f-b958-46c2-96c5-4c52ba76e90c%7Cc54fbabd-0ac9-45d0-9e34-0acb9b756254 (accessed on 24 July 2024).
- Xerox 2023 Corporate Social Responsibility Report. Available online: https://www.xerox.com/downloads/usa/en/x/Xerox_CSR_Report.pdf (accessed on 3 July 2024).
- Chu, X.; Zhong, Q.; Li, X. Reverse Channel Selection Decisions with a Joint Third-Party Recycler. Int. J. Prod. Res. 2018, 56, 5969–5981. [Google Scholar] [CrossRef]
- Agrawal, V.; Atasu, A.; Ülkü, S. Leasing, Modularity, and the Circular Economy. Manag. Sci. 2021, 67, 6782–6802. [Google Scholar] [CrossRef]
- Amend, C.; Revellio, F.; Tenner, I.; Schaltegger, S. The Potential of Modular Product Design on Repair Behavior and User Experience—Evidence from the Smartphone Industry. J. Clean. Prod. 2022, 367, 132770. [Google Scholar] [CrossRef]
- Apple’s Environmental Progress Report Apple’s Environmental Progress Report. Available online: https://www.apple.com.cn/environment/pdf/Apple_Environmental_Progress_Report_2024.pdf (accessed on 12 June 2024).
- Wu, C.-H. OEM Product Design in a Price Competition with Remanufactured Product. Omega 2013, 41, 287–298. [Google Scholar] [CrossRef]
- Das, K.; Chowdhury, A.H. Designing a Reverse Logistics Network for Optimal Collection, Recovery and Quality-Based Product-Mix Planning. Int. J. Prod. Econ. 2012, 135, 209–221. [Google Scholar] [CrossRef]
- Tsao, Y.-C.; Linh, V.-T.; Lu, J.-C. Closed-Loop Supply Chain Network Designs Considering RFID Adoption. Comput. Ind. Eng. 2017, 113, 716–726. [Google Scholar] [CrossRef]
- Bai, Q.; Gong, Y.; Jin, M.; Xu, X. Effects of Carbon Emission Reduction on Supply Chain Coordination with Vendor-Managed Deteriorating Product Inventory. Int. J. Prod. Econ. 2019, 208, 83–99. [Google Scholar] [CrossRef]
- Calmon, A.P.; Graves, S.C. Inventory Management in a Consumer Electronics Closed-Loop Supply Chain. Manuf. Serv. Oper. Manag. 2017, 19, 568–585. [Google Scholar] [CrossRef]
- Yuchi, Q.; Wang, N.; He, Z.; Chen, H. Hybrid Heuristic for the Location-Inventory-Routing Problem in Closed-Loop Supply Chain. Int. Trans. Oper. Res. 2021, 28, 1265–1295. [Google Scholar] [CrossRef]
- Mutha, A.; Pokharel, S. Strategic Network Design for Reverse Logistics and Remanufacturing Using New and Old Product Modules. Comput. Ind. Eng. 2009, 56, 334–346. [Google Scholar] [CrossRef]
- Esmaeili, M.; Allameh, G.; Tajvidi, T. Using Game Theory for Analysing Pricing Models in Closed-Loop Supply Chain from Short- and Long-Term Perspectives. Int. J. Prod. Res. 2016, 54, 2152–2169. [Google Scholar] [CrossRef]
- Machado, N.; Morioka, S.N.; Gohr, C.F. Can Product Modularity Boost Strategies for Circular Business Models? A Visual Tool Proposal Representing Benefits and Barriers Considering Expert Opinion. J. Clean. Prod. 2024, 448, 141522. [Google Scholar] [CrossRef]
- Jiang, L. Managing Mass Customization Products with Modular Design for Recycling in a Closed-loop Supply Chain. Manag. Decis. Econ. 2023, 44, 4589–4607. [Google Scholar] [CrossRef]
- Li, Q. The Optimal Multi-Period Modular Design with Fairness Concerns. Int. J. Prod. Econ. 2018, 206, 233–249. [Google Scholar] [CrossRef]
- Savaskan, R.C.; Bhattacharya, S.; Van Wassenhove, L.N. Closed-Loop Supply Chain Models with Product Remanufacturing. Manag. Sci. 2004, 50, 239–252. [Google Scholar] [CrossRef]
- Liu, C.-Y.; Wang, H.; Tang, J.; Chang, C.-T.; Liu, Z. Optimal Recovery Model in a Used Batteries Closed-Loop Supply Chain Considering Uncertain Residual Capacity. Transp. Res. Part E Logist. Transp. Rev. 2021, 156, 102516. [Google Scholar] [CrossRef]
- He, Q.; Wang, N.; Yang, Z.; He, Z.; Jiang, B. Competitive Collection under Channel Inconvenience in Closed-Loop Supply Chain. Eur. J. Oper. Res. 2019, 275, 155–166. [Google Scholar] [CrossRef]
- Zhou, T.; Li, K. Designing Manufacturer’s New Product Technology for a Closed-Loop Supply Chain with Consumer Context Effect. Transp. Res. Part E Logist. Transp. Rev. 2024, 188, 103634. [Google Scholar] [CrossRef]
- Ghosh, D.; Gouda, S.; Shankar, R.; Swami, S.; Thomas, V.C. Strategic Decision Making under Subscription-Based Contracts for Remanufacturing. Int. J. Prod. Econ. 2018, 200, 134–150. [Google Scholar] [CrossRef]
- Zhao, B.; Tang, W.; Wei, L.; Zhang, J. Price Distortion Forced by Recycling Competition under Trade-in Collaboration. Int. J. Prod. Res. 2024, 62, 7687–7703. [Google Scholar] [CrossRef]
- Gong, B.; Gao, Y.; Li, K.W.; Liu, Z.; Huang, J. Cooperate or Compete? A Strategic Analysis of Formal and Informal Electric Vehicle Battery Recyclers under Government Intervention. Int. J. Logist. Res. Appl. 2022, 27, 149–169. [Google Scholar] [CrossRef]
- Yu, Y.; Yang, H.; Zhen, Z. Collection Cooperation Breakdown and Repair in a Closed-Loop Supply Chain during Supply Disruption and Price Shock. Comput. Ind. Eng. 2023, 183, 109495. [Google Scholar] [CrossRef]
- Zhou, Y.; Zhang, Y.; Wahab, M.I.M.; Goh, M. Channel Leadership and Performance for a Closed-Loop Supply Chain Considering Competition. Transp. Res. Part E Logist. Transp. Rev. 2023, 175, 103151. [Google Scholar] [CrossRef]
- Feng, L.; Govindan, K.; Li, C. Strategic Planning: Design and Coordination for Dual-Recycling Channel Reverse Supply Chain Considering Consumer Behavior. Eur. J. Oper. Res. 2017, 260, 601–612. [Google Scholar] [CrossRef]
- De Giovanni, P.; Zaccour, G. A Two-Period Game of a Closed-Loop Supply Chain. Eur. J. Oper. Res. 2014, 232, 22–40. [Google Scholar] [CrossRef]
- Wang, Q.; Hong, X.; Gong, Y.; Chen, W. Collusion or Not: The Optimal Choice of Competing Retailers in a Closed-Loop Supply Chain. Int. J. Prod. Econ. 2020, 225, 107580. [Google Scholar] [CrossRef]
- Kumar Jena, S.; Sarmah, S.P. Price Competition and Co-Operation in a Duopoly Closed-Loop Supply Chain. Int. J. Prod. Econ. 2014, 156, 346–360. [Google Scholar] [CrossRef]
- Su, J.; Zhang, F.; Hu, H.; Jian, J.; Wang, D. Co-Opetition Strategy for Remanufacturing the Closed-Loop Supply Chain Considering the Design for Remanufacturing. Systems 2022, 10, 237. [Google Scholar] [CrossRef]
- Ethiraj, S.K.; Levinthal, D.; Roy, R.R. The Dual Role of Modularity: Innovation and Imitation. Manag. Sci. 2008, 54, 939–955. [Google Scholar] [CrossRef]
- Belkadi, F.; Vlachou, E.; Kumar-Gupta, R.; Zogopoulos, V.; Kaya, M.; Bernard, A.; Mourtzis, D.; Natalizio, S.; Büyükdığan, B.G.; Tekin Bayrak, I. Modularity as a Support for Frugal Product and Supplier Network Co-Definition under Regional Market Constraints: A Mirroring Hypothesis Application. Int. J. Prod. Res. 2018, 56, 6575–6590. [Google Scholar] [CrossRef]
- Mukhopadhyay, S.K.; Setoputro, R. Optimal Return Policy and Modular Design for Build-to-Order Products. J. Oper. Manag. 2005, 23, 496–506. [Google Scholar] [CrossRef]
- Yang, H.; Jiang, L. Modular Design of New Products and Remanufacturing of Used Products under Mass Customization. Rairo-Oper. Res. 2024, 58, 103–128. [Google Scholar] [CrossRef]
- Ülkü, S.; Dimofte, C.V.; Schmidt, G.M. Consumer Valuation of Modularly Upgradeable Products. Manag. Sci. 2012, 58, 1761–1776. [Google Scholar] [CrossRef]
- Li, W.; Sun, H.; Dong, H.; Gan, Y.; Koh, L. Outsourcing Decision-Making in Global Remanufacturing Supply Chains: The Impact of Tax and Tariff Regulations. Eur. J. Oper. Res. 2023, 304, 997–1010. [Google Scholar] [CrossRef]
- Zhou, Q.; Meng, C.; Sheu, J.-B.; Yuen, K.F. Impact of Market Competition on Remanufacturing Investment. IEEE Trans. Eng. Manage. 2023, 71, 6995–7014. [Google Scholar] [CrossRef]
- Cao, J.; Wu, S.; Kumar, S. Recovering and Remanufacturing to Fulfill EPR Regulation in the Presence of Secondary Market. Int. J. Prod. Econ. 2023, 263, 108933. [Google Scholar] [CrossRef]
- Agrawal, V.V.; Atasu, A.; Van Wassenhove, L.N. OM Forum—New Opportunities for Operations Management Research in Sustainability. Manuf. Serv. Oper. Manag. 2019, 21, 1–12. [Google Scholar] [CrossRef]
- Han, X.; Shen, Y.; Bian, Y. Optimal Recovery Strategy of Manufacturers: Remanufacturing Products or Recycling Materials? Ann. Oper. Res. 2020, 290, 463–489. [Google Scholar] [CrossRef]
- Wan, Y.; Yang, L. Differential Recycling Strategies and Government Intervention in a Closed-Loop Supply Chain. Comput. Ind. Eng. 2024, 187, 109816. [Google Scholar] [CrossRef]
- Zhang, H.; Lv, Y.; Zhang, J.Z. Remanufacturing Strategy of Closed-Loop Supply Chain Under the Constraint of Recycling and Remanufacturing Target: Integrating Carbon Footprint and Social Welfare. IEEE Trans. Eng. Manag. 2024, 71, 14258–14270. [Google Scholar] [CrossRef]
- Huang, Q.; Hou, J.; Shen, H. Remanufacturing and Pricing Strategies under Modular Architecture. Comput. Ind. Eng. 2024, 188, 109863. [Google Scholar] [CrossRef]
- Kańska, K.; Wiszniewska-Matyszkiel, A. Dynamic Stackelberg Duopoly with Sticky Prices and a Myopic Follower. Oper. Res. Int. J. 2022, 22, 4221–4252. [Google Scholar] [CrossRef]
- Tang, S.; Wang, W.; Zhou, G. Remanufacturing in a Competitive Market: A Closed-Loop Supply Chain in a Stackelberg Game Framework. Expert Syst. Appl. 2020, 161, 113655. [Google Scholar] [CrossRef]
- Mikkola, J.H. Capturing the Degree of Modularity Embedded in Product Architectures. J. Prod. Innov. Manag. 2006, 23, 128–146. [Google Scholar] [CrossRef]
- Lu, X.; Xu, F.; Qin, F. Remanufacturing Operations in Different Financial Ownership Structures with Consideration of the Upwards Supplier. Sustainability 2024, 16, 3199. [Google Scholar] [CrossRef]
- Sun, X.; Ma, G. Research on Carbon Cap Regulation, Retailer Altruistic Preferences, and Green Decision-Making of Manufacturing Enterprises. Sustainability 2024, 16, 7575. [Google Scholar] [CrossRef]
- Wei, H.; Wang, X.; Yang, T. A Dual-Channel Cooperative Strategy between Recyclers and E-Tailers for the Offline and Online Recycling of Waste Electronics. Sustainability 2024, 16, 1443. [Google Scholar] [CrossRef]
- Apple Apple’s Self Service Repair. Available online: https://support.apple.com/en-gb/self-service-repair (accessed on 14 June 2024).
- Microsoft Microsoft’s Self Service Repair. Available online: https://learn.microsoft.com/en-us/surface/surface-customer-self-repair-surface (accessed on 14 June 2024).
- Kleber, R.; Reimann, M.; Souza, G.C.; Zhang, W. Two-Sided Competition with Vertical Differentiation in Both Acquisition and Sales in Remanufacturing. Eur. J. Oper. Res. 2020, 284, 572–587. [Google Scholar] [CrossRef]
- Zou, Z.-B.; Wang, J.-J.; Deng, G.-S.; Chen, H. Third-Party Remanufacturing Mode Selection: Outsourcing or Authorization? Transp. Res. Part E Logist. Transp. Rev. 2016, 87, 1–19. [Google Scholar] [CrossRef]
- Borenich, A.; Dickbauer, Y.; Reimann, M.; Souza, G.C. Should a Manufacturer Sell Refurbished Returns on the Secondary Market to Incentivize Retailers to Reduce Consumer Returns? Eur. J. Oper. Res. 2020, 282, 569–579. [Google Scholar] [CrossRef]
- Genc, T.S.; De Giovanni, P. Closed-Loop Supply Chain Games with Innovation-Led Lean Programs and Sustainability. Int. J. Prod. Econ. 2020, 219, 440–456. [Google Scholar] [CrossRef]
- Mukhopadhyay, S.K.; Ma, H. Joint Procurement and Production Decisions in Remanufacturing under Quality and Demand Uncertainty. Int. J. Prod. Econ. 2009, 120, 5–17. [Google Scholar] [CrossRef]


| Product Architecture | Recovery Strategy | Method | Focus | |||
|---|---|---|---|---|---|---|
| Integrated | Modular | Competition | Cooperation | |||
| Zhou et al. (2023) [37] | ✓ | Cournot competition | Remanufacturing decisions of two symmetric manufacturers | |||
| Ülkü et al. (2012) [47] | ✓ | ✓ | Empirical study | The value of modularity for consumers | ||
| He et al. (2019, 2022) [8,31] | ✓ | ✓ | Stackelberg game | Consumer inconvenience and competitive collecting channels | ||
| Amend et al. (2022) [16] | ✓ | Empirical study | The relationship between circular economy and modular products | |||
| Ghosh et al. (2018) [33] | ✓ | ✓ | ✓ | Game theory | Recovery strategy selection and contract design | |
| Yuchi et al. (2021) [23] | ✓ | Mixed-integer nonlinear model | Locations of distribution and remanufacturing centers | |||
| J. Wang and He (2022, 2023) [3,4] | ✓ | ✓ | Stackelberg game | Dual channels and return policy/government subsidy | ||
| This paper | ✓ | ✓ | ✓ | Stackelberg game | Modular investments and recovery strategy selection of manufacturer and TPR | |
| Indices | |
|---|---|
| Index for recovery strategy: | |
| Index for supply chain member (manufacturer, TPR): | |
| Parameters | |
| Intrinsic demand for new products | |
| Price sensitivity of the new products | |
| Customer demand for new products | |
| Manufacturer’s manufacturing cost for new products | |
| Manufacturer’s remanufacturing cost | |
| Recycler’s recycling cost | |
| Unit cost savings through remanufacturing via modular design | |
| Unit cost savings through recycling via modular design | |
| Fixed benefit of the manufacturer | |
| Customer’s valuation of old devices | |
| Customer’s preference for the TPR over the manufacturer | |
| Customer’s sensitivity to product modularity | |
| Recovery benefits of the recycler | |
| Cost index of modularity investment | |
| Collection volume of the manufacturer/the TPR | |
| The profits of the manufacturer/the TPR | |
| The profits of the supply chain | |
| Decision variables | |
| Product modularity level | |
| Selling price of new products | |
| Collection price of the manufacturer/the TPR | |
| Transfer price for returning cores from the recycler to the manufacturer |
| Characteristics | Modular Product Architecture |
|---|---|
| Interfaces | Decoupled |
| Outcome | Economies of scale |
| Component Substitutability | High |
| Component Recombinability | High |
| Component Separability | High |
| Recovery Strategies | |||||||||
|---|---|---|---|---|---|---|---|---|---|
| 1. Centralized model | 2 | 0.13 | 0.6 | \ | 0.53 | \ | 0.77 | \ | 0.77 |
| 2. Cooperation | 2 | 0.06 | 0.55 | 0.29 | \ | 0.26 | 0.63 | 0.07 | 0.70 |
| 3.1 Competition–coexist | 2 | 0.03 | 0.75 | 0.55 | 0.32 | 0.21 | 0.59 | 0.02 | 0.61 |
| 3.2 Competition–monopoly | 2 | 0.08 | 0.56 | \ | 0.33 | \ | 0.66 | \ | 0.66 |
| Recovery Strategies | Manufacturer’s Profit | TPR’s Profit | Environmental Impact: Collection Quantity | Economic Impact: Supply Chain Profits |
|---|---|---|---|---|
| Low | 3.2 Competition (manufacturer monopoly) | 2 Cooperation | 3.1 Competition (coexist) | 3.2 Competition (manufacturer monopoly) |
| Moderate | 3.2 Competition (manufacturer monopoly) | 2 Cooperation | 3.1 Competition (coexist) | 2 Cooperation |
| 2 Cooperation | 2 Cooperation | 3.1 Competition (coexist) | 2 Cooperation |
| Decisions | Conclusions | Managerial Insights |
|---|---|---|
| Modularity level | Cooperation recovery shows greater modularity effectiveness when the TPR is highly competitive. | The manufacturer can counter external threats from the TPR by modifying the level of product modularity to discourage the TPR’s entry. It can also collaborate with a powerful TPR by increasing its investment in product modularity, like Fairphone. |
| TPR’s impact | Competition between the manufacturer and TPR leads to lower profits, reduced modularity levels, and diminished overall supply chain profitability compared to a centralized scenario. However, it consistently results in higher collection quantities. | The presence of TPRs can enhance resource circulation. Governments can offer subsidies to TPRs and assist the formal sector in disassembling functional components. |
| Recovery strategy selection | For less competitive TPRs, the manufacturer should adopt a competitive monopoly recovery strategy by heavily investing in high modularity to deter TPR entry. Otherwise, intense competition may force the manufacturer to collaborate with the TPR. | Outsourcing the collection process and collaborating with established TPRs such as TES, iFixit, and Caterpillar. The manufacturer must strike a balance between profitability and collection targets when managing different TPR capacities. |
Disclaimer/Publisher’s Note: The statements, opinions and data contained in all publications are solely those of the individual author(s) and contributor(s) and not of MDPI and/or the editor(s). MDPI and/or the editor(s) disclaim responsibility for any injury to people or property resulting from any ideas, methods, instructions or products referred to in the content. |
© 2024 by the authors. Licensee MDPI, Basel, Switzerland. This article is an open access article distributed under the terms and conditions of the Creative Commons Attribution (CC BY) license (https://creativecommons.org/licenses/by/4.0/).
Share and Cite
Lai, X.; Wang, N.; Jiang, B.; Jia, T. Choosing Recovery Strategies for Waste Electronics: How Product Modularity Influences Cooperation and Competition. Sustainability 2024, 16, 9035. https://doi.org/10.3390/su16209035
Lai X, Wang N, Jiang B, Jia T. Choosing Recovery Strategies for Waste Electronics: How Product Modularity Influences Cooperation and Competition. Sustainability. 2024; 16(20):9035. https://doi.org/10.3390/su16209035
Chicago/Turabian StyleLai, Xuxin, Nengmin Wang, Bin Jiang, and Tao Jia. 2024. "Choosing Recovery Strategies for Waste Electronics: How Product Modularity Influences Cooperation and Competition" Sustainability 16, no. 20: 9035. https://doi.org/10.3390/su16209035
APA StyleLai, X., Wang, N., Jiang, B., & Jia, T. (2024). Choosing Recovery Strategies for Waste Electronics: How Product Modularity Influences Cooperation and Competition. Sustainability, 16(20), 9035. https://doi.org/10.3390/su16209035