Article

Constituents over Correlation: Indicators and Arctic Urban Decision-Making

by
Jacob D. Tafrate
1,*,
Kelsey E. Nyland
1 and
Robert W. Orttung
2
1
Department of Geography and Environment, George Washington University, Washington, DC 20052, USA
2
Sustainability Research Institute, George Washington University, Washington, DC 20052, USA
*
Author to whom correspondence should be addressed.
Sustainability 2024, 16(20), 9033; https://doi.org/10.3390/su16209033
Submission received: 2 September 2024 / Revised: 16 October 2024 / Accepted: 16 October 2024 / Published: 18 October 2024

Abstract

:
Arctic city mayors influence municipal sustainability outcomes, navigating decisions on waste management, social service funding, and economic development. How do mayors make these decisions and to what extent do they integrate sustainability indicator data? Interviews with the mayors of Fairbanks, Alaska, Yellowknife, Canada, and Luleå, Sweden, revealed indicators are used on a case-by-case basis to track trends but lack systematic integration into decision-making. Constituent concerns drive agendas rather than indicator trends. Based on International Organization for Standardization (ISO) guidelines, 128 indicators grouped into 19 sustainability themes were compiled from 2000 to 2019 for the study cities. Partial Least Squares Structural Equation Modeling (PLS-SEM) was applied to examine the utility of ISO indicators as a guiding factor for sustainability trend tracking, identifying key themes for each city. Results show that indicator trends are too inconsistent and interconnected to be useful as an independent form of guidance for mayors. For Arctic municipalities, sustainability indicator datasets are useful in specific circumstances, but they do not provide the same kind of decision-making heuristic that mayors receive from direct constituent interaction. Findings emphasize the importance of more robust data collection and the development of management frameworks that support sustainability decision-making in Arctic cities.

1. Introduction

New technologies and open databases have ushered in a novel age of increasingly accurate spatial and temporal data available for policy-makers to track economic development, environmental health, and social progress. As a result, a variety of scholarly efforts and policy initiatives are interested in how these data can be utilized best to provide meaningful and actionable information to municipalities, private organizations, and citizens [1,2]. In the Arctic, municipal decision-makers face an array of unique sustainability challenges such as remoteness, resource dependent economies, extreme cold, and intensified rates of climate warming compared to the global average [3,4,5]. At the center of these interactions, Arctic cities find themselves managing both the direct impacts on urban infrastructure and the political ramifications of internal climate migration from remote villages to northern urban centers [6,7]. Arctic cities, often overlooked in global urban sustainability studies, offer unique perspectives on sustainability outcomes in extreme environments subject to imminent climate change impacts. Despite the smaller populations of Arctic cities compared to lower-latitude urban centers, these localities serve critical administrative, financial, and infrastructural hub roles for their surrounding region and communities [8]. Studying Arctic cities advances broader understandings of sustainability due to their unique exposure to rapid climate warming, remoteness, and historically unsustainable economies [9,10].
Arctic policy-makers are increasingly eager to leverage sustainability datasets in support of their decisions. For example, in summer 2023, Mayor Rebecca Alty of Yellowknife in the Northwest Territories shared that her city possesses an abundance of data, but they would need to “turn it into a story” for policy-making. While municipalities have access to large sustainability datasets, city offices typically lack the specialized skill sets and advanced technology necessary to effectively utilize these data [1,11].
To support Arctic policy-makers, this mixed-method study tracks urban sustainability trends to develop novel strategies to meet the challenges of rapidly changing Arctic environments and economies [5,12,13,14]. This work was conducted in collaboration with three Arctic mayors from (1) Fairbanks North Star Borough (NSB), Alaska; (2) Yellowknife, Canada; and (3) Luleå, Sweden, and these three cities serve as case studies for our analysis. The mayors described sustainability indicator data application techniques within their municipalities and identified barriers to the further integration of indicators into decision-making processes. The mayors were provided a summary of 20-year (2000–2020) trends for ISO 37120 indicators using Partial Least Squares Structural Equation Modeling (PLS-SEM). The themes highlighted in the modeling were compared with the most salient sustainability factors that the mayors identified. The Discussion section considers the benefits and drawbacks of employing indicators to track sustainability, explores the potential utility of PLS-SEM applications, and provides recommendations for Arctic policy-makers interested in urban sustainability monitoring. Through collaboration with study city mayors, we present a successful example of community-engaged research to identify how mayors use data in their decision-making processes.

2. Literature Review

The proliferation of sustainability indicators as a valuable tool for monitoring urban areas resulted from suggestions proposed by the United Nations (U.N.) after the Rio Earth Summit in 1992 to develop better mechanisms for tracking progress related to sustainability [15,16,17,18]. Today, the United Nations Sustainable Development Goal (SDG) indicators and the International Organization for Standardization (ISO) 37120: Sustainable Cities and Communities are among the most popular globally focused indicator sets. The SDGs and ISO 37120 overlap in capturing many common sustainability themes, such as environmental health, economic prosperity, and social progress, but differ in geographic focus, quantity of indicators, and data collection methods [19].
The UN SDGs have been adopted by all 193 member states [20]. The SDGs comprise 17 goals and 169 targets [21,22]. They build on the Millenium Development Goals (MDGs) as a way to measure both advances and bottlenecks in efforts for sustainable development. The SDGs are an advance on the MDGs because they are universal for all countries, have resulted from a transparent and inclusive development process, are comprehensive in their ambition, and are interconnected in the sense that real progress requires working across all 17 domains [23].
In contrast to the SDGs, the ISO 37120 focuses exclusively on cities. It incorporates 128 indicators divided into 19 themes (Figure 1) [24]. Approximately 100 cities spanning 35 countries have implemented this indicator set and report their data to the World Council on City Data in order to be certified. Within each theme, indicators are divided into three classes: core, supporting, and profile indicators. Core indicators are considered necessary to measure the performance of a city in each area. Supporting indicators are recommended and dependent on city objectives. Profile indicators provide background baseline information on the city. For example, within the theme of economy, unemployment rate is a core indicator, youth unemployment rate is a supporting indicator, and average household income is a profile indicator.
This study employs the ISO 37120 indicators because of their specific use at the city scale, stated ability to apply to all cities regardless of size or location, and ability to leverage measures city governments are already likely collecting [25]. In contrast, the UN SDG indicators have demonstrated significant gaps in geographic coverage disaggregation level, and methodological consistency, limiting their usability in Arctic municipal application [26]. The ISO 37120 standard also faces criticism for failing to explicitly define theoretical foundations and employing a cumbersome and excessive quantity of indicators which limit municipal application [8,27]. The ISO does not set targets or thresholds defining sustainability success based on indicator values. Rather, its authors claim the process of sustainability measurement alone enables cities to attract investment, localize UN SDGs, and facilitate knowledge exchange among cities [28]. This model can best be understood through its stated intention not to introduce new indicators, but to establish standardized methods of measuring key variables already collected by municipalities. This process then facilitates a network of participating cities promoting comparison and knowledge sharing [29].
In the Arctic, sustainability indicator research has primarily focused on either the applicability of global indicator themes to Arctic cities, or the validity of region-specific indicators [8,30,31,32]. These studies have worked to address calls from the United Nations and Arctic Council to develop effective monitoring tools to better understand sustainability transitions driven by social, economic, and environmental change in the region [15,33,34].
However, a research gap persists regarding how policy-makers can best employ sustainability indicators, both universally and specifically in the Arctic [35,36]. Governing through the use of indicators can lead to improved outcomes by promoting efficiency in processing information, consistency in the application of data, transparency in the decision-making process, greater reliance on scientific authority, and overall evidence-based impartiality [37]. Proper use of indicators can increase human well-being [38]. However, although there are many benefits to using indicators, they ultimately are an attempt to apply simple quantitative measurements to a messy and complicated world. Critics have warned that metrics can be gamed so that they create perverse outcomes. For example, doctors who are judged by how many successful operations they perform may choose not to operate on the neediest patients who are unlikely to recover [39]. The result is that we often seem to live in an era of “mismeasurement, over-measurement, misleading measurement, and counterproductive measurement [40]” A fixation on metrics can facilitate overlooking what really matters, such as human poverty and suffering [41].
As more indicator data becomes available, understanding their application and impact on sustainability decision-making becomes increasingly essential. Most popular indicator sets seldom provide guidance on how to analyze data after collection, leaving policy-makers unsure of how to best implement these data into sustainability decision-making [42]. While numerous past studies have developed innovative methods and guidance on sustainability indicator use, they typically focus on a narrow case study and do not consider many of the data limitations local governments face [43]. This paper contributes to the literature by addressing the practical and theoretical implementation of sustainability indicators, offering new insight into how sustainability decisions are shaped within cities, and provides applied guidance for sustainability practitioners in the Arctic.

3. Materials and Methods
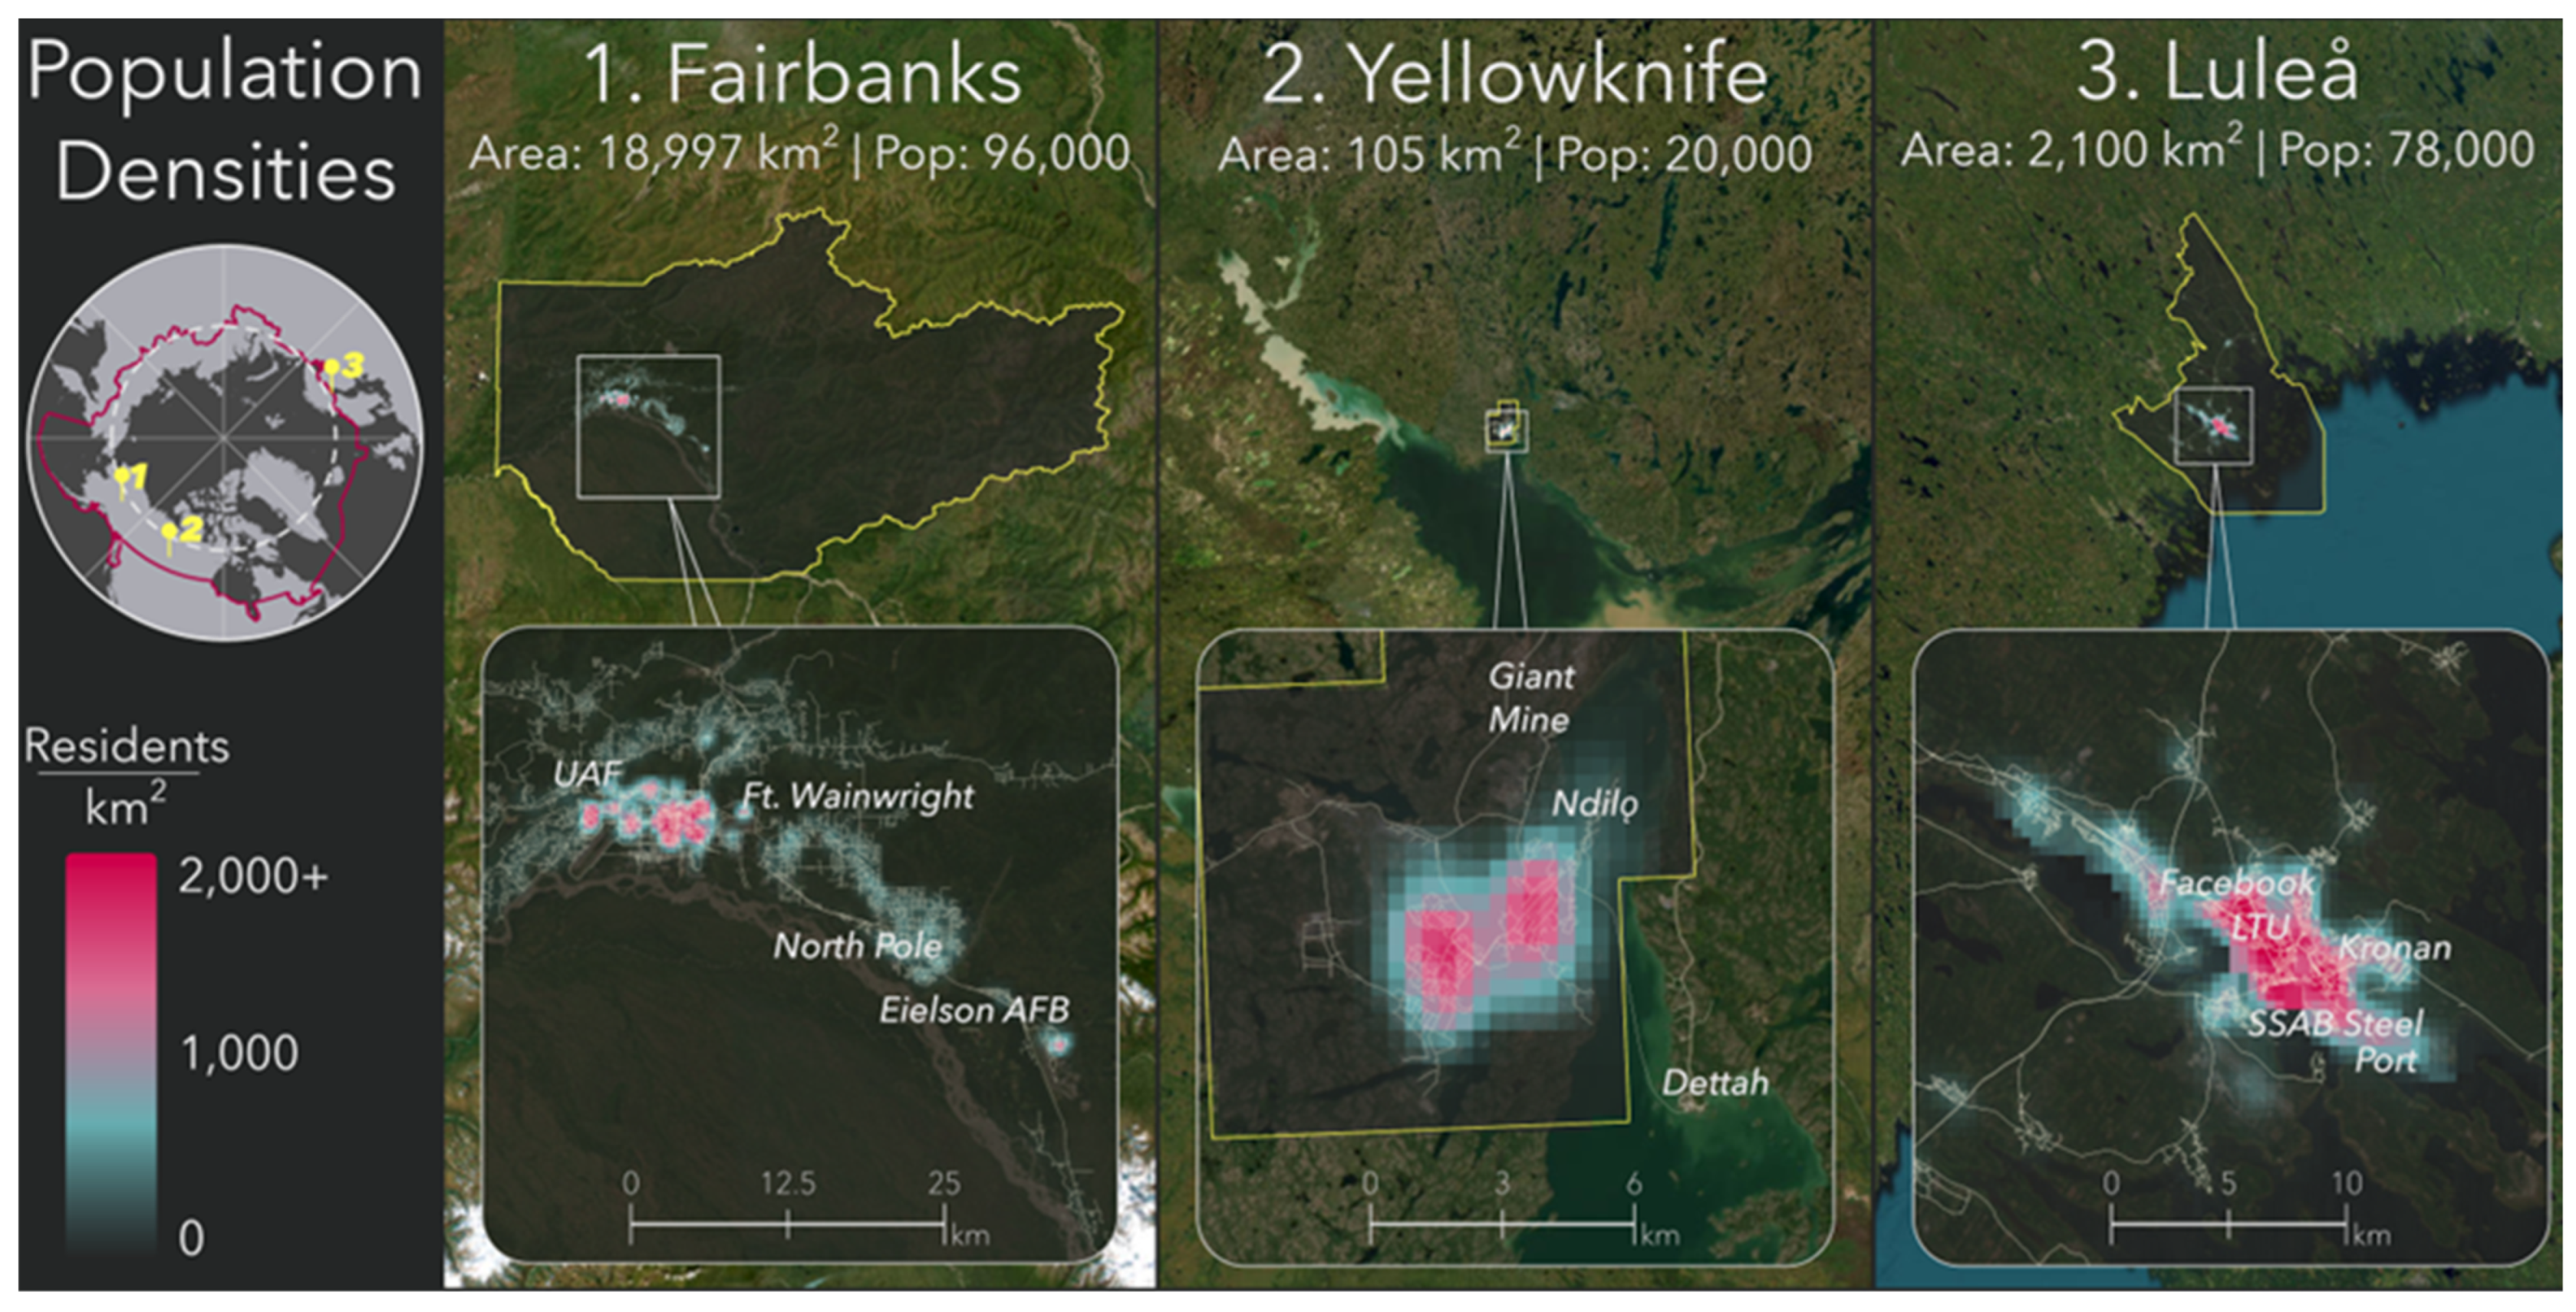
3.1. Study Areas

Fairbanks, Yellowknife, and Luleå were selected as case study cities to represent the diversity of governance structures, geographies, and demographics present in Arctic cities (Figure 2). Each study city is represented by one elected mayor, identified in Figure 2. Prior work recognized varying levels of reliance on fossil fuel extraction, impacts of tourism, and university integration in each city resulting in diverging sustainability outcomes, where operations in Luleå were considered more sustainable compared to the North American counterparts [44,45]. Additionally, all three urban centers serve as strategic points for their respective nations’ northern territories and share similar resource-driven settlement histories. Fairbanks North Star Borough is the northernmost city in Alaska and the third-largest settlement in the state after Anchorage and the capital, Juneau. Yellowknife and Luleå are both the largest settlements and designated capitals (respectively, of the Northwest Territories and Norrbotten County).
Situated just south of the Arctic Circle, these cities share cold continental climates according to the Köppen–Geiger climate classification scheme. Fairbanks and Luleå (Dfc) receive on average more precipitation than Yellowknife (Dsc) which experiences a summer dry season [46]. The selected municipalities differ significantly in area, ranging from 105 km2 (Yellowknife) to nearly 19,000 km2 (Fairbanks North Star Borough), as seen in Figure 3. Notable features and landmarks for each city are highlighted to demonstrate the impact of industry, militarization, and Indigenous communities on modern settlement patterns. Populations range from around 20,000 in Yellowknife to 96,000 in Fairbanks North Star Borough, but the three urban cores have similar maximum population densities, ranging only from 1700 to 2200 residents per km2 (Figure 3). Compared to Yellowknife, Fairbanks and Luleå both exhibit more sprawling development and greater road networks.
Points of interest in Figure 3 demonstrate the impact of industry, militarization, and Indigenous communities on modern settlement patterns across the three study cities. In Fairbanks, military operations and the University of Alaska Fairbanks (UAF) drive economic growth and immigration. A total of 19% of Fairbanks residents are military personnel or dependents with approximately 10% of residents affiliated with UAF [48,49]. The Giant Gold mine in Yellowknife attracted significant settler populations while leaving behind a toxic legacy of arsenic pollution [50]. Pollution, settlement, and economic upheaval associated with resource extraction particularly impacted the neighboring First Nations communities of Dettah and Ndilǫ with residents suffering from disproportionate homelessness [51,52]. Accessible via sea, air, rail, and road, Luleå is more interconnected than Fairbanks and Yellowknife. The SSAB Steel Port historically integrated the city with European iron and steel markets with Luleå currently positioning itself as a northern technology hub attracting large companies like Meta (Facebook), cryptocurrency mining, and developing local expertise through Luleå Technical University (LTU) [53].
Sustainability planning and measurement are shaped by these divergent physical and legal jurisdictions in each municipality. In Fairbanks, the 2018 North Star Borough Sustainability Plan orients efforts around food security, energy security, and waste reduction using eight indicators to track progress [54]. In 2023, a Climate Action and Adaptation Plan was proposed, but faced unanimous rejection by the municipal assembly [55]. After elections brought in new members, the Assembly approved a revised plan in June 2024. Yellowknife is the only municipality to collect ISO 37120 sustainability indicator data; however, these data were not well integrated into municipal decision-making. Rather, sustainability is incorporated into various city bylaws and plans, exemplified by a target of 30% community GHG emissions reductions in 2025 from 2009 levels as part of the new Corporate and Community Action Plan [56] (p. 3). In lieu of local sustainability plans, the Swedish parliament has determined a goal of net-zero emissions for 2045 and major industrial projects in Luleå are expected to support this national goal. Compared to Fairbanks and Yellowknife, Luleå has more limited sustainability decision-making autonomy, yet is one of the most successful Arctic cities in promoting a diverse knowledge-based economy, scoring highly on global indicator standards.

3.2. Sustainable Cities and Communities (ISO 37120) Data Collection

The ISO publishes precise definitions and detailed instructions for the calculation and interpretation for all ISO 37120 indicators [57]. Indicator data were collected for the three study cities from 2000 to 2020 through a series of “Datathons”. Datathons crowdsource student project participants with disparate backgrounds to gather data and peer-review work in real time, a demonstrated means to produce more reliable and replicable data collection [58,59]. Data were compiled from municipal or federal reports and statistical tracking systems, primary source gray literature, and through direct contact with municipal departments. In the case of missing or unavailable data, county or state data were referenced if deemed appropriate. Descriptive statistics were calculated for each indicator using simple linear regression to assess the significance of temporal trends.

3.3. Mayor Interviews and Participatory Observation

Three-week site visits were made to each study city by an interdisciplinary project team of approximately 20 researchers and the project advisory board, composed of the three study city mayors. In each study city, the acting mayor, identified in Figure 2, served as a point of contact for collaboration. During these visits the project team held semi-structured interviews and round-table discussions with NGOs, municipal, county, and state officials and personnel in attempts to resolve missing data and contextualize indicator values. Mayors were extensively interviewed both collectively and individually to provide contextual information regarding indicator usage and identify sustainability themes most critical to their operations. During the final interview, each mayor was asked to select on a printed sheet of paper the ISO 37120 themes they felt were most relevant to understanding sustainability in their city and then presented with PLS-SEM results for comparison. Interviews were recorded with verbal permission and later transcribed in accordance with Institutional Review Board exemption stipulations. Key quotes were identified for each city and organized into three broad categories based on perceived interest from the elected officials: (1) indicator selection, (2) trends and key ISO 37120 themes, and (3) data quality and analysis.
Participatory observation and community engagement in each city centered on volunteering with municipal and civil society organizations including litter clean up, volunteering with community gardens, homeless transit services, local food shelters, and contributing to public art installations [60]. These experiences provided critical insight into how sustainability policies are made and implemented from perspectives not traditionally captured through data points alone. Field visits also situated each city within its regional framework and contextualized place-specific challenges and opportunities. While in Alaska, in addition to the time spent in Fairbanks, researchers drove to Ester, Fox, North Pole, and Prudhoe Bay. In the Northwest Territories, a week was spent in Inuvik to attend the 2023 Arctic Development Expo and Tuktoyaktuk was also visited. In Norrbotten, researchers visited Kiruna and Jokkmokk.

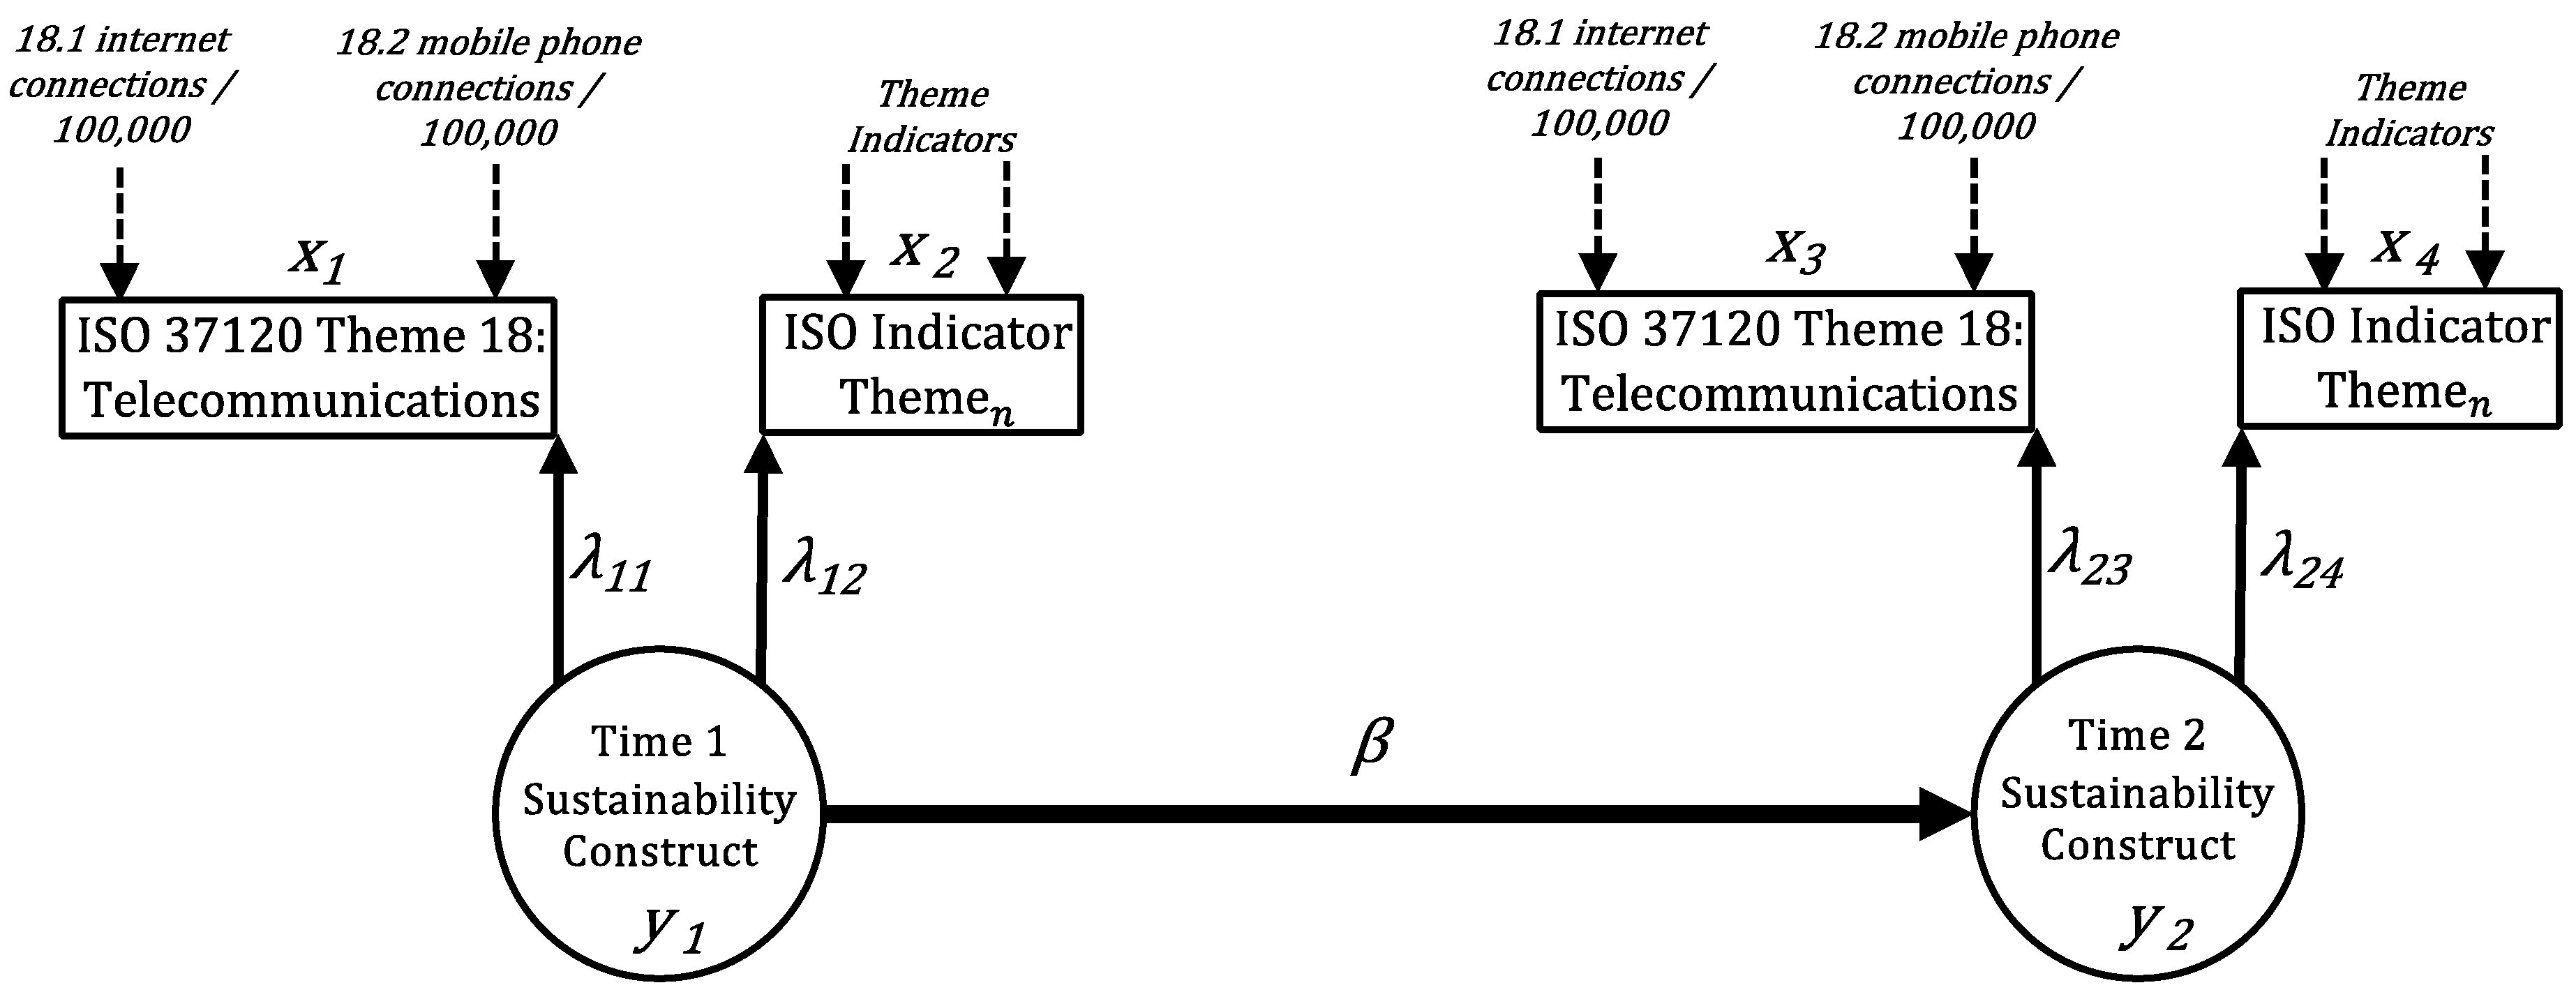
3.4. Partial Least Squares Structural Equation Modeling (PLS-SEM)

Because mayors expressed interest in better understanding interactions among sustainability indicators and trends over time, we selected PLS-SEM as an appropriate exploratory statistical method for our ISO 37120 dataset [61]. This technique integrates elements of principal component analysis and multiple regression, allowing for the exploration of complex relationships among thematic areas and their corresponding indicators through iterative estimations of internal and external correlations [62,63]. PLS-SEM is an increasingly popular tool to explore relationships between latent variables not capable of direct measurement and their directly measured indicators [64]. Compared to traditional regression models that assume independence among variables, PLS-SEM accommodates the interrelated nature of sustainability indicators. PLS-SEM models can assess which indicator themes capture substantive trends and relationships over time while accommodating small and non-Gaussian samples present in the ISO 37120 datasets [65,66,67]. In structural equation modeling, each ISO indicator can be thought of as a puzzle piece representing different hyper-specific components of sustainability, where the pieces combine to form distinct features which only together complete a cohesive image. Instead of analyzing individual ISO indicator trends, this method facilitates the statistical completion of the puzzle to assess which indicator themes are most important in each city and how they influence sustainability over time. Using this method, we aim to test the applicability of statistical techniques on ISO 37120 data, provide mayors with a clearer understanding of the quantitative trends representing their city, and compare modeled results with mayoral experience.
In PLS-SEM models, individual ISO indicators make up the specific measures for indicator themes which come together to reflectively measure change in urban sustainability (Figure 4). In this conceptualization, sustainability exists in an absolute theoretical sense where changes in holistic sustainability conditions are reflected by the indicators rather than directly caused by them [68]. Here, sustainability operates not simply as an amalgamation of certain ISO themes such as finance, wastewater, and telecommunication but is treated as a robust theoretical construct dependent on certain themes to uncover and understand its various manifestations. Using this technique, the influence of indicator themes on the holistic sustainability construct and the effect of overall sustainability from one time point to another are scored. These outputs provide an empirical basis for determining which ISO themes best measure changes in urban sustainability in the Arctic.
Because ISO indicators are represented at different scales, cross-indicator comparison using PLS-SEM is not possible with raw values. To account for these differences, all input indicators were ratio scaled from one to ten to limit information loss and avoid negative values associated with z-score normalization [69]. With ratio scaling, effective direction—socially desirable increasing or decreasing trend—is indicator-dependent. Indicators with negative effective direction (e.g., ISO 37120 indicator 5.1: unemployment rate) were inverted to make values approaching 10 representatives of more desirable states. The result is that the year with the best measure is given a score of ten and the worst a one. Next, the mean value across four sequential five-year intervals were taken, t1–4 (2000–2004, 2005–2009, 2010–2014, and 2015–2019) to compensate for any missing years of data. After this normalization process each indicator has a value ranging from one to 10 for each time facilitating direct comparison.
Longitudinal PLS-SEM path models were developed for each study city in SmartPLS software (Version 4.0) [66,67,70]. City models are composed of both measurement (λ) and structural models (β) (Figure 4). The measurement model assesses the quality of indicators (x) making up the sustainability construct (y) encapsulating sustainability relations over time. City measurement models were assessed using standard metrics (1) outer loading criterion, (2) convergent validity, (3) internal consistency, (4) composite reliability, and (5) discriminant validity [71]. Themes with factor loadings less than the standard threshold, 0.7, for all time periods were removed from city models [72]. Convergent validity was assessed using the average variance extracted (AVE). If lower than the AVE threshold, 0.5, [71,73] for more than one period, indicator themes with the lowest average outer loadings were iteratively removed to achieve acceptable convergent validity values for three of four time periods. Internal consistency of models was tested using Chronbarch’s alpha, where exploratory research values are expected to exceed 0.6 [71]. Composite reliability was assessed using rhoA, where values > 0.7 are acceptable [74]. Lastly, discriminant validity was measured using the conservative heterotrait–monotrait ratio of correlation criteria (HTMT), where generally acceptable values are <0.9 [75]. Once the measurement models were in adherence to the above criteria, city structural models were evaluated using the path coefficient (β), R2, and effect size from the bootstrapping procedure and Student’s t-test to verify significance when applicable [72]. Path coefficients in the outer model range from −1 to +1 where a path coefficient of 0 indicates a random relationship, and ±1 demonstrates a strong positive/negative relationship where sustainability at one time heavily influences outcomes at a subsequent period. Path coefficients approaching +1 signal either expected improvement and/or consistency in sustainability as measured across time. If the relationship is significant, a meaningful change and consistent relationship exists.
Figure 4. Conceptual PLS-SEM model for urban sustainability, where x1–4 represent the measured sustainability theme, y1–2 is the sustainability construct, λ is the factor loading, and β is the path coefficient. Adapted from [66] (Figure 1) and [76] (Figure 1).
Sustainability 16 09033 g004

4. Results

4.1. Sustainability Indicator Use in Practice

We start with our strategic plan. I guess we start with the anecdotal. What do residents keep asking about? […] Once we have our strategic plan, we need to be able to measure success. Then we look for indicators to help in that way. It is probably the backwards way, but it is how we lay people do it. Not looking at the data and the research first, but the anecdotal.
(Mayor Alty, 20 June 2023)
Presented quotes are selected from two interviews which occurred during June 2023 in Yellowknife, Canada. We interviewed Fairbanks North Star Borough mayor Bryce Ward and Luleå mayor Carina Sammeli together for approximately 50 min on 6 June. On 10 June, Yellowknife mayor Rebecca Alty was interviewed for 45 min. Each mayor was asked an identical series of six open-ended questions related to the incorporation of sustainability indicators into municipal planning in their city while also directly selecting key ISO 37120 themes. Interviews were then hand-transcribed, totaling 6422 and 4083 words.
These discussions revealed that across-the-board sustainability indicators are siloed and excluded from day-to-day decision-making processes. Furthermore, ISO 37120 is not utilized in any consistent and systematic capacity, even in Yellowknife which has achieved official World Council on City Data platinum certification [77]. Instead, these study cities typically default to using national- or regional-level governance indicator tracking, such as Statistics Sweden, Statistics Canada, or the U.S. Census, to compare themselves to other entities at the national level.
While data are referenced to explore trends in communities, in each city, policies are primarily driven by financial and political factors related to direct constituent concerns and/or national goals. In Fairbanks, Mayor Ward was clear that, “When we think about sustainability it is driven by the cost to the taxpayer”. This was a sentiment shared by Mayor Alty who stated that, “when it comes to everyday decision-making […] it is the financial impact and legislative considerations”. In Luleå, Mayor Sammeli also expressed how constituent demand and legal jurisdiction focus her planning on education, since it is the primary responsibility of the city government.
Mayors are limited by two main factors when trying to integrate indicator data into decision-making: (1) data quality and (2) lack of comparability. In smaller Arctic municipalities, minor changes and even errors in the data often resulted in major impacts hindering comparison between different time periods. For example, indicator data for homelessness in Yellowknife were collected based on point-in-time counts where a single count of homeless individuals on a given day represented the amount of homelessness for the entire year, producing significant annual variability. Mayor Alty expressed frustration that “they keep changing how they gather the data so we can’t really analyze [it]. So, homelessness went down, well that one year they didn’t go to the shelter. You missed 100 people. Actually, we probably significantly increased”. This reticence to trust indicator data was shared by Mayor Sammeli saying, “The difficult part is, what is good data? If I use what is available maybe it is wrong. They could have measured wrong”. When data were collected reliably, it often occurred within different branches of the municipal office with incongruent measurement standards, making integration as part of a sustainability framework challenging. Mayor Ward shared that each department has their own data collection system and that bridging collection techniques has been nearly impossible. Additionally, the indicators collected at the municipal level are primarily determined by state and national policies which can result in shifting indicator sets as national priorities and administrations change.
The mayors were clear that indicators were more likely to be employed when the data were directly comparable across space and time and could be used to tell a meaningful story. In Luleå, a comparative database for all Swedish municipalities was highlighted as a successful example of indicator data being incorporated to track progress. In Fairbanks NSB, geospatial data have been “particularly powerful to look at change in policy and change in practice”. For Yellowknife, ISO data collection has not been used since personnel in the office are not yet able to turn it into a compelling story. However, Statistics Canada and NWT Statistics are often integrated into city planning decisions related to land use and permitting. These examples highlight that Arctic municipalities do utilize indicator data for targeted comparisons when confident about their quality. However, in each instance when indicators were used, they operated within the national framework, comparing Arctic cities to other national entities limiting opportunity for circum-Arctic urban comparison.

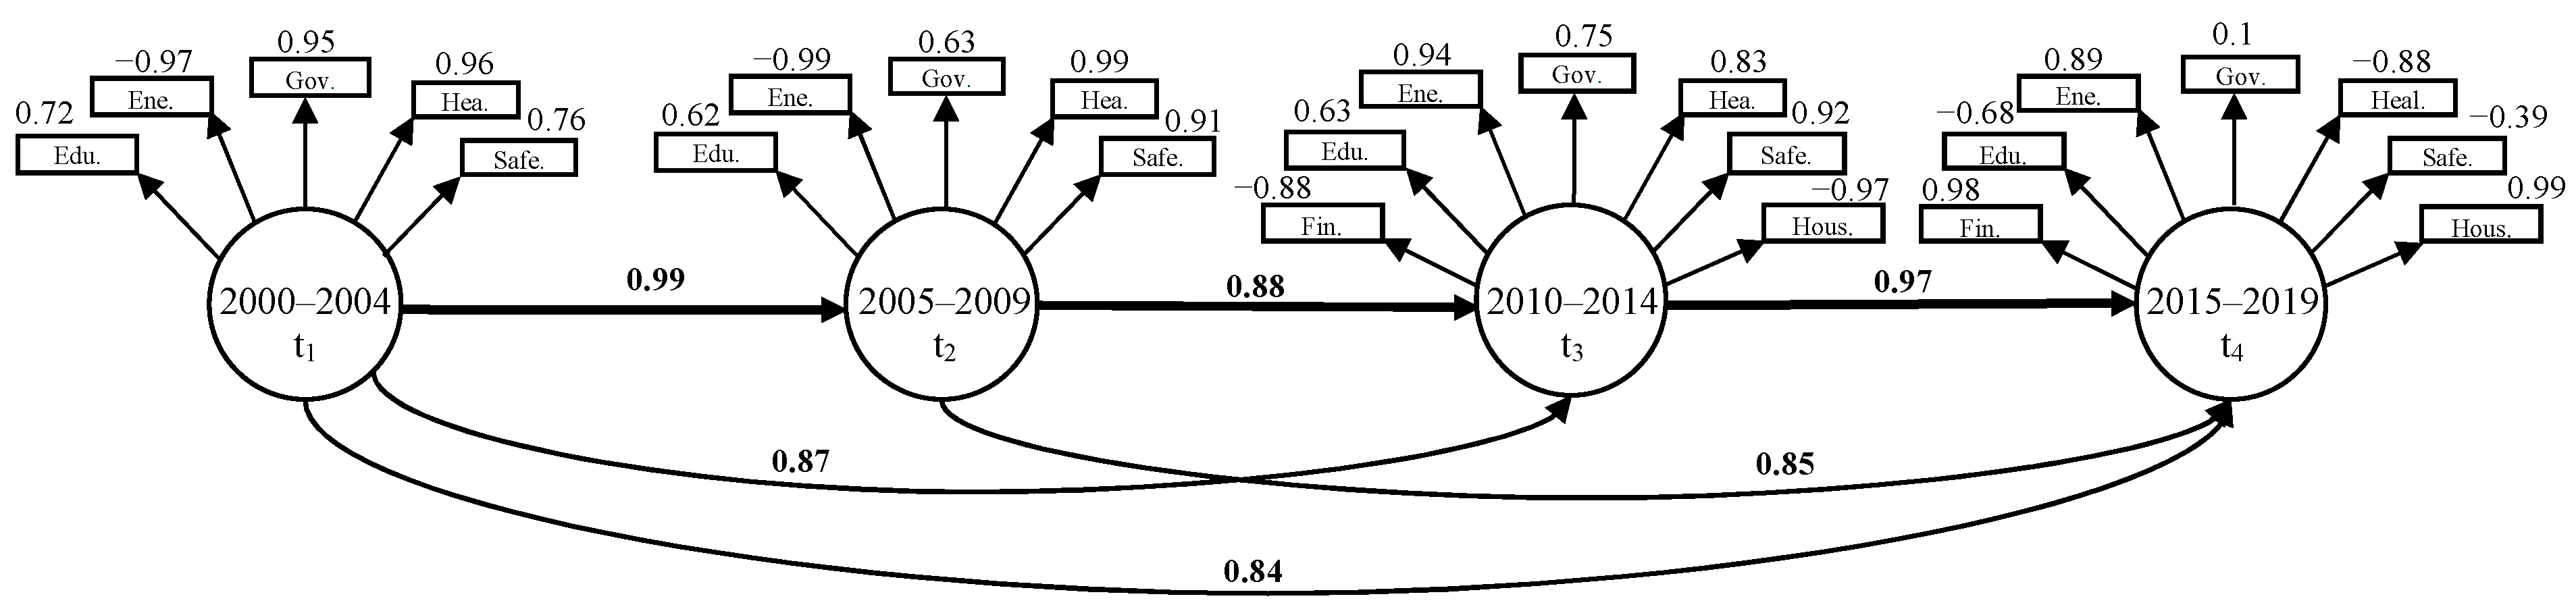
4.2. Modeling Sustainability with PLS-SEM

Partial Least Squares Structural Equation Modeling (PLS-SEM) facilitated the integration of multiple sustainability indicators in one model to identify ISO 37120 themes that form the strongest statistical construct for sustainability measurement in each city and explore temporal trends. The influence of ISO 37120 themes on the sustainability construct is explained by the factor loading value. High positive factor loadings indicate a positive association, suggesting that as sustainability levels increase, corresponding themes (e.g., economy, education, housing) also tend to improve. Conversely, negative relationships imply a decline in associated themes as the sustainability construct also improves. For example, a negative relationship between sustainability and housing suggests potential adverse effects on housing conditions or availability as overall sustainability increases in the city. Values close to zero represent minimal influence on the sustainability construct, and themes with consistent values below the threshold of 0.7 were not retained in the final models presented. Temporal trends between the sustainability constructs are represented by path coefficients which signify the strength and direction that sustainability at one point in time has on overall sustainability at a future time point. Positive path coefficients demonstrate that an improvement in the sustainability construct at the first point in time is associated with an increase in sustainability at the subsequent time point. If the path coefficient is significant, a consistent and robust relationship has been found. Conversely, insignificant paths indicate the associate relationship is weak and no meaningful temporal trend between constructs is detected, signaling no improvement or worsening in sustainability overall between time periods.
In each city model, energy, finance, and health are retained as meaningful measures driving sustainability outcomes with high factor loading values. Across all models, temporal sustainability trends are consistently represented by high path coefficient values. In each case, path coefficients were highest between temporal neighbors (e.g., t1t2) and decreased as the relationship became less direct while always remaining positive (e.g., t1t4).
In Fairbanks NSB, education, energy, governance, health, safety, finance, and housing indicator themes presented the highest factor loading values and are recommended themes for understanding sustainability measurement in the city (Figure 5). Finance and housing were not included in t1 and t2 due to a lack of data availability but were represented in t3 and t4. Discriminant validity was partially established between t1t3 (0.853) and t1t4 (0.891). Internal consistency of the model did not satisfy standard assessments. All path coefficient values were considered high with the strongest path coefficients present between neighboring time increments; however, none were statistically significant (p-values 0.05). Relatively high percentages of variance explained in each time by the preceding period are represented by R2 values: t1t2 (0.98), t2t3 (0.77), t3t4 (0.94).
The economy, energy, finance, health, and housing formed the best measure of sustainability in Yellowknife. Composite reliability was fully established for the Yellowknife model. Seen in Figure 6, convergent validity was satisfied for t1–3 and just below acceptable levels for t4 (0.42). Internal consistency was satisfied during t3 but failed during the remaining time periods. Discriminant validity establishment failed based on HTMT values. Path coefficients were consistently characterized by high values across all construct connections, often approaching one for neighboring time periods, but none demonstrated significance. Sustainability constructs exhibit substantial R2 coefficients, indicating strong explanatory power where one construct’s variance is effectively accounted for by its counterpart at an earlier time: t1t2 (0.91), t2t3 (0.82), and t3t4 (0.87).
Sustainability in Luleå was best measured by education, the economy, energy, finance, health, and water (Figure 7). Composite reliability across the model was fully established. Convergent validity was mostly satisfied, except for t4 (0.44). The model faced internal consistency and discriminant validity challenges with values below the accepted thresholds. Path coefficients approached +1, with t1t2 representing the only statistically significant relationship. R2 values across time are all high where variance in a later construct is well explained by the earlier period: t1 → t2 (0.88), t2t3 (0.92), t3t4 (0.88).

4.3. Comparing Mayor Responses with Modeled Results

During interviews, each city mayor was asked to directly identify the ISO 37120 sustainability themes they deemed most relevant to municipal planning and measurement. These results are compared with those identified through measurement model factor analysis with individual indicator trends also shown for highlighted themes (Figure 8). Within identified themes, individual ISO 37120 indicator trends were analyzed using simple linear regression models. These tests were performed on the raw data without normalization or effective direction correction. Significant trends are presented with significance level denoted by asterisks and trend directionality signaled by the up and down arrows. The ISO themes of economy, education, energy, finance, health, and housing were all highlighted either by modeling or mayor input in each city. Of these, energy was the only theme to be emphasized both by modeling and mayors for Fairbanks, Yellowknife, and Luleå. Conversely, 26% of ISO indicator themes (sport and culture, telecommunications, transportation, urban planning, and wastewater) were deemed across the board to lack relevance to the Arctic cities being studied. PLS-SEM models accurately pinpointed 78% of sustainability themes identified by mayors, with 100% convergence in Fairbanks and Yellowknife. During this exercise, mayors were generally more likely to select a greater number of themes when compared to modeled sustainability constructs.
In Fairbanks, seven significant trends associated with improvement in urban sustainability were found, while four indicators showed trends corresponding to worsening conditions during the study period. The economy and safety both exhibited three significant trends for individual indicators. Average household income and the percentage commercial property value increased during the study period, while city product per capita decreased. In the safety theme, the number of firefighters and fire-related deaths increased but the number of police officers declined. Other notable indicator trends for Fairbanks include a declining number of households, improvement in both health indicators, and conflicting trends in education. In Yellowknife, four indicators exhibited trends indicating improvement, while two demonstrated significant trends toward unsustainable operations. Despite the total number of households increasing, the percentage of the population living in inadequate housing also increased. Both economic indicators signal improving economic conditions during the study period. Luleå presented the greatest quantity of significant individual trends, with 12 representing sustainability improvement and 9 associated with deterioration. Only in Luleå did the mayor consider population and social conditions a relevant theme and individual indicator trends exhibit a demographic shift with increasing non-citizen immigration and an aging population. Luleå is also the only study city with measurable decreasing greenhouse gas emissions based on ISO data. Across all individual indicators, interpretation is highly dependent on local conditions and political leaning. Additionally, many profile indicators related to demographic makeup presented statistically significant temporal trends but were not deemed to impact Arctic urban sustainability positively or negatively.

5. Discussion

5.1. Working with ISO 37120

PLS-SEM models provide a novel way to conceptualize and quantify the interactions between indicator themes and sustainability. However, due to model inconsistency, they are not recommended for municipal application. In applying statistical techniques to ISO 37120 indicator data, challenges identified by municipalities such as data quality and comparability limit the potential for successful quantitative analysis. Because of the complex conceptual nature of sustainability measurement and issues with ISO data quality, all models demonstrated insufficiencies with internal consistency, discriminant validity, and the absence of statistically significant paths between defined sustainability constructs [71]. Inconsistencies across models largely stem from variations in the number of indicators making up ISO themes, producing small and inconsistent sample sizes. In calculation, PLS-SEM disproportionately emphasizes themes with more indicators. Additionally, indicators within the same theme often exhibited opposite trends even after compensating for effective direction, limiting the reliability of themes as quantitative bins for the sustainability construct.
Field visits and mayor interviews unveiled that the most successful use of sustainability indicators occurs where data are contextualized through situated local knowledge of sustainability conditions based on legislation, marquee events, and sustainability planning with policy-makers and other stakeholders [78]. The mayors repeatedly expressed a desire for indicators to capture interesting and relevant stories, emphasizing the role data can play in enhancing municipal communications with national government officials and other stakeholders [79]. Study cities possessed an abundance of data collected either for ISO, or in many cases, for their state or national statistical survey, but lacked the in-house capacity to thoroughly analyze them and disseminate the results into effective policy decisions. Often indicators were unwieldy in quantity and based on frameworks which overlook specific Arctic urban challenges. The mayors and personnel in their offices were highly knowledgeable about what data existed but less informed about basic trends present in the data. Instead, their knowledge on key sustainability topics was based primarily around constituent concerns driving their agendas. Indicator data were seldom collected or analyzed as part of a cohesive sustainability framework, where instead indicators were siloed in different divisions and used to make arguments about singular issues rather than to present a picture of sustainability in the city. Furthermore, mayors repeatedly stressed how sustainability planning and indicator use is often constrained within budgetary and political concerns making long-term policies with short term costs to taxpayers unlikely to be implemented.

5.2. Sustainability Indicators for Arctic Cities

When combined with contextual knowledge drawing from discussions with mayors and other regional stakeholders, ISO 37120 indicators are useful in monitoring several key regional Arctic sustainability issues, such as the knowledge economy [80]. In Fairbanks, an interesting diverging trend can be observed with a declining percentage of students completing secondary education and an increasing number of higher education degrees per 100,000 people in the city. This is contextualized through challenges in public education funding within Fairbanks and successful initiatives to attract highly educated people to the city through the university and military [81]. A complex picture of education to support a knowledge economy is illuminated through the data where Fairbanks is increasingly reliant on outside expertise to fill higher-paying knowledge jobs and failing to support the growth of local talent through educational opportunities.
Of the study cities, Luleå exhibited the greatest number of indicators that significantly improved over the 20-year observation period compared to Fairbanks or Yellowknife (see Figure 8). These findings were corroborated by participatory observations, and other interviews where it was repeatedly noted that Luleå has had several housing projects, new businesses and industry, increased business investment, and growing population thanks primarily to international immigration [82,83]. Considering ISO indicator 7.2 (percentage of total end-use energy derived from renewable sources), a reasonable assumption is that differences between the European and North American Arctic contexts examined are due to Sweden’s national strategy to reach net zero emissions by 2045 [84]. Although the city of Yellowknife aims to increase the share of renewable energy use from 50% to 70% by 2025, measurable improvement towards this target is not observed in ISO data [56]. The Fairbanks sustainability plan urges growth in renewables but lacks supporting legislation to progress shares of renewable energy over the study period [44]. Indicators interpreted in context, such as the “percent of total end-use energy derived from renewable sources”, have potential to inform powerful understandings about the role of strong national leadership in setting and achieving ambitious urban sustainability goals [85].
All mayors identified housing as a key area which forms the foundation of sustainable planning within each municipality. Both Mayor Alty of Yellowknife and Mayor Ward of Fairbanks discussed housing and the unhoused population as a key concern within their respective city, whereas in Luleå, it is an important factor for facilitating desired growth. When looking at the individual indicators which demonstrated significant trends in Yellowknife, the percentage of the population living in inadequate housing (indicator 12.1) has been increasing. This trend supports research and reports focused on growing homeless populations in Yellowknife [51]. In Yellowknife, homelessness is a keystone issue and closely interrelated to legacies of colonialism and residential schooling in the western Canadian Arctic [86,87]. Indicator data can be utilized to demonstrate that major initiatives such as The Yellowknife Homelessness Coalition—formed in January 2000—and The Homelessness Assistance Fund, which began in August 2007, have not been successful in reversing the trend in homelessness in the city. Here, the data support criticism that the city government and territorial government lack sufficient dedicated personnel to address homelessness in a comprehensive manner and that funding remains far below required levels [86]. While the percentage of people living in inadequate housing in Fairbanks has not demonstrated a significant trend, the total number of households have declined as the number of persons per unit has increased. This challenge was described by Mayor Ward and corroborated by reports of housing inflation driven by a recent increase in military members stationed in Fairbanks NSB searching for off-base housing during the end of study period [88]. In Luleå, housing challenges are not felt as acutely, and homelessness is not a visible concern [89]. However, many housing indicators still exhibited significant trends with residential rental units as a percentage of total dwelling units in decline and the total number of households increasing. The increase in housing units here is well explained generally by a focus on new housing development to facilitate growth from a municipality of 80,000 to 100,000 residents. However, these developments were only taking place during the final period of the 20-year time series, explaining the lag in declining rental units.
Although a focused and contextualized application of ISO 37120 provides meaningful insights into Arctic cities, it is ineffective in capturing one of the leading concerns identified by study city mayors: climate change. Of 7500 cities globally, the top 100 cities expected to experience the highest rates of climate warming by mid-century are all located in the Arctic region [90]. Arctic cities face a myriad of climate and environment concerns from thawing permafrost, changing snow and ice conditions and duration, to increased wildfires [91,92,93,94]. The environment and climate change ISO indicator theme includes five air pollutants, noise pollution, protected lands, percent change in native species, and greenhouse gas emissions [20]. These indicators capture public health effects, but not other direct climate impacts on Arctic cities such as the dangers of extreme weather events, failing infrastructure, and more. As a result, ISO 37120 does not sufficiently measure Arctic environmental sustainability, and alternative frameworks should be employed (see [95]).
Another major limitation of ISO 37120 application in the Arctic is its inability to incorporate the perspective of Indigenous science and account for ongoing structural biases in these municipalities [96]. In Fairbanks and Yellowknife, Indigenous peoples are represented at significantly higher demographic rates than cities in the south, composing 10% and 23% of the population, respectively. In these cities, lived experiences across all realms of sustainability are divided between settler and Indigenous populations, where Indigenous groups face greater exposure and vulnerability to environmental toxins, higher rates of homelessness, and more limited economic opportunities [52,97,98]. To address this, Degai and Petrov argue, Arctic governments should incorporate Indigenous understandings of sustainability to promote northern development which empowers communities to define their own destinies amid the array of challenges they face [99]. These perspectives have been demonstrated to include, but are not limited to, ideas of reciprocity and connectivity between humans and nature through a multigenerational experience-based interpretation of healthy relationships within interrelated holistic systems [99,100]. Currently, ISO 37120 has no capacity to address diverging demographic trends and no specific Indigenous indicators, leading to erroneous assumptions about sustainability trends while isolating Indigenous stakeholders from the sustainability planning and measurement process.

5.3. Future Research Directions

Despite abundant literature on sustainability indicators and an expanding data pool, there is limited guidance on best practices to analyze these data. Calls for indicator performance measures are a persistent demand in indicator research [101]. For ISO 37120, in-depth guidelines exist for indicator calculation without any instruction on subsequent analysis. While PLS-SEM provides a novel and theoretically sound framework for understanding sustainability trends, all models presented issues limiting their reliability and validity, representing a significant limitation of this study [71]. Achieving more reliable results with PLS-SEM would necessitate a smaller subset of indicators, larger sample sizes, and consistent spatio-temporal collection techniques. The search for an optimal method for handling large sustainability indicator datasets remains an open question requiring further exploration and more rigorous data collection standards. Developing new methodologies for indicator evaluation would provide policy-makers with a better understanding of the importance of data collection and effective analysis techniques.
Across all study cities, mayors were productive participants, given their sustainability processes and decision-making knowledge. As democratically elected officials, these mayors represent the values of their constituents and offer wide-angle views of local discourse [102]. With the political and legal authority to implement research findings, mayors affect substantial change in their cities related to sustainability [103]. However, limiting factors such as electoral cycles, insufficient municipal resources, varying political beliefs, and conflicting understandings of sustainability produce incongruent indicator data collection and limited empirical analysis within the city government. Sustainability literature and corresponding indicators emphasize the importance of long-term trend analysis while mayors react to more immediate challenges and depend on timely results [104]. Future research should consider improved data integration into municipal processes, indicators capable of identifying change at shorter timeframes, and actionable vulnerability reduction measures.
In this study, mayors and models failed to select 26% of indicators as relevant to Arctic urban sustainability. Intensive data collection demands for indicators that lack local relevancy prevent wider application [61]. Of the 19 sustainability themes, only the economy, education, energy, finance, health, and housing were identified as relevant in all cities. Arctic cities interested in sustainability monitoring with indicators would benefit from a focused data collection for indicators within those six themes. Refining and regionalizing global sustainability indicators into locally relevant subsets is a promising avenue for future research, indicator development, and policy application.

6. Conclusions

This study employed a mixed-methods approach to identify how sustainability indicators are used within Arctic cities and explore new ways of analyzing indicator data to aid municipal decision-making. Twenty years of ISO 37120 sustainability indicator data were compiled and summarized using PLS-SEM modeling to capture and analyze relationships between indicator themes and sustainability outcomes across time. PLS-SEM modeling allowed for sustainability to be treated as a robust theoretical construct where indicators reflect and measure changes in each city. Modeled results were then compared with mayor Advisory Board responses about critical factors for sustainability measurement within their jurisdictions. Of identified themes, individual indicators were then assessed to uncover which indicators drove sustainability outcomes over the study period. Based on the integration of these results, (1) economy, (2) education, (3) energy, (4) finance, (5) health, and (6) housing are the most useful urban sustainability measurement themes within the global ISO 37120 framework for Arctic cities. For municipal policy-makers interested in beginning standardized indicator tracking, these themes offer a useful starting point for understanding and measuring progress towards Arctic urban sustainability.
Individual indicator trends were compared across cities and contextualized with local policies to provide a comprehensive picture of sustainability indicator use in the Arctic. While sustainability indicators were not found to be widely applied in Arctic cities, this work demonstrates their usefulness and discusses limitations related to climate change and colonial legacies in Arctic urban environments. Understanding how Arctic cities make decisions and incorporate data into the process provides a window into how key sustainability concerns are prioritized and framed at the city scale [105]. In all cities, mayors utilized indicators to better understand pressing issues identified by constituents and to provide benchmarks for city-scale comparison, often to their geographic urban neighbors. However, indicators struggle to comprehensively assess progress towards complex constructs such as sustainability with current data quality and consistency limitations. Future research related to urban Arctic indicators and ISO 37120 applications should consider how environmental indicators can be better tailored to local conditions and incorporate diverse and often divergent definitions of sustainability at a set geographic scale. As demonstrated through application of ISO 37120, indicators are strongest when complimented with local understanding and used to measure and track progress for stated municipal objectives.
For sustainability indicators to be further incorporated into day-to-day decision-making in Arctic cities, they must better address local concerns and be able to answer more pressing questions of whether these cities will be sustainable places for future generations in a rapidly changing Arctic. This issue should be confronted through the development of a more dynamic indicator set which incorporates Indigenous knowledge and considers future projections for climate impacts based on modeled data. This approach would complement current global indicator sets’ thorough accounting of regional conditions and would better develop our knowledge of the potential sustainability pathways for Arctic cities.
The advantage of global sustainability indicator projects like ISO 37120 in the Arctic may not lie in their ability to comprehensively quantify the intricate dynamics of Arctic urban sustainability, but their ability to promote the need for circumpolar data sharing. The Arctic, long characterized by limited sustainability data, typically sees data collected at the municipal level funneled upward to territory or state governments isolating information nationally. Collaborative efforts among Arctic cities using global indicator sets can connect national datasets, facilitating circumpolar information and knowledge flows. Better connecting historically isolated Arctic cities through circumpolar data and best practice sharing is a feasible and practical means of addressing many Arctic urban sustainability challenges.

Author Contributions

Conceptualization, J.D.T. and R.W.O.; methodology, J.D.T. and K.E.N.; software, J.D.T.; validation, K.E.N. and R.W.O.; formal analysis, J.D.T. and K.E.N.; investigation, R.W.O., K.E.N. and J.D.T.; resources, K.E.N. and R.W.O.; data curation, J.D.T. and R.W.O.; writing—original draft preparation, J.D.T.; writing—review and editing, K.E.N. and R.W.O.; visualization, J.D.T.; supervision, K.E.N.; project administration, R.W.O.; funding acquisition, R.W.O. and K.E.N. All authors have read and agreed to the published version of the manuscript.

Funding

This research was funded by the US National Science Foundation award RISE-2127364 to the George Washington (GW) University.

Institutional Review Board Statement

The George Washington University IRB determined this study to be exempt due to all interviews relating to participants’ professional public-facing capacity.

Informed Consent Statement

Not applicable.

Data Availability Statement

The original data presented in the study are openly available in [61].

Acknowledgments

We are grateful to GW undergraduate and graduate research assistants on the MUST project who assisted with the compilation of 20 years of ISO data for each city examined in this work. We also thank the participating mayors and many others for their engagement in this MUST project.

Conflicts of Interest

The authors declare that they have no known competing financial interests or personal relationships that could have influenced the work reported in this paper.

References

  1. Allen, C.; Smith, M.; Rabiee, M.; Dahmm, H. A review of scientific advancements in datasets derived from big data for monitoring the Sustainable Development Goals. Sustain. Sci. 2021, 16, 1701–1716. [Google Scholar] [CrossRef]
  2. Asokan, V.A.; Yarime, M.; Onuki, M. A review of data-intensive approaches for sustainability: Methodology, epistemology, normativity, and ontology. Sustain. Sci. 2020, 15, 955–974. [Google Scholar] [CrossRef]
  3. Esau, I.; Mikhail, V.; Marlene, L.; Martin, W.M.; Pavel, K.; Andrey, S.; Alexander, A.B.; Victoria, V.M. Warmer climate of Arctic cities. In The Arctic: Current Issues and Challenges; Pokrovsky, O., Kirpotin, S., Malov, A., Eds.; NOVA Publishers: Hauppauge, NY, USA, 2020; pp. 57–82. [Google Scholar]
  4. Larsen, J.N.; Huskey, L. The Arctic economy in a global context. In The New Arctic; Evengård, B., Larsen, J.N., Paasche, Ø., Eds.; Springer: Berlin/Heidelberg, Germany, 2015; pp. 159–174. [Google Scholar]
  5. Orttung, R.W.; Anisimov, O.; Badina, S.; Burns, C.; Cho, L.; DiNapoli, B.; Jull, M.; Shaiman, M.; Shapovalova, K.; Silinsky, L.; et al. Measuring the sustainability of Russia’s Arctic cities. Ambio 2021, 50, 2090–2103. [Google Scholar] [CrossRef] [PubMed]
  6. Manrique, D.R.; Corral, S.; Pereira, Â.G. Climate-related displacements of coastal communities in the Arctic: Engaging traditional knowledge in adaptation strategies and policies. Environ. Sci. Policy 2018, 85, 90–100. [Google Scholar] [CrossRef]
  7. Zamyatina, N.; Goncharov, R. Arctic urbanization: Resilience in a condition of permanent instability. The case of Russian Arctic cities. In Resilience and Urban Disasters; Borsekova, K., Nijkamp, P., Eds.; Edward Elgar Publishing: Cheltenham, UK, 2019; pp. 136–153. [Google Scholar]
  8. Berman, M.; Orttung, R.W. Measuring progress toward urban sustainability: Do global measures work for Arctic cities? Sustainability 2020, 12, 3708. [Google Scholar] [CrossRef]
  9. Vlasova, T.; Petrov, A.N.; Volkov, S. Rethinking sustainability monitoring in the arctic by linking resilience and sustainable development in socially-oriented observations: A perspective. Sustainability 2020, 13, 177. [Google Scholar] [CrossRef]
  10. Graybill, J.; Petrov, A. Introduction. In Arctic Sustainability, Key Methodologies and Knowledge Domains. A Synthesis of Knowledge, I; Graybill, J.K., Petrov, A.N., Eds.; Routledge: New York, NY, USA, 2020; 150p. [Google Scholar]
  11. Kitchin, R. The opportunities, challenges and risks of big data for official tatistics. Stat. J. IAOS 2015, 31, 471–481. [Google Scholar] [CrossRef]
  12. Poeltzer, G.; Wilson, G. Governance in the Arctic: Political systems and geopolitics. In Arctic Human Development Report: Regional Processes and Global Linkages; Larsen, J.N., Fondahl, G., Eds.; Nordic Councilof Ministers: Copenhagen, Denmark, 2014; pp. 185–222. [Google Scholar]
  13. Suter, L.; Schaffner, C.; Giddings, C.; Orttung, R.; Streletskiy, D. Developing metrics to guide sustainable development of Arctic cities: Progress & challenges. Arct. Yearb. 2017, 1–20. Available online: https://www.researchgate.net/profile/Dmitry-Streletskiy/publication/320453847_Developing_Metrics_to_Guide_Sustainable_Development_of_Arctic_Cities_Progress_Challenges/links/59e6b1eeaca2721fc227b28c/Developing-Metrics-to-Guide-Sustainable-Development-of-Arctic-Cities-Progress-Challenges.pdf (accessed on 10 October 2024).
  14. Wilson, G.N.; Fondahl, G.; Hansen, K.G. Governance for arctic sustainability. In Arctic Sustainability, Key Methodologies and Knowledge Domains; Graybill, J.K., Petrov, A.N., Eds.; Routledge: London, UK, 2020; pp. 83–104. [Google Scholar]
  15. Bell, S.; Morse, S. Sustainability Indicators: Measuring the Immeasurable? Routledge: London, UK, 2012. [Google Scholar]
  16. Bossel, H. Assessing viability and sustainability: A systems-based approach for deriving comprehensive indicator sets. Conserv. Ecol. 2002, 5, 12. Available online: http://www.jstor.org/stable/26271829 (accessed on 10 October 2024). [CrossRef]
  17. Harger, J.R.E.; Meyer, F.M. Definition of indicators for environmentally sustainable development. Chemosphere 1996, 33, 1749–1775. [Google Scholar] [CrossRef]
  18. Izac, A.N.; Swift, M.J. On agricultural sustainability and its measurement in small-scale farming in sub-Saharan Africa. Ecol. Econ. 1994, 11, 105–125. [Google Scholar] [CrossRef]
  19. Moschen, S.A.; Macke, J.; Bebber, S.; Benetti Correa da Silva, M. Sustainable development of communities: ISO 37120 and UN goals. Int. J. Sustain. High. Educ. 2019, 20, 887–900. [Google Scholar] [CrossRef]
  20. Leff, S.; Petersen, B. Beyond the Scorecard: Understanding Global City Rankings; Chicago Council on Global Affairs: Chicago, IL, USA, 2015. [Google Scholar]
  21. Leboeuf, C. Global Indicator Framework for the Sustainable Development Goals; United Nations Department of Economic and Social Affairs: New York, NY, USA, 2018; Available online: https://coilink.org/20.500.12592/xbz90r (accessed on 11 October 2024).
  22. United Nations Sustainable Development. Sustainable Development Goals. 2015. Available online: https://www.un.org/sustainabledevelopment/ (accessed on 26 September 2024).
  23. Kamau, M.; Chasek, P.; O’Connor, D. Transforming Multilateral Diplomacy: The Inside Story of the Sustainable Development Goals; Routledge: London, UK, 2018. [Google Scholar]
  24. ISO Standard No. 37120:2018; Sustainable Cities and Communities—Indicators for City Services and Quality of Life. International Organization for Standardization: Geneva, Switzerland, 2018. Available online: https://www.iso.org/standard/68498.html (accessed on 20 August 2024).
  25. Schindler, S.; Marvin, S. Constructing a universal logic of urban control? International standards for city data, management, and interoperability. City 2018, 22, 298–307. [Google Scholar] [CrossRef]
  26. Guo, H.; Liang, D.; Sun, Z.; Chen, F.; Wang, X.; Li, J.; Zhu, L.; Bian, J.; Wei, Y.; Huang, L.; et al. Measuring and evaluating SDG indicators with Big Earth Data. Sci. Bull. 2022, 67, 1792–1801. [Google Scholar] [CrossRef] [PubMed]
  27. James, P.; Scerri, A. Auditing cities through circles of sustainability. In Cities and Global Governance; Routledge: London, UK, 2016; pp. 125–150. [Google Scholar]
  28. Midor, K.; Płaza, G. Moving to smart cities through the standard indicators ISO 37120. Multidiscip. Asp. Prod. Eng. 2020, 3, 617–630. [Google Scholar] [CrossRef]
  29. McCarney, P. Building high calibre city data. Econ. Dev. J. 2017, 16, 7–17. [Google Scholar]
  30. Nilsson, A.E.; Larsen, J.N. Making regional sense of global sustainable development indicators for the Arctic. Sustainability 2020, 12, 1027. [Google Scholar] [CrossRef]
  31. Larsen, J.N.; Schweitzer, P.P.; Fondahl, G. Arctic Social Indicators; TemaNord 2010: 519; Nordic Council of Ministers: Copenhagen, Denmark, 2010.
  32. Larsen, J.N.; Petrov, A.N.; Schweitzer, P. Arctic Social Indicators (ASI II); Implementation; TemaNord 2014:568; Nordic Council of Ministers: Copenhagen, Denmark, 2014.
  33. Einarsson, N.; Nymand Larsen, J.; Nilsson, A.; Young, O.R. Arctic Human Development Report; Stefansson Arctic Institute: Akureyri, Iceland, 2004. [Google Scholar]
  34. United Nations. Work of the Statistical Commission pertaining to the 2030 Agenda for Sustainable Development. In Resolution Adopted by the General Assembly on 6 July 2017; A/RES/71/313; UN: New York, NY, USA, 2017. [Google Scholar]
  35. Morse, S. Analysing the Use of Sustainability Indicators. In The Palgrave Handbook of Indicators in Global Governance; Malito, D., Umbach, G., Bhuta, N., Eds.; Palgrave Macmillan: London, UK, 2018. [Google Scholar] [CrossRef]
  36. Shen, L.Y.; Ochoa, J.J.; Shah, M.N.; Zhang, X. The application of urban sustainability indicators–A comparison between various practices. Habitat Int. 2011, 35, 17–29. [Google Scholar] [CrossRef]
  37. Davis, K.E.; Fisher, A.; Kingsbury, B.; Merry, S.E. (Eds.) Governance by Indicators: Global Power through Quantification and Rankings; Oxford University Press: New York, NY, USA, 2012. [Google Scholar]
  38. Stiglitz, J.E.; Fitoussi, J.-P.; Durand, M. Measuring what Counts: The Global Movement for Well-Being; The New Press: New York, NY, USA, 2019. [Google Scholar]
  39. Porter, T.M. The fetishization of quantification. Science 2018, 359, 527. [Google Scholar] [CrossRef]
  40. Muller, J.Z. The Tyranny of Metrics; Princeton University Press: Princeton, NJ, USA, 2018; p. 4. [Google Scholar]
  41. Machlis, G.E. Sustainability for the Forgotten; The University of Utah Press: Salt Lake City, UT, USA, 2024. [Google Scholar]
  42. Lyytimäki, J.; Tapio, P.; Varho, V.; Söderman, T. The use, non-use and misuse of indicators in sustainability assessment and communication. Int. J. Sustain. Dev. World Ecol. 2013, 20, 385–393. [Google Scholar] [CrossRef]
  43. Gan, X.; Fernandez, I.C.; Guo, J.; Wilson, M.; Zhao, Y.; Zhou, B.; Wu, J. When to use what: Methods for weighting and aggregating sustainability indicators. Ecol. Indic. 2017, 81, 491–502. [Google Scholar] [CrossRef]
  44. Orttung, R.W. (Ed.) Urban Sustainability in the Arctic: Measuring Progress in Circumpolar Cities, 1st ed.; Berghahn Books: New York, NY, USA, 2020; Volume 3. [Google Scholar]
  45. Zhang, E.X. Who Gets to Measure? Arctic Urban Sustainability and Locating Knowledge Production beneath the Power of Indicators. Master’s Thesis, George Washington University, Washington, DC, USA, 2021. [Google Scholar]
  46. Peel, M.C.; Finlayson, B.L.; McMahon, T.A. Updated world map of the Köppen-Geiger climate classification. Hydrol. Earth Syst. Sci. 2007, 11, 1633–1644. [Google Scholar] [CrossRef]
  47. WorldPop. Population Density; WorldPop: Hampshire, UK, 2020. [Google Scholar] [CrossRef]
  48. Robinson, D.; Howell, D.; Sandberg, E.; Brooks, L. Alaskan Population Overview: 2019 Estimates; Department of Labor and Workforce Development, Research and Analysis Section: Juneau, AK, USA, 2020.
  49. University of Alaska Fairbanks. UAF Facts and Figures. 2022. Available online: https://www.uaf.edu/facts/ (accessed on 5 September 2024).
  50. Houben, A.J.; D’Onofrio, R.; Kokelj, S.V.; Blais, J.M. Factors affecting elevated arsenic and methyl mercury concentrations in small shield lakes surrounding gold mines near the Yellowknife, NT, (Canada) region. PLoS ONE 2016, 11, e0150960. [Google Scholar] [CrossRef] [PubMed]
  51. Falvo, N. Homelessness in Yellowknife: An Emerging Social Challenge; The Canadian Homelessness Research Network Prewss: Toronto, ON, Canada, 2011. [Google Scholar]
  52. Christensen, J.; Arnfjord, S.; Carraher, S.; Hedwig, T. Homelessness across Alaska, the Canadian North and Greenland: A review of the literature on a developing social phenomenon in the Circumpolar North. Arctic 2017, 70, 349–364. Available online: https://www.jstor.org/stable/26387309 (accessed on 5 September 2024). [CrossRef]
  53. Coates, K.; Holroyd, C. Northern Sweden and Economic Development. J. North. Stud. 2021, 15, 7–24. [Google Scholar] [CrossRef]
  54. Fairbanks North Star Borough. Sustainability Plan. 2018. Available online: https://www.fnsb.gov/DocumentCenter/View/1258/2018-Sustainability-Plan-PD (accessed on 5 September 2024).
  55. Fairbanks North Star Borough. FNSB Climate Action and Adaptation Plan–Defeated 8 June 2023; Fairbanks North Star Borough: Fairbanks, AK, USA, 2023. Available online: https://fnsb.gov/DocumentCenter/View/12403/CAAP-Final-Plan-Defeated-June-2023?bidId= (accessed on 5 September 2024).
  56. City of Yellowknife. Corporate and Community Energy Action Plan: 2015–2025. 2015. Available online: https://www.yellowknife.ca/en/living-here/resources/Energy/DOCS-485683-v1-CORPORATE_AND_COMMUNITY_ENERGY_ACTION_PLAN_2015_TO_2025_WITH_STUDIES.PDF (accessed on 5 September 2024).
  57. Fox, M.S. The role of ontologies in publishing and analyzing city indicators. Comput. Environ. Urban Syst. 2015, 54, 266–279. [Google Scholar] [CrossRef]
  58. Aboab, J.; Celi, L.A.; Charlton, P.; Feng, M.; Ghassemi, M.; Marshall, D.C.; Mayaud, L.; Naumann, T.; McCague, N.; Paik, E.K.; et al. A “datathon” model to support cross-disciplinary collaboration. Sci. Transl. Med. 2016, 8, 333ps8. [Google Scholar] [CrossRef]
  59. Anslow, C.; Brosz, J.; Maurer, F.; Boyes, M. Datathons: An Experience Report of Data Hackathons for Data Science Education. In Proceedings of the 47th ACM Technical Symposium on Computing Science Education, Memphis, TN, USA, 2–5 March 2016; pp. 615–620. [Google Scholar] [CrossRef]
  60. Cornwall, A.; Jewkes, R. What is participatory research? Soc. Sci. Med. 1995, 41, 1667–1676. [Google Scholar] [CrossRef]
  61. Tafrate, J. Indicator Data and Decision-Making in a Changing Arctic (Order No. 31237623). Available from Dissertations & Theses @ George Washington University—WRLC; ProQuest Dissertations & Theses Global. (3061585655). 2024. Available online: https://www.proquest.com/dissertations-theses/indicator-data-decision-making-changing-arctic/docview/3061585655/se-2 (accessed on 10 October 2024).
  62. Memon, M.A.; Ramayah, T.; Cheah, J.H.; Ting, H.; Chuah, F.; Cham, T.H. PLS-SEM statistical programs: A review. J. Appl. Struct. Equ. Model. 2021, 5, 1–14. [Google Scholar] [CrossRef]
  63. Wold, H. Systems under indirect observation using PLS. In A Second Generation of Multivariate Analysis: Methods; Praeger: Sherman Oaks, CA, USA, 1982. [Google Scholar]
  64. López-Sánchez, J.Á.; Santos-Vijande, M.L. Key capabilities for frugal innovation in developed economies: Insights into the current transition towards sustainability. Sustain. Sci. 2022, 17, 191–207. [Google Scholar] [CrossRef]
  65. Astrachan, C.B.; Patel, V.K.; Wanzenried, G. A comparative study of CB-SEM and PLS-SEM for theory development in family firm research. J. Fam. Bus. Strategy 2014, 5, 116–128. [Google Scholar] [CrossRef]
  66. Johnson, M.D.; Herrmann, A.; Huber, F. The evolution of loyalty intentions. J. Mark. 2006, 70, 122–132. [Google Scholar] [CrossRef]
  67. Roemer, E. A tutorial on the use of PLS path modeling in longitudinal studies. Ind. Manag. Data Syst. 2016, 116, 1901–1921. [Google Scholar] [CrossRef]
  68. Hanafiah, M.H. Formative vs. reflective measurement model: Guidelines for structural equation modeling research. Int. J. Anal. Appl. 2020, 18, 876–889. [Google Scholar]
  69. Lemke, C. Accounting and Statistical Analyses for Sustainable Development: Multiple Perspectives and Information-Theoretic Complexity Reduction; Springer Nature: Cham, Switzerland, 2021. [Google Scholar]
  70. Ringle, C.M.; Wende, S.; Becker, J.M. SmartPLS 4. Oststeinbek: SmartPLS. 2022. Available online: https://www.smartpls.com (accessed on 23 January 2024).
  71. Hair, J.F.; Hult, T.M.; Ringle, C.M.; Sarstedt, M. A Primer on Partial Least Squares Structural Equation Modeling (PLS-SEM); Sage: New York, NY, USA, 2017. [Google Scholar]
  72. Hair, J.F.; Anderson, R.E.; Babin, B.J.; Black, W.C. Multivariate Data Analysis: A Global Perspective; Pearson: London, UK, 2010; Volume 7. [Google Scholar]
  73. Fornell, C.; Larcker, D.F. Evaluating structural equation models with unobservable variables and measurement error. J. Mark. Res. 1981, 18, 39–50. [Google Scholar] [CrossRef]
  74. Dijkstra, T.K.; Henseler, J. Consistent partial least squares path modeling. MIS Q. 2015, 39, 297–316. Available online: https://www.jstor.org/stable/26628355 (accessed on 5 September 2024). [CrossRef]
  75. Henseler, J.; Ringle, C.M.; Sarstedt, M. A new criterion for assessing discriminant validity in variance-based structural equation modeling. J. Acad. Mark. Sci. 2015, 43, 115–135. [Google Scholar] [CrossRef]
  76. Venturini, S.; Mehmetoglu, M. plssem: A Stata package for structural equation modeling with partial least squares. J. Stat. Softw. 2019, 88, 1–35. [Google Scholar] [CrossRef]
  77. City of Yellowknife. City Receives WCCD Platinum Certification under Data for Canadian Cities Project. 2022. Available online: https://www.yellowknife.ca/en/city-government/resources/WCCD-World-Council-for-City-Data/MEDIA-RELEASE-CITY-RECEIVES-PLATINUM-CERTIFICATION-UNDER-WCCD-DATA-FOR-CANADIAN-CITIES-PROJECT-AUGUST-2020.pdf (accessed on 5 September 2024).
  78. Aporta, C.; Bishop, B.; Choi, O.; Wang, W. Knowledge and data: An exploration of the use of Inuit knowledge in decision support systems in marine management. In Governance of Arctic Shipping: Rethinking Risk, Human Impacts and Regulation; Chircop, A., Goerlandt, F., Aporta, C., Pelot, R., Eds.; Springer: Berlin/Heidelberg, Germany, 2020; pp. 151–169. [Google Scholar]
  79. Elwood, S.A. GIS and collaborative urban governance: Understanding their implications for community action and power. Urban Geogr. 2001, 22, 737–759. [Google Scholar] [CrossRef]
  80. Petrov, A.N. Exploring the Arctic’s “other economies”: Knowledge, creativity and the new frontier. Polar J. 2016, 6, 51–68. [Google Scholar] [CrossRef]
  81. Robyne. Fairbanks Schools’ Budget $15 Million Less Than Last Year. Available online: https://kuac.org/ (accessed on 23 March 2023).
  82. Bye, H.-G. The Economic Situation for Small Businesses in Norrbotten Stands out in Sweden. High North News. Available online: https://www.highnorthnews.com/en/economic-situation-small-businesses-norrbotten-stands-out-sweden (accessed on 12 June 2023).
  83. Orange, R. Wanted: 100,000 Pioneers for a Green Jobs Klondike in the Arctic. The Guardian. Available online: https://www.theguardian.com/world/2021/nov/19/sweden-north-green-jobs (accessed on 19 November 2021).
  84. Government Offices of Sweden, Ministry of the Environment. Sweden’s Long-Term Strategy for Reducing Greenhouse Gas Emissions. 2020. Available online: https://unfccc.int/sites/default/files/resource/LTS1_Sweden.pdf (accessed on 5 September 2024).
  85. May, A.; Boehler-Baedeker, S.; Delgado, L.; Durlin, T.; Enache, M.; van der Pas, J.-W. Appropriate national policy frameworks for sustainable urban mobility plans. Eur. Transp. Res. Rev. 2017, 9, 7. [Google Scholar] [CrossRef]
  86. Agrawal, S.; Zoe, C. Housing and Homelessness in Indigenous Communities of Canada’s North. Hous. Policy Debate 2021, 34, 39–69. [Google Scholar] [CrossRef]
  87. Abele, F. Northern Development: Past, Present and Future. In Northern Exposure: Peoples, Powers and Prospects in Canada’s North; Abele, F., Courchene, J.T.J., Seidle, F.L., St-Hilaire, F., Eds.; Institute for Research on Public Policy: Montreal, QC, Canada, 2010; pp. 2–65. [Google Scholar]
  88. Bengel, A. Fairbanks Experiences Housing Price Inflation Amid Shortage. Webcenterfairbanks. Available online: https://www.webcenterfairbanks.com/2021/05/27/fairbanks-experiences-housing-price-inflation-amid-shortage/ (accessed on 27 May 2021).
  89. O’Sullivan, E. Welfare states and homelessness. In Homeless Research in Europe; O’Sullivan, E., Busch-Geertsema, V., Quilgars, D., Pleace, N., Eds.; Feantsa: Brussels, Belgium, 2010; pp. 65–84. [Google Scholar]
  90. Streletskiy, D.A.; Landers, K.; Shiklomanov, N.; Lanckman, J. Permafrost Degradation Comes at Substantial Cost to the Arctic States [Paper Presentation]. In Proceedings of the Arctic Science Summit Week, Vienna, Austria, 17–24 February 2023. [Google Scholar]
  91. AMAP. Snow, Water, Ice and Permafrost in the Arctic; Arctic Monitoring and Assessment Programme (AMAP) AMAP Secretariat of the Arctic Council: Oslo, Norway, 2017. [Google Scholar]
  92. Biskaborn, B.K.; Smith, S.L.; Noetzli, J.; Matthes, H.; Vieira, G.; Streletskiy, D.A.; Schoeneich, P.; Romanovsky, V.E.; Lewkowicz, A.G.; Abramov, A.; et al. Permafrost is warming at a global scale. Nat. Commun. 2019, 10, 264. [Google Scholar] [CrossRef] [PubMed]
  93. Intergovernmental Panel on Climate Change (IPCC). Climate Change 2014: Synthesis Report; Contribution of Working Groups I, II and III to the Fifth Assessment Report of the Intergovernmental Panel on Climate Change; IPCC: Geneva, Switzerland, 2014.
  94. Masrur, A.; Petrov, A.N.; DeGroote, J. Circumpolar spatio-temporal patterns and contributing climatic factors of wildfire activity in the Arctic tundra from 2001–2015. Environ. Res. Lett. 2018, 13, 014019. [Google Scholar] [CrossRef]
  95. Usubiaga-Liaño, A.; Ekins, P. Are we on the right path? Measuring progress towards environmental sustainability in European countries. Sustain. Sci. 2023, 18, 755–770. [Google Scholar] [CrossRef]
  96. Johnson, J.T.; Howitt, R.; Cajete, G.; Berkes, F.; Louis, R.P.; Kliskey, A. Weaving Indigenous and sustainability sciences to diversify our methods. Sustain. Sci. 2016, 11, 1–11. [Google Scholar] [CrossRef]
  97. Dudley, J.P.; Hoberg, E.P.; Jenkins, E.J.; Parkinson, A.J. Climate change in the North American Arctic: A One Health perspective. EcoHealth 2015, 12, 713–725. [Google Scholar] [CrossRef]
  98. Petrov, A.N. Human capital and sustainable development in the Arctic: Towards intellectual and empirical framing. In Northern Sustainabilities: Understanding and Addressing Change in the Circumpolar World; Fondahl, G., Wilson, N., Eds.; Springer: Berlin/Heidelberg, Germany, 2017; pp. 203–220. [Google Scholar]
  99. Degai, T.S.; Petrov, A.N. Rethinking Arctic sustainable development agenda through indigenizing UN sustainable development goals. Int. J. Sustain. Dev. World Ecol. 2021, 28, 518–523. [Google Scholar] [CrossRef]
  100. Behe, C.; Daniel, R.; Raymond-Yakoubian, J. Understanding the Arctic Through a Co-Production of Knowledge. Fairbanks (AK): ACCAP Webinar, Alaska Center for Climate Assessment & Policy, University of Alaska Fairbanks. Available online: https://uaf-accap.org/event/understanding-the-arctic-through-a-co-production-of-knowledge/ (accessed on 11 April 2018).
  101. Mair, S.; Jones, A.; Ward, J.; Christie, I.; Druckman, A.; Lyon, F. A Critical Review of the Role of Indicators in Implementing the Sustainable Development Goals. In Handbook of Sustainability Science and Research; World Sustainability Series; Leal, F.W., Ed.; Springer: Cham, Switzerland, 2018. [Google Scholar] [CrossRef]
  102. Zeemering, E.S. Sustainability management, strategy and reform in local government. In Sustainable Public Management; Routledge: London, UK, 2024; pp. 141–158. [Google Scholar]
  103. Homsy, G.C. Capacity, sustainability, and the community benefits of municipal utility ownership in the United States. J. Econ. Policy Reform 2020, 23, 120–137. [Google Scholar] [CrossRef]
  104. Phillips, J. The Sustainability Dynamics Framework—A holistic approach to define and evaluate sustainability and unsustainability in the Anthropocene. Environ. Impact Assess. Rev. 2020, 84, 106436. [Google Scholar] [CrossRef]
  105. Filimonova, N. Constructing climate change: Exploring how cities frame climate change in the Arctic. J. Urban Aff. 2024, 1–19. [Google Scholar] [CrossRef]
Figure 1. ISO 37120 indicator set structure.
Sustainability 16 09033 g001
Figure 2. Case study city locations within Arctic territories (blue) as defined by the Arctic Human Development Report [33]. City crests, founding dates, and the mayor term start date displayed on the right.
Sustainability 16 09033 g002
Figure 3. Population density for study cities shown at the same 1: 6,000,000 scale. Population densities at 1 km spatial resolution based on WorldPop (2020) estimates with municipal borders [47]. All densities shown at a scale from 0 to 2000 people km2. Satellite imagery from Esri, Maxar, and Earthstar Geographics.
Sustainability 16 09033 g003
Figure 5. Longitudinal Structural Equation Modeling (PLS-SEM) for Fairbanks NSB: Observed variables with factor loadings and latent variables with path coefficients.
Sustainability 16 09033 g005
Figure 6. Longitudinal Structural Equation Modeling (PLS-SEM) for Yellowknife: Observed variables with factor loadings and latent variables with path coefficients.
Sustainability 16 09033 g006
Figure 7. Longitudinal Structural Equation Modeling (PLS-SEM) for Luleå: Observed variables with factor loadings and latent variables with path coefficients.
Sustainability 16 09033 g007
Figure 8. Identification of ISO themes relevant to study cities with individual indicator trends presented for highlighted themes: mayor selection (green), model selection (pink), selected by both (purple). Not selected themes left blank.
Sustainability 16 09033 g008
Disclaimer/Publisher’s Note: The statements, opinions and data contained in all publications are solely those of the individual author(s) and contributor(s) and not of MDPI and/or the editor(s). MDPI and/or the editor(s) disclaim responsibility for any injury to people or property resulting from any ideas, methods, instructions or products referred to in the content.

