
Relationship Between Land Use Transformation and Ecosystem Service Value in the Process of Urban–Rural Integration: An Empirical Study of 17 Prefecture-Level Cities in Henan Province, China

Abstract
1. Introduction
2. Literature Review and Mechanism Analysis
2.1. Literature Review
- Ensuring equal status and mutual enhancement of urban and rural strengths.
- Facilitating rational flow and optimal allocation of factors such as population, land, capital, technology, and management across urban and rural territories at suitable scales.
- Promoting shared prosperity and comprehensive human development.
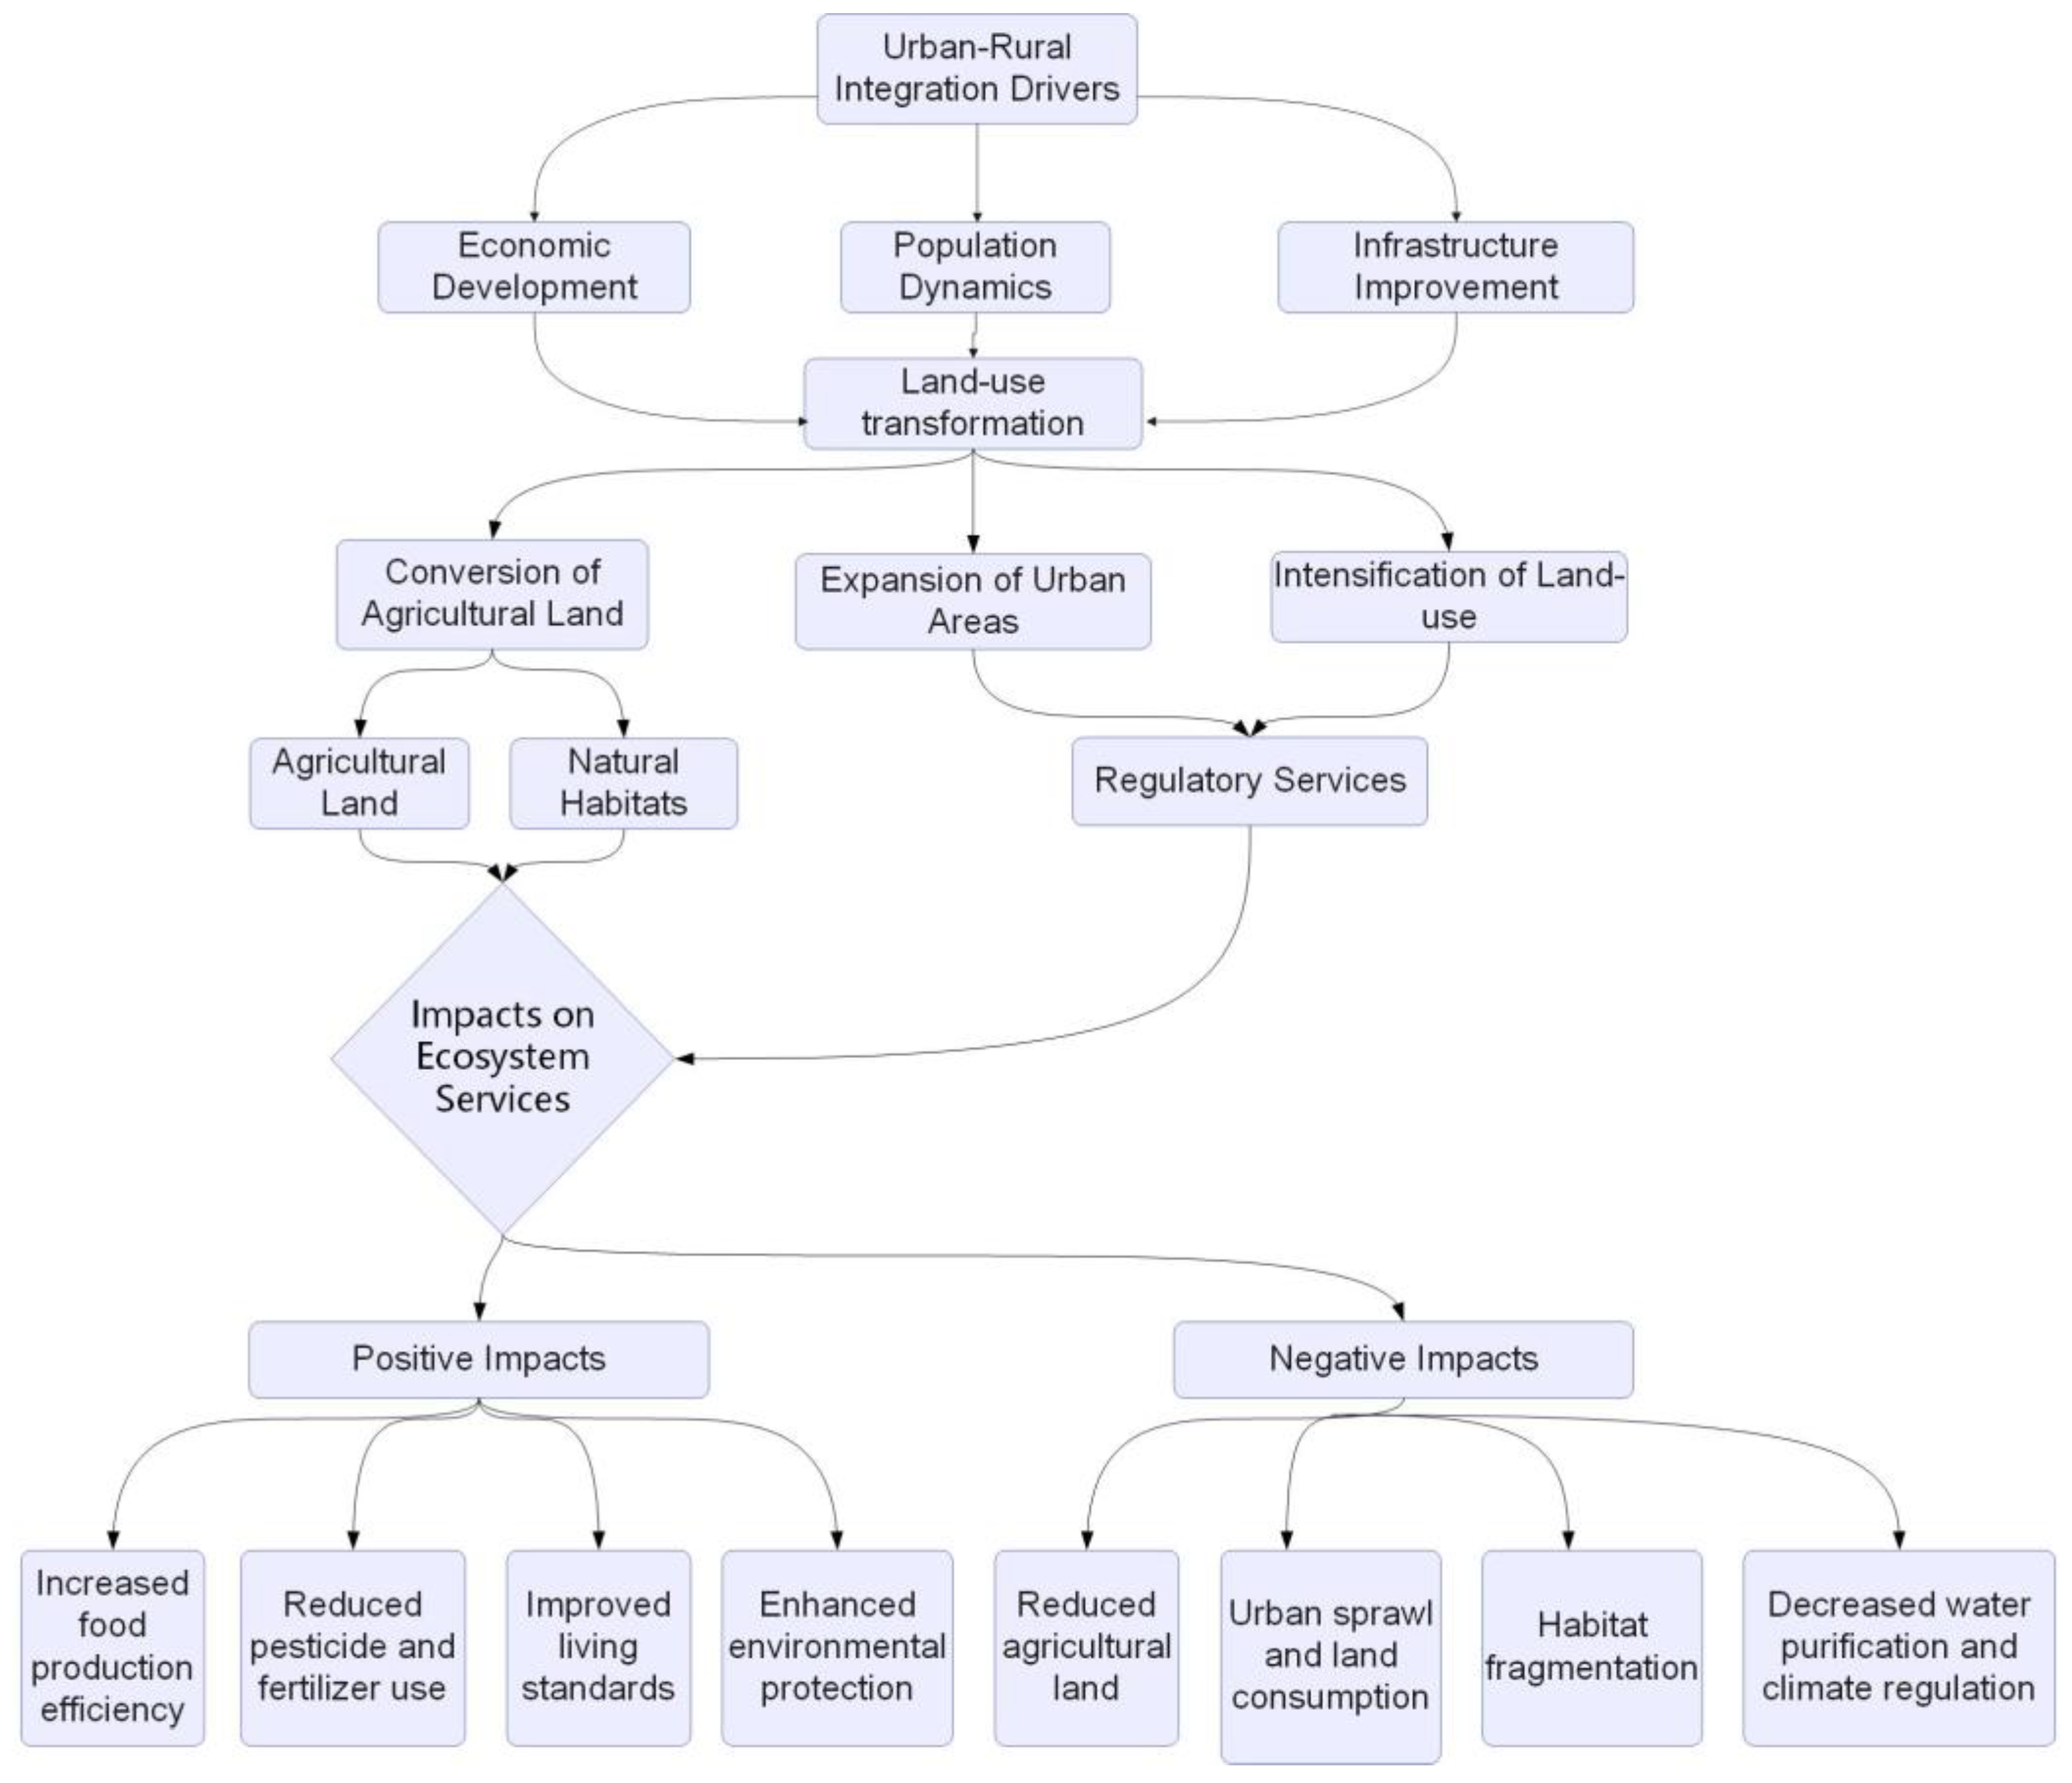
2.2. Mechanism Analysis
3. Data Sources and Methods
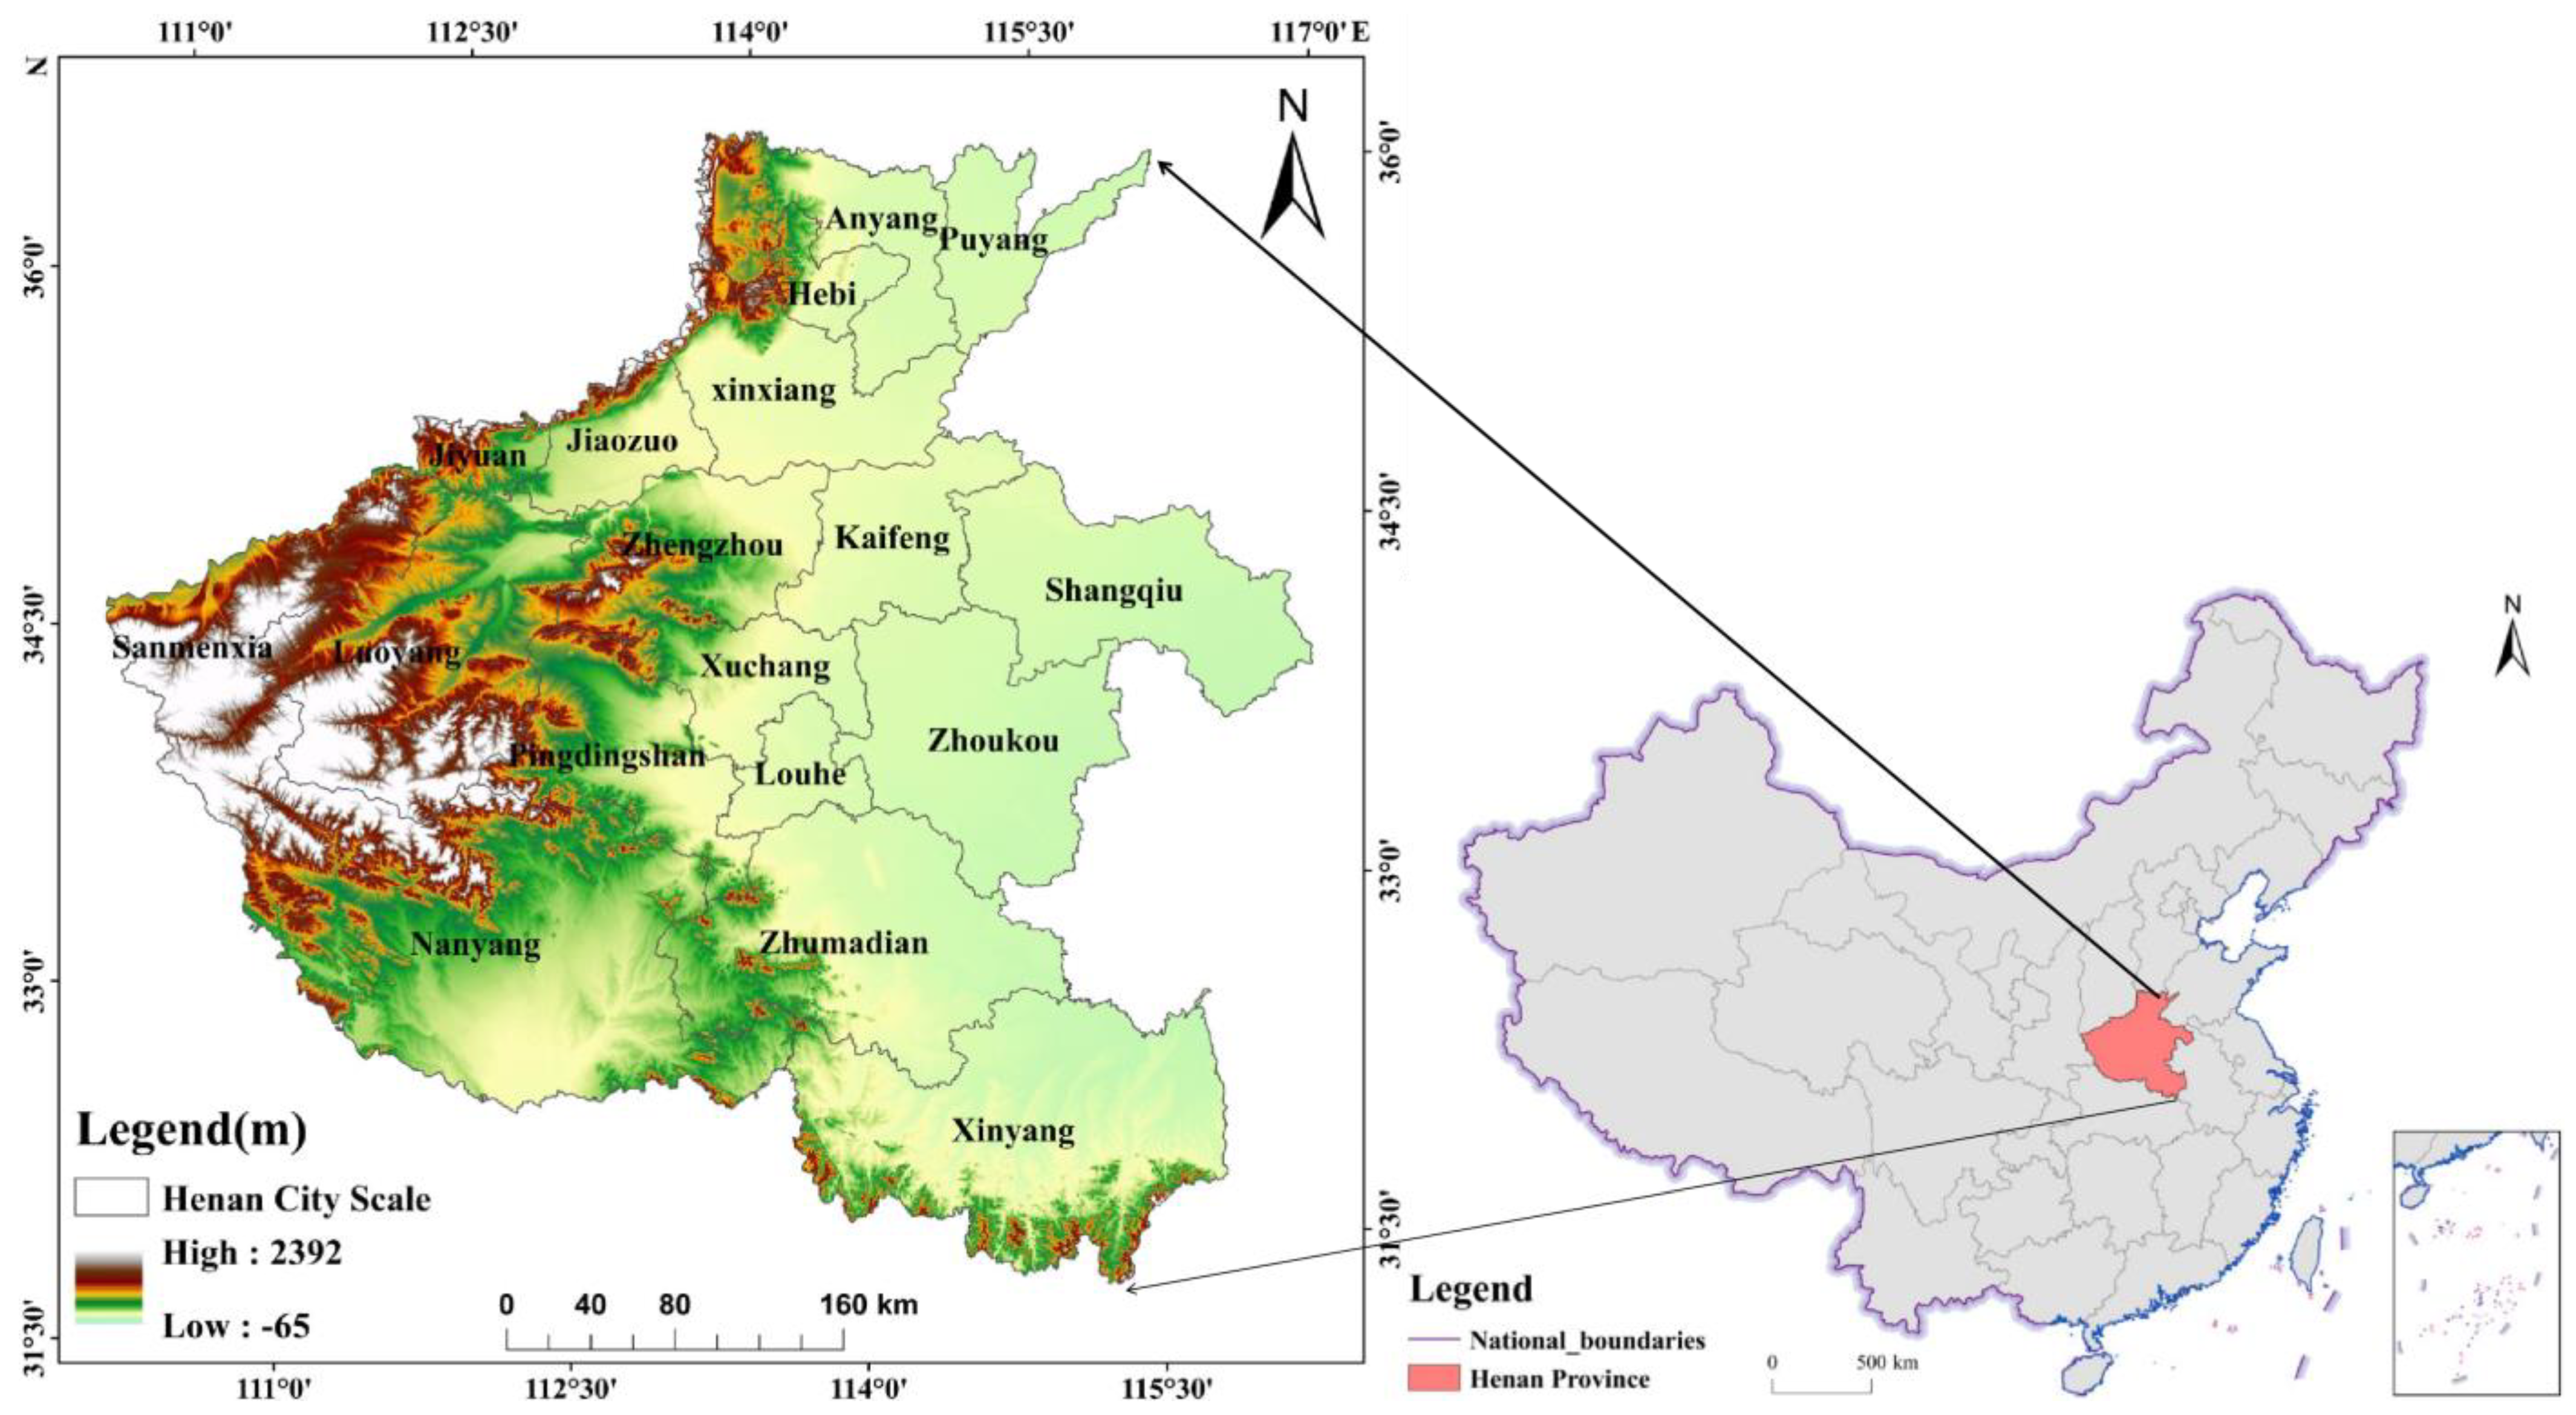
3.1. Study Area and Division of Research Units
3.2. Methods
3.2.1. Urban–Rural Integration Index
3.2.2. Calculation of ESVs
3.2.3. Elasticity of ESV Change in Relation to LUCC
3.3. Data Sources
4. Results
4.1. Urban–Rural Integration Development Index and Land Use Change
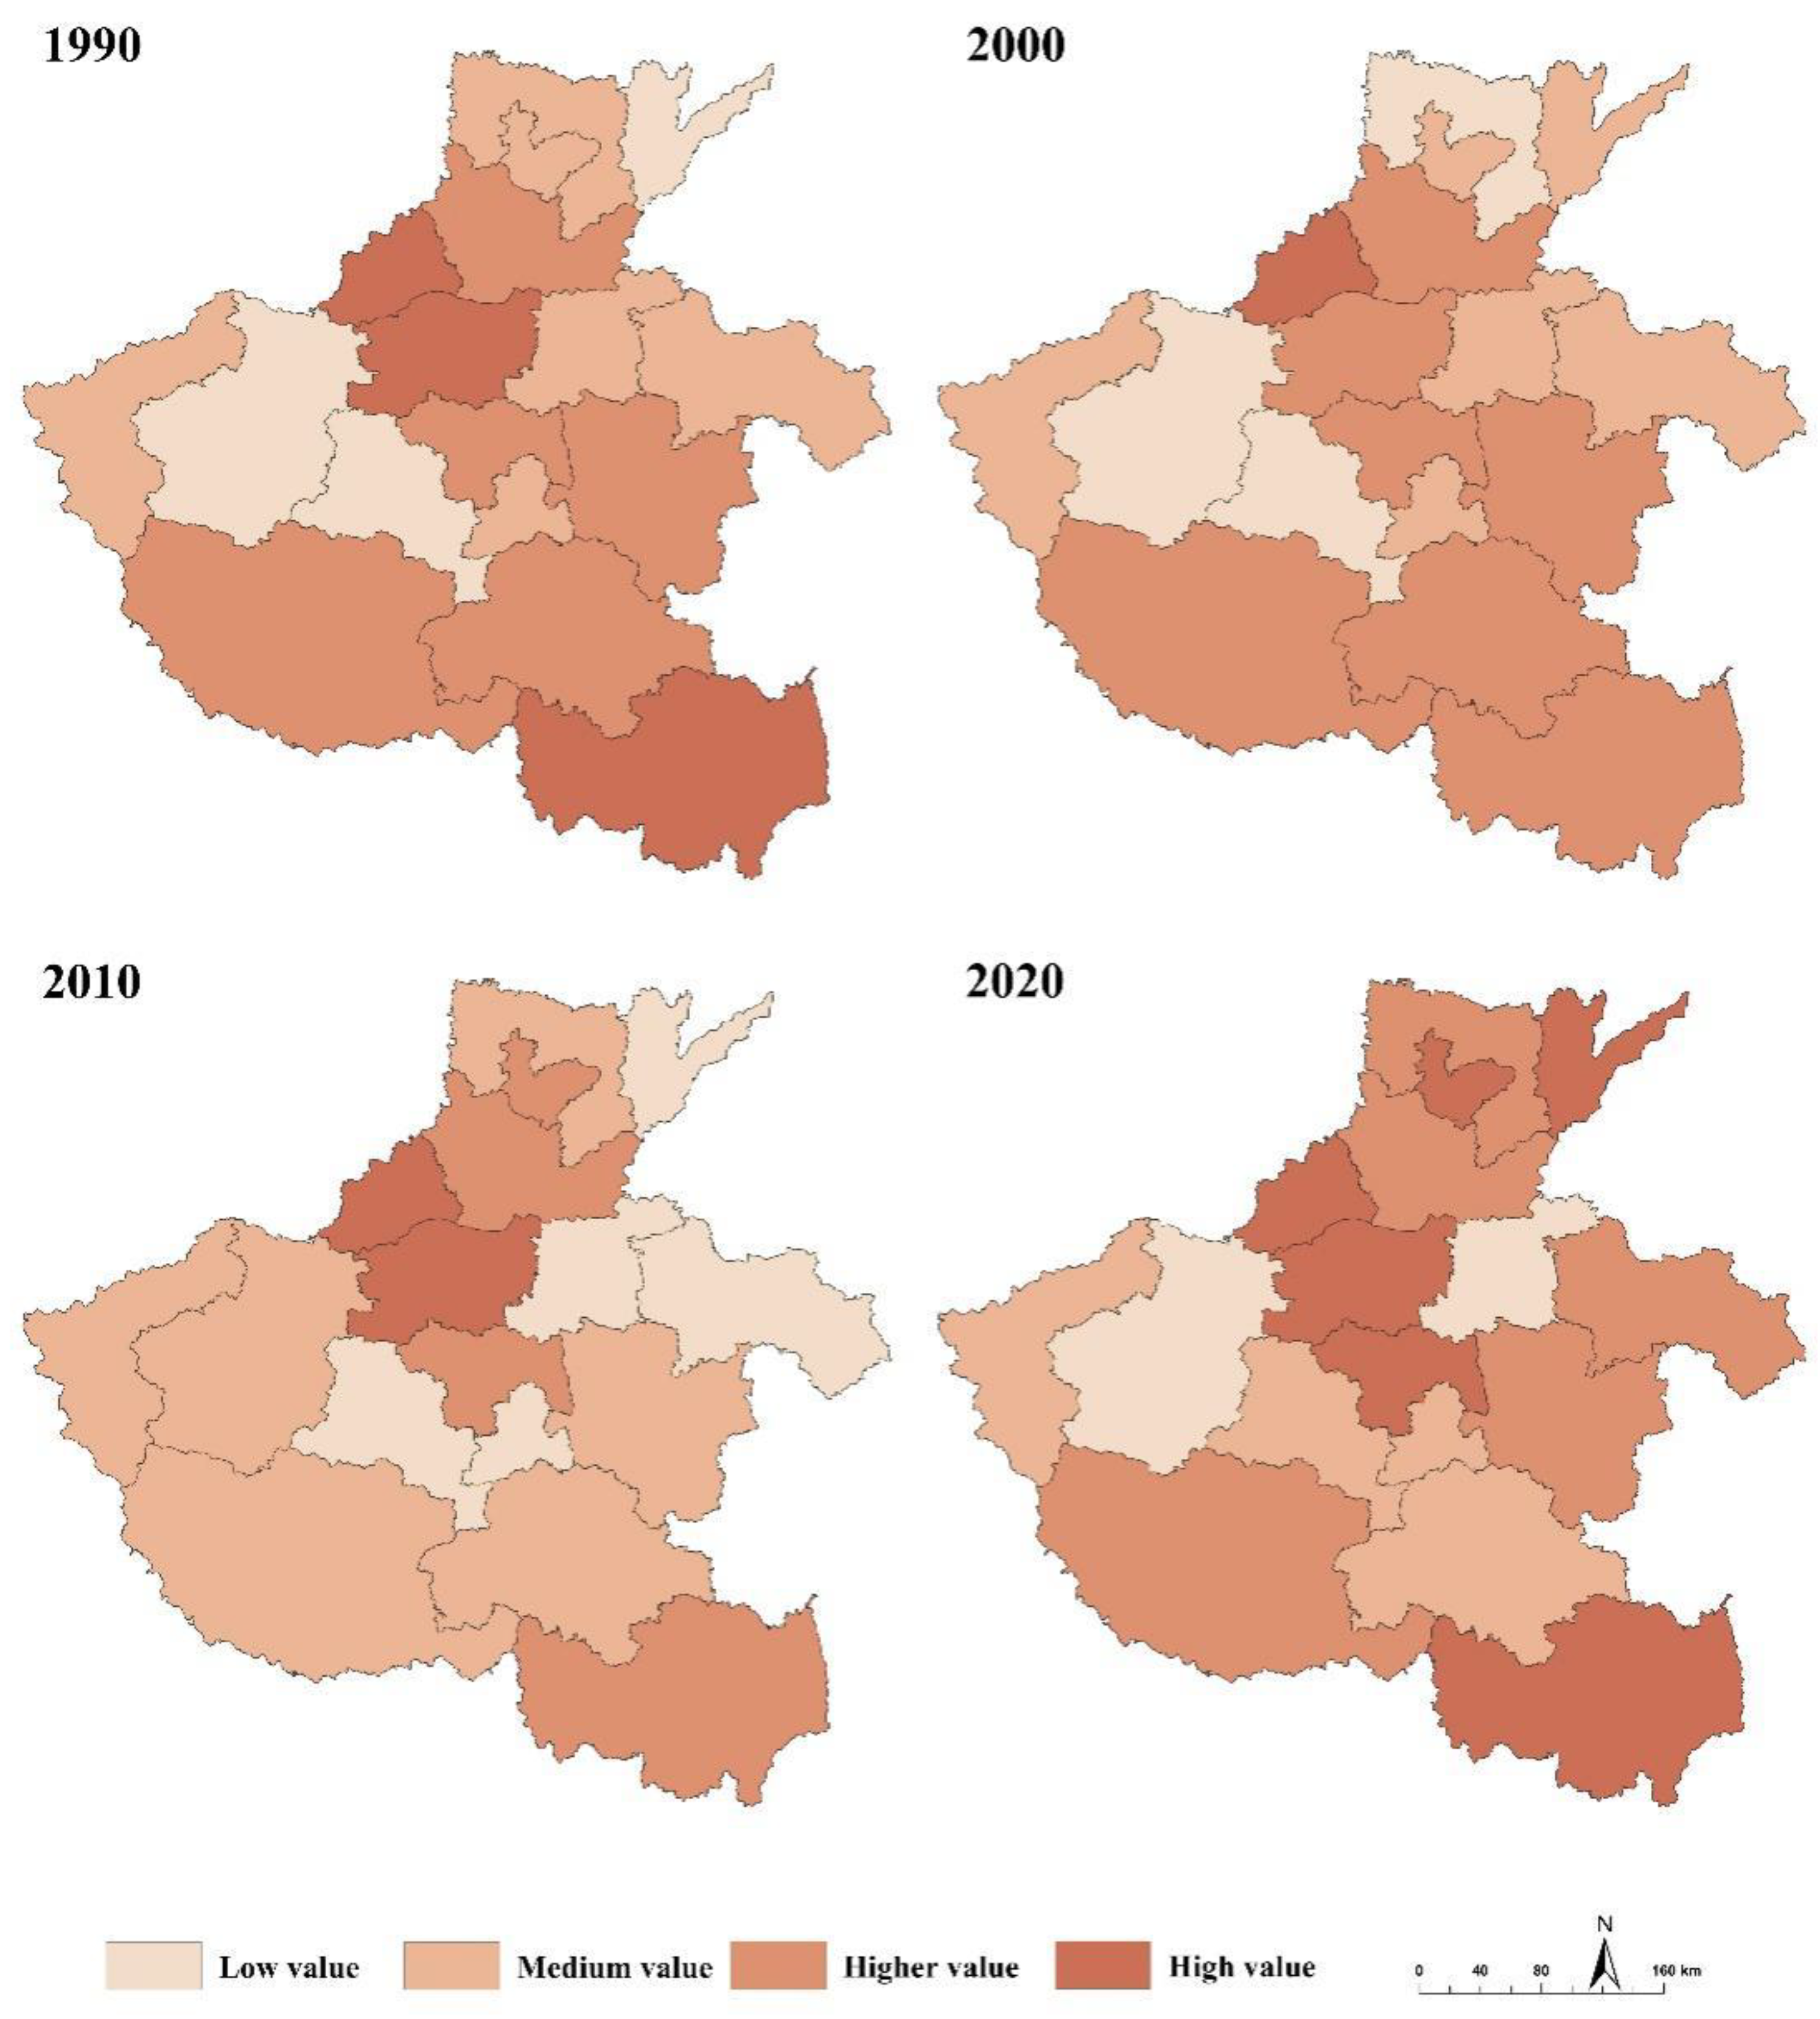
4.1.1. Spatial Distribution and Trends in Urban–Rural Integration Development
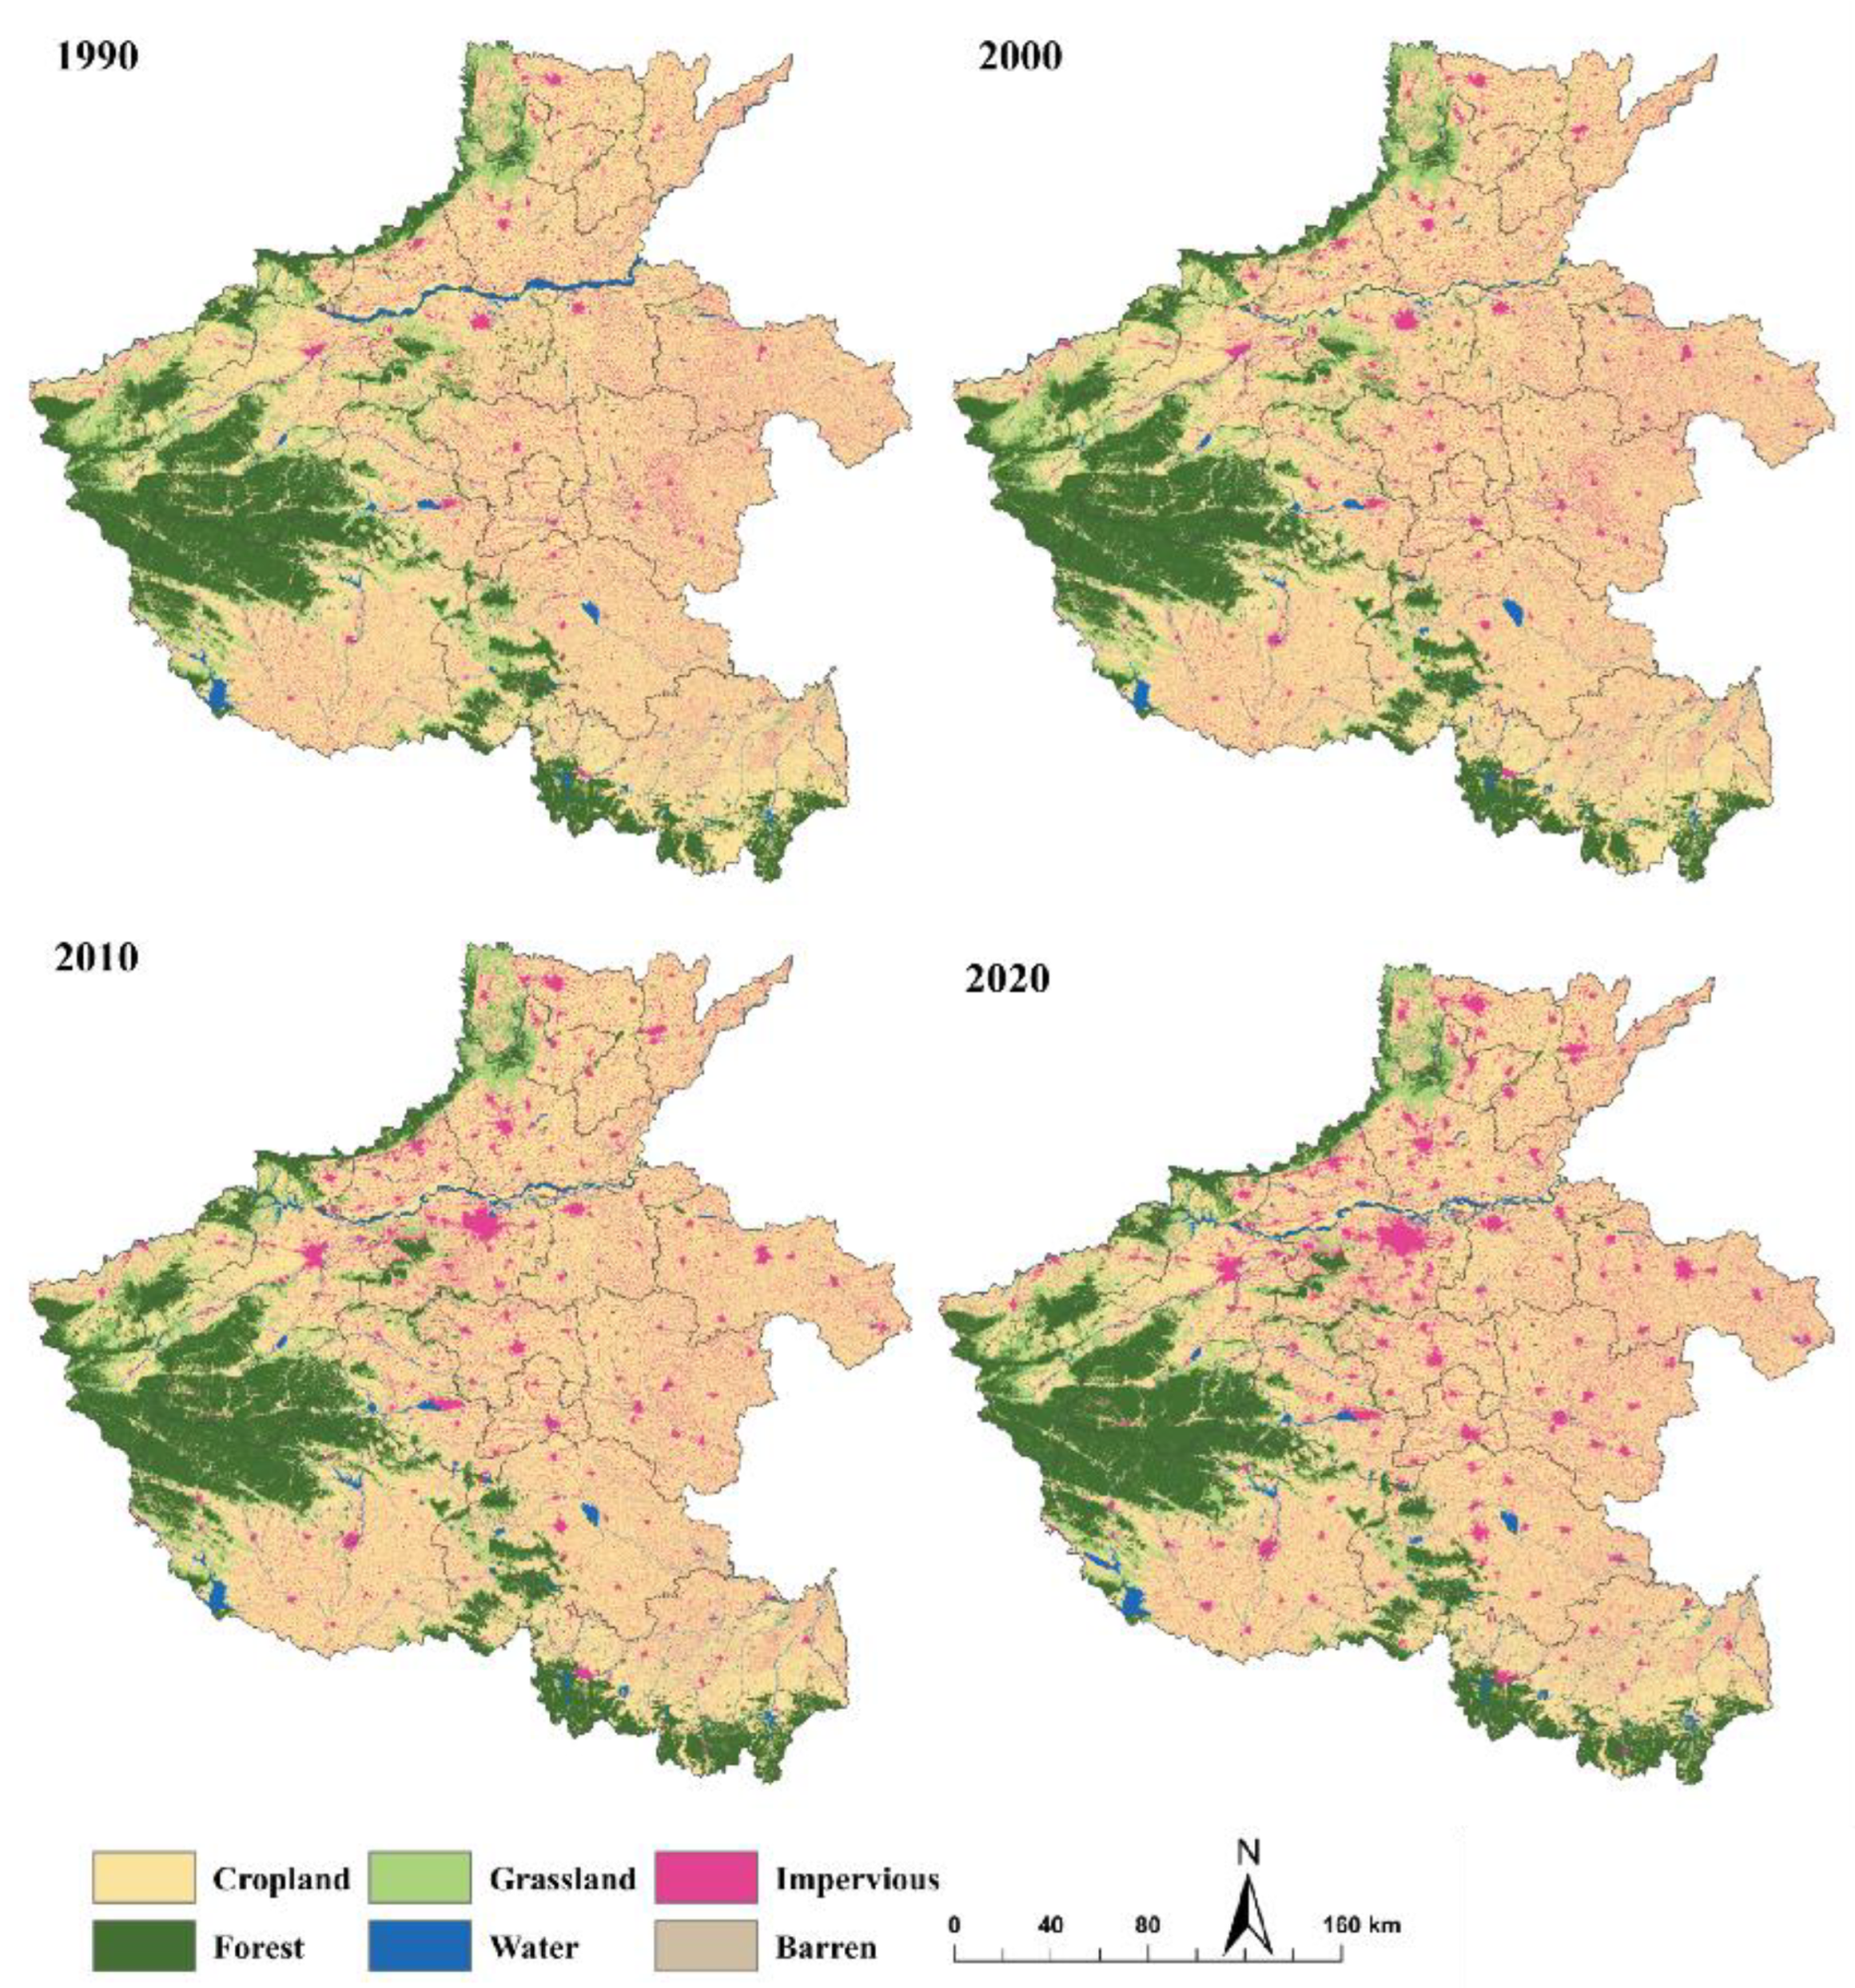
4.1.2. Evolution of Land Use Transfer
- Urban expansion: This was characterized by a substantial conversion of agricultural land into urban built-up areas, indicating accelerated urbanization. This mode was identified when the proportion of built-up land transferred to the area exceeded 15%.
- Suburbanization development: This was marked by a considerable conversion of agricultural land into suburban residential, commercial, and mixed-use areas, reflecting the blurring of urban–rural boundaries. This mode was identified when the proportion of built-up land transferred in was between 5% and 15% and the proportion of grassland or forest land transferred in exceeded 5%.
- Agricultural intensification: This involved increased intensification of agricultural land use and improved agricultural production efficiency. This mode was identified when the area of cultivated land transferred in exceeded 80%.
- Ecological restoration: This focused on restoring ecological services by converting industrial or degraded land into forest land, water bodies, or other natural areas. This mode was identified when the proportion of water transferred in exceeded 2% or the proportion of forest land transferred in exceeded 10%.
4.2. Ecosystem Service Value Changes
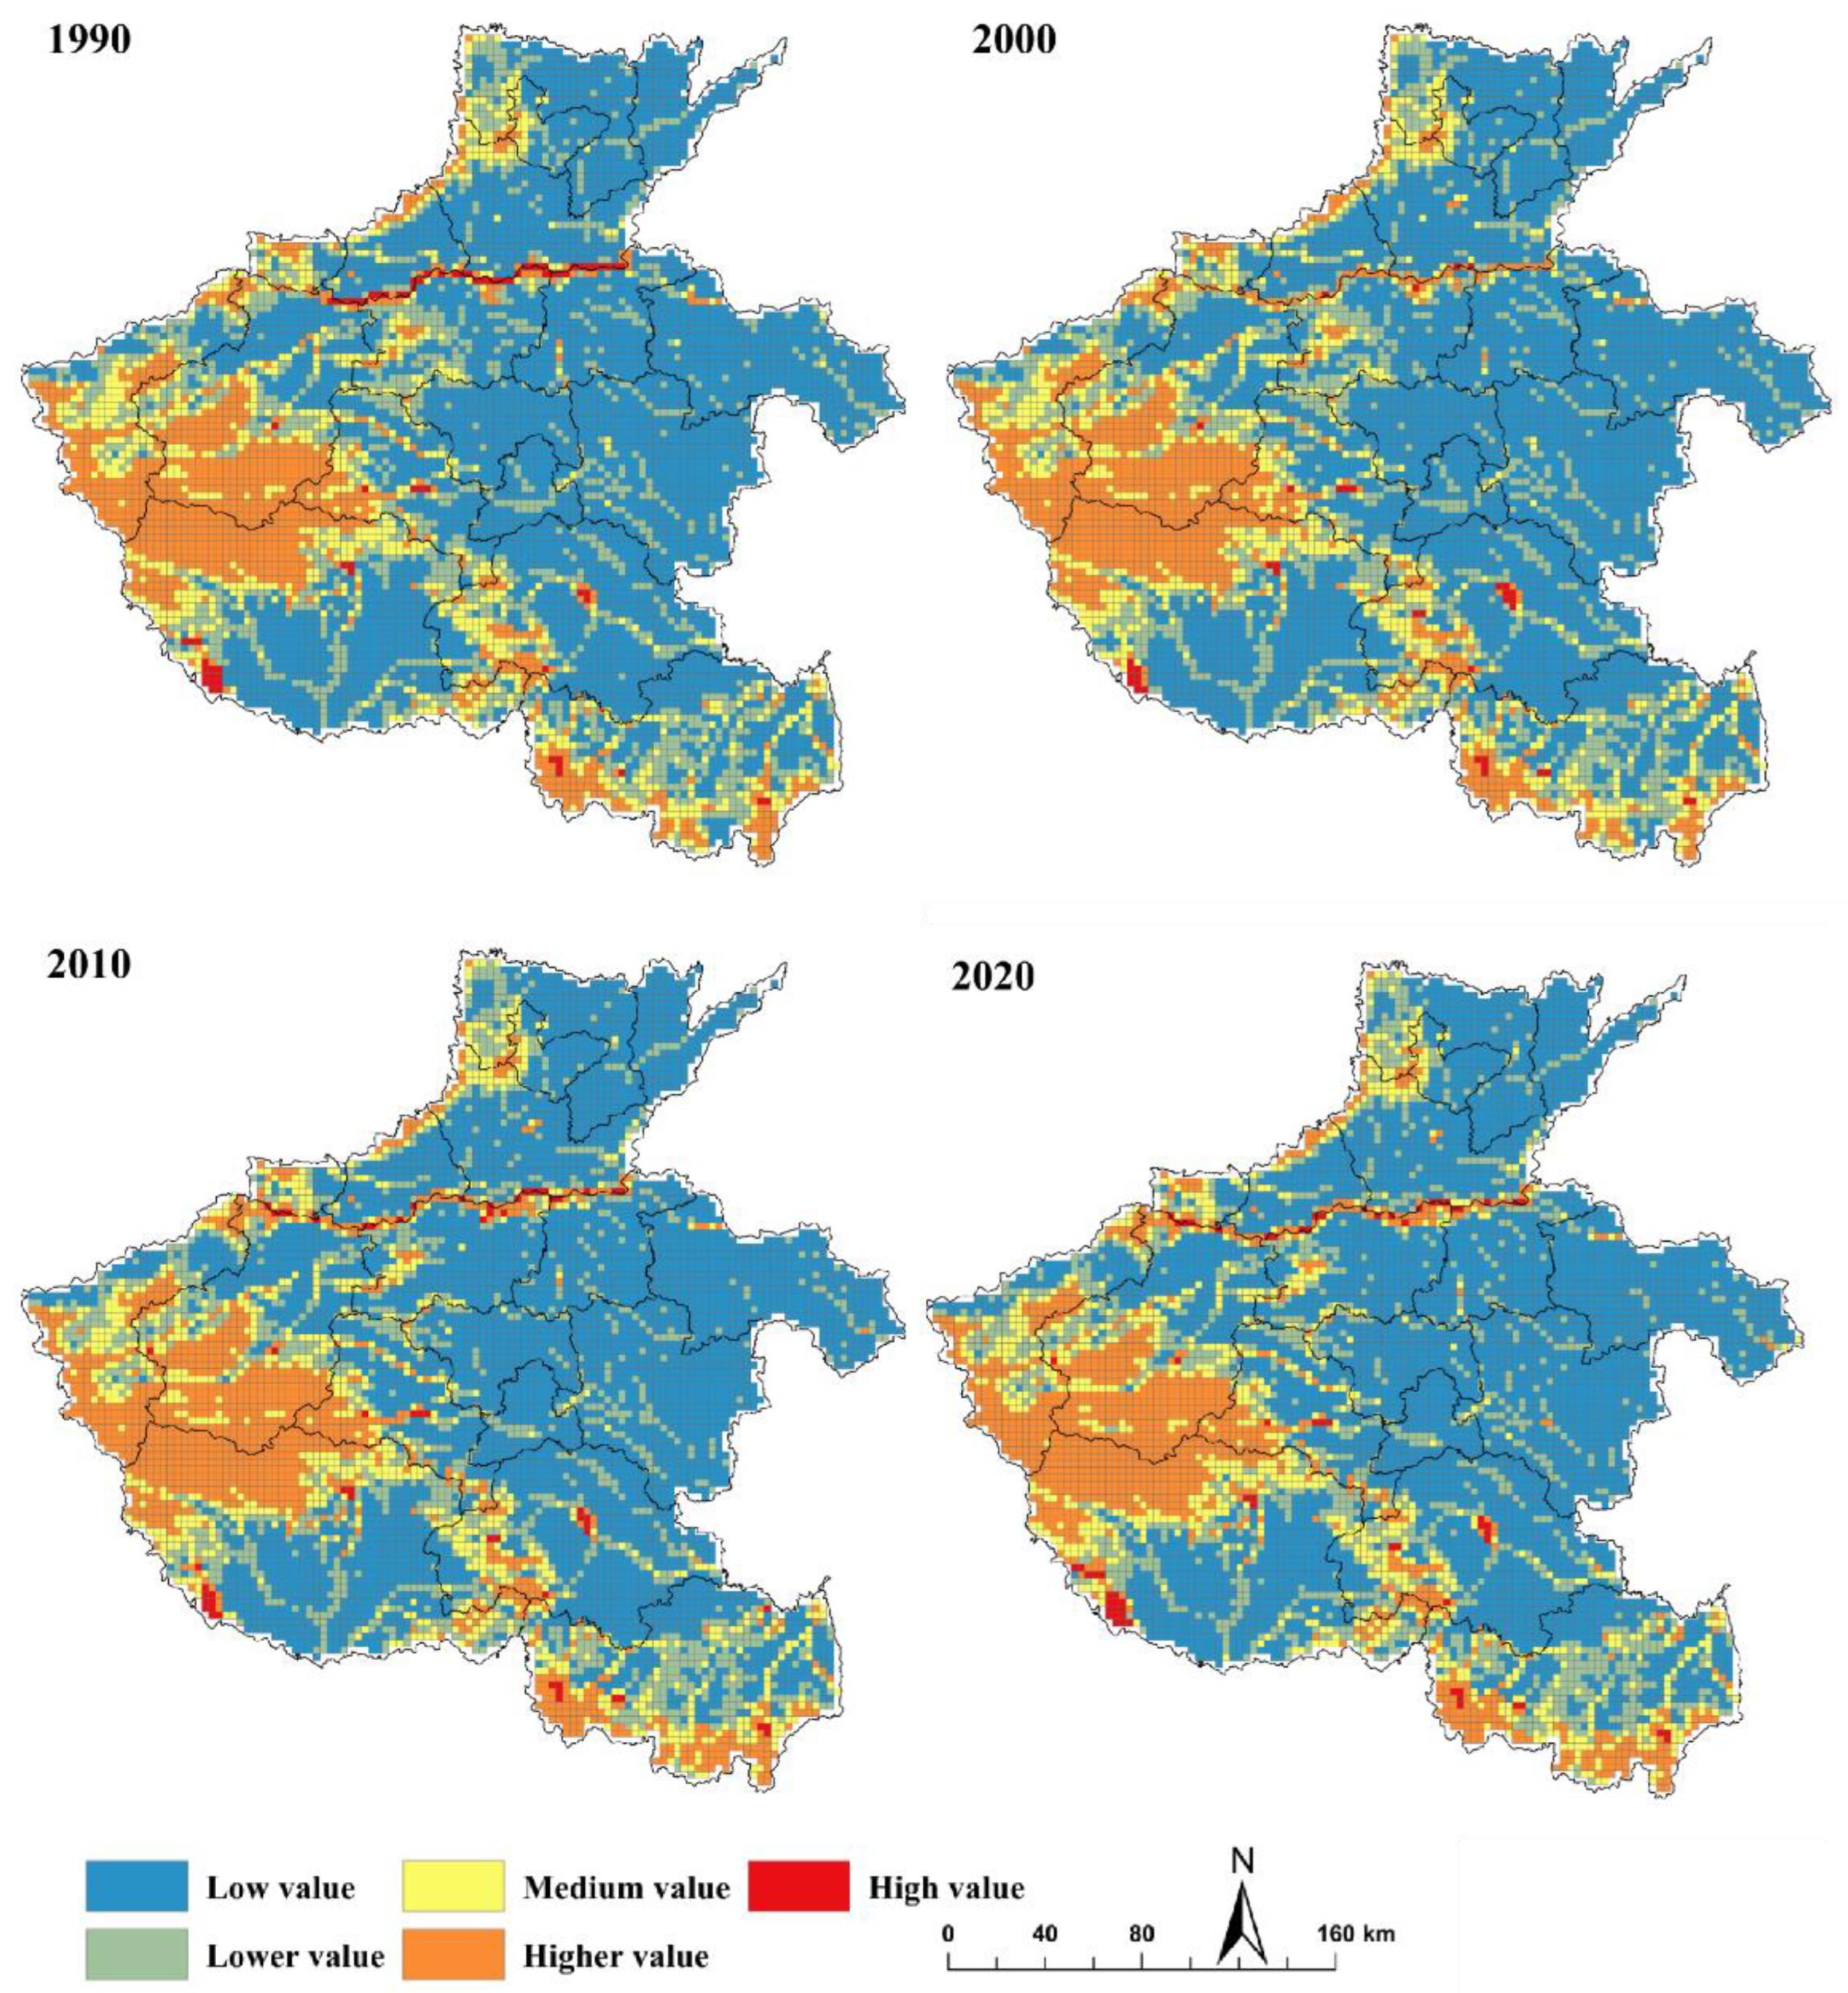
4.2.1. Temporal and Spatial Changes in ESV
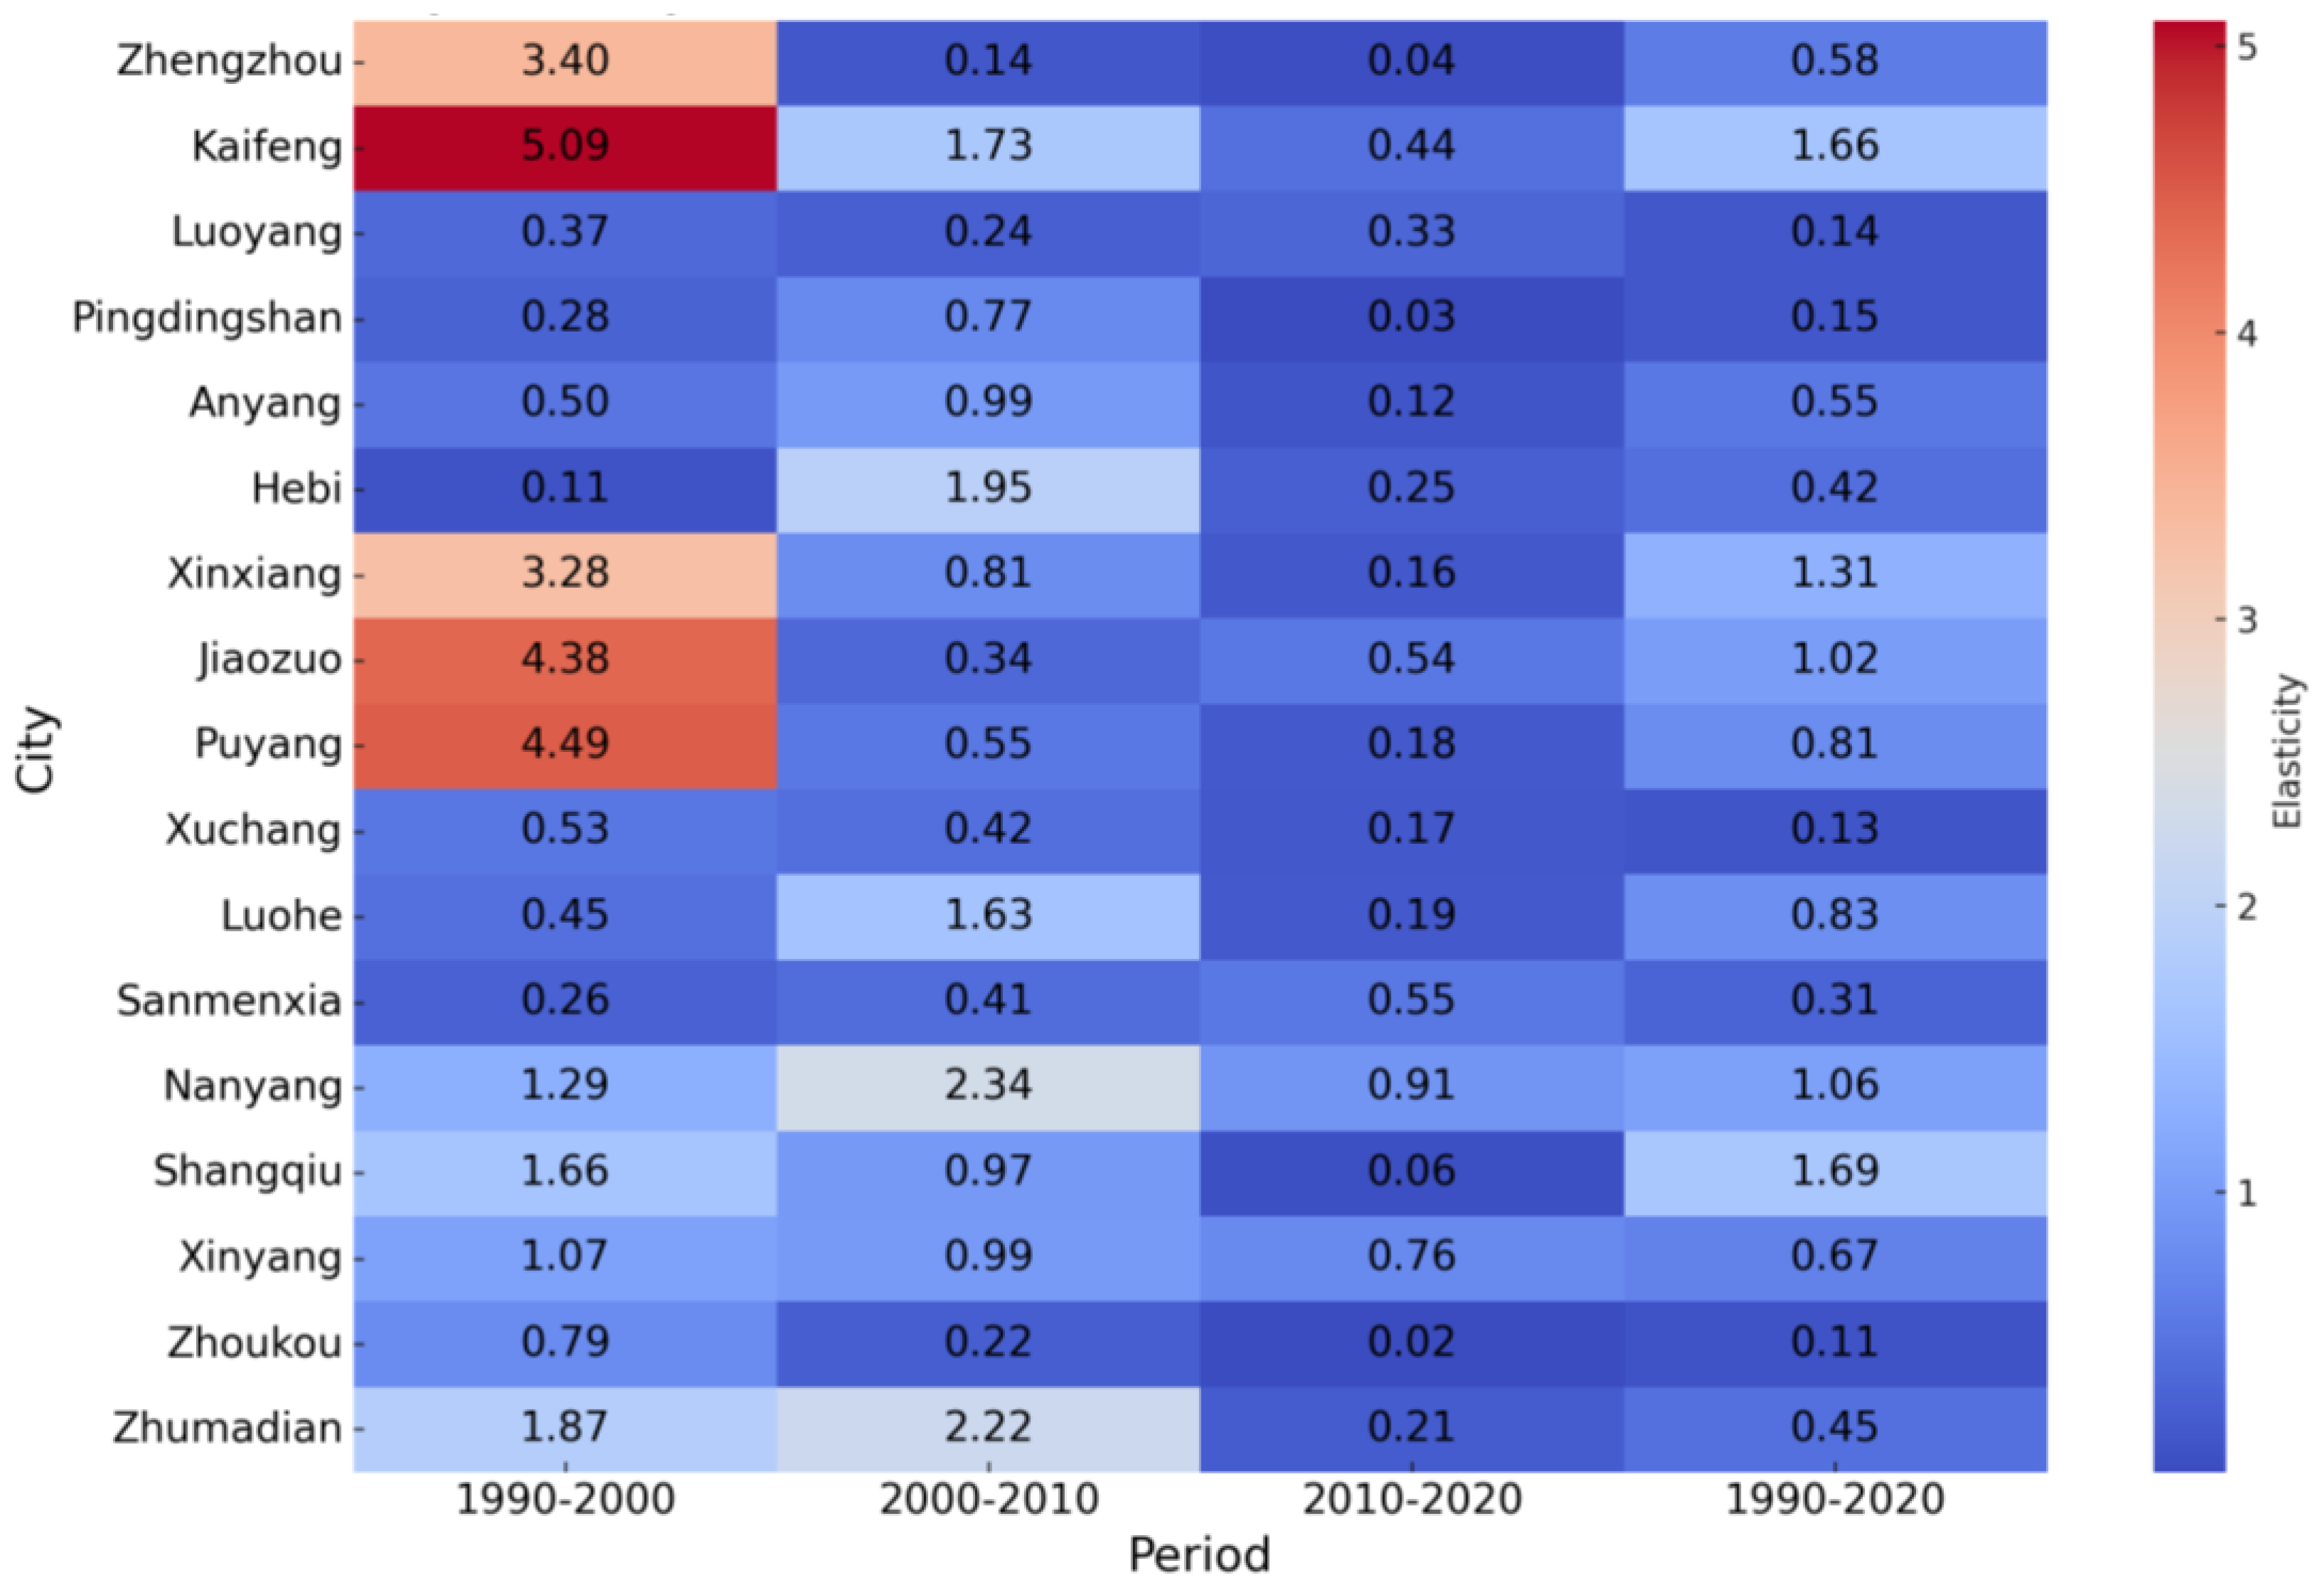
4.2.2. Relationship between ESV Changes and Land Use Transition in the Process of Urban–Rural Integration
5. Discussion
6. Conclusions
Author Contributions
Funding
Institutional Review Board Statement
Informed Consent Statement
Data Availability Statement
Conflicts of Interest
References
- Zhou, D.; Qi, J.L.; Zhong, W.Y. Review of urban-rural integration evaluation: Connotation identification, theoretical analysis, and system reconstruction. J. Nat. Resour. 2021, 36, 2634–2651. (In Chinese) [Google Scholar] [CrossRef]
- Cao, W.; Zhou, S.L.; Zhou, M.Y. Operational pattern of urban-rural integration regulated by land use in metropolitan fringe of China. Land 2021, 10, 515. [Google Scholar] [CrossRef]
- Shaker, R.R.; Mackay, B.R. Hidden patterns of sustainable development in Asia with underlying global change correlations. Ecol. Indic. 2021, 131, 108227. [Google Scholar] [CrossRef]
- Yang, Y.Y.; Bao, W.K.; Wang, Y.S.; Liu, Y.S. Measurement of urban-rural integration level and its spatial differentiation in China in the new century. Habitat Int. 2021, 117, 102420. [Google Scholar] [CrossRef]
- Zhang, C.; Fan, Y.P.; Fang, C.L. When will China realize urban-rural integration? A case study of 30 provinces in China. Cities 2024, 153, 105290. [Google Scholar] [CrossRef]
- He, Y.H.; Zhou, G.H.; Tang, C.L.; Fan, S.G.; Guo, X.S. The spatial organization pattern of urban-rural integration in urban agglomerations in China: An agglomeration-diffusion analysis of the population and firms. Habitat Int. 2019, 87, 54–65. [Google Scholar] [CrossRef]
- He, R.W.; Yang, H.; Zhang, H.P.; Yuan, C.X. Research on the realization path of urban-rural integration development with a perspective of urban-rural. J. Desert Res. 2022, 42, 32–40. (In Chinese) [Google Scholar]
- Wang, Y.; Lu, Y.; Zhu, Y. Can the integration between urban and rural areas be realized? A new theoretical analytical framework. J. Geogr. Sci. 2024, 34, 3–24. (In Chinese) [Google Scholar] [CrossRef]
- Chen, K.Q.; Long, H.L.; Liao, L.W.; Tu, S.S.; Li, T.T. Land use transitions and urban-rural integrated development: Theoretical framework and China’s evidence. Land Use Policy 2020, 92, 104465. [Google Scholar] [CrossRef]
- Fang, C.L. On integrated urban and rural development. J. Geogr. Sci. 2022, 32, 1411–1426. [Google Scholar] [CrossRef]
- Liu, W.D.; Dunford, M.; Song, Z.Y.; Chen, M.X. Urban–rural integration drives regional economic growth in Chongqing, Western China. Area Dev. Policy 2016, 1, 132–154. [Google Scholar] [CrossRef]
- Mishra, B.K.; Mebeelo, K.; Chakraborty, S.; Kumar, P.; Gautam, A. Implications of urban expansion on land use and land cover: Towards sustainable development of Mega Manila, Philippines. GeoJournal 2021, 86, 927–942. [Google Scholar] [CrossRef]
- Aziz, T. Changes in land use and ecosystem services values in Pakistan, 1950–2050. Environ. Dev. 2021, 37, 100576. [Google Scholar] [CrossRef]
- Wang, R.B.; Xu, X.J.; Bai, Y.; Alatalo, J.M.; Yang, Z.B.; Yang, W.; Yang, Z.Q. Impacts of urban land use changes on ecosystem services in Dianchi lake basin, China. Sustainability 2021, 13, 4813. [Google Scholar] [CrossRef]
- Kavitha, A.; Somashekar, R.; Nagaraja, B. Urban expansion and loss of Agriculture land-A case of Bengaluru city. Int. J. Geomat. Geosci. 2015, 5, 492–498. [Google Scholar]
- Camara, M.; Jamil, N.R.; Abdullah, A.F.B. Impact of land uses on water quality in Malaysia: A review. Ecol. Process. 2019, 8, 10. [Google Scholar] [CrossRef]
- de Oliveira, T.E.; de Freitas, D.S.; Gianezini, M.; Ruviaro, C.F.; Zago, D.; Mercio, T.Z.; Dias, E.A.; do Nascimento Lampert, V.; Barcellos, J.O.J. Agricultural land use change in the Brazilian Pampa Biome: The reduction of natural grasslands. Land Use Policy 2017, 63, 394–400. [Google Scholar] [CrossRef]
- Wu, Y.Z.; Long, H.L.; Zhao, P.J.; Hui, E.C.M. Land use policy in urban-rural integrated development. Land Use Policy 2022, 115, 106041. [Google Scholar] [CrossRef]
- Baglioni, E.; Campling, L.; Hanlon, G. Beyond rentiership: Standardisation, intangibles and value capture in global production. Environ. Plan. A 2023, 55, 1528–1547. [Google Scholar] [CrossRef]
- Quintas-Soriano, C.; Castro, A.J.; Castro, H.; Garcia-Llorente, M. Impacts of land use change on ecosystem services and implications for human well-being in Spanish drylands. Land Use Policy 2016, 54, 534–548. [Google Scholar] [CrossRef]
- Siddik, M.S.; Tulip, S.S.; Rahman, A.; Islam, M.N.; Haghighi, A.T.; Mustafa, S.M.T. The impact of land use and land cover change on groundwater recharge in northwestern Bangladesh. J. Environ. Manag. 2022, 315, 115130. [Google Scholar] [CrossRef] [PubMed]
- Hao, F.H.; Lai, X.H.; Ouyang, W.; Xu, Y.M.; Wei, X.F.; Song, K.Y. Effects of land use changes on the ecosystem service values of a reclamation farm in Northeast China. Environ. Manag. 2012, 50, 888–899. [Google Scholar] [CrossRef] [PubMed]
- Onaindia, M.; Fisher, J. Urban growth and biodiversity conservation. In Life on Land; Leal Filho, W., Azul, A.M., Brandli, L., Salvia, A.L., Wall, T., Eds.; Springer International Publishing: Cham, Switzerland, 2021; pp. 1069–1079. [Google Scholar]
- Qi, W.H.; Li, H.R.; Zhang, Q.F.; Zhang, K.R. Forest restoration efforts drive changes in land-use/land-cover and water-related ecosystem services in China’s Han River basin. Ecol. Eng. 2019, 126, 64–73. [Google Scholar] [CrossRef]
- Yin, J.R.; Liu, X.; Wang, H.; Huang, W.; Cai, E.X. Spatio-temporal variations of ecosystem service values in response to land use/cover change in Luoyang city. Front. Environ. Sci. 2022, 10, 984888. [Google Scholar] [CrossRef]
- Man, J.C.; Liu, J.X.; Cui, B.M.; Sun, Y.Q.; Sriboonchitta, S. Coupling and coordination between digital economy and Urban–Rural Integration in China. Sustainability 2023, 15, 7299. [Google Scholar] [CrossRef]
- Yang, Z.H.; Shen, N.N.; Qu, Y.B.; Zhang, B.L. Association between rural land use transition and urban–rural integration development: From 2009 to 2018 based on county-level data in Shandong province, China. Land 2021, 10, 1228. [Google Scholar] [CrossRef]
- Wang, Y.; Tian, L.; Wang, Z.Y.; Wang, C.Y.; Gao, Y. Effects of Transfer of Land Development Rights on Urban–Rural Integration: Theoretical Framework and Evidence from Chongqing, China. Land 2023, 12, 2045. [Google Scholar] [CrossRef]
- Xie, G.D.; Zhang, C.X.; Zhang, L.M.; Chen, W.H.; Li, S.M. Improvement of the evaluation method for ecosystem service value based on per unit area. J. Nat. Resour. 2015, 30, 1243–1254. (In Chinese) [Google Scholar]
- Song, W.; Deng, X.Z. Land-use/land-cover change and ecosystem service provision in China. Sci. Total Environ. 2017, 576, 705–719. [Google Scholar] [CrossRef]
- Sharma, M.; Kumar, V.; Kumar, S. A systematic review of urban sprawl and land use/land cover change studies in India. Sustain. Environ. 2024, 10, 2331269. [Google Scholar] [CrossRef]
- Yang, Y.J.; Zhang, H.; Zhao, X.Q.; Chen, Z.Z.; Wang, A.G.; Zhao, E.L.; Cao, H. Effects of urbanization on ecosystem services in the Shandong peninsula urban agglomeration, in China: The case of Weifang city. Urban Sci. 2021, 5, 54. [Google Scholar] [CrossRef]
- Bush, J.; Doyon, A. Building urban resilience with nature-based solutions: How can urban planning contribute? Cities 2019, 95, 102483. [Google Scholar] [CrossRef]
- Chaturvedi, V.; de Vries, W.T. Machine Learning Algorithms for Urban Land Use Planning: A Review. Urban Sci. 2021, 5, 68. [Google Scholar] [CrossRef]

| Subsystem | Indicator | Description | Attribute |
|---|---|---|---|
| Economic integration | Urban–rural income ratio | Urban per capita disposable income/rural per capita disposable income | Negative |
| Urban–rural consumption ratio | Urban per capita consumption/rural per capita consumption | Negative | |
| Engel coefficient ratio | Urban Engel coefficient/rural Engel coefficient | Positive | |
| Industrial structure | Value of secondary and tertiary industries/primary industry | Positive | |
| Population integration | Non-agricultural to agricultural employment | Secondary and tertiary industry employment/primary industry employment | Positive |
| Urban–rural density ratio | Urban population density/rural population density | Negative | |
| Urbanization level | Urban population/total population | Negative | |
| Education resources | Higher education students/regional population | Positive | |
| Social integration | Cultural and recreational expenditure ratio | Urban per capita cultural and recreational expenditure/rural per capita cultural and recreational expenditure | Negative |
| Healthcare expenditure ratio | Urban per capita healthcare expenditure/rural per capita healthcare expenditure | Negative | |
| Unemployment insurance coverage | Unemployment insurance participants/regional population | Positive | |
| Transportation and communication expenditure ratio | Urban per capita transportation and communication expenditure/rural per capita transportation and communication expenditure | Negative |
| Data Type | Specific Data Content | Data Source | Time Range | Spatial Coverage | Processing Method | Notes |
|---|---|---|---|---|---|---|
| Urban–rural integration index data | Income, consumption, employment, urbanization, education | China Urban Statistical Yearbook, Henan Statistical Yearbook | 1990–2020 | 17 cities in Henan Province | Data from yearbooks, normalized using min–max | Missing data interpolated |
| Land use data | Cropland, forest, grassland, water, built-up land | Resource and Environment Data Platform, CAS (http://www.resdc.cn/) | 1990, 2000, 2010, 2020 | Entire Henan Province | Processed with ArcGIS, accuracy > 85% | Spatial resolution: 30 m × 30 m |
| Grain production data | Total output, major crop yields, yield per unit area | Henan Statistical Yearbook | 1990–2020 | Henan Province and its cities | Calculated annual growth rates | Includes rice, wheat, corn |
| Grain price data | Prices of rice, wheat, corn | China Statistical Yearbook, China Statistical Information Network (http://www.ticn.org/) | 2020 | National average prices | Calculated weighted average prices | 2020 as base year |
| Ecosystem service value (ESV) coefficients | ESV factors for different land use types | Xie et al. (2015) [29] https://doi.org/10.11849/zrzyxb.2015.08.001 | 2015 | Applicable to China | Adjusted based on regional characteristics | Updated for Chinese ecosystems |
| Administrative boundary data | Boundaries of Henan and 17 cities | National Geomatics Center of China | 2020 version | Henan Province | Processed and projected with ArcGIS | 1:250,000 scale |
| City | 1990 | 2000 | 2010 | 2020 |
|---|---|---|---|---|
| Zhengzhou | 0.3467 | 0.392 | 0.4557 | 0.6268 |
| Kaifeng | 0.2926 | 0.3703 | 0.3115 | 0.4815 |
| Luoyang | 0.2612 | 0.3198 | 0.3471 | 0.4687 |
| Pingdingshan | 0.2471 | 0.2857 | 0.2952 | 0.5248 |
| Anyang | 0.3033 | 0.326 | 0.3424 | 0.6003 |
| Hebi | 0.3041 | 0.3722 | 0.3841 | 0.6175 |
| Xinxiang | 0.319 | 0.3878 | 0.4098 | 0.6014 |
| Jiaozuo | 0.3698 | 0.4682 | 0.4437 | 0.6505 |
| Puyang | 0.2752 | 0.3443 | 0.3124 | 0.6152 |
| Xuchang | 0.3367 | 0.3891 | 0.3992 | 0.6415 |
| Luohe | 0.2978 | 0.3567 | 0.3228 | 0.5528 |
| Sanmenxia | 0.297 | 0.3706 | 0.3718 | 0.5481 |
| Nanyang | 0.3088 | 0.3798 | 0.3677 | 0.5745 |
| Shangqiu | 0.2856 | 0.3551 | 0.3263 | 0.5894 |
| Xinyang | 0.3542 | 0.4192 | 0.4067 | 0.6078 |
| Zhoukou | 0.3161 | 0.4074 | 0.3373 | 0.5637 |
| Zhumadian | 0.3105 | 0.3818 | 0.3564 | 0.5291 |
| Land Use Transition Mode | City | Built-Up Land Transfer Ratio | Cultivated Land Transfer Ratio | Grassland Transfer Ratio | Forest Land Transfer Ratio | Unused Land Transfer Ratio | Water Area Transfer Ratio |
|---|---|---|---|---|---|---|---|
| Suburban development | Anyang | 11.96% | 67.91% | 12.53% | 6.51% | 0.29% | 0.80% |
| Hebi | 12.51% | 69.10% | 11.38% | 5.62% | 0.22% | 1.17% | |
| Jiaozuo | 12.72% | 66.64% | 4.89% | 13.15% | 0.08% | 2.53% | |
| Xinxiang | 13.26% | 71.18% | 7.77% | 4.91% | 0.30% | 2.58% | |
| Zhumadian | 11.20% | 75.27% | 3.46% | 7.58% | 0.00% | 2.48% | |
| Zhengzhou | 11.24% | 66.88% | 9.13% | 10.08% | 0.04% | 2.62% | |
| Agricultural intensification | Kaifeng | 15.32% | 81.37% | 0.11% | 1.27% | 0.28% | 1.65% |
| Pingdingshan | 9.43% | 63.81% | 7.20% | 16.27% | 0.01% | 3.29% | |
| Puyang | 16.54% | 80.62% | 0.25% | 0.66% | 0.08% | 1.84% | |
| Shangqiu | 19.08% | 79.01% | 0.30% | 0.56% | 0.01% | 1.04% | |
| Xinyang | 6.88% | 67.86% | 1.01% | 20.76% | 0.00% | 3.50% | |
| Luohe | 17.50% | 81.15% | 0.00% | 0.04% | 0.00% | 1.30% | |
| Xuchang | 15.36% | 79.13% | 0.05% | 1.87% | 0.00% | 0.59% | |
| Zhoukou | 18.15% | 80.43% | 0.00% | 0.38% | 0.00% | 1.04% | |
| Nanyang | 6.58% | 57.35% | 6.14% | 27.55% | 0.00% | 2.38% | |
| Ecological restoration | Luoyang | 4.75% | 45.10% | 9.58% | 38.35% | 0.01% | 2.21% |
| Sanmenxia | 2.79% | 33.61% | 19.04% | 42.73% | 0.04% | 1.79% |
| Land Use Transfer Mode | City | Built-Up Land Transfer Ratio (%) | Cultivated Land Transfer Ratio (%) | Grassland Transfer Ratio (%) | Forest Land Transfer Ratio (%) | Unused Land Transfer Ratio (%) | Water Area Transfer Ratio (%) |
|---|---|---|---|---|---|---|---|
| Urban expansion | Jiaozuo | 16.50% | 63.77% | 4.28% | 12.12% | 0.08% | 3.25% |
| Luohe | 19.63% | 79.31% | 0.00% | 0.00% | 0.00% | 1.05% | |
| Shangqiu | 17.19% | 81.39% | 0.29% | 0.37% | 0.00% | 0.75% | |
| Xuchang | 16.88% | 77.34% | 3.00% | 2.09% | 0.00% | 0.70% | |
| Zhengzhou | 22.54% | 61.10% | 5.25% | 7.45% | 0.00% | 3.66% | |
| Zhoukou | 17.35% | 81.40% | 0.00% | 0.18% | 0.00% | 1.06% | |
| Suburban development | Anyang | 13.72% | 67.01% | 12.26% | 6.33% | 0.00% | 0.68% |
| Hebi | 13.06% | 69.16% | 11.03% | 5.67% | 0.06% | 1.02% | |
| Xinxiang | 14.66% | 70.06% | 7.51% | 4.77% | 0.09% | 2.92% | |
| Nanyang | 6.55% | 56.59% | 6.47% | 27.59% | 0.00% | 2.80% | |
| Xinyang | 7.94% | 63.60% | 0.88% | 23.47% | 0.01% | 4.09% | |
| Agricultural intensification | Kaifeng | 16.26% | 80.97% | 0.16% | 0.49% | 0.00% | 2.12% |
| Zhumadian | 3.16% | 81.95% | 3.90% | 8.32% | 0.00% | 2.66% | |
| Ecological restoration | Luoyang | 6.32% | 43.39% | 9.63% | 38.20% | 0.02% | 2.44% |
| Pingdingshan | 10.73% | 62.31% | 6.48% | 16.75% | 0.00% | 3.72% | |
| Puyang | 18.82% | 78.49% | 0.19% | 0.30% | 0.00% | 2.19% | |
| Sanmenxia | 3.53% | 35.06% | 16.72% | 43.03% | 0.01% | 1.65% |
| Land Use Transfer Mode | City | Built-Up Land Transfer Ratio (%) | Cultivated Land Transfer Ratio (%) | Grassland Transfer Ratio (%) | Forest Land Transfer Ratio (%) | Unused Land Transfer Ratio (%) | Water Area Transfer Ratio (%) |
|---|---|---|---|---|---|---|---|
| Urban expansion | Jiaozuo | 16.50% | 63.77% | 4.28% | 12.12% | 0.08% | 3.25% |
| Luohe | 19.63% | 79.31% | 0.00% | 0.00% | 0.00% | 1.05% | |
| Shangqiu | 17.19% | 81.39% | 0.29% | 0.37% | 0.00% | 0.75% | |
| Xuchang | 16.88% | 77.34% | 3.00% | 2.09% | 0.00% | 0.70% | |
| Zhengzhou | 22.54% | 61.10% | 5.25% | 7.45% | 0.00% | 3.66% | |
| Zhoukou | 17.35% | 81.40% | 0.00% | 0.18% | 0.00% | 1.06% | |
| Suburban development | Anyang | 13.72% | 67.01% | 12.26% | 6.33% | 0.00% | 0.68% |
| Hebi | 13.06% | 69.16% | 11.03% | 5.67% | 0.06% | 1.02% | |
| Xinxiang | 14.66% | 70.06% | 7.51% | 4.77% | 0.09% | 2.92% | |
| Nanyang | 6.55% | 56.59% | 6.47% | 27.59% | 0.00% | 2.80% | |
| Xinyang | 7.94% | 63.60% | 0.88% | 23.47% | 0.01% | 4.09% | |
| Agricultural intensification | Kaifeng | 16.26% | 80.97% | 0.16% | 0.49% | 0.00% | 2.12% |
| Zhumadian | 3.16% | 81.95% | 3.90% | 8.32% | 0.00% | 2.66% | |
| Ecological restoration | Luoyang | 6.32% | 43.39% | 9.63% | 38.20% | 0.02% | 2.44% |
| Sanmenxia | 3.53% | 35.06% | 16.72% | 43.03% | 0.01% | 1.65% | |
| Pingdingshan | 10.73% | 62.31% | 6.48% | 16.75% | 0.00% | 3.72% | |
| Puyang | 18.82% | 78.49% | 0.19% | 0.30% | 0.00% | 2.19% |
| City | 1990 | 2000 | 2010 | 2020 |
|---|---|---|---|---|
| Zhengzhou | 117.2042244 | 95.67861136 | 92.19425031 | 92.63029581 |
| Kaifeng | 58.82361921 | 48.98748717 | 51.46931213 | 52.41966996 |
| Luoyang | 300.2889879 | 298.0636036 | 300.7922355 | 303.8360443 |
| Pingdingshan | 120.5560029 | 118.7128742 | 122.8159578 | 122.6778042 |
| Anyang | 72.38519433 | 71.91313918 | 69.38003382 | 69.04721794 |
| Hebi | 21.23785009 | 21.15062937 | 20.5982672 | 20.23752765 |
| Xinxiang | 106.9544213 | 91.6880712 | 94.30370748 | 94.97833662 |
| Jiaozuo | 63.34585126 | 51.58125783 | 53.19060592 | 54.39988265 |
| Puyang | 37.89219844 | 33.63583842 | 34.61674825 | 34.29908848 |
| Xuchang | 35.03737244 | 34.67965077 | 35.22157625 | 35.4854215 |
| Luohe | 18.90902576 | 18.68989236 | 17.39017732 | 17.26478373 |
| Sanmenxia | 214.5369692 | 213.211832 | 208.753588 | 210.9302537 |
| Nanyang | 452.4203637 | 441.3469584 | 457.7142649 | 474.6409808 |
| Shangqiu | 74.94906559 | 71.26190326 | 67.9544435 | 68.27141462 |
| Xinyang | 303.9439301 | 298.3362439 | 324.4378561 | 321.9208588 |
| Zhoukou | 80.03765528 | 79.4261444 | 79.78374036 | 79.70027858 |
| Zhumadian | 160.0255907 | 169.1454564 | 165.9352279 | 164.6745484 |
| 1990–2000 | 2000–2010 | 2010–2020 | 1990–2020 | Average | |
|---|---|---|---|---|---|
| Zhengzhou | 3.40 | 0.14 | 0.04 | 0.58 | 1.19 |
| Kaifeng | 5.09 | 1.73 | 0.44 | 1.66 | 2.42 |
| Luoyang | 0.37 | 0.24 | 0.33 | 0.14 | 0.31 |
| Pingdingshan | 0.28 | 0.77 | 0.03 | 0.15 | 0.36 |
| Anyang | 0.50 | 0.99 | 0.12 | 0.55 | 0.54 |
| Hebi | 0.11 | 1.95 | 0.25 | 0.42 | 0.77 |
| Xinxiang | 3.28 | 0.81 | 0.16 | 1.31 | 1.42 |
| Jiaozuo | 4.38 | 0.34 | 0.54 | 1.02 | 1.76 |
| Puyang | 4.49 | 0.55 | 0.18 | 0.81 | 1.74 |
| Xuchang | 0.53 | 0.42 | 0.17 | 0.13 | 0.37 |
| Luohe | 0.45 | 1.63 | 0.19 | 0.83 | 0.75 |
| Sanmenxia | 0.26 | 0.41 | 0.55 | 0.31 | 0.4 |
| Nanyang | 1.29 | 2.34 | 0.91 | 1.06 | 1.51 |
| Shangqiu | 1.66 | 0.97 | 0.06 | 1.69 | 0.90 |
| Xinyang | 1.07 | 0.99 | 0.76 | 0.67 | 0.94 |
| Zhoukou | 0.79 | 0.22 | 0.02 | 0.11 | 0.34 |
| Zhumadian | 1.87 | 2.22 | 0.21 | 0.45 | 1.43 |
Disclaimer/Publisher’s Note: The statements, opinions and data contained in all publications are solely those of the individual author(s) and contributor(s) and not of MDPI and/or the editor(s). MDPI and/or the editor(s) disclaim responsibility for any injury to people or property resulting from any ideas, methods, instructions or products referred to in the content. |
© 2024 by the authors. Licensee MDPI, Basel, Switzerland. This article is an open access article distributed under the terms and conditions of the Creative Commons Attribution (CC BY) license (https://creativecommons.org/licenses/by/4.0/).
Share and Cite
Liang, X.; Zhang, P. Relationship Between Land Use Transformation and Ecosystem Service Value in the Process of Urban–Rural Integration: An Empirical Study of 17 Prefecture-Level Cities in Henan Province, China. Sustainability 2024, 16, 9029. https://doi.org/10.3390/su16209029
Liang X, Zhang P. Relationship Between Land Use Transformation and Ecosystem Service Value in the Process of Urban–Rural Integration: An Empirical Study of 17 Prefecture-Level Cities in Henan Province, China. Sustainability. 2024; 16(20):9029. https://doi.org/10.3390/su16209029
Chicago/Turabian StyleLiang, Xin, and Pei Zhang. 2024. "Relationship Between Land Use Transformation and Ecosystem Service Value in the Process of Urban–Rural Integration: An Empirical Study of 17 Prefecture-Level Cities in Henan Province, China" Sustainability 16, no. 20: 9029. https://doi.org/10.3390/su16209029
APA StyleLiang, X., & Zhang, P. (2024). Relationship Between Land Use Transformation and Ecosystem Service Value in the Process of Urban–Rural Integration: An Empirical Study of 17 Prefecture-Level Cities in Henan Province, China. Sustainability, 16(20), 9029. https://doi.org/10.3390/su16209029