Article

Prospects for Long-Distance Cascaded Liquid—Gaseous Hydrogen Delivery: An Economic and Environmental Assessment

1
School of Engineering, Sichuan Normal University, Chengdu 610101, China
2
Business School, Sichuan Normal University, Chengdu 610101, China
3
Maglev Transportation Engineering R&D Center, Tongji University, Shanghai 201804, China
4
Clare Hall, University of Cambridge, Cambridge CB3 9AL, UK
*
Authors to whom correspondence should be addressed.
Sustainability 2024, 16(20), 8839; https://doi.org/10.3390/su16208839
Submission received: 23 September 2024 / Revised: 9 October 2024 / Accepted: 10 October 2024 / Published: 12 October 2024

Abstract

:
As an important energy source to achieve carbon neutrality, green hydrogen has always faced the problems of high use cost and unsatisfactory environmental benefits due to its remote production areas. Therefore, a liquid-gaseous cascade green hydrogen delivery scheme is proposed in this article. In this scheme, green hydrogen is liquefied into high-density and low-pressure liquid hydrogen to enable the transport of large quantities of green hydrogen over long distances. After long-distance transport, the liquid hydrogen is stored and then gasified at transfer stations and converted into high-pressure hydrogen for distribution to the nearby hydrogen facilities in cities. In addition, this study conducted a detailed model evaluation of the scheme around the actual case of hydrogen energy demand in Chengdu City in China and compared it with conventional hydrogen delivery methods. The results show that the unit hydrogen cost of the liquid-gaseous cascade green hydrogen delivery scheme is only 51.58 CNY/kgH2, and the dynamic payback periods of long- and short-distance transportation stages are 13.61 years and 7.02 years, respectively. In terms of carbon emissions, this scheme only generates indirect carbon emissions of 2.98 kgCO2/kgH2 without using utility electricity. In sum, both the economic and carbon emission analyses demonstrate the advantages of the liquid-gaseous cascade green hydrogen delivery scheme. With further reductions in electricity prices and liquefication costs, this scheme has the potential to provide an economically/environmentally superior solution for future large-scale green hydrogen applications.

1. Introduction

In order to achieve carbon peak and carbon neutrality, China has proposed in the Medium- and Long-Term Plan for the Development of Hydrogen Energy Industry (2021–2035) that by 2025, great progress will be made in hydrogen production from clean energy and hydrogen storage and transportation technology, hydrogen production from renewable energy will reach 100,000–200,000 tons per year, and a number of hydrogen filling stations will be deployed and built. Hydrogen produced from renewable energy has lower carbon emissions, but most of the hydrogen produced in China currently comes from fossil fuels, and green hydrogen accounts for less than 1% [1]. The proposal of the dual carbon target means that China will accelerate the transformation from gray hydrogen to green hydrogen [2,3].
The western region of China is currently witnessing the construction of numerous renewable energy power generation facilities, which possess abundant green hydrogen resources capable of fulfilling China’s self-sufficiency in carbon-free hydrogen energy [4]. Most regions abundant in renewable energy lack sufficient local energy consumption capacity and are located at a certain distance from the energy load center [5,6], resulting in a regional mismatch between hydrogen production capacity and downstream application upon the widespread realization of green hydrogen [7]. Therefore, to achieve the large-scale application of green hydrogen, it is crucial to consider the storage and transportation of hydrogen, as the cost associated with these processes will significantly impact the final utilization cost of green hydrogen [8,9].
At present, the three mainstream transportation modes of hydrogen are gaseous hydrogen (GH2) pipelines, GH2 transport vehicles, and liquid hydrogen (LH2) transport vehicles [10,11]. The rigidity of GH2 pipelines and their higher initial investment make them suitable only for point-to-point transmission of large volumes of hydrogen [12]. GH2 vehicle transport offers greater flexibility, but a typical 20 MPa GH2 transport vehicle can only accommodate 350 kg of hydrogen, greatly limiting its transport efficiency [13,14]. Compared with GH2 transport vehicles, the LH2 transporter exhibits a significantly higher hydrogen storage density, with a single vehicle capable of transporting 4000 kg of hydrogen, surpassing the GH2 transport vehicle by more than tenfold. This provides evident advantages in scenarios requiring large-scale hydrogen transportation [15,16]. However, the LH2 transport vehicle also faced some problems. Most of the existing hydrogen refueling stations are GH2 refueling stations with a size of 500 kg/day to 1000 kg/day [17,18]. The hydrogen refueling station served by the LH2 transport vehicle must add an LH2 gasification unit, which will increase the investment cost. In addition, the spacing between multiple hydrogen refueling stations will also lead to an increase in vehicle transportation distance and time. This increases evaporation losses and fuel consumption generated during transportation [19,20], raising operating costs. The above three modes of hydrogen storage and transportation have been fully verified in actual projects. At present, various standards have been established to support the use of GH2 and LH2, and the relevant equipment has high safety standards to realize the safe use of hydrogen [21]. In addition, organic liquid hydrogen storage and solid hydrogen storage are also the current research hotspots of hydrogen storage and transportation technology; methanol, liquid ammonia, and porous silicon SI+ are more typical examples [22]. The common point of organic liquid hydrogen storage and solid hydrogen storage is that both can avoid harsh conditions such as high pressure or low temperature required for physical transportation of hydrogen to a certain extent and have better safety and economy [23,24]. However, due to the complexity of the process, the other two methods of hydrogen storage and transportation have not been commercialized.
The problems faced by LH2 transport vehicles in practical application can be alleviated by establishing a liquid-gas cascade transportation scheme. The LH2 transport vehicle only undertakes the long-distance transport task. After vaporizing at the hydrogen transfer station [25], the transported LH2 is connected with the nearby hydrogen energy facilities through the GH2 transport vehicle. Compared with the existing point-to-point hydrogen energy transportation scheme, the liquid-gas cascade transportation scheme can use the advantages of high storage density of liquid hydrogen, transport a large amount of hydrogen efficiently, and greatly reduce transportation costs and energy consumption. The problem of the mismatch between liquid hydrogen transportation and existing hydrogen energy facilities and the need to purchase new equipment has also been solved through the hydrogen transfer station. In summary, the liquid-gas cascade transportation scheme significantly reduces transportation costs and energy consumption while avoiding additional initial investment. However, to the best of our knowledge, no studies have been carried out to provide a comprehensive economic evaluation and system-level analysis of liquid-gas cascade transport options for hydrogen. Meanwhile, previous literature has not fully considered the energy consumption and carbon emissions of hydrogen throughout its life cycle, from production to use, nor has it introduced cost analyses to assess the payback period from an engineering economics perspective. Therefore, this study designs a complete liquid-gas cascade green hydrogen supply scheme around the actual hydrogen use case in Chengdu city and provides a detailed feasibility analysis of the scheme.
Different from those existing studies on single hydrogen storage and transport methods, this article explores a new type of green hydrogen supply scheme applicable to the current situation of hydrogen energy development in China. The novelties and contributions can be summarized as follows:
(1)
Taking the future hydrogen demand of Chengdu City as an example, a liquid-gas cascade green hydrogen supply scheme from Qinghai to Chengdu is proposed. The scheme makes full use of the surplus renewable energy in Qinghai province for the electrolysis of water to produce hydrogen and uses a cascade storage and transport scheme to maximize the advantages of LH2 transport and GH2 transport, and the transport vehicle also uses hydrogen-powered vehicles. While lowering the cost of hydrogen, it also significantly reduces the amount of indirect carbon emissions generated during the process, with no direct CO2 emissions throughout the entire transport process.
(2)
Based on the actual costs and performance of the equipment, an economic model and a carbon emission model of the liquid-gas cascade green hydrogen supply scheme are established. The model systematically analyzes the economic and environmental benefits, taking into account the costs of operation and maintenance and the consumption of various energy sources. Finally, a static/dynamic payback period analysis and a carbon emission analysis are performed to evaluate the economics and emission reduction capability of the scheme, providing a universal evaluation method for the practical development and use of liquid-gas cascade transport schemes.

2. Overall Framework and Principle

Chengdu’s hydrogen energy industry development plan proposes to build 40 hydrogen refueling stations in 2023–2025; in the long-term goal of 2025–2030, it is proposed to build about 100 hydrogen refueling stations, and the proportion of green hydrogen is more than 75%; By 2030, it will fully transform to green hydrogen operation mode [26]. Referring to the hydrogen energy demand proposed in the plan, this paper designs the liquid-gas cascade green hydrogen supply scheme (Route 1) from Qinghai to Chengdu. The scheme adopts the mixed transportation mode of long-distance liquid hydrogen transportation and short-distance gas-hydrogen transportation, which can simultaneously meet the daily hydrogen energy demand of twenty 1000 kg hydrogen refueling stations and twenty 500 kg hydrogen refueling stations, and the daily hydrogen transportation volume is 28 tons.
Route 1 gives priority to the use of excess wind and solar energy in Qinghai Province for the electrolysis of water to produce H2. The H2 produced is liquefied and deposited in the LH2 storage tanks in the hydrogen plant, then transported to the H2 transfer station around Chengdu City by LH2 transporters, and finally the transported LH2 is centrally stored in the H2 transit station. The above is the long-distance transport component, which includes three stages: H2 production, LH2 transport, and H2 transit station. The LH2 transporter operates from the hydrogen plant to the H2 transit station, a distance of 1050 km, and transports 28,000 kg of LH2 daily. The short-distance transport component consists of two stages: GH2 transport and H2 refueling stations. The H2 transit stations gasify and pressurize a quantitative amount of LH2 according to the specific hydrogen requirements before transporting it to the individual H2 refueling stations by GH2 transporters. The GH2 transporter operates from the H2 transit station to each H2 refueling station over a distance of 0–70 km, and the amount of H2 transported in a single day depends on the H2 demand of each H2 refueling station, which is typically 500 kg. The energy distribution, transformation, and transmission in Route 1 are shown in Figure 1.
As a comparison, the LH2 transport scheme (Route 2) and the GH2 transport scheme (Route 3) of the same scale are additionally designed in this paper. Unlike Route 1, there are no H2 transit stations in Route 2 and Route 3, and the transporters operate from the hydrogen plants to the various H2 refueling stations. In Route 2, the H2 produced by electrolysis is liquefied and then transported directly to H2 refueling stations by LH2 transporters, each of which is required to meet the hydrogen demand of several H2 refueling stations. Route 3 does not involve LH2 throughout the process, and the H2 produced by electrolysis is pressurized and transported to H2 refueling stations by GH2 transporters. The three routes differ in the equipment required at each stage due to the different modes of transport, as shown in Figure 2.

3. System Modeling

3.1. H2 Production Stage

The main equipment involved in the H2 production stage is the H2 production equipment and the H2 storage tank [27]. All three routes used electrolysis of water to obtain H2 [28], and the mass of H2 produced (liquefier input) was 29,863 kg per day. The Alkaline Water Electrolysis (AWE) technology selected in this paper is the most economically optimal way to produce H2 from electrolytic water [29], with a market share of 97% in 2022. Compared with AWE, Proton Exchange Membrane (PEM) and Solid Oxide Water Electrolysis (SOEC) water electrolysis technology have higher efficiency [30]. The SOEC water electrolysis technology requires additional energy to ensure the high-temperature environment required for its operation, so the technology is more suitable for scenarios with suitable heat sources. As of now, the technology is still in the early stages of commercialization [31]. PEM technology has been applied in many new projects and gradually promoted, but the problems of short life and high cost of PEM electrolyzers still exist. At present, the average hydrogen production cost of the AWE electrolyzer is 33.37 CNY/kgH2, while the average hydrogen production cost of the PEM electrolyzer is 50.97 CNY/kgH2. Among them, the equipment investment of the PEM electrolyzer is 3–5 times that of the AWE electrolyzer [32,33].
In addition to the high purity H2 obtained when producing H2 from electrolytic water, a high-value by-product of high-purity green oxygen (up to 99.995% concentration after dewatering and dehydrogenation) can also be brought about [34]. The specific parameters of the selected AWE electrolyzer are shown in Table 1 [35,36].
Electricity for electrolysis consists of excess wind power and solar power not connected to the grid in Qinghai Province, and electricity is uniformly delivered by the grid. Qinghai Province launched the PV parity project and large industrial grid-connected electricity price time-sharing policy. The design of the electrolysis tank operation time for the day was 23:00 to 17:00 the next day, avoiding most of the peak power hours and reducing the grid load while saving the cost of H2 production [37,38].
The hydrogen plant storage equipment for Route 1 and Route 2 is LH2 storage tanks, while Route 3 stores GH2 [39].

3.2. LH2 Transport

Route 1 and Route 2 both use LH2 transporters for long-distance transport. Route 1 has a H2 refueling station, and the truck only needs to deliver LH2 from the hydrogen plant to the H2 transit station 1050 km away; in Route 2, a single LH2 truck needs to deliver LH2 to multiple H2 refueling stations in Chengdu, and the distance between each H2 refueling station increases the distance of Route 2 compared to Route 1, and unloading multiple times also prolongs the truck’s running time and increases H2 losses [40]. The distance from the hydrogen plant to Chengdu is about 1100 km, and the total operating distance of Route 2 is 1500 km after the 50 km between H2 refueling stations is taken into account.
The equipment involved in LH2 transport is the LH2 transporter and the liquefier, and the specific parameters of the hydrogen energy LH2 transporter are shown in Table 2 [41,42].
The selected H2 liquefier has a maximum liquefaction capacity of 15,000 kg/d [43]. Since LH2 has H2 losses when it is produced, transported, and stored, it needs to be liquefied by producing more H2 than the actual hydrogen demand. Liquefier input mliq (kg) is calculated by [44]:
m l i q = m d / φ l i q / φ d e l / φ s t o ,
where md is the daily H2 demand in Chengdu, kg; φliq, φdel, and φsto are the mass efficiencies of liquefaction, transport, and storage, with typical values of 99.5%, 94.5%, and 99.7%.
The energy requirement Eliq (kWh/kgH2) for each unit of H2 liquefied is calculated by:
E l i q = 13.382 × ( m l i q / N / 1000 ) 0.1 ,
where N is the number of liquefiers; in the example, 2 liquefiers are required.

3.3. GH2 Transport

Currently, GH2 transport technology is mature, and most of the existing H2 refueling, storage, and transport facilities are constructed with GH2 as the energy carrier [45,46]. The use of GH2 transport can be well adapted to the existing H2 refueling and use facilities in Chengdu and is more suitable for the complex traffic situation within the city. Route 1 and Route 3 both involve GH2 transport, and the GH2 transporter in Route 1 is only tasked with short-distance, small-scale transport between H2 transit stations and individual H2 refueling stations within 70 km. In Route 3, the H2 is transported by GH2 transporters from the hydrogen plant to the H2 refueling stations. The H2 produced by electrolysis is compressed and transported to Chengdu by the GH2 transporter.
The equipment involved in GH2 transport is the GH2 transporter and compressor, and the specific parameters of the hydrogen energy GH2 transporter are shown in Table 3 [41,42]. The selected H2 compressor power Pcom (kW) is calculated by [44]:
P c o m = Z m R T × k η ( k 1 ) × [ ( P o u t l e t P i n l e t ) k 1 k 1 ] ,
where Z is the average compressibility factor; m is the mass flow rate, kg/s; R is the universal gas constant, 8.3144 KJ/kg-mole-°K; T is the inlet gas temperature, °K; η is the efficiency, 75%; k is 1.4; and Poutlet and Pinlet are the outlet and inlet pressures.
The daily H2 compressor energy consumption Ecom (kWh/d) is calculated by:
E c o m = P c o m × t d i s p e n i n g / η e l e ,
where ηele is the compressor efficiency, typically 90%; tdispening is the daily running time, h.

3.4. H2 Transit Stage

The main equipments at the H2 transit station mainly include the LH2 storage tank and the gasifier [47]. Currently, the main function of the transit station is to store and redistribute H2 according to the hydrogen consumption in Chengdu, but the development plan of Chengdu proposes to increase the scale of H2 export for nearby cities, so there is an increased need for a large-scale H2 transit station to carry out unified planning and scheduling for the city’s input and output of H2. In addition, the LH2 storage tank also provides an on-site cryogenic operating condition for integrating various advanced superconducting power devices in future cryogenic energy networks [48,49].

3.5. H2 Refueling Stations Stage

H2 refueling stations are mainly composed of H2 storage tanks, compressors, high-pressure tanks, pre-cooling units, and dispensers, but the equipment for H2 refueling stations varies slightly depending on the mode of transport [50]. In this paper, we take the common 500 kg refueling station in China as an example. It has a peak flow rate of 26 kgH2/h and operates 24 h daily.
The H2 delivery method in Route 1 and Route 3 is GH2 delivery, so the H2 storage device at the H2 refueling stations is the GH2 tank. As the GH2 transport pressure does not reach the distribution pressure, it needs to be further pressurized by the compressor and cooled to meet the distributor’s operating requirements. In Route 2, the station H2 storage tanks are LH2 tanks, which also need to be equipped with additional gasifiers [51]. The function of the high-pressure tank is to supply H2 to meet peak demand during periods of high H2 requirements. In general, 35 MPa H2 refueling stations should be equipped with 45 MPa high-pressure tanks. The formula for calculating the capacity of the high-pressure tank, CH (kg), is calculated by [52]:
C H = m p e a k × S F ,
where mpeak is the total mass to be delivered at peak time, kg; SF is the safety factor, generally 1.2.
The H2 needs to be cooled before distribution, and the pre-cooling unit energy consumption Epcu (kWh/kgH2) is calculated by [53]:
E p c u = 0.3 1.6 × e 0.018 × T a m b + [ 25 × ln T a m b 21 D D H 2 ] ,
where DDH2 is the daily demand of H2, kg/d, and Tamb is the ambient temperature, 27 °C.

4. Economic Analysis

4.1. Methods of Economic Calculation

The cost of hydrogen use C in all phases consists of both capital and operating costs. C is calculated by [54]:
C = A C C + O P C ,
where the annual cost of capital (ACC) can be calculated by multiplying the total initial cost of capital (TCC) and the Capital Recovery Factor (CRF). The TCC is composed of the total price of the unit (TPU) plus any additional expenditures. Additional costs include conventional facility costs, engineering permits, and start-up costs, contingency handling costs, and miscellaneous land costs, which can be calculated by multiplying the TPU by an experience factor (EF) [55]. The CRF can be calculated from the discount rate and the lifetime of the equipment. ACC, TCC, and CRF are calculated by [56]:
A C C = T C C × C R F ,
T C C = T P U + T P U × E F ,
C R F = i ( 1 + i ) t ( 1 + i ) t 1 .
Operating costs (OPC) include the cost of raw materials for production, fuel (gas, diesel, coal, etc.), labor costs, non-fuel OandM costs, fixed costs, and the cost of by-products sold at market price, as calculated by [57]:
O P C = C f e e d + C u t i + C l a b + C O & M + C b y p .
The total cost of H2 use (RMB/kgH2) can be calculated by adding up the costs of all stages. The total H2 cost (CH) is calculated by:
C H = C p r o + C t r a 1 + C t r a n s i t + C t r a 2 + C d i s ,
where Cpro, Ctra1, Ctransit, Ctra2, and Cdis are the unit H2 costs for the five stages of H2 production, long-distance transport, transit, short-distance transport, and distribution, respectively. The raw material prices and by-product selling prices used in this paper are shown in Table 4 [58], the economic assumptions used are shown in Table 5, and the prices of the main equipment used are shown in Table 6.

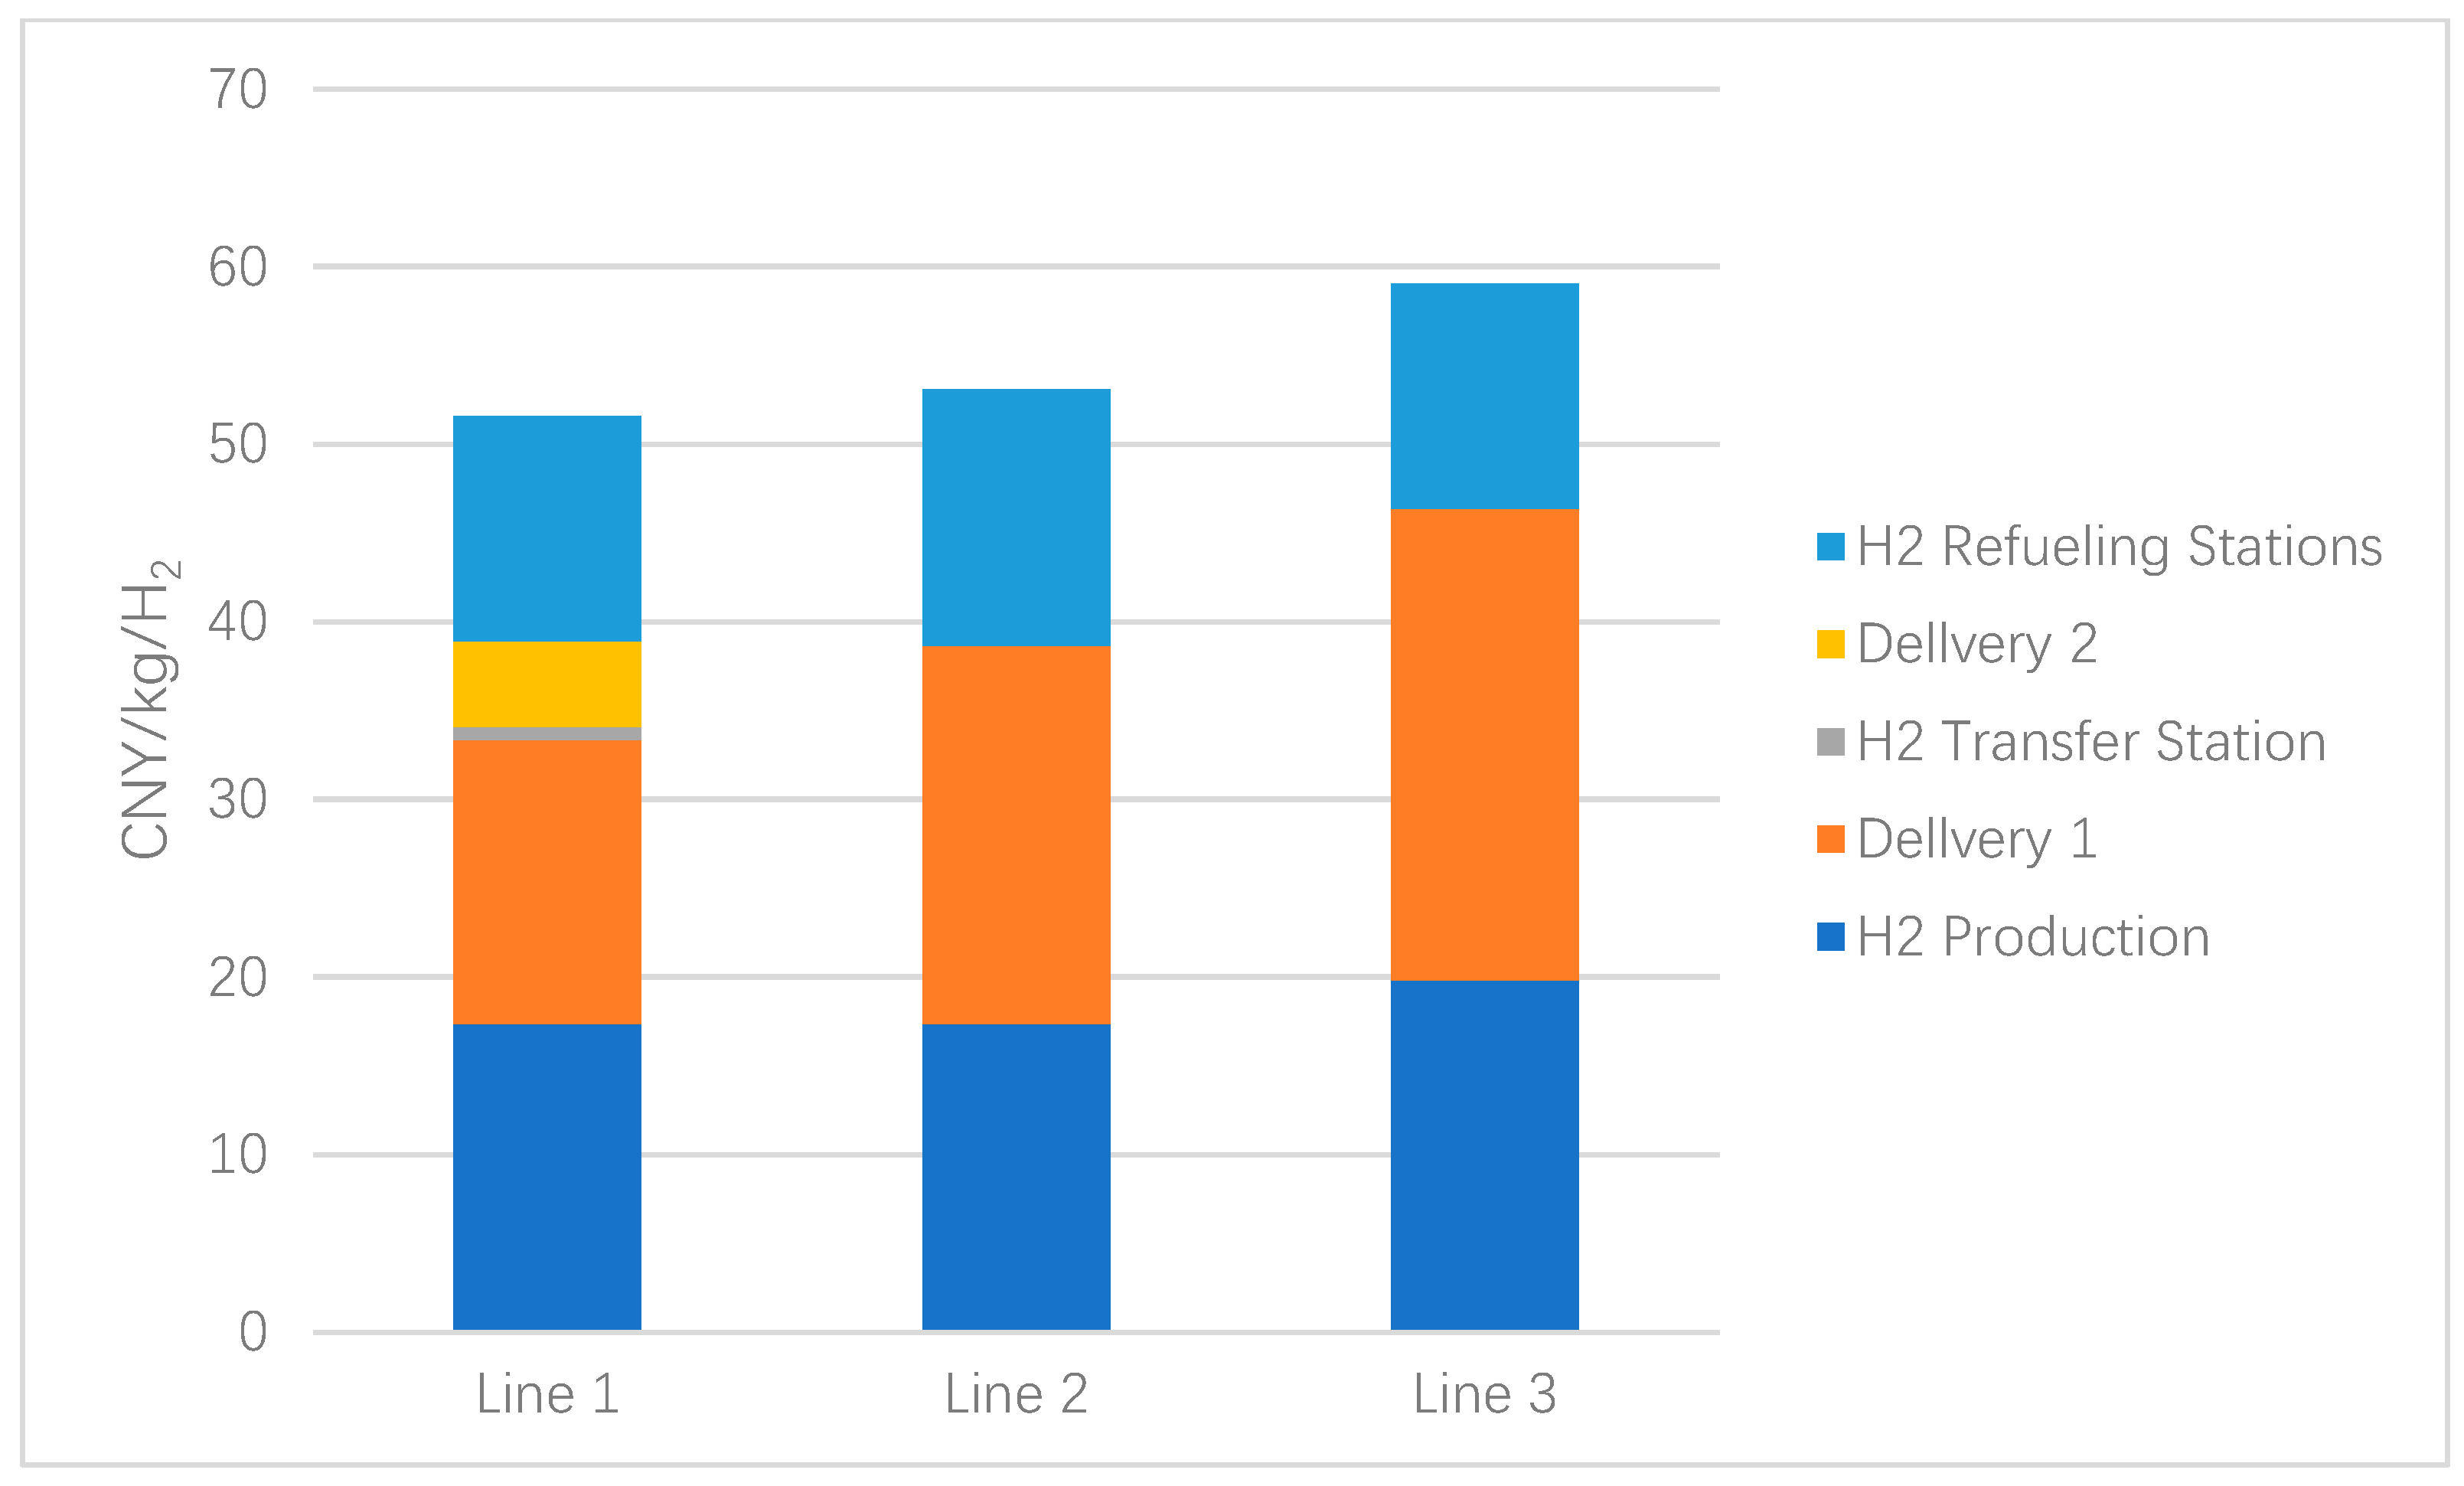
4.2. Results of Economic Calculations

After modeling, the total H2 cost of Route 1 was calculated to be 51.5825 CNY/kgH2; Route 2 was calculated to be 53.1102 CNY/kgH2, and Route 3 was calculated to be 59.0321 CNY/kgH2. The specific cost components of the three routes are shown in Figure 3 and Figure 4.
In Route 1, the three parts of H2 production, LH2 transport, and H2 transit station have a carrier scale of 28,000 kgH2/day, and the cost of H2 is 17.372, 15.952, and 0.765 CNY/kgH2, respectively, for a total of 34.089 CNY/kgH2, and the initial investment is RMB 336.46 million, RMB 1111.39 million, and RMB 73.67 million, respectively, for a total of RMB 1521.52 million. The scale of carriage for the GH2 transport and H2 refueling stations component is 500 kgH2/day. The costs were 4.822 and 12.671 CNY/kgH2, totaling 17.493 CNY/kgH2, and the initial investments were RMB 9.28 million and RMB 17.34 million, totaling RMB 26.62 million.
In Route 1, the stages where the cost will fluctuate with the change in electricity price are hydrogen production, long-distance transportation, and hydrogen refueling stations. Their variation curves are shown in Figure 5. In addition, with the progress of the electrolysis process and the liquefication process, the initial investment of the related equipment will be further reduced, and the hydrogen cost will also fall.

4.3. Capital Recovery, Profitability, and Government Subsidies
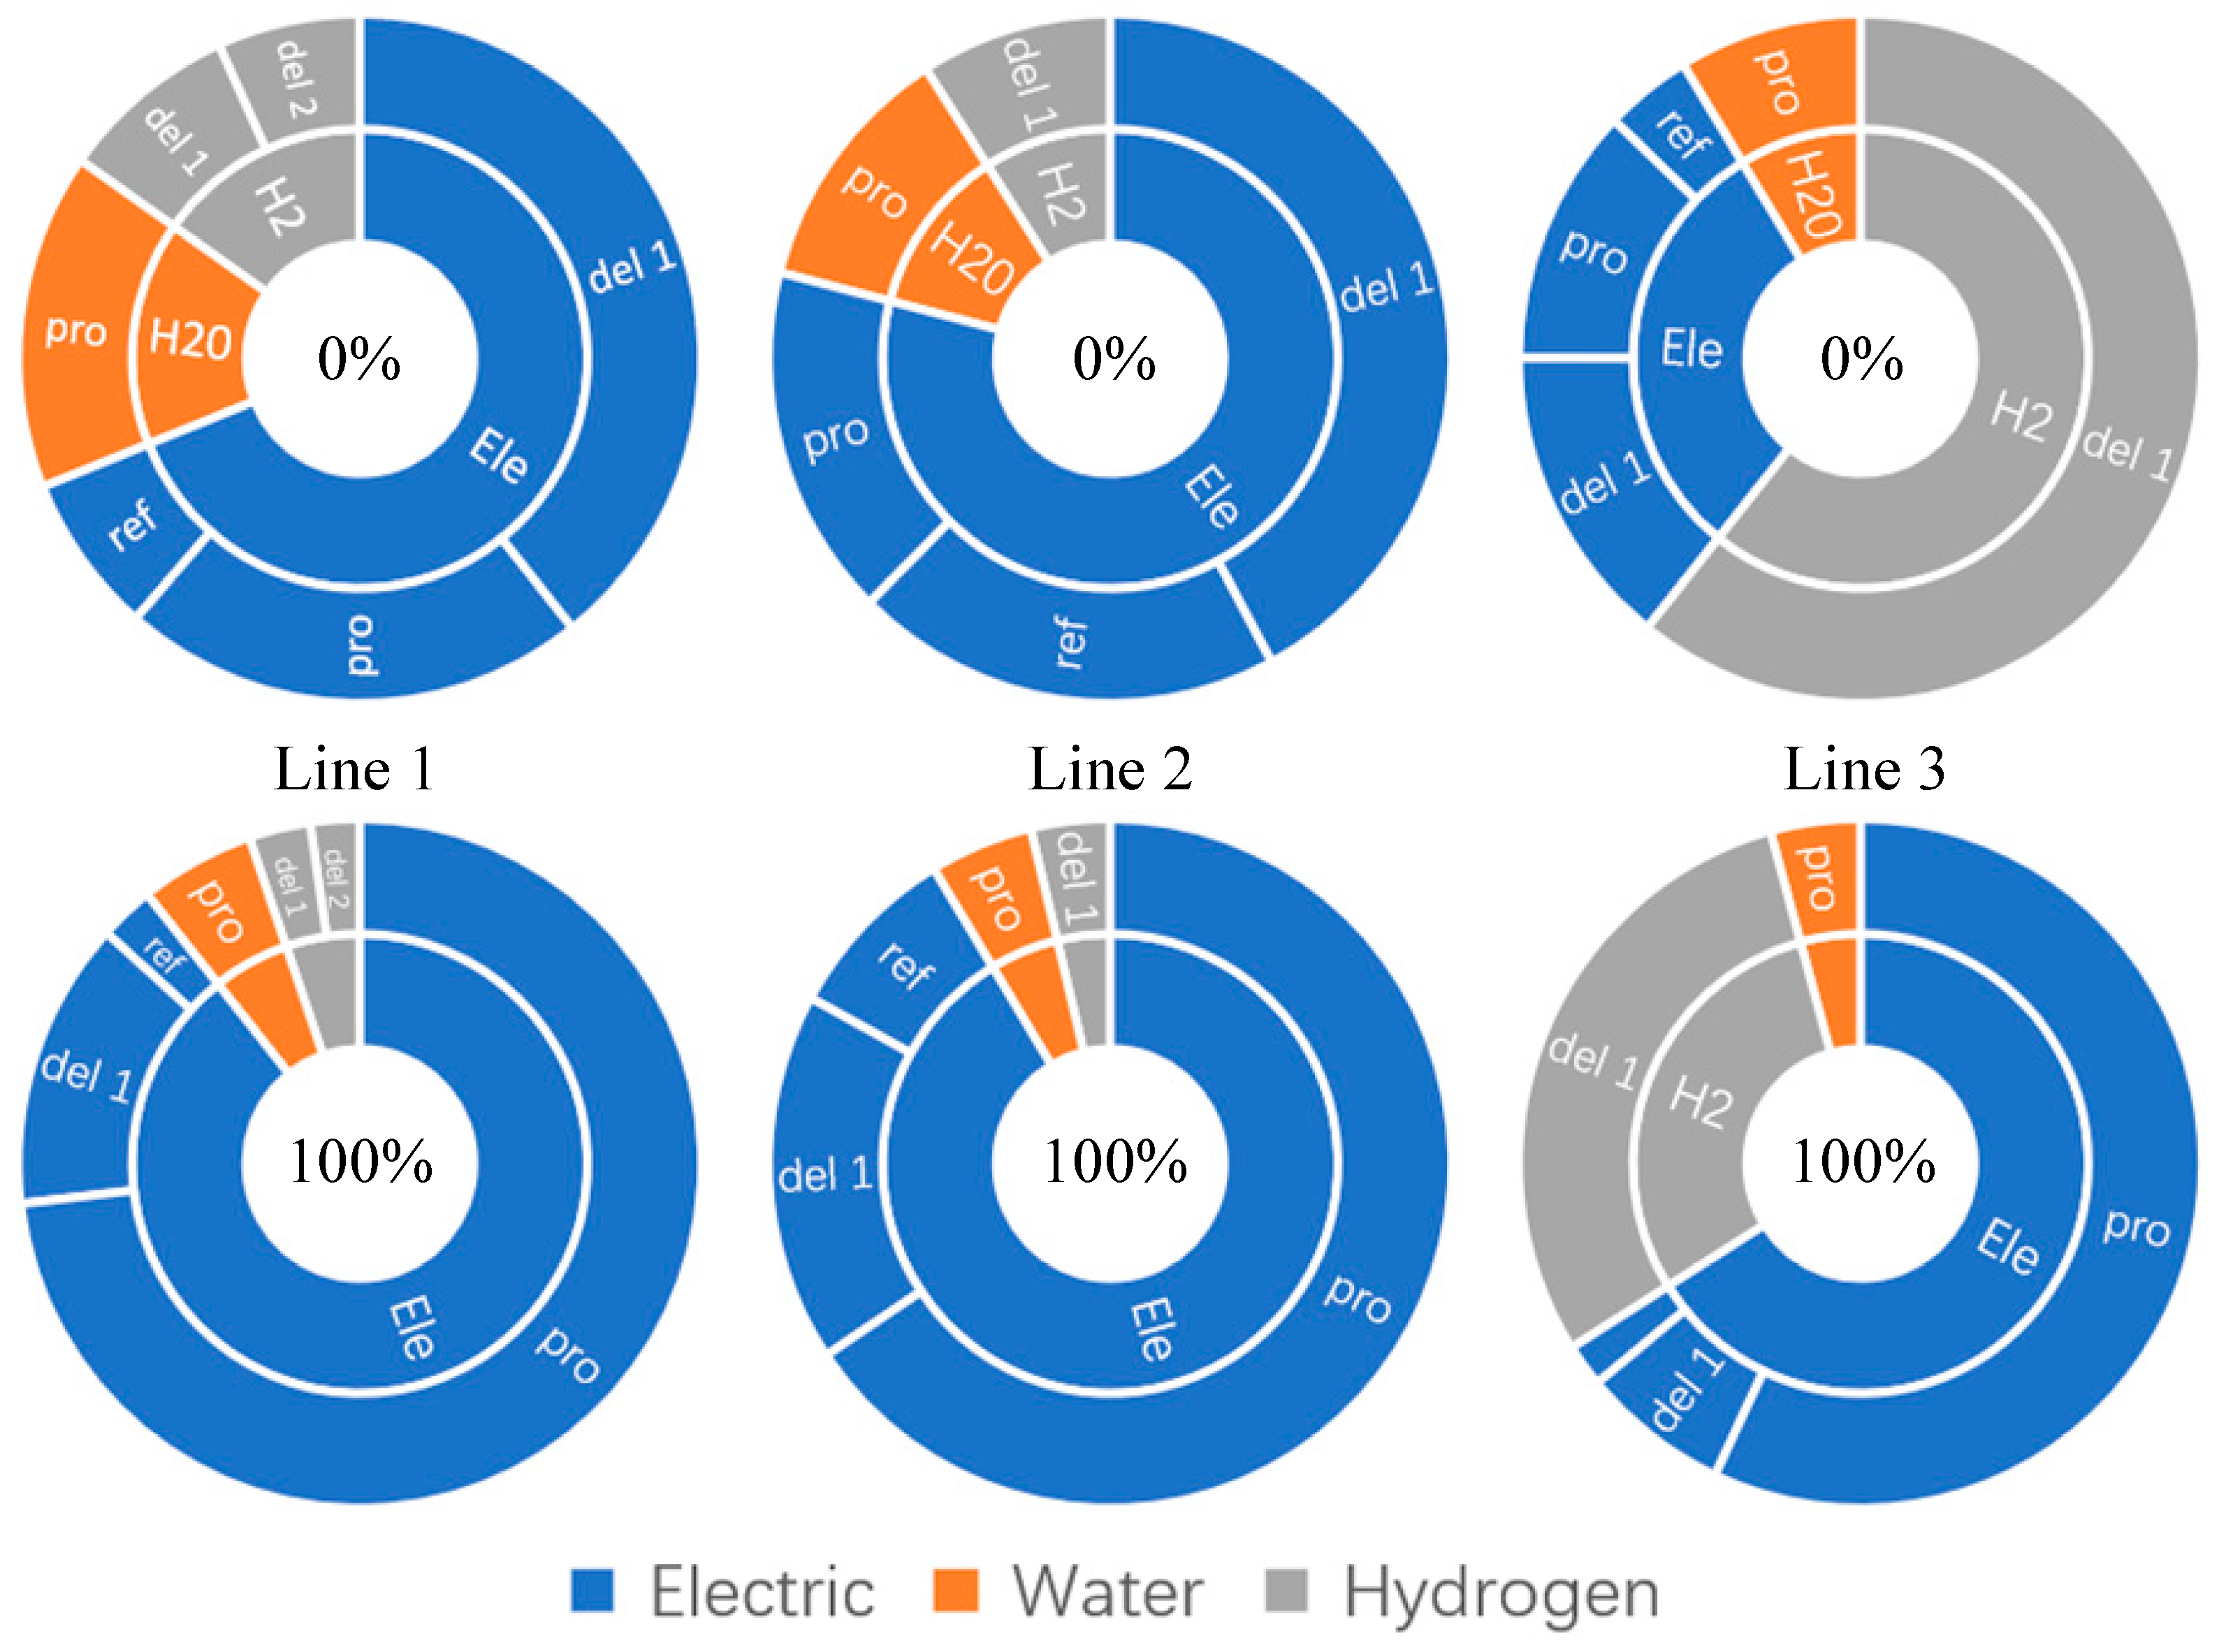
The General Office of the Chengdu Municipal People’s Government issued a policy on hydrogen subsidies in 2020 [60], proposing investment and operational subsidies for companies engaged in the storage and transport of H2 and the construction of H2 refueling stations. If the investment is made in the long-distance transport component of Route 1, then both the H2 production and transit station phases involve the storage of H2, with a total of RMB 10 million in one-off subsidies available. The LH2 transport stage is eligible for an annual transport subsidy of RMB 1.5 million, which translates to 0.147 CNY/kg per unit of subsidized H2. If investing in the short-distance transport component, each H2 refueling station will receive a one-time subsidy of RMB 5 million upon completion; the GH2 transport stage receives a subsidy of 1.5 CNY/kg per unit of H2. If H2 refueling stations sell H2 at prices not higher than 40 CNY/kg, they are also eligible for an annual sales subsidy of RMB 20 per unit of H2. Therefore, after enjoying the policy subsidy, Route 1 provides 1 kg of H2 sold at 40 CNY/kg, with an actual income of RMB 61.647. Dividing the actual income in a 6/4 ratio, we get RMB 37 from selling 1 kg of H2 in the long-distance transport section and RMB 24.647 from selling 1 kg of H2 in the short-distance transport section.
The payback period is an important indicator for measuring the effectiveness of project investment and its ability to resist risk. The dynamic payback period (DPP) is the time required to recover the total investment in terms of the net return of the project under the condition that the time value of money is fully taken into account, whereas the static payback period (SPP) is the time required for recovering the total investment without taking into account the time value of money [61]. Net Present Value (NPV) is the sum of the present values of the net cash flows over the project’s calculated period by specifying the discount rate and is an absolute indicator of the project’s profitability. DPP, SPP, and NPV are calculated by [59,62]:
t = 1 D P P C I C O t ( 1 + i ) t = 0 ,
t = 1 S P P C I C O t = 0 ,
N P V = t = 1 n C I C O t ( 1 + i ) t ,
where CI is the annual revenue (income per unit of H2 × annual volume of H2 transported), CNY; CO is the annual operating cost (operating cost per unit of H2 × annual volume of H2 transported), CNY; and (CI-CO)t is the net cash flow at the end of year t, CNY. After considering the one-time subsidy, the cumulative life cycle NPV of RMB 1829.41 million is obtained for investing in the long-distance transport component, with DPP and SPP of 13.61 and 8.11 years, respectively. When the scale of short-distance transport exceeds 2000 kg/d, GH2 transporters and related equipment can achieve a high utilization rate to further improve economic benefits. After considering the lump-sum subsidy, the DPP and SPP of the short-distance transport component with a scale of 2000 kg/d are 7.02 years and 5.21 years, respectively, and the cumulative NPV of the life cycle is RMB 104.84 million. The cumulative NPV and dynamic and static payback periods over the life cycle of the long and short-distance transport components are shown in Figure 6 and Figure 7.

5. CO2 Emissions

The three routes in this paper all use a green hydrogen supply system that combines H2 production from electrolytic water with hydrogen trucking, and the main energy sources consumed are electricity, hydrogen, and water, with no direct CO2 emissions. Thus, only the indirect CO2 emissions from the process need to be calculated. The indirect CO2 emissions are calculated by [63]:
E C O 2 = j = 1 n m j × E F j , C O 2 ,
where E C O 2 is the indirect emission of CO2 and E F j , C O 2 is the CO2 emission factor of the energy source. The CO2 emission factors of the main energy sources in this paper refer to the “China Product Full Life Cycle Greenhouse Gas Emission Coefficient Library” [64,65]. The CO2 emission factors of major energy sources are shown in Table 7.
When renewable energy cannot meet the electricity demand for hydrogen production, the surplus electricity will be supplemented through the Qinghai provincial power grid [66]. The more grid-connected electricity is consumed, the more indirect carbon emissions per unit of green hydrogen are generated, with an overall linear upward trend. As shown in Figure 8, Routes 1 and 2 require additional electricity for hydrogen liquefaction in addition to water electrolysis, and indirect CO2 emissions from liquefaction exceed those from H2 production without the use of grid-connected electricity. Indirect CO2 emissions from the hydrogen fuel required to obtain the transporter are small, but in Route 3, this share increases considerably. Thus, comparing the two modes of transport, LH2 and GH2, the indirect CO2 emissions from LH2 transport come mainly from the electricity used in the liquefiers, while the CO2 emissions from GH2 transport come from the acquisition of hydrogen fuel. Indirect CO2 emissions from the H2 production stage rise sharply when access to the transmission grid is required for power supplementation, reaching up to 75% of the total CO2 emissions, with the detailed share shown in Table 8.
The electrolytic water hydrogen production technology, which is common to the three routes, emits 0.946 kgCO2/kgH2 and 5.684 kgCO2/kgH2 of CO2 per unit of H2 obtained in the two scenarios of no grid-connected electricity used and all grid-connected electricity used, which is a reduction in carbon emissions per unit of H2 produced from conventional natural gas hydrogen production of 10.063 kgCO2/kgH2, respectively, by 90.6% and 43.5%.
The hydrogen trucks chosen for the three routes will also have reduced CO2 emissions compared to conventional diesel trucks. Taking Route 1, which is the most environmentally friendly, as an example, the amount of CO2 emitted per unit of H2 delivered is 2.98 kgCO2/kgH2 and 7.72 kgCO2/kgH2 for the two scenarios of no grid-connected electricity used and all grid-connected electricity used, respectively. However, if the hydrogen trucks in Route 1 are replaced with diesel trucks, the amount of CO2 emitted per unit of H2 delivered is raised to 3.09 kgCO2/kgH2 and 7.82 kgCO2/kgH2 in both scenarios, resulting in 1022 metric tons of additional CO2 emissions each year.

6. Conclusions

To realize the large-scale production and application of green hydrogen, this paper proposes a low-cost and low-emission liquid-gas cascade hydrogen energy transportation scheme to solve the long-distance transportation problem faced by green hydrogen. This paper selects the hydrogen energy demand of Chengdu, Sichuan Province, as the realistic background and designs a complete green hydrogen supply scheme from hydrogen production to application. The technological process and main equipment involved in the scheme are introduced in detail, and the economic analysis and environmental benefit analysis are carried out. The results demonstrate the advantages (lower cost and greenhouse gas emissions) of the liquid-gas cascade green hydrogen transport scheme over the traditional transport scheme.
A detailed economic analysis of the scheme is carried out and compared with the traditional transport scheme. The results show that the liquid-gas cascade hydrogen energy transport scheme has obvious advantages in the cost of hydrogen supply, which is only 51.5825 CNY/kgH2. In addition, because long- and short-distance transportation is divided, each enterprise can flexibly choose the investment part according to its field of involvement. Enterprises investing in the long-distance transportation stage need large initial capital and a high total return, and the investment cost can be fully recovered in 13.61 years. The start-up capital and expected revenue of investing in the short-distance transportation stage depend on the number of lines invested, with an average payback period of 7.02 years.
In terms of environmental analysis, this scheme does not produce direct carbon dioxide emissions in the whole process, so indirect carbon emissions are calculated and the relationship between grid-connected electricity consumption and emissions is studied. The results show that the scheme only generates 2.98 kg of indirect carbon emissions per unit of hydrogen delivered without grid-connected electricity and only 7.72 kgCO2/kgH2 when grid electricity is fully used, which is better than the traditional transportation scheme. In summary, the newly proposed liquid-gas cascade hydrogen energy delivery scheme has economic and emission reduction advantages and is expected to become the main mode of green hydrogen delivery in China in the future.

Author Contributions

Writing—original draft preparation, Software, Y.Y.; Conceptualization, X.C.; Formal analysis, L.Y.; Validation, Z.Z.; Resources, K.Q.; Supervision, B.S. All authors have read and agreed to the published version of the manuscript.

Funding

This research was supported in part by the Sichuan Science and Technology Program (2024NSFSC1069), the MOE (Ministry of Education in China) Project of Humanities and Social Sciences (23XJC630012), and the Education Reform Project of Sichuan Normal University under Grant No. 20210469XKC and JWCJF202080128.

Data Availability Statement

Data are available from the authors upon request.

Conflicts of Interest

The authors declare no conflicts of interest.

References

  1. Ren, J.; Gao, S.; Tan, S.; Dong, L.; Scipioni, A.; Mazzi, A. Role prioritization of hydrogen production technologies for promoting hydrogen economy in the current state of China. Renew. Sustain. Energy Rev. 2015, 41, 1217–1229. [Google Scholar] [CrossRef]
  2. Kim, J.H.; Han, S.M.; Yoo, S.H. Price premium for green hydrogen in South Korea: Evidence from a stated preference study. Renew. Energy 2023, 211, 647–655. [Google Scholar] [CrossRef]
  3. Kern, F.; Schmelzle, F.; Hummel, M. Hydrogen as a panacea for decarbonising everything? Exploring contested hydrogen pathways in Germany. Environ. Res. Lett. 2023, 18, 114017. [Google Scholar] [CrossRef]
  4. Yang, L.; Wang, S.; Zhang, Z.; Lin, K.; Zheng, M. Current development status, policy support and promotion path of China’s green hydrogen industries under the target of carbon emission peaking and carbon neutrality. Sustainability 2023, 15, 10118. [Google Scholar] [CrossRef]
  5. Vilbergsson, K.; Dillman, K.; Emami, N.; Ásbjörnsson, E.; Heinonen, J.; Finger, D. Can remote green hydrogen production play a key role in decarbonizing Europe? A cradle to gate LCA of hydrogen production in Austria, Belgium and Iceland. EGU Gen. Assem. Conf. Abstr. 2022, EGU22-5406. [Google Scholar] [CrossRef]
  6. Ibagon, N.; Muñoz, P.; Díaz, V.; Teliz, E.; Correa, G. Techno-economic analysis for off-grid green hydrogen production in Uruguay. J. Energy Storage 2023, 67, 107604. [Google Scholar] [CrossRef]
  7. Galimova, T.; Fasihi, M.; Bogdanov, D.; Breyer, C. Impact of international transportation chains on cost of green e-hydrogen: Global cost of hydrogen and consequences for Germany and Finland. Appl. Energy 2023, 347, 121369. [Google Scholar] [CrossRef]
  8. Ruhnau, O.; Qvist, S. Storage requirements in a 100% renewable electricity system: Extreme events and inter-annual variability. Environ. Res. Lett. 2022, 17, 044018. [Google Scholar] [CrossRef]
  9. Hren, R.; Vujanović, A.; Van Fan, Y.; Klemeš, J.J.; Krajnc, D.; Čuček, L. Hydrogen production, storage and transport for renewable energy and chemicals: An environmental footprint assessment. Renew. Sustain. Energy Rev. 2023, 173, 113113. [Google Scholar] [CrossRef]
  10. Faye, O.; Szpunar, J.; Eduok, U. A critical review on the current technologies for the generation, storage, and transportation of hydrogen. Int. J. Hydrogen Energy 2022, 47, 13771–13802. [Google Scholar] [CrossRef]
  11. Zhang, G.; Jiang, Z. Overview of hydrogen storage and transportation technology in China. Unconv. Resour. 2023, 3, 291–296. [Google Scholar] [CrossRef]
  12. Semeraro, M.A., III. Renewable energy transport via hydrogen pipelines and HVDC transmission lines. Energy Strategy Rev. 2021, 35, 100658. [Google Scholar] [CrossRef]
  13. Nazir, H.; Muthuswamy, N.; Louis, C.; Jose, S.; Prakash, J.; Buan, M.E.; Flox, C.; Chavan, S.; Shi, X.; Kauranen, P.; et al. Is the H2 economy realizable in the foreseeable future? Part II: H2 storage, transportation, and distribution. Int. J. Hydrogen Energy 2020, 45, 20693–20708. [Google Scholar] [CrossRef]
  14. Dogan, B. Hydrogen storage tank systems and materials selection for transport applications. In Proceedings of the ASME Pressure Vessels and Piping Conference, Vancouver, BC, Canada, 23–27 July 2006; pp. 571–578. [Google Scholar]
  15. Pan, W.; Wan, T.; Han, Y.; Liu, S.; Fu, J. Storage and transportation technology solutions selection for large-scale hydrogen energy utilization scenarios under the trend of carbon neutralization. IOP Conf. Ser. Earth Environ. Sci. 2021, 770, 012017. [Google Scholar] [CrossRef]
  16. Tzimas, E.; Castello, P.; Peteves, S. The evolution of size and cost of a hydrogen delivery infrastructure in Europe in the medium and long term. Int. J. Hydrogen Energy 2007, 32, 1369–1380. [Google Scholar] [CrossRef]
  17. Bauer, A.; Mayer, T.; Semmel, M.; Morales MA, G.; Wind, J. Energetic evaluation of hydrogen refueling stations with liquid or gaseous stored hydrogen. Int. J. Hydrogen Energy 2019, 44, 6795–6812. [Google Scholar] [CrossRef]
  18. Petitpas, G.; Aceves, S.M.; Gupta, N. Vehicle refueling with liquid hydrogen thermal compression. Int. J. Hydrogen Energy 2012, 37, 11448–11457. [Google Scholar] [CrossRef]
  19. Ratnakar, R.R.; Gupta, N.; Zhang, K.; van Doorne, C.; Fesmire, J.; Dindoruk, B.; Balakotaiah, V. Hydrogen supply chain and challenges in large-scale LH2 storage and transportation. Int. J. Hydrogen Energy 2021, 46, 24149–24168. [Google Scholar] [CrossRef]
  20. Wolfram, P.; O’Rourke, P.; McJeon, H.; Kyle, P. Helping the climate by replacing liquefied natural gas with liquefied hydrogen or ammonia? Environ. Res. Lett. 2024, 19, 054005. [Google Scholar] [CrossRef]
  21. Aziz, M. Liquid hydrogen: A review on liquefaction, storage, transportation, and safety. Energies 2021, 14, 5917. [Google Scholar] [CrossRef]
  22. Muduli, R.C.; Kale, P. Sorption properties of nanostructured ball-milled porous silicon for solid-state hydrogen storage up to 80 bar. Int. J. Hydrogen Energy 2024, in press. [Google Scholar] [CrossRef]
  23. Halder, P.; Babaie, M.; Salek, F.; Haque, N.; Savage, R.; Stevanovic, S.; Zare, A. Advancements in hydrogen production, storage, distribution and refuelling for a sustainable transport sector: Hydrogen fuel cell vehicles. Int. J. Hydrogen Energy 2024, 52, 973–1004. [Google Scholar] [CrossRef]
  24. Rampai, M.M.; Mtshali, C.B.; Seroka, N.S.; Khotseng, L. Hydrogen production, storage, and transportation: Recent advances. RSC Adv. 2024, 14, 6699–6718. [Google Scholar] [CrossRef]
  25. Demir, M.E.; Dincer, I. Cost assessment and evaluation of various hydrogen delivery scenarios. Int. J. Hydrogen Energy 2018, 43, 10420–10430. [Google Scholar] [CrossRef]
  26. Chengdu Hydrogen Energy Industry Development Plan. Available online: https://cdjx.chengdu.gov.cn/cdsjxw/ (accessed on 2 February 2021).
  27. Le Duigou, A.; Bader, A.G.; Lanoix, J.C.; Nadau, L. Relevance and costs of large scale underground hydrogen storage in France. Int. J. Hydrogen Energy 2017, 42, 22987–23003. [Google Scholar] [CrossRef]
  28. Rashid, M.; Al Mesfer, M.K.; Naseem, H.; Danish, M. Hydrogen production by water electrolysis: A review of alkaline water electrolysis, PEM water electrolysis and high temperature water electrolysis. Int. J. Eng. Adv. Technol. 2015, 4, 2249–8958. [Google Scholar]
  29. Terlouw, T.; Bauer, C.; McKenna, R.; Mazzotti, M. Large-scale hydrogen production via water electrolysis: A techno-economic and environmental assessment. Energy Environ. Sci. 2022, 15, 3583–3602. [Google Scholar] [CrossRef]
  30. Lahrichi, A.; El Issmaeli, Y.; Kalanur, S.S.; Pollet, B.G. Advancements, strategies, and prospects of solid oxide electrolysis cells (SOECs): Towards enhanced performance and large-scale sustainable hydrogen production. J. Energy Chem. 2024, 94, 688–715. [Google Scholar] [CrossRef]
  31. Liu, H.; Yu, M.; Tong, X.; Wang, Q.; Chen, M. High Temperature Solid Oxide Electrolysis for Green Hydrogen Production. Chem. Rev. 2024, 18, 10509–10576. [Google Scholar] [CrossRef]
  32. Astriani, Y.; Tushar, W.; Nadarajah, M. Optimal planning of renewable energy park for green hydrogen production using detailed cost and efficiency curves of PEM electrolyzer. Int. J. Hydrogen Energy 2024, 79, 1331–1346. [Google Scholar] [CrossRef]
  33. Kim, M.; Lee, D.; Qi, M.; Kim, J. Techno-economic analysis of anion exchange membrane electrolysis process for green hydrogen production under uncertainty. Energy Convers. Manag. 2024, 302, 118134. [Google Scholar] [CrossRef]
  34. Manabe, A.; Kashiwase, M.; Hashimoto, T.; Hayashida, T.; Kato, A.; Hirao, K.; Shimomura, I.; Nagashima, I. Basic study of alkaline water electrolysis. Electrochim. Acta 2013, 100, 249–256. [Google Scholar] [CrossRef]
  35. Shi, J.; Gao, H.; Wang, H. Economic analysis on wind power for hydrogen production. Energy China 2015, 37, 11–14. [Google Scholar]
  36. Zhang, C. Cost analysis and development suggestion for hydrogen production from coal and natural gas. Pet. Process. Petrochem. 2018, 49, 94–98. [Google Scholar]
  37. Time-Sharing Mechanism for Electricity Prices in Qinghai Province. Available online: http://www.qinghai.gov.cn/index.html (accessed on 9 September 2022).
  38. Zeyen, E.; Riepin, I.; Brown, T. Temporal regulation of renewable supply for electrolytic hydrogen. Environ. Res. Lett. 2024, 19, 024034. [Google Scholar] [CrossRef]
  39. Abdin, Z.; Tang, C.; Liu, Y.; Catchpole, K. Large-scale stationary hydrogen storage via liquid organic hydrogen carriers. Iscience 2021, 24, 102966. [Google Scholar] [CrossRef]
  40. Busch, T.; Groß, T.; Linßen, J.; Stolten, D. The role of liquid hydrogen in integrated energy systems–A case study for Germany. Int. J. Hydrogen Energy 2023, 48, 39408–39424. [Google Scholar] [CrossRef]
  41. Available online: https://www.yicai.com/news/101148270.html (accessed on 21 August 2021).
  42. Available online: http://www.chinahv.cn/display/439168.html (accessed on 9 October 2020).
  43. Chen, X.; Pang, Z.; Zhang, M.; Jiang, S.; Feng, J.; Shen, B. Techno-economic study of a 100-MW-class multi-energy vehicle charging/refueling station: Using 100% renewable, liquid hydrogen, and superconductor technologies. Energy Convers. Manag. 2023, 276, 116463. [Google Scholar] [CrossRef]
  44. Argonne National Laboratory. Hydrogen and Fuel Cells Program. Available online: https://www.anl.gov (accessed on 1 August 2023).
  45. Zou, J.; Han, N.; Yan, J.; Feng, Q.; Wang, Y.; Zhao, Z.; Fan, J.; Zeng, L.; Li, H.; Wang, H. Electrochemical compression technologies for high-pressure hydrogen: Current status, challenges and perspective. Electrochem. Energy Rev. 2020, 3, 690–729. [Google Scholar] [CrossRef]
  46. Barthélémy, H.; Weber, M.; Barbier, F. Hydrogen storage: Recent improvements and industrial perspectives. Int. J. Hydrogen Energy 2017, 42, 7254–7262. [Google Scholar] [CrossRef]
  47. Rong, Y.; Chen, S.; Li, C.; Chen, X.; Xie, L.; Chen, J.; Long, R. Techno-economic analysis of hydrogen storage and transportation from hydrogen plant to terminal refueling station. Int. J. Hydrogen Energy 2024, 52, 547–558. [Google Scholar] [CrossRef]
  48. Chen, X.; Gou, H.; Chen, Y.; Jiang, S.; Zhang, M.; Pang, Z.; Shen, B. Superconducting fault current limiter (SFCL) for a power electronic circuit: Experiment and numerical modelling. Supercond. Sci. Technol. 2022, 35, 045010. [Google Scholar] [CrossRef]
  49. Clegg, M.; Ruiz, H.S. Electromagnetic analysis and AC losses of triaxial cables with multiple 2G-HTS layers per phase. Superconductivity 2023, 5, 100039. [Google Scholar] [CrossRef]
  50. Mayer, T.; Semmel, M.; Morales MA, G.; Schmidt, K.M.; Bauer, A.; Wind, J. Techno-economic evaluation of hydrogen refueling stations with liquid or gaseous stored hydrogen. Int. J. Hydrogen Energy 2019, 44, 25809–25833. [Google Scholar] [CrossRef]
  51. Reddi, K.; Elgowainy, A.; Rustagi, N.; Gupta, E. Impact of hydrogen refueling configurations and market parameters on the refueling cost of hydrogen. Int. J. Hydrogen Energy 2017, 42, 21855–21865. [Google Scholar] [CrossRef]
  52. Gu, Y.; Chen, Q.; Xue, J.; Tang, Z.; Sun, Y.; Wu, Q. Comparative techno-economic study of solar energy integrated hydrogen supply pathways for hydrogen refueling stations in China. Energy Convers. Manag. 2020, 223, 113240. [Google Scholar] [CrossRef]
  53. Elgowainy, A.; Reddi, K.; Lee, D.; Rustagi, N.; Gupta, E. Techno-economic and thermodynamic analysis of pre-cooling systems at gaseous hydrogen refueling stations. Int. J. Hydrogen Energy 2017, 42, 29067–29079. [Google Scholar] [CrossRef]
  54. Huang, S. Technological Economy of Chemical Engineering; Chemical Industry Press: Beijing, China, 2012. [Google Scholar]
  55. NDRC. Construction of Project Economic Evaluation Methods and Parameters; NDRC: Beijing, China, 2006. [Google Scholar]
  56. Esen, H.; Inalli, M.; Esen, M. A techno-economic comparison of ground-coupled and air-coupled heat pump system for space cooling. Build. Environ. 2007, 42, 1955–1965. [Google Scholar] [CrossRef]
  57. Esen, M.; Yuksel, T. Experimental evaluation of using various renewable energy sources for heating a greenhouse. Energy Build. 2013, 65, 340–351. [Google Scholar] [CrossRef]
  58. China’s National Development Reform Commission. Available online: https://en.ndrc.gov.cn (accessed on 1 August 2023).
  59. Chen, X.; Pang, Z.; Jiang, S.; Zhang, M.; Feng, J.; Fu, L.; Shen, B. A novel LH2/GH2/battery multi-energy vehicle supply station using 100% local wind energy: Technical, economic and environmental perspectives. Energy 2023, 270, 126871. [Google Scholar] [CrossRef]
  60. Opinions of the General Office of Chengdu Municipal People’s Government on Promoting High-Quality Development of Hydrogen Energy Industry. Available online: http://www.sczwfw.gov.cn (accessed on 13 July 2020).
  61. Mahmod, S.S.; Jahim, J.M.; Abdul, P.M.; Luthfi AA, I.; Takriff, M.S. Techno-economic analysis of two-stage anaerobic system for biohydrogen and biomethane production from palm oil mill effluent. J. Environ. Chem. Eng. 2021, 9, 105679. [Google Scholar] [CrossRef]
  62. Bosch, M.; Montllor-Serrats, J.; Tarrazon, M. NPV as a function of the IRR: The value drivers of investment projects. J. Appl. Financ. 2007, 17, 41. [Google Scholar]
  63. Yu, S.; Wei, Y.; Guo, H.; Ding, L. Carbon emission coefficient measurement of the coal-to-power energy chain in China. Appl. Energy 2014, 114, 290–300. [Google Scholar] [CrossRef]
  64. China Product Full Life Cycle Greenhouse Gas Emission Coefficient Library. Available online: http://lca.cityghg.com/ (accessed on 22 September 2024).
  65. Eggleston, H.S.; Buendia, L.; Miwa, K.; Ngara, T.; Tanabe, K. IPCC Guidelines for National Greenhouse Gas Inventories Volume 1: General Guidance and Reporting; Institute for Global Environmental Strategies (IGES) for the IPCC: Kanagawa, Japan, 2006. [Google Scholar]
  66. Kothari, R.; Buddhi, D.; Sawhney, R.L. Comparison of environmental and economic aspects of various hydrogen production methods. Renew. Sustain. Energy Rev. 2008, 12, 553–563. [Google Scholar] [CrossRef]
Figure 1. Energy distribution, conversion, and transmission roadmap.
Sustainability 16 08839 g001
Figure 2. Hydrogen supply flow chart.
Sustainability 16 08839 g002
Figure 3. Total H2 cost for the three routes.
Sustainability 16 08839 g003
Figure 4. Cost composition of three routes.
Sustainability 16 08839 g004
Figure 5. Part of the cost is affected by the electricity price diagram.
Sustainability 16 08839 g005
Figure 6. Cumulative NPV and payback period over the life cycle of the long-distance transport component.
Sustainability 16 08839 g006
Figure 7. Cumulative NPV and payback period over the life cycle of the short-distance transport component.
Sustainability 16 08839 g007
Figure 8. CO2 emission composition of the three routes under the two conditions of 0% and 100% grid-connected electricity consumption (in the figure, del1 is for long-distance transport and del2 is for short-distance transport).
Sustainability 16 08839 g008
Table 1. Parameters of the AWE electrolyzer.
Technical DataValueUnit
Price14,100,000RMB
Capacity89.3kgH2/h
Operating temperature343K
Operating pressure15atm
Power consumption of electrolysis50.392kWh/kgH2
Other consumption4.7kWh/kgH2
Delivered H2 pressure2MPa
Fresh water consumption10.99kg/kgH2
Recycling water consumption405.15kg/kgH2
Day running time18h
Table 2. Hydrogen fuel LH2 transport truck parameters.
ParameterValueUnit
Price1,200,000$
Fuel typeH2-
Transport typeLH2-
Load capacity4000kg
Fuel economy0.08kg/km
Average speed70km/h
Truck use per day15h
Table 3. Hydrogen fuel GH2 transport truck parameters.
ParameterValueUnit
Price376,470$
Fuel typeH2-
Transport typeGH2-
Tube trailer pressure20MPa
Load capacity350kg
Fuel economy0.08kg/km
Average speed70km/h
Truck use per day15h
Table 4. Prices of raw materials, fuels, and by-products.
ItemPriceUnit
Electricity in flat and low periods (Qinghai Province)0.28RMB/kWh
Electricity (Qinghai Province)0.35RMB/kWh
Electricity (Sichuan Province)0.55RMB/kWh
Fresh water1.5RMB/ton
Recycling water0.3RMB/ton
Fuel H240,000RMB/ton
O20.25RMB/Nm3
Table 5. Economic assumptions.
ItemValueUnit
HRS capacity500kgH2/d
Discounted rate8%-
Exchange rate of RMB7RMB:$
Lifetime for H2 production20years
Lifetime for H2 transportation20years
Lifetime for H2 refueling station15years
General facilities10%of TPU
Engineering permitting and startup5%of TPU
Contingencies5%of TPU
Land Miscellaneous3%of TPU
Variable non-fuel O and M0.5%of TCC
Labor3%of TCC
Fixed operating cost5%of TCC
Table 6. Main equipment prices.
EquipmentCapital CostsRefs
Liquefier cost75,185,000 $ each unit[43]
Compressor51,901 × (3600 m)0.65 $[50]
Gasifier650,000 $ each unit[50]
Low-pressure buffer tank1001 $/kgH2[50]
High-pressure buffer tank1495 $/kgH2[50]
Liquid H2 tank27 $/kgH2[59]
Dispenser with precooling unit170,000 $ each unit[53]
Table 7. CO2 emission coefficient.
ItemValueUnit
Wind photovoltaic0.01kgCO2/kWh
Electricity (Qinghai Province)0.096kgCO2/kWh
Electricity (Sichuan Province)0.123kgCO2/kWh
Fresh water5.75kgCO2/ton
Recycling water0.82kgCO2/ton
Fuel H210,063kgCO2/ton
Diesel3797kgCO2/ton
Table 8. Indirect CO2 emissions and their proportion in each stage when the utilization rate of grid-connected electricity is 100%.
The Main Energy-Consuming PhaseLine 1Line 2Line 3
The Amount and Proportion of CO2 EmissionsProportion of EnergyThe Amount and Proportion of CO2 EmissionsProportion of EnergyThe Amount and Proportion of CO2 EmissionsProportion of Energy
H2 production5.684 (78.6%)Electric 73.1%5.684 (70.5%)Electric 65.6%5.684 (61.3%)Electric 57%
Water 5.5%Water 4.9%Water 4.3%
H2 transportation1.36 (18.8%)Electric 13.6%1.703 (21.1%)Electric 17.4%3.406 (36.7%)Electric 7%
H2 5.2%H2 3.7%H2 29.7%
H2 refueling
station
0.188 (2.6%)Electric 2.6%0.675 (8.4%)Electric 8.4%0.188 (2%)Electric 2%
Total CO2
emissions
7.2328.0629.278
Disclaimer/Publisher’s Note: The statements, opinions and data contained in all publications are solely those of the individual author(s) and contributor(s) and not of MDPI and/or the editor(s). MDPI and/or the editor(s) disclaim responsibility for any injury to people or property resulting from any ideas, methods, instructions or products referred to in the content.

