Abstract
This study proposes an improved methodology based on life cycle assessment (LCA), which is used to calculate the carbon footprint of agriculture, provides a simple and feasible calculation path, and constructs a streamlined framework for calculating the carbon footprint based on the agricultural traceability system records. Using important economic crop (Onion) as research subject, and choose the largest planting area in R.O.C. (southern Taiwan) as a case study. A total of 64 farm production history records have been collected, includes all of farms certified with a traceable agricultural products (TAP) label. Through a detailed analysis of the traditional carbon footprint calculation method, found that agricultural traceability system records could replace the data source in carbon footprint verification (CFV) process, and system records could be used as activity data after being organized. With our method, no need to go through a complicated CFV process, just download the existing data on agricultural traceability system, can start calculating carbon footprint as soon as possible. To compared to traditional assessment method, results show a margin of error is less than 6% compared to traditional assessment methods. Advantages of improved method were be found, such as easy data acquisition, simplified calculation steps, and improved data transparency and accuracy. From statistical data, show that at least seven categories of carbon emission sources for carbon footprints, the most significant of carbon emission impact are fertilizers. The result of improved methodology based on life cycle assessment (LCA), show that using the improved methods can help promote the carbon footprint management efficiency of agricultural organizations such as Farmers’ Association or Agricultural Production Marketing Group, promptly monitor the carbon footprint status of their fields and adjust strategies to reduce carbon footprints in real-time, advancing towards the goal of net-zero carbon emissions.
1. Introduction
Issue of global climate change is receiving considerable attention, with particular focus being placed on the impact of greenhouse gas (GHG) emissions on the phenomenon of global warming, which is directly linked to the occurrence of climate change and its rate of change. Intergovernmental Panel on Climate Change (IPCC) released its report, IPCC AR6, which reiterates the need to implement Paris Agreement’s overarching goal that warming should be contained within range of 1.5 °C to 2 °C to mitigate warming scenarios [1]. Mitigation of GHG emissions from human activities is considered a priority [2].
GHG emissions from agricultural activities originate from soil and inputs of fertilizers and pesticides [3]. Agro-ecosystems are tasked with both food supply and ecological preservation and must simultaneously safeguard crop productivity and soil fertility. With significant impacts of climate change, issues such as increased frequency of pests and diseases, reduced areas for cultivation, and drastically reduced yields are gradually emerging, prompting agriculture industry to invest more resources into solving these problems while maintaining original production capacity. This situation will lead to an increase in GHG emissions, which will also pose a real threat and crisis to production of food, agriculture, and ecological environments. Therefore, there is an urgent need for agricultural sector to plan strategies to reduce GHG emissions. Taiwan is located in a subtropical climate region, which creates a unique environment suitable for the growth of a variety of crops. Agriculture plays an important role in Taiwan’s economy, and small-scale farms are common, so short-cycle crops can flexibly adjust crop types and reduce risk of growing a single crop [4,5], which is the reason why most farmers choose to grow short-term crops, such as onions. Crop rotation with green manure application strategy can help to prevent soil health degradation and accumulation of pests and diseases, and maintain soil health and productivity [6]. As Taiwan faces environmental problems such as climate change, soil erosion, and excessive use of chemical fertilizers, which threaten soil health, planting water sources, and crop health [7], Department of Agriculture encourages practice of green agriculture and application of environmentally friendly technologies, such as introduction of intelligent irrigation systems, precision farming, and other technologies, to actively promote sustainable development of agricultural industry [8,9], which provides rich research value for study of carbon footprints. This provides a rich research value for carbon footprint study case.
Basic works in agriculture is complex, with different crops having different climatic and environmental requirements, as well as different planting methods and crop rotation systems. After determining the type of crop to be planted, farmers develop appropriate crop rotations and soil management practices based on geography and crop characteristics, and adjust land use and planting management strategies in response to climate change. This action helps to ensure crop yield and quality, but usually does not take into account size of carbon footprint [10,11,12].
Carbon footprint is an indicator that measures the contribution of GHG emissions from energy consumption. According to calculation scope and end-use requirements, divided into personal carbon footprint, product carbon footprint, and organizational carbon footprint [13]. Carbon footprint estimation quantifies direct and indirect contribution of agricultural basic works to greenhouse gas emissions and facilitates the review of carbon footprint history of agricultural practices. There are a number of steps involved in basic works for carbon footprint estimation, including determining the scope of the carbon footprint estimation, collecting activity data, inventorying energy consumption, analyzing GHG emissions, using LCA for life cycle assessment [14,15,16,17], and these steps will help to streamline calculation process, and numerically present history of carbon footprint, as a basis for formulating strategies to reduce carbon emissions.
In examining the entire process of agricultural activities, its resource inputs and energy consumption should be included in calculation of agricultural carbon footprint, including chemical fuel usage, livestock rearing, agricultural land usage area, electricity usage, organic and chemical fertilizer usage, pesticide spraying, and water usage. To this end, GHG emissions that may be generated by individual inputs should be calculated, focusing on carbon footprint contribution of each segment of agricultural activities, which can explain the trend of carbon emissions between agricultural activities, reflecting overall carbon footprint emission pathway [18].
Measuring carbon footprint relies on data inventory and statistical modeling, with inventory and assessment process consuming significant labor and time costs [19,20]. However, the field of agriculture generally lacks transparency in activity process, digitization of activity records, and data-sharing facilities. Furthermore, and most importantly, there is no certain process sequence or operation standards based on climate. Most importantly, there is no certain process sequence and operation standard and agricultural operations are usually carried out according to factors such as climate and farm operation status, and a habit of real-time record-keeping is non-existent, making it difficult to accurately grasp details of past activities; given the uncertainty in source of data, the carbon footprint assessment encounters difficulties in data collection [21]. Agricultural carbon footprint is usually calculated by pairing carbon footprint (CFP) with life cycle assessment (LCA) methodology, as defined by ISO [22,23,24,25,26]. This approach follows a standardized process for building an inventory of individual emissions sources according to their carbon emissions pathways [27], and a few studies have accounted for total amount of carbon emissions by defining the scope of system themselves [28]. Common approach across carbon footprint assessment methodologies requires data to be obtained by researchers from multiple sources, which consumes significant time and labor. For example, experimental raw data can be obtained through on-site surveys and specific resources can only be obtained through general or specific databases, through which data is obtained at a cost. Costs associated with time and data acquisition can be saved if the results of previous research are in similar fields and backgrounds can be cited as references for the literature review. Both LCA and CFP can accurately calculate the carbon footprint; however, the source of data reference needs to take into account the differences in national and regional environments. Carbon emissions factors and carbon footprint databases are not internationally recognized data, and the lack of research data and literature sources will be an obstacle to calculation of carbon footprints in regions where related research data are incomplete. On the other hand, calculating carbon footprint using LCA requires relevant professional knowledge, which is an insurmountable threshold for most farmers, making it impossible for them to assess the carbon footprint of their respective operations and production systems and efficiently participate in carbon reduction activities.
In solving the above problems and challenges of carbon footprint assessment and data collection in agriculture, the concept of traceability data technology [29,30], which is used in food supply chain, transmits and allows it to share information in an intelligent system, can be leveraged. In this regard, details of the system operation are recorded and stored and used to remove the consumer’s concerns about food safety. In reflecting on feasible alternatives in agricultural sector, a viable one could be utilizing existing information management systems to reduce equipment investment and system construction costs, eliminate complex system requirements, and streamline data access. Taiwan’s Ministry of Agriculture has established an agricultural traceability system, which is currently widely adopted for recording agricultural production activities [31]. Traceability system has important information about complete production process, including basic information about farmland, cultivation schedules, annual crop production, fertilizer usage, and plant protection product consumption. This information aligns with data collected in on-site carbon inventories and can serve as a reference point for carbon footprint activity data. Accordingly, with propose a modified agricultural carbon footprint calculation method based on LCA. This method adheres to established carbon footprint calculation criteria, simplifies the complex carbon inventory process, and uses farmers’ customary agricultural and food production and marketing history systems as data sources. It aims to create a straightforward template for calculating carbon footprints, thereby reducing the barriers to assessing agricultural carbon footprint. This method allows farmers to conduct their own assessments based on registration data from their agricultural and food production and marketing history, enabling them to calculate and assess their agricultural carbon footprint based on their own production and marketing histories. Sixty-four plots of farmland in southern Taiwan were accordingly selected to illustrate and verify the feasibility of this improved methodology.
2. Materials and Methods
2.1. Case Description
A total of 64 farm production history records have been collected, includes all of farms certified with a traceable agricultural products (TAP) label. In this regard, total area studied is approximately 23.27 hectares. When collecting data on agricultural traceability system records for period of 2019–2021, each field’s records in the system for each year were treated as individual data points. Some fields did not get annual TAP labels. After statistical analysis, there were a total of 148 data points (covering three years).
Onion fields are divided into seedling and main cultivation areas. In seedling area, onion seeds are cultivated into seedlings, which are then transplanted and planted in main cultivation area. The average cultivation period for onions is 110 days. Local farmers employ conventional agriculture, with variations in cultivation duration, types of fertilizers used, and types of pesticides used. However, there are no significant differences in other aspects, such as farming practices, transportation methods, agricultural infrastructure, and harvesting methods. Agricultural machinery is used to assist in agricultural activities.
Focuses on all agricultural activities conducted in the main cultivation area after planting is completed. Figure 1 illustrates the onion cultivation process and corresponding agricultural activities. Following process sequence, can get a complete inventory of agricultural activities and possible sources of carbon emissions during onion life cycle. Cultivation process is divided into four stages, encompassing nine types of agricultural activities. In Land preparation stage, tractors are used for plowing, and cultivators are used for ridging, preparing a favorable planting environment for onion, totaling two agricultural activities. During Crop Growing stage, fertilizer is applied using a backpack fertilizer, fields are irrigated using a high-pressure pump, pesticides are applied with a high-pressure power sprayer, and weeds are managed using a backpack weeder, ensuring healthy crop growth and management, totaling four agricultural activities. During Harvesting stage, similar to Crop Growth stage, it is necessary to spray pesticides and weeds. Specifically, during harvesting, an onion root cutter is used to cut off the onion roots to facilitate pulling during harvesting. Harvested onions are sorted into harvesting bags and prepared for loading onto transport vehicles, which totals four agricultural activities. During Transportation Management stage, onions are placed in plastic baskets and transported by truck to centralized agricultural centers, where they are collectively handled and processed by local agricultural associations, totaling one agricultural activity.
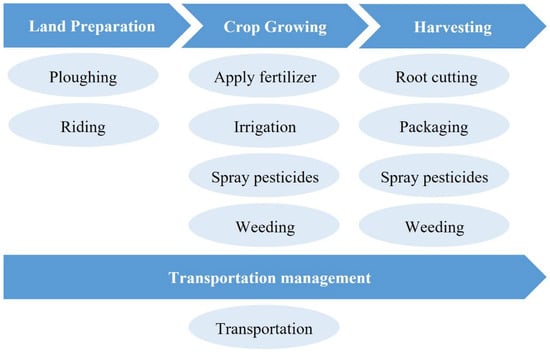
Figure 1.
Onion Cultivation Lifecycle.
2.2. Enhanced LCA Methodology for Carbon Footprint Assessment
The traditional carbon footprint assessment method is relatively cumbersome. Thus, this study aims to simplify traditional assessment method to reduce the threshold of carbon footprint calculation and data collection barriers. A modified LCA method based on the production process record estimation of carbon footprint is accordingly proposed [32], with the calculation steps shown in Figure 2 and the difference with the traditional assessment method lying in the source of data in Step 3. The qualitative and quantitative activity data obtained through the agricultural traceability system are treated as the results of the carbon emissions data collected through a manual process of CFV, which simplifies Step 3, Collecting Activity Data, in traditional assessment method for calculating carbon footprint, speeds up the efficiency of obtaining the activity data, and reduces the labor burden of manual measurement and record keeping. However, the original data from agricultural product traceability systems only partially fulfill data requirements. Additional sources are necessary to supplement information on actual agricultural activities obtained through self-computation and field visits. This approach fills data gaps in the agricultural traceability system, ensuring comprehensive activity data. Through data cleaning and consolidation, data are standardized and formatted to ensure quality, completeness, and consistency of assessment data, ultimately calculating total carbon footprint of agricultural cultivation processes.
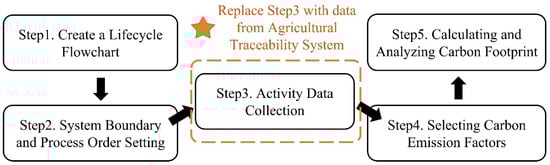
Figure 2.
Process of modified LCA carbon footprint calculation.
2.2.1. Definition of Agricultural Carbon Footprint Lifecycle
Referring to principles of LCA [24], this study redefines the lifecycle of agricultural carbon footprint from the perspective of crop growers, as depicted in Figure 3. It encompasses all agricultural activities during crop cultivation, including land preparation, crop growing, and harvesting stages, each involving different agricultural operations where the same resources may be used across various cultivation stages. Most agricultural operations are mechanized, typically using gasoline or diesel. The calculation considers both direct and indirect GHG emissions that farmers may generate during crop management, ensuring all factors influencing emissions are comprehensively accounted for as the basis for agricultural carbon footprint assessment.
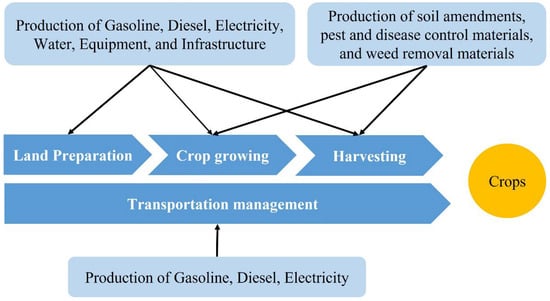
Figure 3.
Agricultural Carbon Footprint Lifecycle.
When calculating agricultural carbon footprint, considerations include the use of raw materials at each cultivation stage, utilization of agricultural machinery, cultivation management, and logistical transport. Assuming that after harvest, crops are directly delivered to local agricultural processing centers, non-cultivation-related agricultural activities before planting and after harvest will be excluded, such as seedling cultivation, the downstream processing of agricultural products, emissions of exhaust gases, grading, and sorting, distribution for sale, and waste disposal. Logistical transport stage refers to transportation services during cultivation process, operations involving transport between different destinations and farms, such as transporting raw materials from farmhouses to fields and crops from fields to agricultural distribution centers.
Each agricultural activity contributes differently to GHG emissions based on the items and resources used. For example, emissions from gasoline, diesel, electricity, water, equipment, and infrastructure can occur during all three cultivation stages. Meanwhile, GHG emissions from soil conditioners, pest control materials, and weed control materials may occur during crop growing and harvesting stages. Logistical transport stage spans entire cultivation process and may involve emissions from gasoline, diesel, and electricity. Inventorying inputs and outputs of each agricultural activity serves as the target for data collection. Relevant data are obtained from agricultural traceability system to calculate total agricultural carbon footprint during crop cultivation period.
2.2.2. Data on Agricultural Traceability System Records and Carbon Footprint Activities
Assessment scope and resource utilization can be determined from agricultural carbon footprint lifecycle, serving as the basis for collecting agricultural activity data. The original data for this study originates from agricultural traceability system, as shown in Figure 4, with raw data categorized into basic cultivation information and agricultural activity details based on attribute differences.
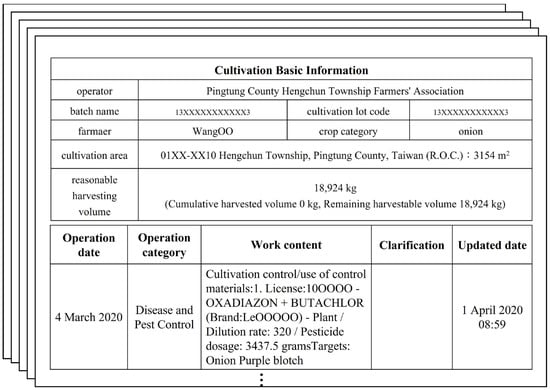
Figure 4.
Agricultural traceability system raw data.
Basic cultivation information comprises agricultural product operators, batch names, cultivation lot codes, the farmer’s name, crop category, cultivation areas (including plot numbers and areas), and reasonable harvest quantities (comprising cumulative harvest quantities and remaining harvestable quantities). Details of agricultural activity include operation dates, operation types, detailed tasks, explanatory notes, and update dates.
Carbon footprint calculations require categories identifying use items, quantities of resources being used, and other relevant usage information to accurately determine the closest carbon footprint. Figure 5 illustrates the composition of agricultural carbon footprint activity data sets, categorized into two main groups: feature information and essential field information. Feature information is extracted from the raw data for agricultural cultivation lifecycle. After comparing this with data requirements for the carbon footprint assessment, using define, organize, and gather the necessary information through methods such as self-definition, data compilation, and field visits. This process aims to compile comprehensive foundational information for carbon footprint assessment, including missing information, such as logistics transportation medium, irrigation water source, types of agricultural machinery, frequency of agricultural machinery use, duration of agricultural machinery operation, fuel used by agricultural machinery, and agricultural machinery fuel consumption.
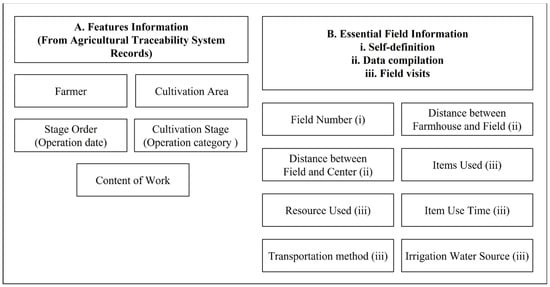
Figure 5.
Components of agricultural carbon footprint activity data.
From the raw data, valuable feature information, such as Farmer, Cultivation Area, Operation Date, Operation Type, and Task Details are sequentially extracted. The field Operation Type is renamed Cultivation stage to categorize operational content that corresponds to agricultural activities within cultivation stages, including land management, field cultivation management, planting/seedling propagation, fertilization, pest control, and harvesting. Category titled Planting/Seedling Propagation is excluded from agricultural carbon footprint lifecycle scope and, therefore, excluded from the raw data. The Cultivation Area is used to calculate carbon footprint per hectare of onion. All agricultural activities are sorted based on Operation Date field in raw data, and a new field, Sequence, is added to replace Operation Date, denoting the sequence of agricultural activity execution since different emissions occur depending on the type of pest control materials used, which must be included in the carbon footprint feature information. Therefore, for complete research, extracted the Task Details field, which comprises fertilizer types, fertilizer amounts, pesticide amounts, pesticide dilution ratios, other materials types, and other materials usage amounts.
Only self-defined item is Farmland number, sequenced based on Farmer and Cultivation area from agricultural traceability system. This approach allows each field to be distinctly segmented, facilitating raw data collection and identification.
Self-organized data comprises two items: Distance Between Farmhouse And Field and Distance Between Field And Agricultural Distribution Center. Depending on transportation method, differences in fuel consumption for energy resources and transport tools may exist. Initially, Cultivation Area from the raw data is used to obtain latitude and longitude coordinates of field locations, and then a Web Map Service is utilized to compute the minimum values as reference points. Based on this, the potential carbon emissions during logistics transportation process are calculated. Regarding Distance Between Farmhouse And Field, assuming agricultural materials will be stored in farmhouses, farmers transport appropriate quantities directly to fields for application without intermediate stops, maintaining consistent round-trip paths. The materials include fertilizers, pesticides, plastic baskets, and harvest bags. For the Distance Between Field And Agricultural Distribution Center, assumed after harvesting, crops will be transported directly to agricultural distribution center without intermediate stops, following a consistent round-trip path. Crops will be sorted, graded, and packaged at the center before being sold, processed, and shipped.
Field visit data includes five items: Items Used, Resource Used, Items Use Time, Transportation Method and Irrigation Water Source. Through farmers’ firsthand shared experiences, an overview of normal agricultural activities and conventional agriculture operations are obtained, and details are recorded, such as the types of machinery used, energy resources consumed, machinery performance, and other pertinent information, aiding carbon footprint assessment. Variations in machinery-related data stem from differences in operational speeds and farmers’ machinery usage habits.
Items Used: Farmers utilize various types of agricultural machinery and infrastructure to support agricultural activities. This field records the types of items used, including, but not limited to, tractors, cultivators, backpack fertilizer, high-pressure power sprayers, backpack weeders, root cutters, agricultural trucks, and loading/unloading trucks. Depending on the type of agricultural machinery used, there are differences in energy resource consumption, fuel consumption, and operational efficiency, which affect the amount of carbon emissions.
Resource Used: This item records the energy resource types utilized for each activity, including, but not limited to, gasoline, diesel, mixed oil, and electricity, each contributing differently to carbon emissions.
Items Use Time: This item logs duration and frequency of machinery use per session, offering information on calculating the hourly or per-use carbon footprint of agricultural machinery or equipment.
Transportation Method: This item pertains to means by which farmers manage transportation activities, utilizing vehicles like agricultural trucks and loading/unloading trucks for round-trip movements between fields, farmhouses, and agricultural distribution centers. Understanding transportation methods and their associated energy resource consumption helps quantify fuel consumption and resultant carbon emissions during logistical operations.
Irrigation Water Source: This selection depends on local water resource conditions, with different water resource situations contributing to varying levels of carbon footprint impact in agricultural irrigation practices.
By integrating feature and essential field information, compiling agricultural carbon footprint activity data. Through organizing and cleaning, raw structured data transforms into unstructured yet usable quantitative assessment data. This process ensures the quality, completeness, and consistency of assessment data, thereby providing a reliable data foundation for subsequent carbon footprint analysis.
2.2.3. Appropriate Carbon Emissions Coefficients
After obtaining data from agricultural traceability system, it is necessary to find suitable carbon emissions factors to calculate carbon footprint during crop cultivation period. Selection of emissions factors will affect the calculated results of carbon footprint. Without a unified data reference, there could be uncertainty in the results. Priority should be given to the considering factors data from IPCC Guidelines for National Greenhouse Gas Inventories and announcements from national-level authorities. If these sources do not provide relevant carbon emissions factors, reliable and accurate data sources should be sequentially consulted, such as raw material manufacturing processes, relevant literature with similar backgrounds, or factors calculated and provided by relevant regulatory authorities or operational units, to ensure data consistency.
In agricultural activities during the cultivation process, different emissions sources have their respective carbon emissions factors. After inventorying emissions source types and identifying suitable carbon emissions factors for each, the carbon footprint calculation formula can be applied to determine the carbon emissions of each agricultural activity. Emissions sources across the lifecycle of each activity are categorized into three types: raw materials (P), goods (B), and fuels (E). It is necessary to convert the emissions factors of various sources into a unified unit expressed as CO2eq to facilitate smooth calculations, quantifying the carbon dioxide equivalent emissions per unit of energy. Table 1 presents carbon emissions factors used for calculating agricultural carbon footprints.

Table 1.
Carbon emissions factors used for carbon footprint assessment.
P refers to the most basic raw materials and resources used in the production or manufacturing processes, such as water, fertilizers, and pesticides. Water is primarily used for diluting pesticides or irrigation. Carbon emissions factor of tap water can be referenced from statistical data published by Taiwan Water Corporation [34], indicating that the carbon dioxide equivalents per cubic meter (m3) of water used are 0.152 kg CO2eq. If irrigation water is sourced from irrigation channels supplied by tap water, its carbon emissions are typically disregarded because environmental impacts generated at the source or during processing are not usually measured in terms of carbon emissions. Fertilizers have complex compositions, and their carbon footprint is typically estimated by multiplying the carbon dioxide equivalents per kilogram of major nutrients, such as nitrogen (N), phosphorus (P2O5), and potassium (K2O), by their respective concentrations in the fertilizer, and then summing them up. Due to the lack of relevant research literature in Taiwan, data from Japan, which shares similar geographical crop growth environments and conditions, are used instead. The data are sourced from the Japan CFP Office [36], with the carbon dioxide equivalents per kilogram of major components presented, while components with lower concentrations are referenced from relevant carbon footprint databases. Although animal manure is also a natural nutrient fertilizer, it has been excluded from the study due to difficulties in obtaining data from agricultural traceability system and actual interviews [32]. Type, composition, and concentration all affect the carbon emissions of pesticides. In this study, utilize average carbon emissions per kilogram calculated by Lal for various types of pesticides as their emission factors [39]. References pesticide properties to categorize them into insecticides, herbicides, and fungicides.
B refers to processed or manufactured products, such as plastic baskets and harvesting bags. Due to the unique specifications of plastic baskets and harvesting bags, there is no established research on uniform carbon emissions coefficients. Therefore, it is not possible to directly find relevant carbon emissions data in related carbon footprint databases. Hence, carbon emissions factors of the main raw materials are used as a substitute for their carbon emissions factors [33]. Main material of plastic baskets is polypropylene, and main material of harvesting bags is polyester. Both plastic baskets and harvesting bags are reusable resources with varying lifespans depending on actual product condition. Assume that each item has the same lifespan, using the average annual contribution to carbon dioxide equivalents as the basis for calculation.
E represents fuels used to power machinery and equipment, such as gasoline, diesel, blended fuel, and electricity. Blended fuel refers to a specific mixture of gasoline and diesel combined in specific proportions. Machinery fuels include gasoline, diesel, and blended fuel, primarily used in agricultural machinery operations. Carbon emissions factors can be referenced from the announcement data of Taiwan Environmental Protection Administration [33]. Specifically, carbon dioxide equivalent emissions of gasoline emits 3.02 kg CO2eq per liter, and diesel emits 3.38 kg CO2eq per liter. Electricity primarily powers agricultural infrastructure, such as high-pressure pumps for irrigation. The carbon emissions coefficient for electricity can be referenced from statistical data announced by Taiwan Ministry of Economic Affairs, Energy Bureau, regarding household electricity consumption [35], which shows the carbon dioxide equivalents per kilowatt-hour (kWh) of electricity generated.
3. Results
3.1. Equation for Calculating Agricultural Carbon Footprint
Following the optional emissions factor method outlined in PAS 2050 (specification for the assessment of the life cycle GHG emissions of goods and services) [40], revised the formula for calculating total agricultural carbon emissions as Equation (1) [32]. It extracts various types of information from agricultural carbon footprint activity data concerning different cultivation stages and specifically gathers details from fields such as Content Of Work, Items Used, and Resources Used. Resources Used are further categorized into raw materials (P), materials (B), and fuels (E), enabling estimation of the carbon emissions for each stage of activity. Carbon emissions of a single activity are derived from GHG emitted by its sources, then multiplied by the corresponding carbon emission factors (C1, C2, C3) to convert them into numerical form. Summing the carbon emissions of all activities during agricultural cultivation provides the total carbon emissions (TCE) for entire assessment process. The functional unit is per kilogram of crop (ton yield−1), using carbon dioxide equivalent emissions (CO2eq unit−1) as calculation standard [41,42].
Formula for calculating agricultural carbon footprint, as shown in Equation (2), divides the TCE by functional unit (F) to obtain agricultural carbon footprint (CF). Table 2 presents parameters and their corresponding codes for the formulas used to calculate total agricultural carbon emissions and the agricultural CF.
TCE = Σ(Pi × C1i + Bi × C2i + Ei × C3i)
Table 2.
Parameters of Equation and corresponding codes.
Equation (1). calculating total agricultural carbon emissions.
CF = TCE/F
Equation (2). calculating agricultural carbon footprint.
3.2. Carbon Footprint of the Onion Cultivation Process
Using the P, B, and E data related to a single agricultural activity in the agricultural CF calculation formula Equation (2), determined that average CF of onions in southern Taiwan is 306 kg CO2eq per metric ton. Figure 6 illustrates the calculated average carbon emissions of one metric ton of onions during various cultivation processes. Fertilizer contributes the most to CF, accounting for nearly 30% of the total CF, at 28.75% (88 kg CO2eq). It is followed by harvesting bags, contributing 26.76% (81.9 kg CO2eq), and fuel used in machinery, contributing 25.77% (78.9 kg CO2eq). The contributions of these top three factors are quite close, suggesting that fertilizers, harvesting bags, and machinery fuel are likely major sources of the CF.
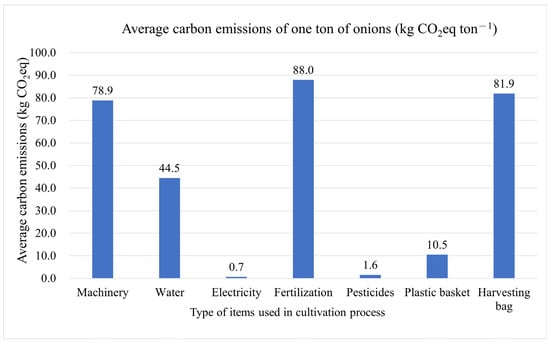
Figure 6.
Carbon footprint of onions in different cultivation processes.
Conventional agricultural practices influence farmers’ decisions on fertilizer application and pesticide spraying. During onion growth process, soil fertility requires substantial amounts of fertilizer to provide the nutrients necessary for growth. Increased fertilizer input increases the likelihood of achieving optimal onion yields, leading to TCE from fertilizers surpassing emissions from other sources. These activities generate substantial GHG emissions, making them hotspots in the entire cultivation process.
For harvesting stage, more onions harvested, more harvesting bags are used to meet the loading requirements. Harvesting bags have a higher CF compared to plastic baskets. Additionally, the material and lifespan of bags also influence the magnitude of their CF.
Through tracking GHG emissions sources, it was found that machinery fuel, including diesel and gasoline used in various types of agricultural machinery, such as tractors, cultivators, backpack fertilizers, high-pressure power sprayers, backpack weeders, and onion root cutters, contributes significantly. Due to high mechanization levels in southern Taiwanese agriculture and the frequent use of diverse agricultural machinery during field operations, these inputs consume considerable time and generate substantial GHG emissions, making them hotspots in entire cultivation process.
3.3. Analyzing the Strengths and Weaknesses of Assessment Methods from Data Perspective
By analyzing data sources and characteristics comparing the traditional LCA CF assessment method with the improved LCA CF assessment method proposed in this study, we can delve into their performance in terms of data collection, result accuracy, and applicability. This comparison highlights the characteristics and effectiveness of the two methods, understanding their suitability in practical applications and thereby clarifying the strengths and weaknesses of each method in data analysis.
In comparing CF assessment methods, traditional methods and modified method in this study each demonstrates distinct advantages and disadvantages. Traditional methods are characterized by comprehensive manual data inventories and holistic LCA, which provide detailed insights into CF information throughout agricultural cultivation process. They can utilize existing official assessment results as a reference base for analysis explanations. On the other hand, data collection process involves tedious calculation steps and costly CFV, requiring a certain level of expertise, thereby posing significant entry barriers to CF assessment in the agricultural domain. Tailoring carbon inventories and statistical analysis steps for different products and services allows for effective CF assessments. Furthermore, traditional methods require distinct carbon accounting and statistical analysis steps tailored to different products and services to conduct these assessments (Table 3).
Table 3.
Comparison of carbon footprint assessment methods between this study’s modified and traditional one.
This study proposes a solution in response to the previously mentioned challenges. Agricultural traceability system is now widely adopted and allows qualified producers to freely download system records. The direct conversion of system records into CF activity data significantly simplifies the CFV steps in CF assessments and reduces the professional threshold and cost of calculation. System records provide lifecycle-related information, such as raw material procurement, production processes, and transportation methods, enhancing transparency and availability of agricultural data. However, this research method relies on challenges related to the completeness of system data and the supplementation of external data. Ensuring reliable data sources is critical for CF assessment, including on farmers, raw material suppliers, and manufacturers, and improves the efficiency of CF assessments. Otherwise, there is a risk of data gaps or inaccurate assessment results. This assessment method is applicable across various sectors involving system data, such as agriculture, forestry, fisheries, and livestock farming.
3.4. Comparison of the Carbon Footprint Assessment Methods between Modified Version and Traditional Version
As of the completion date of this study, there have been no publicly available research results on onion CF assessments in Taiwan. Most agricultural CF assessments primarily focus on traditional farming practices, excluding agricultural machinery from their scope. This discrepancy proves challenging to draw direct comparisons with studies from different research backgrounds. Given this situation, reference was made to the most similar research background as conducted by Esmaeilzadeh et al. [43] regarding onion CF assessment. They investigated the relationship between farm scale and CF, considering specific factors, such as farm size, climate conditions, and soil texture.
Before proceeding with comparisons, it is crucial that verifing credibility and accuracy of the total agricultural carbon emissions calculation formula (Formula (1)) used. This verification begins with confirming basic backgrounds such as agricultural context, climate conditions, cultivation methods, and the use of agricultural machinery in previous studies. Consistency in these agricultural domain backgrounds provides a basis for evaluating potential errors in the calculation formula used in this study.
In the study, onions were cultivated in Iran, where they are among the top ten most valuable agricultural products locally and rank fifth globally in terms of production volume. The agricultural practices in the region are similar to those in our study, predominantly involving irrigation and the use of agricultural machinery for farming operations. Their analysis explored impact of farm scale on potential global warming effects, particularly focusing on resource inputs affecting factors categorized into agriculture, energy, agricultural machinery, and transportation. These inputs include chemical fertilizers, pesticides, electricity, diesel, self-propelled machinery, fixed infrastructure, and attachments. This classification closely aligns that converting all input materials into a CF to comprehensively assess onion production system.
The total CF per metric ton of onions in production system is approximately 324 kg CO2eq. Agricultural machinery accounts for the highest proportion of CF emissions, reaching up to 57%. The CF of agricultural machinery is influenced by factors such as machinery type, frequency of farm operations, and even soil properties, which affect fuel consumption.
In comparison, this differs from the findings of Esmaeilzadeh et al. by approximately 5%. Factors potentially influencing CF calculations, such as differences in carbon emissions coefficient references, production system input energy resources, cultivation environments, agricultural planting methods, and conventional agricultural materials, are similar. However, variations in frequency of agricultural machinery use or labor intensity lead to slight discrepancies in onion CF results.
4. Discussion
Research data collection is completed by extracting original agricultural traceability system records and conducting field interviews with farmers. However, these data sources have limitations [32]. Firstly, agricultural traceability system does not require mandatory fields, making it easy for information to be missing [44]. Secondly, infor-mation, such as fertilizer and pesticide usage, is input by farmers based on current condi-tions, potentially introducing some discrepancies with actual practices. Thirdly, some activity data in this study is obtained through actual interviews, differences in interviewees’ personal experiences and judgment criteria may lead to slight variations in interview results.
The above limitations are unavoidable in a practical study, the focus discussion shifts to exploring data collection and application [45].
In terms of data collection, data are mainly obtained from agricultural traceability system, supplemented by direct interviews and data compilation. This approach demonstrates the practicality and effectiveness of using improved methodology, improving assessment efficiency and accuracy while lowering the professional threshold required for conducting assessments.
Future research can further expand the application scope of system records and related statistical analyses to explore more precise and comprehensive CF assessment models. This recommended focus will help address new challenges posed by global climate change and environmental conservation [46].
In the future, in line with the international release of net-zero carbon reduction strategies, it may be possible to expand data diversity and integrate more environmental factors, such as soil properties and water resource changes, to increase the flexibility of CF calculations [47]. On the other hand, establishing more comprehensive education and training mechanisms to improve the collection of primary data, thereby enhancing accuracy of CF calculation results [48].
5. Conclusions
The improved LCA CF assessment method integrates agricultural product traceabil-ity system as the primary data source, no need to go through a complicated CFV process, just download the existing data on agricultural traceability system, can start calculating carbon footprint as soon as possible.
Through the methodology, collected activity data can not only for agricultural CF calculations but also for material inventory purposes, providing insights into various sta-tistical data, such as types of agricultural machinery used, average usage hours, and other cultivation requirements.
This innovation successfully streamlines the CF inventory process, reducing both labor costs and time investments. To compared to traditional assessment method, results show a margin of error is less than 6% compared to traditional assessment methods. Not only provides detailed agricultural activity data but also effectively collects and manages information on energy consumption and emissions throughout cultivation process, and reduces the barrier for assessing agricultural CF, allowing more farmers to participate in CF reduction efforts and enhancing calculation efficiency and accuracy It serves as an intuitive and user-friendly evaluation tool for Farmers’ Association or Agricultural Production and Marketing Group.
The agricultural traceability system includes information related to agricultural, foestry, fishery, and livestock products, makes the method has broad application potential, extending beyond specific crops like onion cultivation to other agricultural products, contributing to sustainable agriculture and global GHG emission reduction.
Author Contributions
Conceptualization, Z.-Y.L., Y.-H.K. and W.-C.K.; Methodology, Z.-Y.L.; Formal analysis, S.-C.L.; Investigation, Y.-T.C.; Resources, S.-H.L.; Data curation, S.-H.L.; Writing—original draft, Z.-Y.L.; Writing—review & editing, W.-C.K.; Project administration, C.-C.C. All authors have read and agreed to the published version of the manuscript.
Funding
Thanks for the support and assistance provided by Industrial Technology Research Institute, Central Region Campus, in interdisciplinary smart integration and innovative technology development project (Project Number: 111-EC-17-A-21-1589), and onion Smart Field Management Platform project (Project Number: 111農科-8.1.2-科-aA) for this research.
Data Availability Statement
The original contributions presented in the study are included in the article, further inquiries can be directed to the corresponding author.
Conflicts of Interest
The authors declare no conflict of interest.
References
- Allen, M.; Dube, O.P.; Solecki, W.; Aragón-Durand, F.; Cramer, W.; Humphreys, S.; Kainuma, M. Special Report: Global Warming of 1.5 C; Intergovernmental Panel on Climate Change (IPCC): Geneva, Switzerland, 2018. [Google Scholar]
- IPCC. 2021: Summary for Policymakers. In Climate Change 2021: The Physical Science Basis. Contribution of Working Group I to the Sixth Assessment Report of the Intergovernmental Panel on Climate Change; IPCC: Geneva, Switzerland, 2021. [Google Scholar]
- Shakoor, A.; Shakoor, S.; Rehman, A.; Ashraf, F.; Abdullah, M.; Shahzad, S.M.; Farooq, T.H.; Ashraf, M.; Manzoor, M.A.; Altaf, M.M.; et al. Effect of animal manure, crop type, climate zone, and soil attributes on greenhouse gas emissions from agricultural soils—A global meta-analysis. J. Clean. Prod. 2021, 278, 124019. [Google Scholar] [CrossRef]
- Lee, J.H.; Chang, Y.C. Evaluation of Onion Varieties and Their Characteristics in Taiwan. Taiwan Agric. Res. 2020, 54, 123–135. [Google Scholar]
- Lin, Y.H.; Kao, C.H. Economic Impact of Agriculture on Taiwan’s Rural Development. Taiwan Rural Dev. Rev. 2019, 27, 33–47. [Google Scholar]
- Chen, C.H.; Huang, M.L. Promoting Green Agricultural Practices to Reduce Carbon Footprint in Taiwan. J. Environ. Agric. 2022, 20, 77–90. [Google Scholar]
- Huang, Y.-H.; Tsai, W.-T. Soil and water management in Taiwan agriculture. J. Soil Water Conserv. 2021, 56, 112–125. [Google Scholar]
- Ministry of Agriculture, TWN. Taiwan Agricultural Technology Innovation Report; Council of Agriculture: Taipei, Taiwan, 2022. [Google Scholar]
- Ministry of Environment, TWN. Taiwan Greenhouse Gas Inventory Report; Environmental Protection Administration: Taipei, Taiwan, 2023. [Google Scholar]
- Wang, J.T.; Liu, H.P. Advancements in Agricultural Technology and Their Impact in Taiwan. Agric. Technol. J. 2020, 12, 89–102. [Google Scholar]
- Huang, C.H.; Lin, K.C. Seasonal Patterns and Climate Adaptation of Onion Cultivation in Taiwan. J. Taiwan Agric. Stud. 2018, 16, 45–59. [Google Scholar]
- Chen, S.H.; Chang, C.L. Agricultural Structure and Small-Scale Farming in Taiwan. J. Agric. Econ. 2021, 38, 78–92. [Google Scholar]
- Aykaç Özen, H.; Vayiç, B.; Çoruh, S. Assessment of organizational carbon footprints in a denim-washing company: A systematic approach to indirect non-energy emissions. Environ. Sci. Pollut. Res. 2024, 31, 35897–35907. [Google Scholar] [CrossRef]
- Chang, S.K.; Lee, H.J. Fertilizer and Pesticide Use in Taiwan: Environmental Consequences and Management Strategies. Taiwan Environ. Sci. Rev. 2019, 22, 54–67. [Google Scholar]
- Hsu, Y.J.; Chen, L.F. Energy Efficiency and Carbon Reduction Strategies in Taiwanese Agriculture. J. Sustain. Agric. 2021, 15, 211–224. [Google Scholar]
- Tsai, Y.W.; Chou, T.S. Land Use Changes and Environmental Impacts in Taiwan Agriculture. Environ. Manag. J. 2020, 46, 123–135. [Google Scholar]
- Zhang, X.; Xu, L. Life Cycle Assessment of Agricultural Products: A Case Study of Onion Cultivation in Taiwan. J. Clean. Prod. 2021, 273, 123–135. [Google Scholar]
- Al-Mansour, F.; Jejcic, V. A model calculation of the carbon footprint of agricultural products: The case of Slovenia. Energy 2017, 136, 7–15. [Google Scholar] [CrossRef]
- Marras, S.; Masia, S.; Duce, P.; Spano, D.; Sirca, C. Carbon footprint assessment on a mature vineyard. Agric. For. Meteorol. 2015, 214, 350–356. [Google Scholar] [CrossRef]
- Peter, C.; Fiore, A.; Hagemann, U.; Nendel, C.; Xiloyannis, C. Improving the accounting of field emissions in the carbon footprint of agricultural products: A comparison of default IPCC methods with readily available medium-effort modeling approaches. Int. J. Life Cycle Assess. 2016, 21, 791–805. [Google Scholar] [CrossRef]
- Hang, L.; Ullah, I.; Kim, D.H. A secure fish farm platform based on blockchain for agriculture data integrity. Comput. Electron. Agric. 2020, 170, 105251. [Google Scholar] [CrossRef]
- Usva, K.; Sinkko, T.; Silvenius, F.; Riipi, I.; Heusala, H. Carbon and water footprint of coffee consumed in Finland—Life cycle assessment. Int. J. Life Cycle Assess. 2020, 25, 1976–1990. [Google Scholar] [CrossRef]
- Wang, H.; Yang, Y.; Zhang, X.; Tian, G. Carbon footprint analysis for mechanization of maize production based on life cycle assessment: A case study in Jilin Province, China. Sustainability 2015, 7, 15772–15784. [Google Scholar] [CrossRef]
- Khoshnevisan, B.; Rafiee, S.; Omid, M.; Mousazadeh, H.; Clark, S. Environmental impact assessment of tomato and cucumber cultivation in greenhouses using life cycle assessment and adaptive neuro-fuzzy inference system. J. Clean. Prod. 2014, 73, 183–192. [Google Scholar] [CrossRef]
- Bartzas, G.; Zaharaki, D.; Komnitsas, K. Life cycle assessment of open field and greenhouse cultivation of lettuce and barley. Inf. Process. Agric. 2015, 2, 191–207. [Google Scholar] [CrossRef]
- Adewale, C.; Higgins, S.; Granatstein, D.; Stöckle, C.O.; Carlson, B.R.; Zaher, U.E.; Carpenter-Boggs, L. Identifying hotspots in the carbon footprint of a small scale organic vegetable farm. Agric. Syst. 2016, 149, 112–121. [Google Scholar] [CrossRef]
- ISO 14067:2018; Greenhouse Gases—Carbon Footprint of Products—Requirements and Guidelines for Quantification. International Organization for Standardization: Geneva, Switzerland, 2018.
- de Jesus Pereira, B.; Cecílio Filho, A.B.; La Scala, N., Jr. Greenhouse gas emissions and carbon footprint of cucumber, tomato and lettuce production using two cropping systems. J. Clean. Prod. 2021, 282, 124517. [Google Scholar] [CrossRef]
- Parashar, S.; Sood, G.; Agrawal, N. Modelling the enablers of food supply chain for reduction in carbon footprint. J. Clean. Prod. 2020, 275, 122932. [Google Scholar] [CrossRef]
- Aung, M.M.; Chang, Y.S. Traceability in a food supply chain: Safety and quality perspectives. Food Control 2014, 39, 172–184. [Google Scholar] [CrossRef]
- Ministry of Agriculture, TWN. Knowledge of Traceable Agricultural Products Verification System, Traceable Agricultural Products Information. 2023. Available online: https://taft.moa.gov.tw/mp-1.html (accessed on 28 September 2024).
- Lee, Z.-Y. Evaluation of Carbon Footprint Hotspots Using Process Mining–A Case Study of Onion Production. Master’s Thesis, National Sun Yat-sen University, Kaohsiung, Taiwan, 2023. [Google Scholar]
- Ministry of Environment, TWN. Carbon Footprint Emission Coefficient, Environmental Information Open Platform. 2023. Available online: https://data.moenv.gov.tw/ (accessed on 28 September 2024).
- Taiwan Water Corporation. Approximately the Equivalent of Carbon Dioxide (CO2) Is Emitted Per Degree of Water Consumption; Taiwan Water Corporation Official: Taichung, Taiwan, 2020. Available online: https://www.water.gov.tw/ch (accessed on 28 September 2024).
- Ministry of Economic Affairs, TWN. 110 Annual Electricity Carbon Emission Coefficient, Energy Administration, Ministry of Economic Affairs, TWN. 2022. Available online: https://www.moeaea.gov.tw/ecw/populace/home/Home.aspx (accessed on 28 September 2024).
- Product Category Rules. Japan Urichi Rice (Japonica Rice), Carbon Footprint of Products of Japan. 2009. Available online: https://www.jstage.jst.go.jp/article/ilcaj/2009/0/2009_0_60/_article/-char/ja/ (accessed on 28 September 2024).
- DoITPro Carbon Footprint Database. Industrial Technology Research Institute, TWN, 2015. Available online: https://scmp.itri.org.tw/Frontend/WebPage/index.aspx (accessed on 28 September 2024).
- U.S. Life Cycle Inventory Database. National Renewable Energy Laboratory. 2012. Available online: https://www.lcacommons.gov/nrel/search (accessed on 19 November 2012).
- Lal, R. Carbon emission from farm operations. Environ. Int. 2004, 30, 981–990. [Google Scholar] [CrossRef]
- PAS 2050:2011; Specification for the Assessment of the Life Cycle Greenhouse Gas Emissions of Goods and Services. British Standards Institution: London, UK, 2011.
- Ministry of Economic Affairs, TWN. Product Carbon Footprint, Manufacturing Product Environmental Carbon Footprint and Resource Sustainability Information. 2022. Available online: https://www.idbcfp.org.tw/ (accessed on 28 September 2024).
- Ministry of Environment, TWN. Carbon Footprint Label, Product Carbon Footprint Information. 2022. Available online: https://cfp-calculate.tw/ (accessed on 28 September 2024).
- Esmaeilzadeh, S.; Asgharipour, M.R.; Khoshnevisan, B. Water footprint and life cycle assessment of edible onion production—A case study in Iran. Sci. Hortic. 2020, 261, 108925. [Google Scholar] [CrossRef]
- Gao, H.; Liu, Z.; Wang, Q. Discrepancies in Fertilizer and Pesticide Usage Reporting. Environ. Sci. Technol. 2020, 54, 123–134. [Google Scholar]
- Yang, L.; Zhao, S.; Wang, J. Applications of Agricultural Data in Carbon Footprint Calculations. Sustain. Agric. J. 2022, 14, 101–115. [Google Scholar]
- Liu, Y.; Zhang, H.; Li, X. Advancements in Carbon Footprint Assessment Models: Addressing Climate Change Challenges. Environ. Sci. Policy 2021, 116, 115–128. [Google Scholar]
- Smith, A.; Martin, R.; Gonzalez, P. Integrating Environmental Factors into Carbon Footprint Calculations: The Role of Soil and Water Data. J. Environ. Manag. 2022, 305, 114386. [Google Scholar]
- Jones, T.; Lee, M. Enhancing Data Collection Through Education and Training for Improved Carbon Footprint Accuracy. J. Sustain. Dev. 2023, 27, 45–59. [Google Scholar]
Disclaimer/Publisher’s Note: The statements, opinions and data contained in all publications are solely those of the individual author(s) and contributor(s) and not of MDPI and/or the editor(s). MDPI and/or the editor(s) disclaim responsibility for any injury to people or property resulting from any ideas, methods, instructions or products referred to in the content. |
© 2024 by the authors. Licensee MDPI, Basel, Switzerland. This article is an open access article distributed under the terms and conditions of the Creative Commons Attribution (CC BY) license (https://creativecommons.org/licenses/by/4.0/).