1. Introduction
With the rapid development of urban rail transit, the instances of new subways crossing near existing high-speed rail bridges are increasing [
1,
2,
3,
4]. Due to the high speeds clocked by high-speed railway trains, the generated vibration load can have an adverse dynamic effect on the overlapping bridge–tunnel structure [
5,
6,
7,
8]. Under the combined action of the vibration loads generated by subways and high-speed trains, this adverse effect becomes more prominent, making it necessary to perform dynamic research.
Currently, several studies have been conducted on the dynamic response of bridges or tunnel structures under train vibration loads. Zheng et al. [
9] studied the strength performance of a concrete tunnel structure under train loading based on field measurement and numerical simulation. The strength attenuation of the concrete at different ages under different dynamic load levels was determined. Shi et al. [
10] used the numerical simulation method to study the spalling and falling of concrete blocks of a tunnel lining under the load of a high-speed train running at different speeds. The tunnel was divided into safe and dangerous areas based on the calculation results. Regarding the dynamic response, Fu et al. [
11] and Zhang et al. [
12] clarified that a pile raft composite foundation and CFG pile-supported subgrade can effectively reduce the vibration level and improve the safety of train operation, respectively. Yang et al. [
13] applied the model test method to analyze the dynamic response characteristics of a tunnel under the vibration loading of a high-speed train and reported a significant difference in the dynamic effect of cross-sectional shapes on tunnels. Guo et al. [
14] investigated the dynamic response of a shield tunnel structure and soil under the train vibration of Xiamen Metro Line 6. Xu et al. [
15] studied the dynamic response of the pile–soil foundation of a close-distance tunnel under a high-speed train load and divided the tunnel into three zones based on the safety threshold: dangerous zone, strongly affected zone, and weakly affected zone. Yang et al. [
16] and Ding et al. [
17] studied the dynamic response of a tunnel with cracks or voids behind the lining to train vibrations. Zhang et al. [
18] monitored the dynamic response of the ground surface and reported a significant increase in the ground vibration induced by the simultaneous operation of the railway and the subway train.
However, relevant research on the dynamic response of the overlapping section of the bridge and tunnel is lacking. When a high-speed railway bridge and a subway tunnel overlap, the working conditions become more complicated due to the existence of the bridge pile foundation, particularly the overlapping bridge–tunnel structure under the combined action of the vibration loads generated by the subway and high-speed trains. Compared with a composite pile–soil foundation, the propagation law of the vibration waves changes, and the superimposed vibration load will have a more prominent impact on the structure, and in severe cases will even threaten structural and traffic safety. Hence, it is necessary to perform relevant research in this area.
In this study, the undercrossing of the Daxi high-speed railway bridge by Xi’an Metro Line 14 was taken as an engineering example, and the dynamic response characteristics of the bridge–tunnel overlapping structure in the frequency and time domains were investigated by performing numerical simulation and model tests. Considering the movement effect and superposition effect of the high-speed railway and subway trains, a 3D finite model was established to study the dynamic response of the bridge–tunnel overlapping structure. The objective of this study was to investigate the dynamic response characteristics of bridge–tunnel overlapping structures under the synergistic effects of high-speed railways and subways and provide a theoretical basis for actual engineering.
2. Dynamic Response of a Bridge–Tunnel Overlapping Structure under Single-Point Vibration Load
2.1. Project Overview
The tunnel section of the Xi’an Metro Line 14 undercrossing the Datong–Xi’an high-speed railway and the Xi’an–Tongchuan highway special bridge was taken as a research object, as shown in
Figure 1. The buried depth of the tunnel section is approximately 11 m, and the tunnel is constructed mainly in medium sand and silty clay. The shield segment has an outer diameter of 6 m and a thickness of 0.3 m. The minimum distance between the outer edge of the tunnel and the outer edge of the high-speed railway bridge pile is 3.78 m. The bridge is a 32 m span simply supported box girder. Each bearing platform is equipped with eight bored piles, and the bearing dimensions are 12.2 m × 6.8 m. The diameter and length of the pile foundation are 1.25 m and 46 m, respectively.
2.2. Model Test
2.2.1. Determination of Experimental Similarity Constant
The test was mainly intended to study the dynamic response characteristics of the bridge–tunnel overlapping structure under vibration loading. According to relevant research results [
19,
20,
21,
22,
23], the deformation of a structural model under dynamic action is within the elastic range. Therefore, only the elastic similarity criterion needs to be satisfied. Based on the full consideration of the operability and reliability of the test, the similarity relationships of the length
L, density
ρ, and elastic modulus
E, which are the basic parameters of this test, are determined as follows:
The remaining physical quantities include acceleration
a, velocity
v, time
t, frequency
w, and load
F. Their similarity relationships can be calculated and determined based on the similarity theorem and the similarity relationships of basic physical quantities, as follows:
The model soil is composed of sand and clay.
Table 1 presents the specific parameters. To ensure the effectiveness of the dynamic model test, an organic glass with a low elastic modulus and an easy-to-meet measurement accuracy was selected as the material of the pile foundation and tunnel structure in this test. Its elastic modulus was 2.5 GPa. The prototype tunnel and pile were made from C40 concrete with an elastic modulus of 35.5 GPa. The similarity constants are obtained as follows:
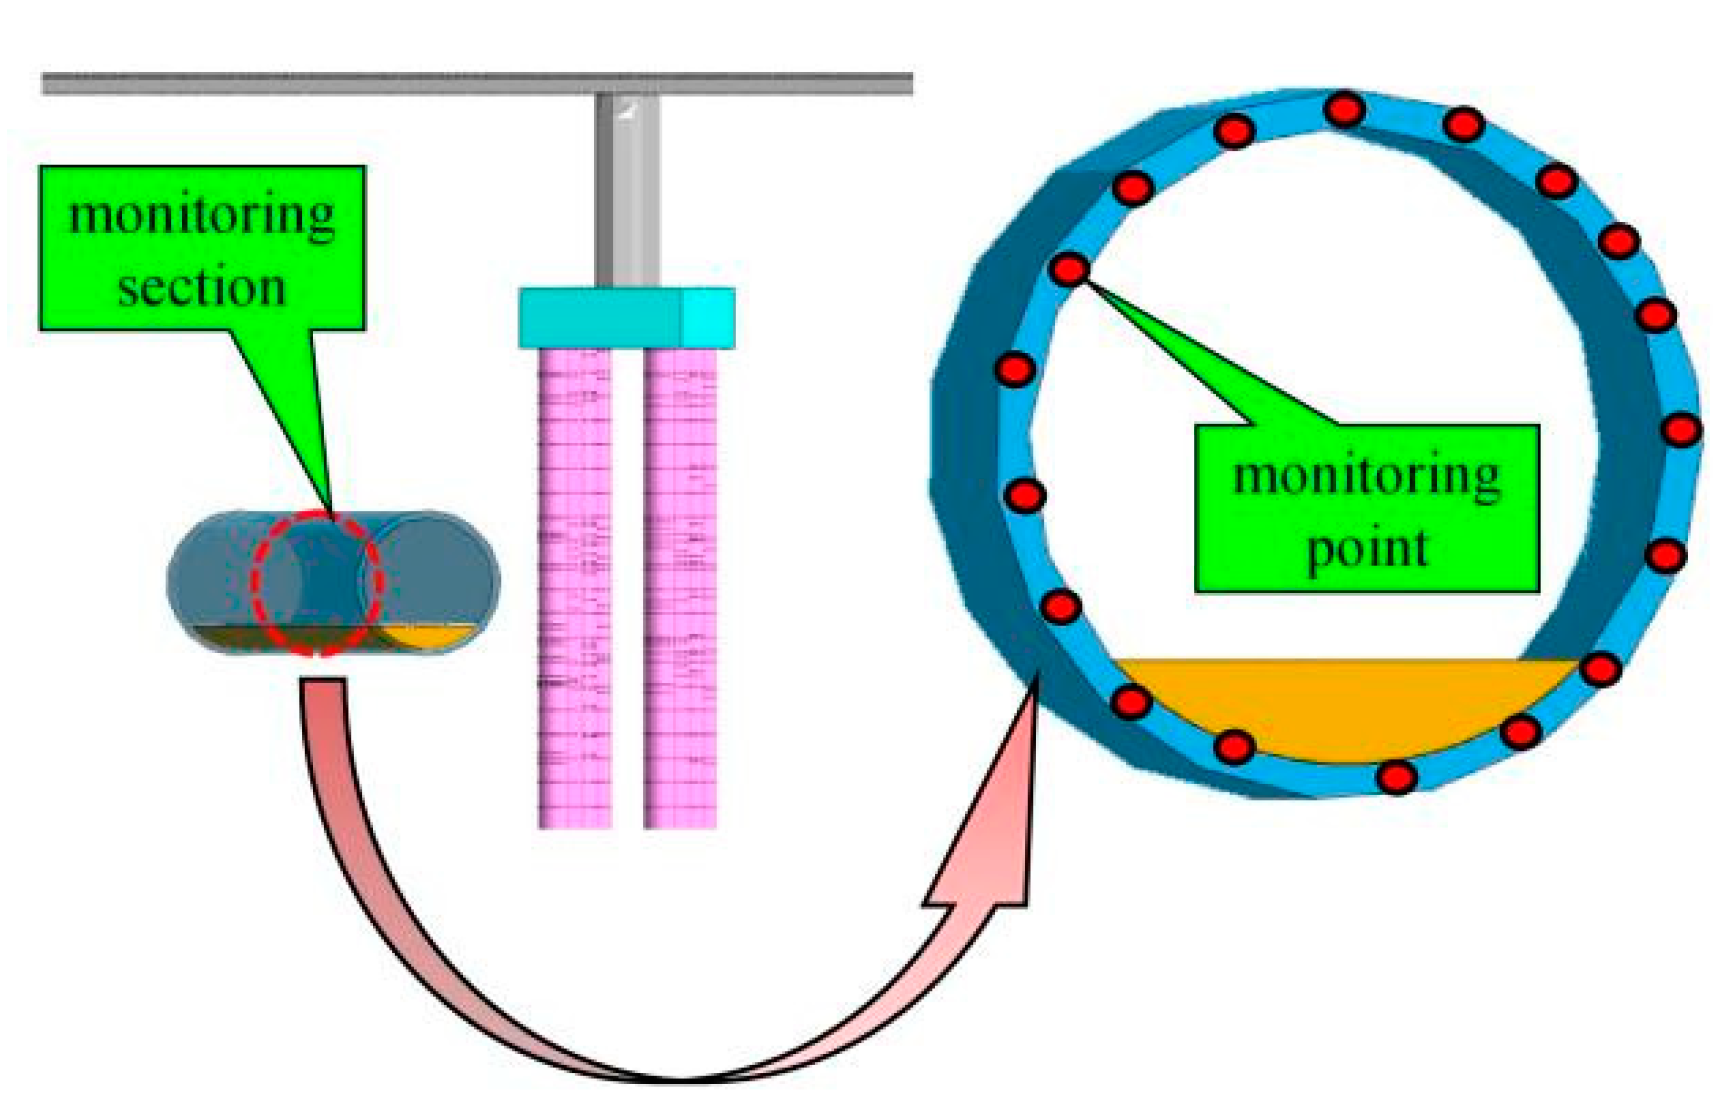
2.2.2. Test Device
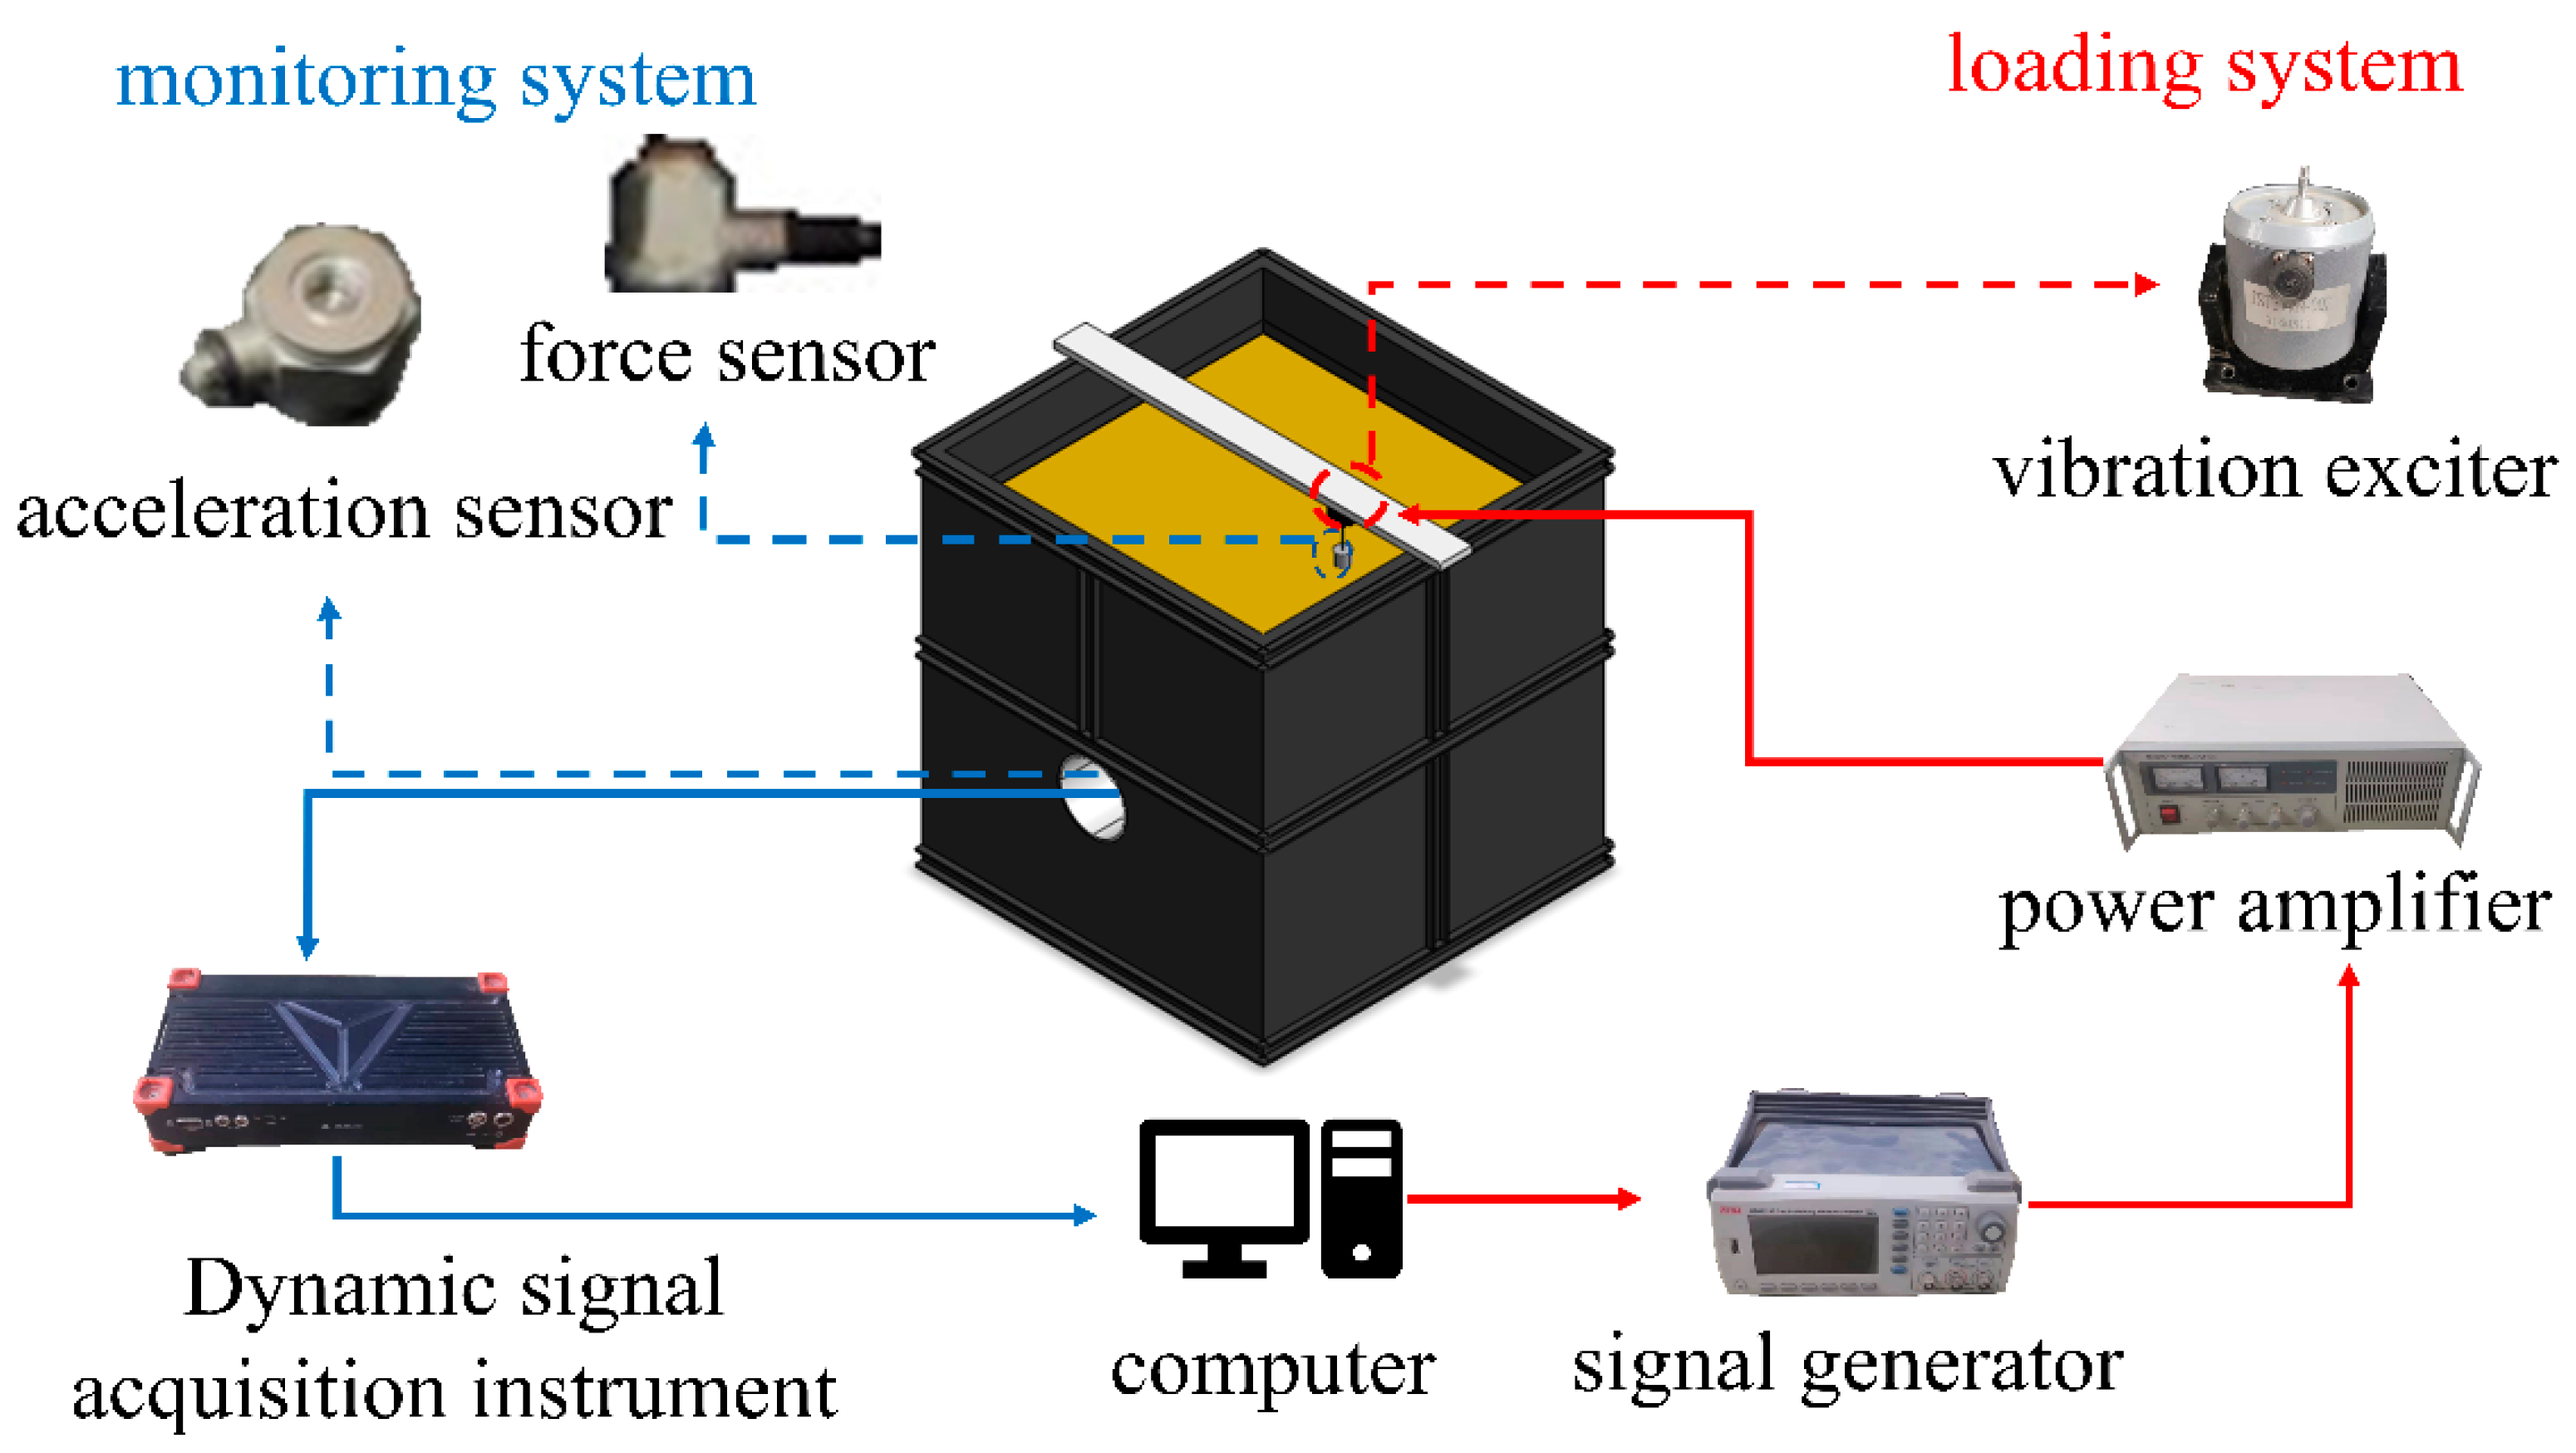
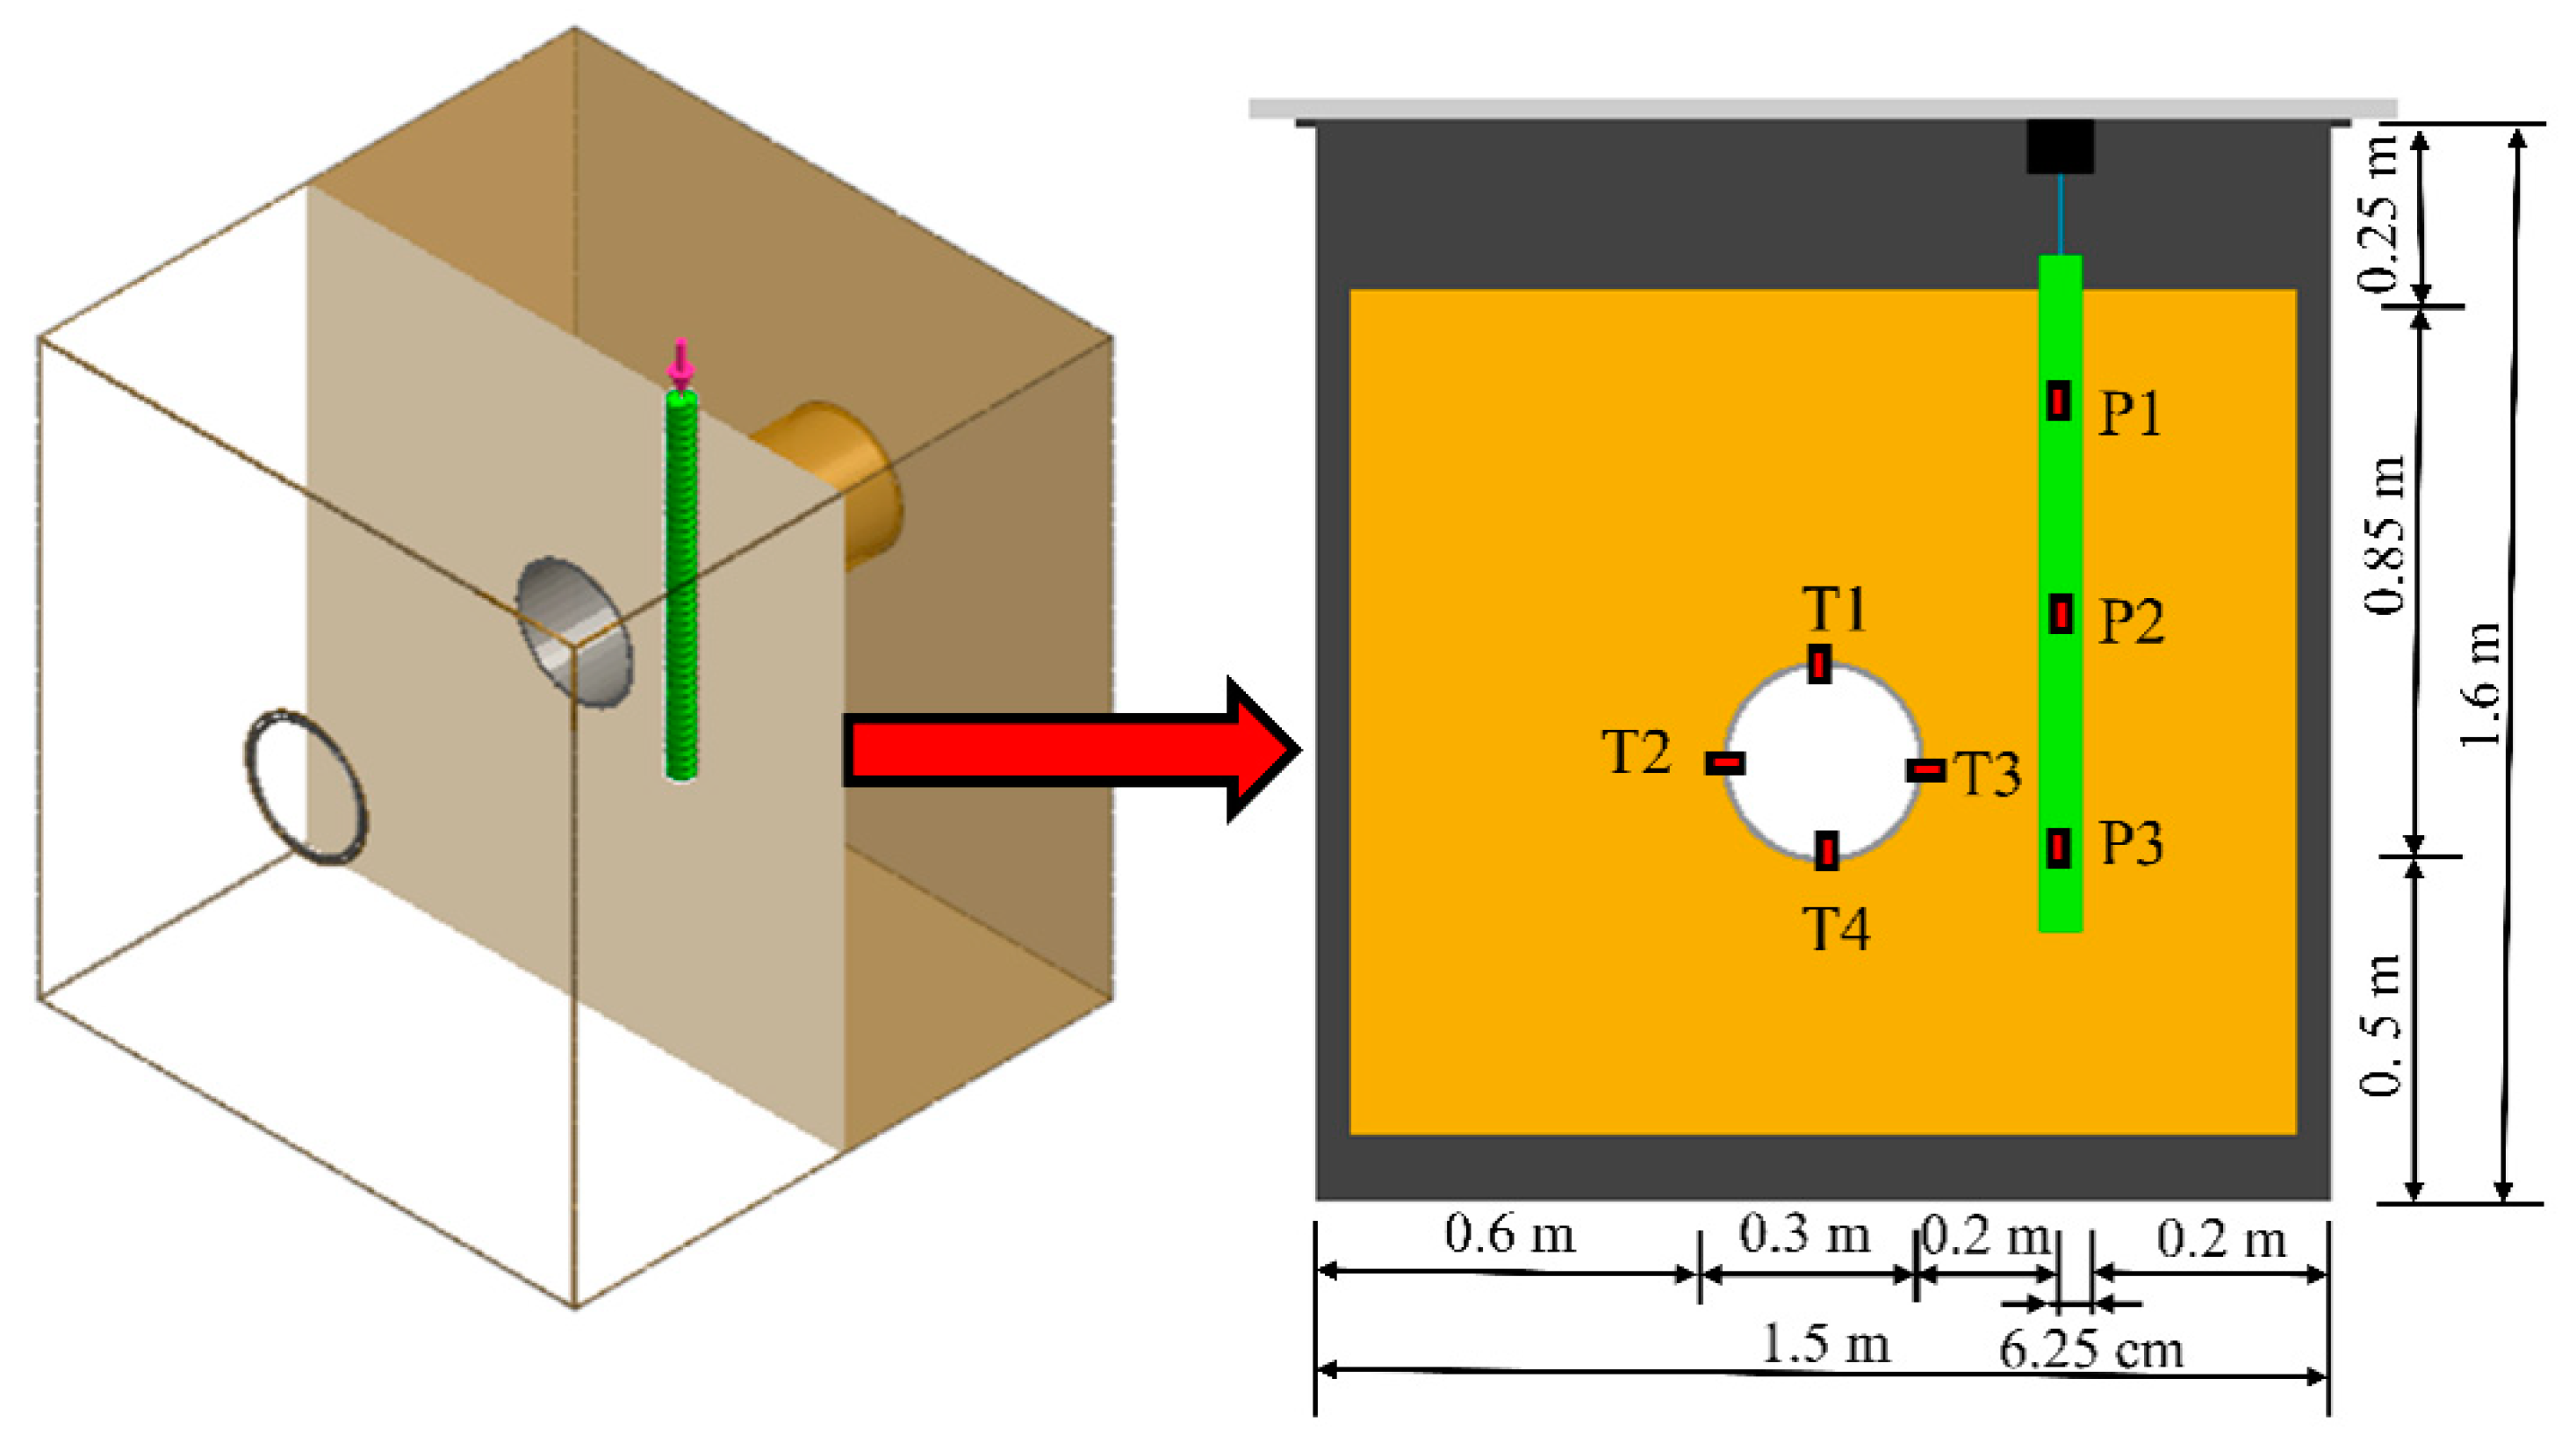
The model box used for the test measures 1.5 m (length) × 1.5 m (width) × 1.6 m (height). To reduce the influence of the reflection effect of vibration waves on the boundary of the model box on the test results, a vibration-absorbing material with a thickness of 30 mm was installed inside the model box to improve the accuracy of the test results. The vibration signal required for the test was generated by a control computer, connected to an exciter by a signal generator and a power amplifier, and then loaded by the exciter. To accurately measure the actual load during the test, a dynamic force sensor was installed at the top of the exciter loading rod, and the dynamic force signal was collected by the collector. Acceleration sensors were installed near the tunnel and pile foundation to monitor the acceleration response during the test.
Figure 2 and
Figure 3 show the test device and monitoring point layout, respectively.
2.2.3. Test Vibration Load
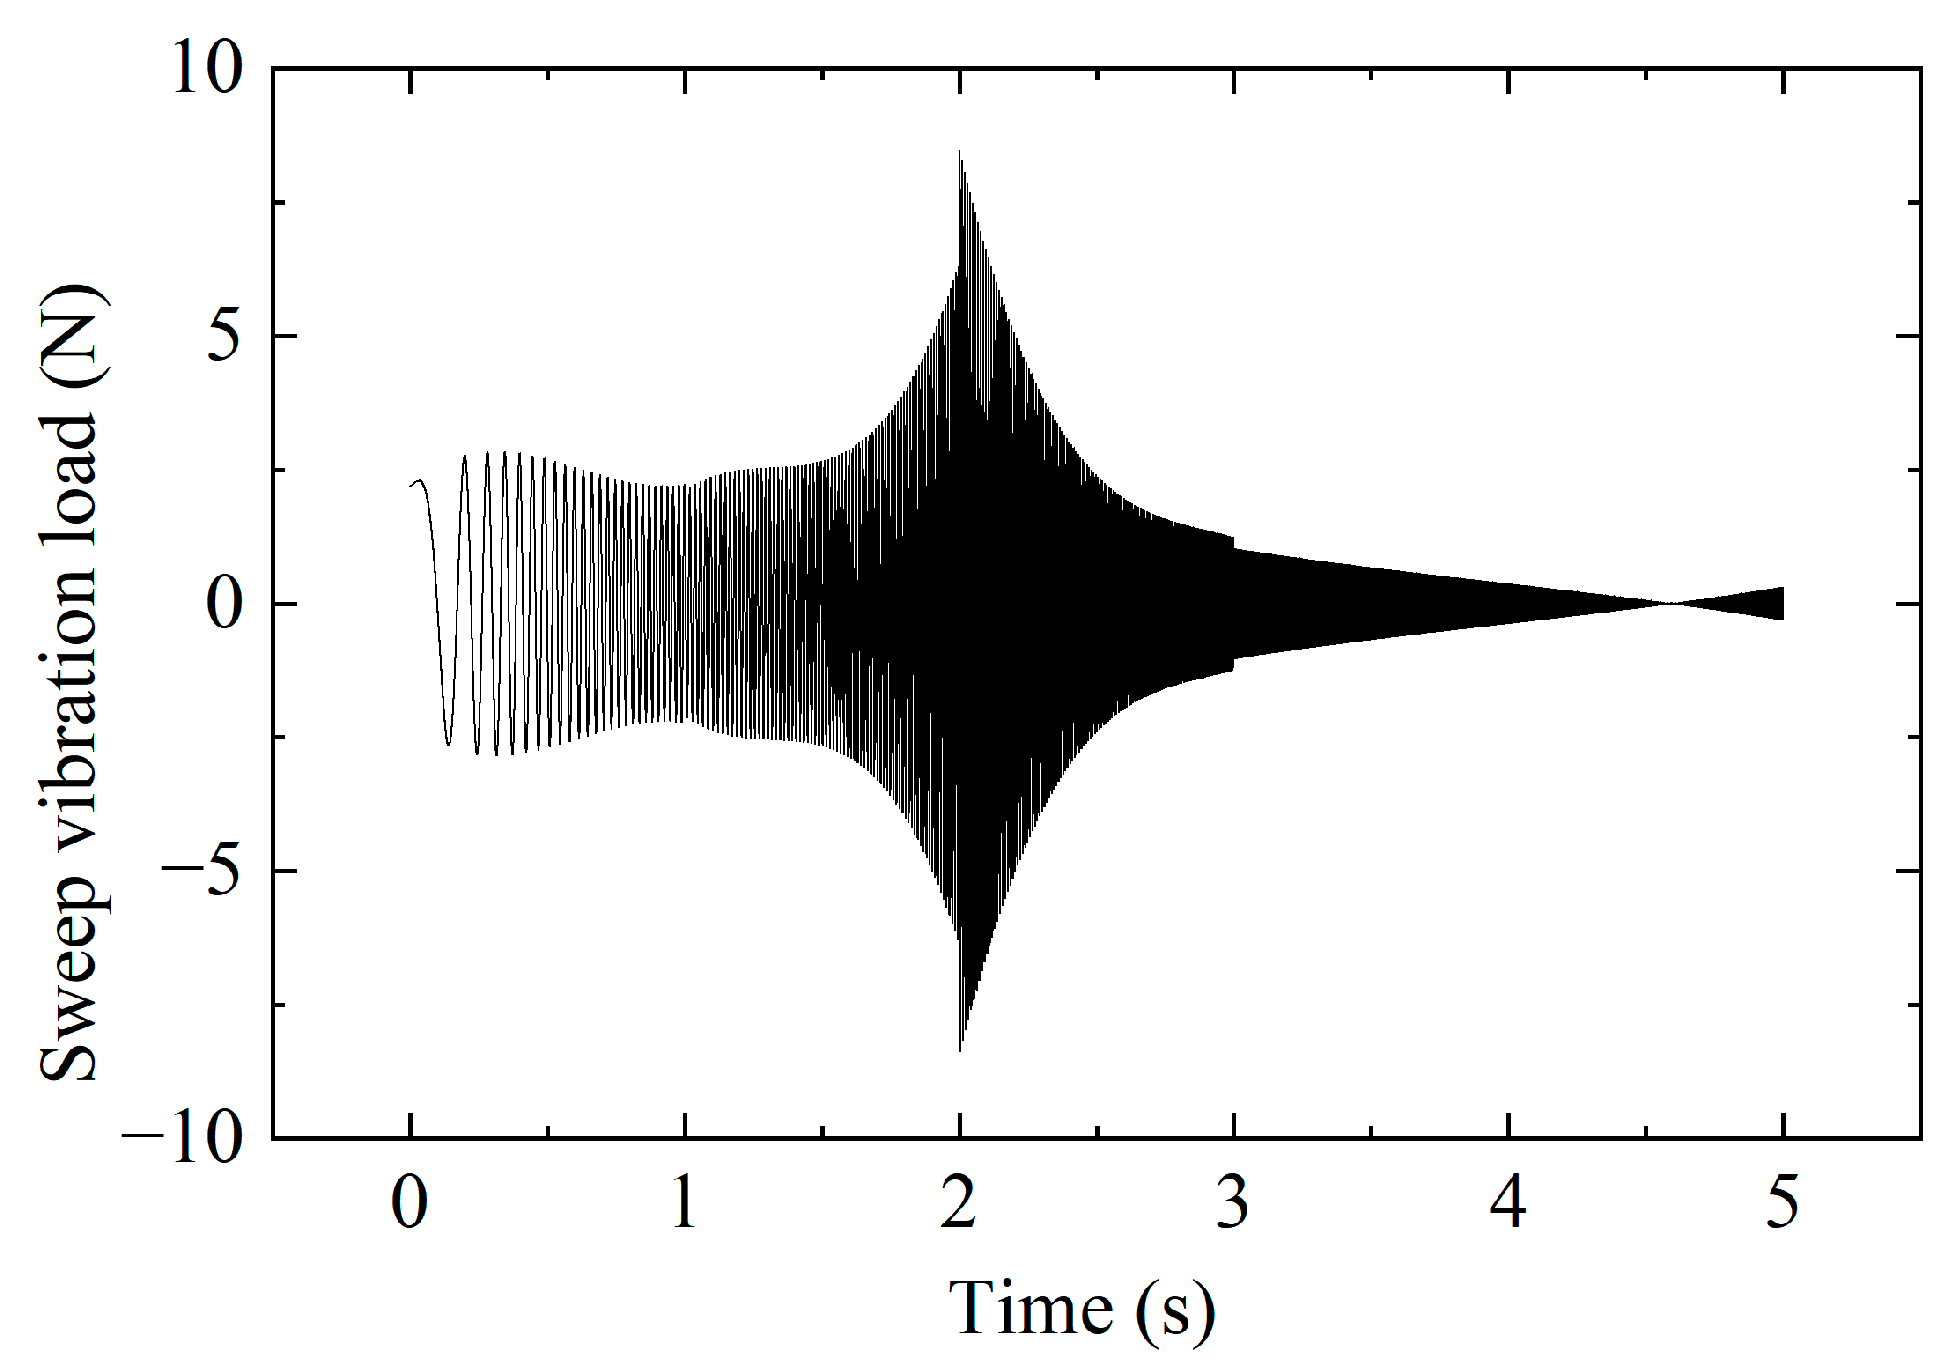
Two types of vibration loads were applied during the model test. One was a sinusoidal sweep load, which was used to obtain the frequency response function (FRF) of the model and analyze the dynamic response characteristics of the bridge–tunnel overlapping structure at different frequencies. The frequency range (0–250 Hz) of the loads included the train vibration load. Its duration was 5 s.
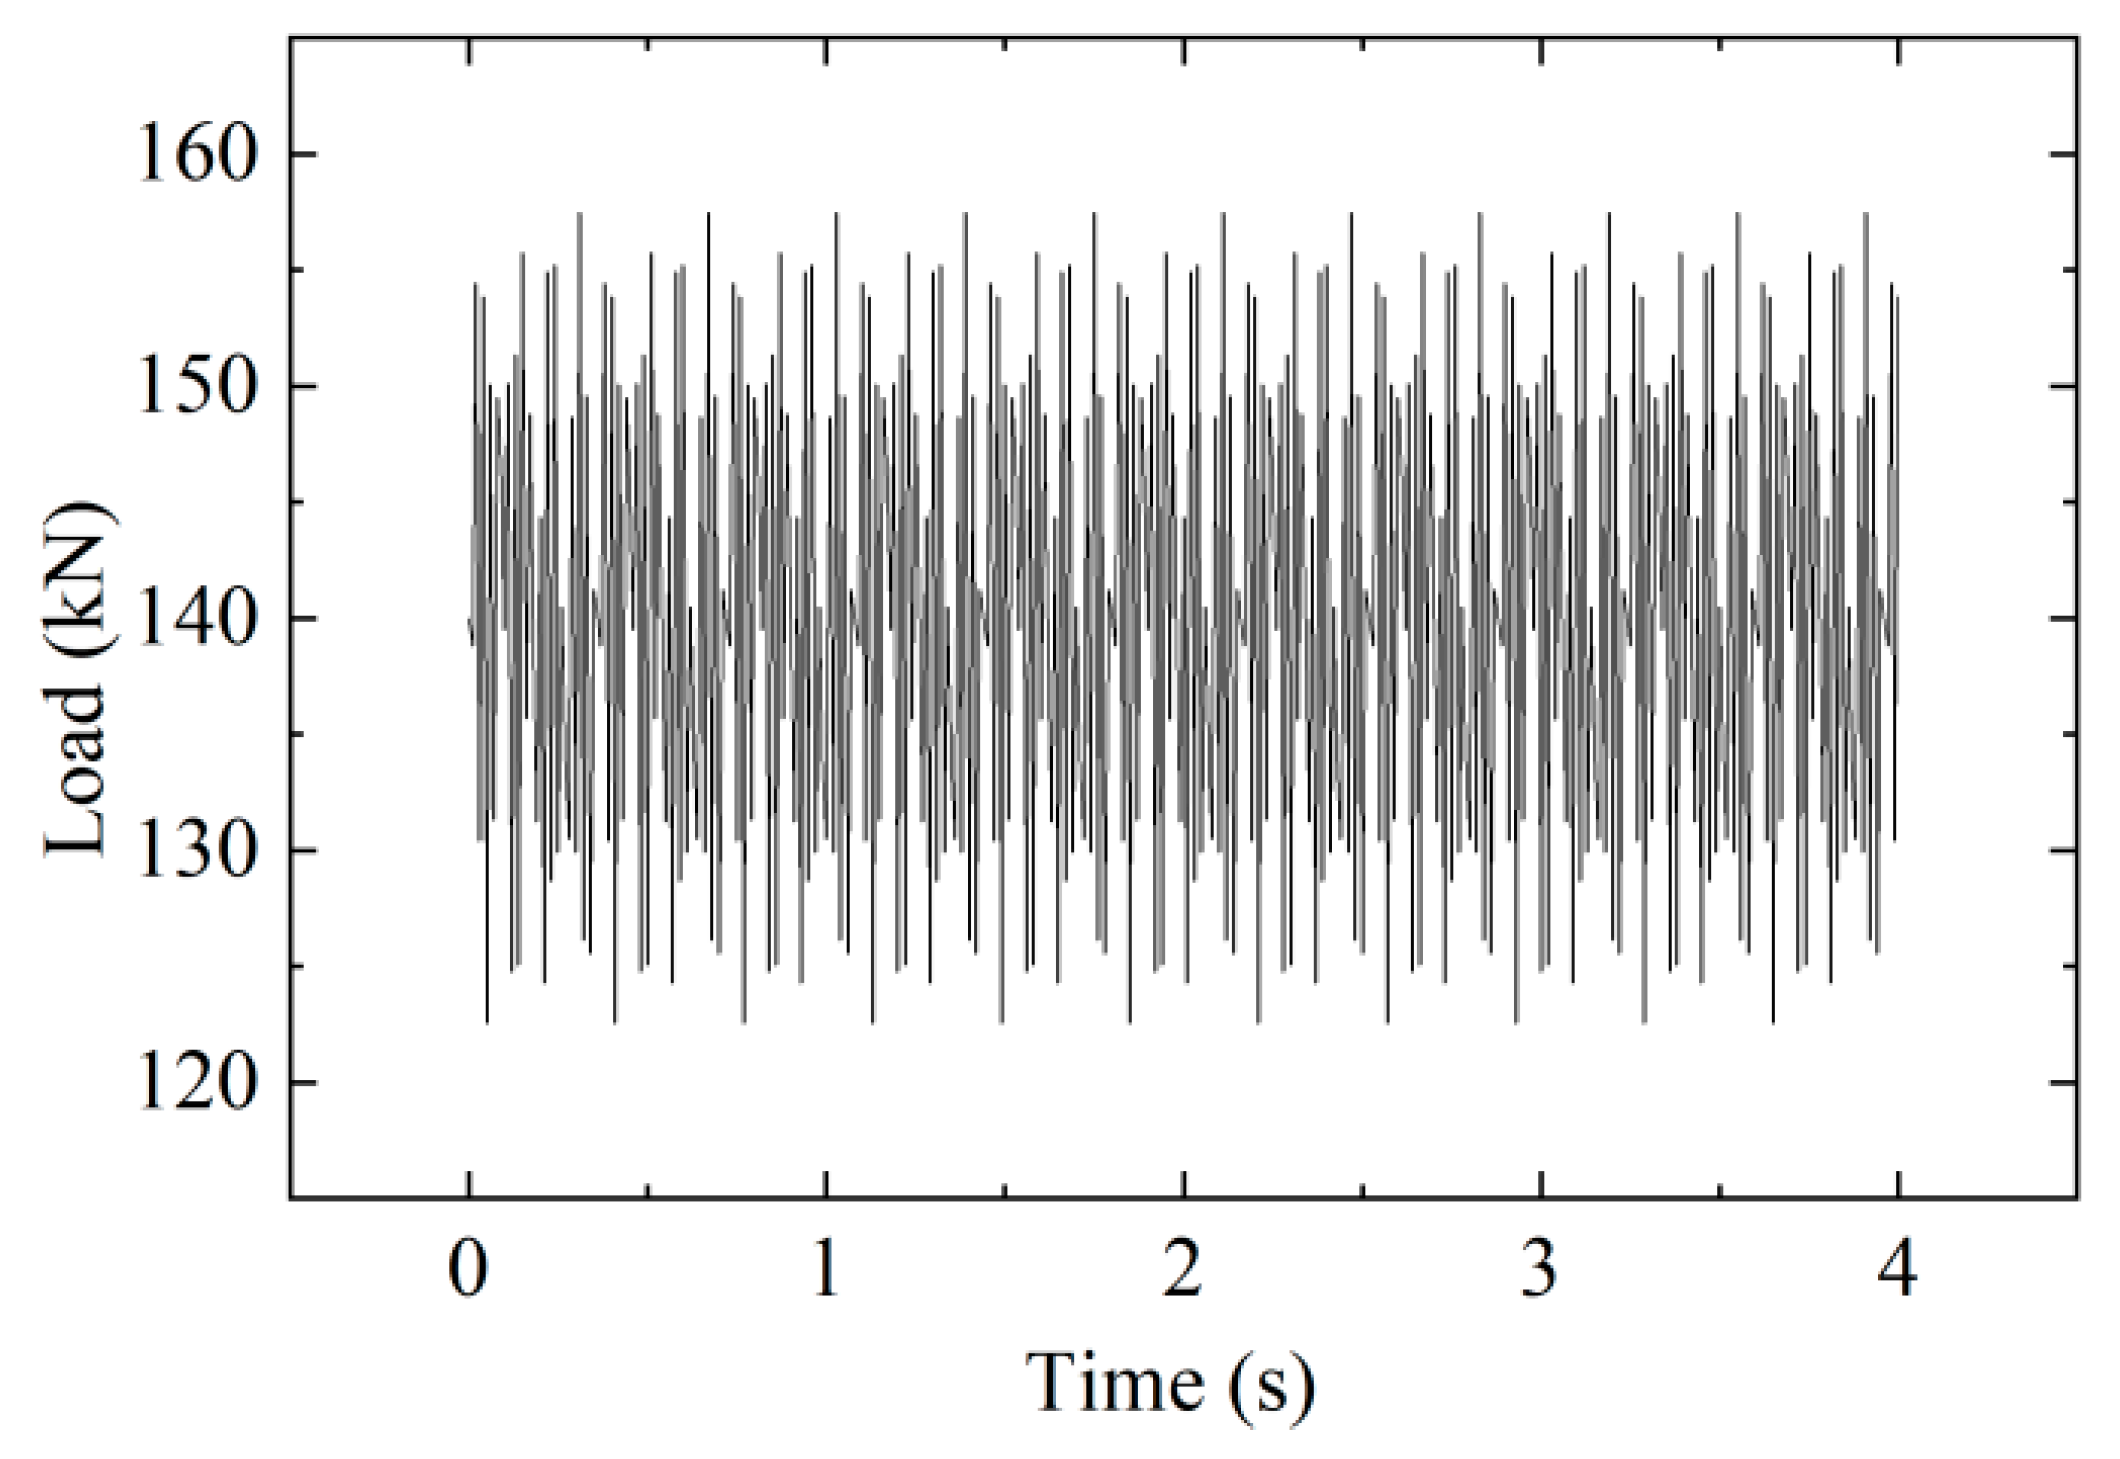
Figure 4 shows one of the typical sweep loads measured from the load cell in the testing phase.
The other type of load was the train vibration load, which is typically caused by vehicle weight and track irregularity [
24]. The maximum vibration load generated during train operation can be expressed using the following excitation function [
25]:
Here,
P0 is the wheel static load.
P1,
P2, and
P3 are the typical vibration load values.
M0 is the mass under the spring.
ai and
Li are the typical wavelengths and typical vector heights, respectively. The British track irregularity management value was determined by querying
a1 = 3.5 mm,
a2 = 0.4 mm,
a3 = 0.08 mm,
L1 = 10 m,
L2 = 2 m, and
L3 = 0.5 m.
v is the train speed.
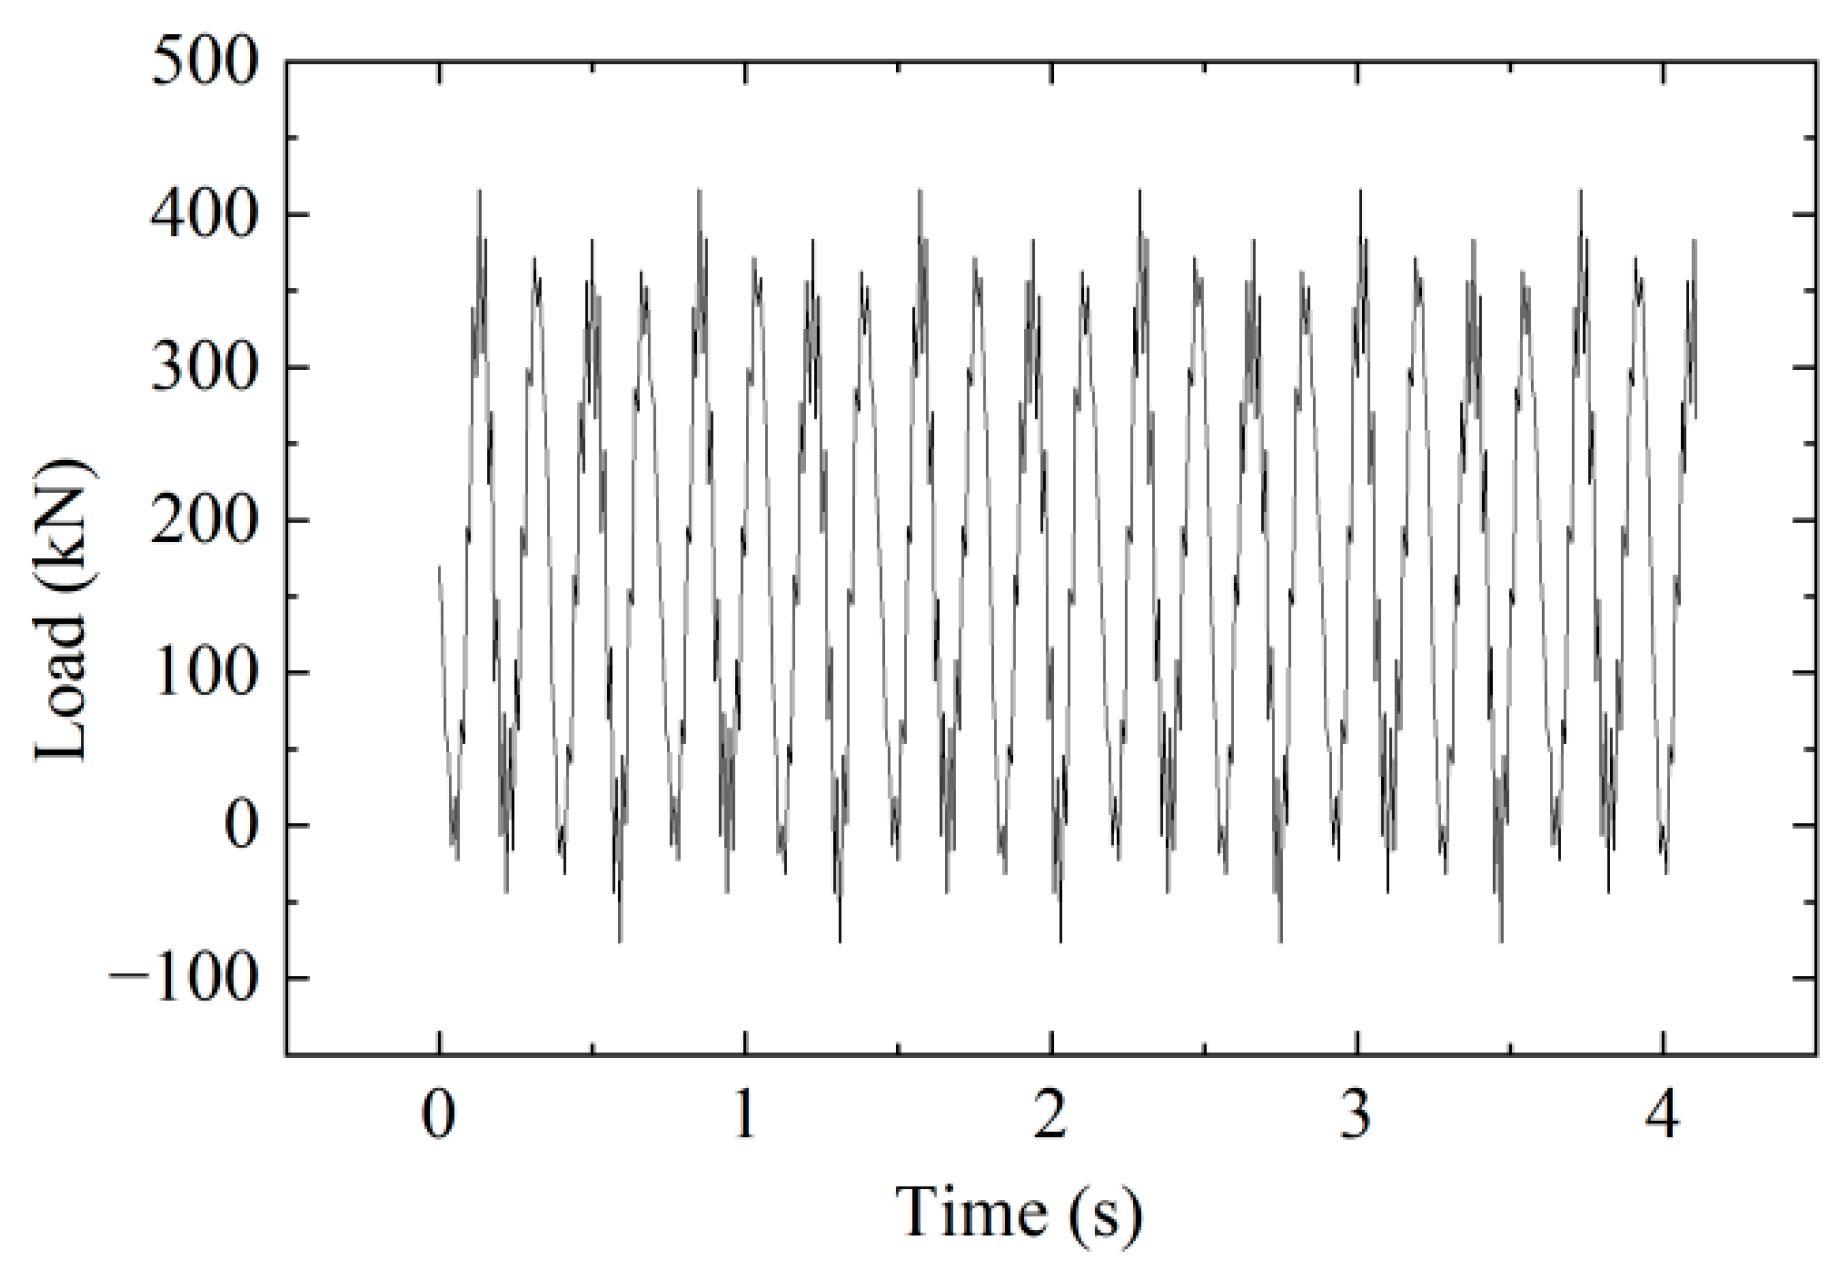
In this study, the running speed of the high-speed railway train was taken as 350 km/h, in accordance with the current design speed in China.
Figure 5 shows the time history curve of the vibration load of the high-speed railway train.
2.3. Numerical Simulation
2.3.1. Overview of the Numerical Calculation Model
To verify the reliability of the model test results and further study the dynamic characteristics of the bridge–tunnel overlapping structure, the 3D finite element numerical simulation software MIDAS GTS NX 2022 R1 (MIDAS Information Technology Co., Ltd., Beijing, China) was used to establish a numerical model for the test conditions. To ensure that the numerical model size was consistent with the test prototype size, the model size was determined to be 1.5 m (length) × 1.5 m (width) × 1.6 m (height), and the acceleration calculation results were extracted along the acceleration monitoring points described in the model test for analysis. In the numerical simulation, the pile foundation was simulated using the method of beam element pile interface, and due to the small difference in the soil properties of the formation, the interface parameters along the pile length were considered equal. The following empirical formulae were used for the calculation [
14,
26]:
Here, Kn and Kt are the normal stiffness modulus and tangential stiffness modulus, respectively. E0 is the elastic modulus of the soil. tv is the virtually calculated thickness of the pile interface, and the value is taken as 1.0.
Under the vibration load of the train, the elastic modulus of the structure is generally high, and the deformation generated is low [
27]. The elastic modulus of the surrounding soil was relatively low, and its plastic characteristics need to be considered in the numerical calculation process. Therefore, structures were simulated by elastic constitutive elements, and the stress–strain characteristics of the native soil body were subject to the Mohr–Coulomb criterion. In addition, the physical and mechanical parameters used in the numerical calculation model were consistent with those used in the model test.
Figure 6 shows the numerical calculation model. To ensure the accuracy of the numerical analysis, the size of the model grid elements was less than 1/10–1/8 of the wavelength, corresponding to the input wave frequency.
2.3.2. Setting of Boundary Conditions
The 3D artificial viscoelastic boundary conditions [
28], which are convenient to apply and can ensure calculation accuracy, were used to calculate the required equivalent spring tangential direction, normal stiffness, and equivalent damper tangential and normal damping coefficients, which are calculated as follows [
29]:
Here, KT and KN are the equivalent spring tangential stiffness and normal stiffness of the equivalent spring, respectively. CT and CN are the tangential damping coefficient and normal damping coefficient of the equivalent damper, respectively. αT and αN are the tangential and normal correction coefficients, respectively. The recommended values are 1.33 and 0.67, respectively. G is the shear modulus of the propagation medium, ρ is the density of the propagation medium, R is the distance from the vibration source to the artificial boundary, and CS and CP are the velocities of the S and P waves, respectively.
2.4. Frequency Response Function and Coherence Analysis
In this study, the sweep frequency vibration load was applied to the pile top of the model test, and the dynamic responses at the monitoring points arranged, as shown in
Figure 3, were collected by the acceleration sensor. The FRF was used to convert the obtained results into the frequency domain response results for the analysis, and the dynamic response characteristics of the tunnel structure at different vibration loads under the condition of a side-crossing pile foundation were explored. The FRF is the ratio of the applied force to the dynamic response recorded in this test. The coherence coefficient method was used to verify the reliability of the model test. The calculation method is expressed in Equations (8) and (9). The calculated coherence coefficient was between 0 and 1. In engineering practice, the coherence coefficient is often used to evaluate the FRF. Generally, when the FRF is greater than 0.8, the calculation result is considered more accurate and reliable.
where:
Here,
SFF(
ω) is the power spectral density of the excitation load.
SFA(
ω) is the cross-spectral density of the excitation load and acceleration.
SAA(
ω) is the acceleration power spectral density.
SAF(
ω) is the cross-spectral density of the acceleration and excitation load.
M = 1, 2, …,
NS − 1.
n = 1, 2, …,
NS − 1.
F(t)
n and
A(t)
n are the excitation load and acceleration, respectively.
Based on the calculation method mentioned above, the FRF and coherence coefficient curves at the P2 and T4 monitoring points of the pile foundation and tunnel structure were obtained by processing the data collected from the model test, as shown in
Figure 7.
Figure 7 shows that in the frequency range of 0–40 Hz, the FRF and coherence coefficient at the measuring point show significant fluctuation, and the calculation result of the coherence coefficient is less than 0.8. This is mainly due to the influence of environmental noise around the model test. In the frequency range of 40–250 Hz, the fluctuations in the FRF and coherence coefficient at the measuring point are reduced. The coherence coefficient is close to 1, indicating that the FRF curve in this frequency range has a good correlation and that the test data are reliable.
2.5. Dynamic Response Analysis of Tunnel Structure
2.5.1. Dynamic Response in the Frequency Domain
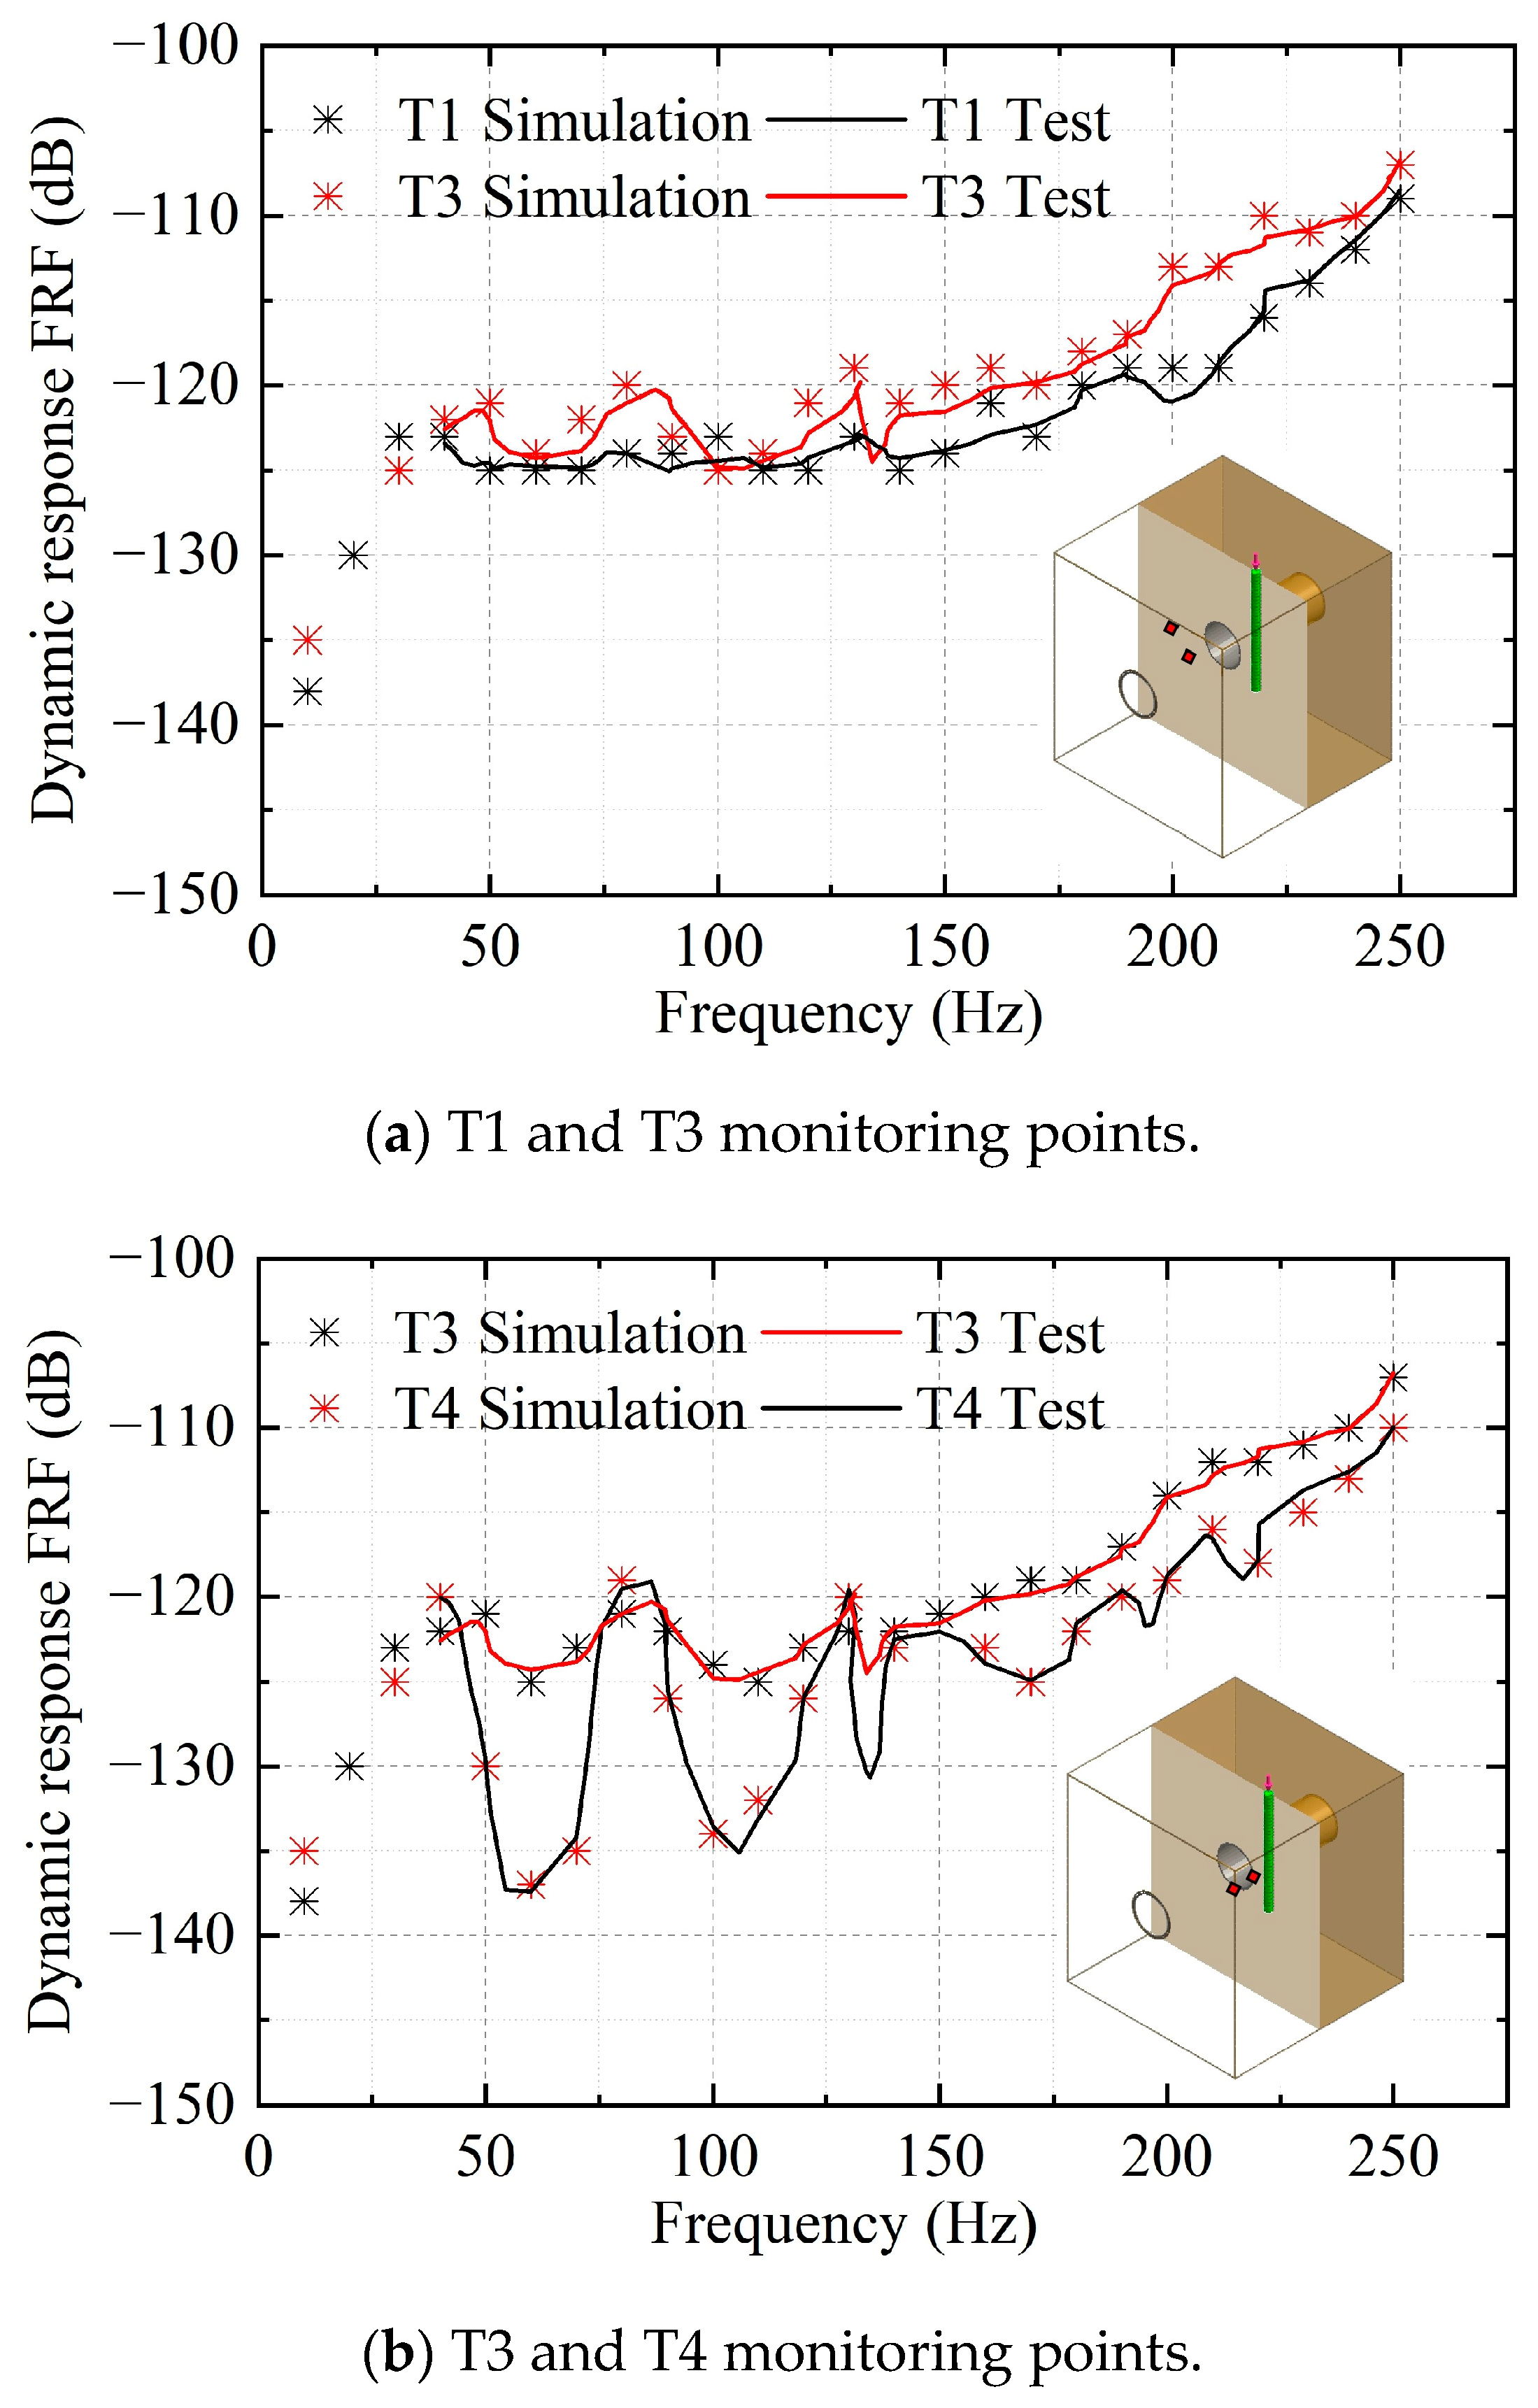
To explore the dynamic response characteristics of the bridge–tunnel overlapping structure at different positions in the tunnel under frequency sweeping loads, this study applied a combination of numerical simulation and model tests to analyze the dynamic characteristics of the tunnel side piercing pile structure under sweeping loads. The dynamic response results of the tunnel section at the upside, waist, and vault positions were extracted, and the FRF curves at different positions in the tunnel structure were plotted. As shown in
Figure 8, the scatter points and curves are the results of the numerical simulations and model tests, respectively. As shown in
Figure 7, the dynamic response of the tunnel and pile foundation in the frequency range of 0–40 Hz is significantly affected by the surrounding environmental noise during the model test. Therefore, the dynamic response in the frequency range of 0–40 Hz was analyzed from the numerical simulation results, and the dynamic response in the frequency range of 40–250 Hz was analyzed from the numerical simulation and model test results.
Figure 8a,b indicate that the dynamic responses of the structure from the simulation and model test in the frequency range of 40–250 Hz remain in the range of 3 dB, and the overall difference is small. Therefore, the results of the numerical simulation and model tests are said to be reliable. Further analysis of the test results showed that the dynamic response of the bridge–tunnel overlapping structure increased with an increase in frequency. The dynamic response increased rapidly in the frequency range of 0–40 Hz, increased gradually in the range of 40–200 Hz, and increased rapidly in the range of 200–250 Hz. The dynamic responses at different positions in the tunnel were different. The dynamic response at the arch waist monitoring point T3 near the pile foundation side was significantly greater than the vault monitoring point T1, with an average difference of 2.48 dB. The difference in the dynamic responses between the arch bottom monitoring point T4 and the arch waist monitoring point T3 was 4.15 dB. Clearly, the dynamic response at each measuring point in the monitoring section was greater than the vault near the pile foundation, and the vault exhibited a greater dynamic response than the tunnel invert.
2.5.2. Dynamic Response in the Time Domain
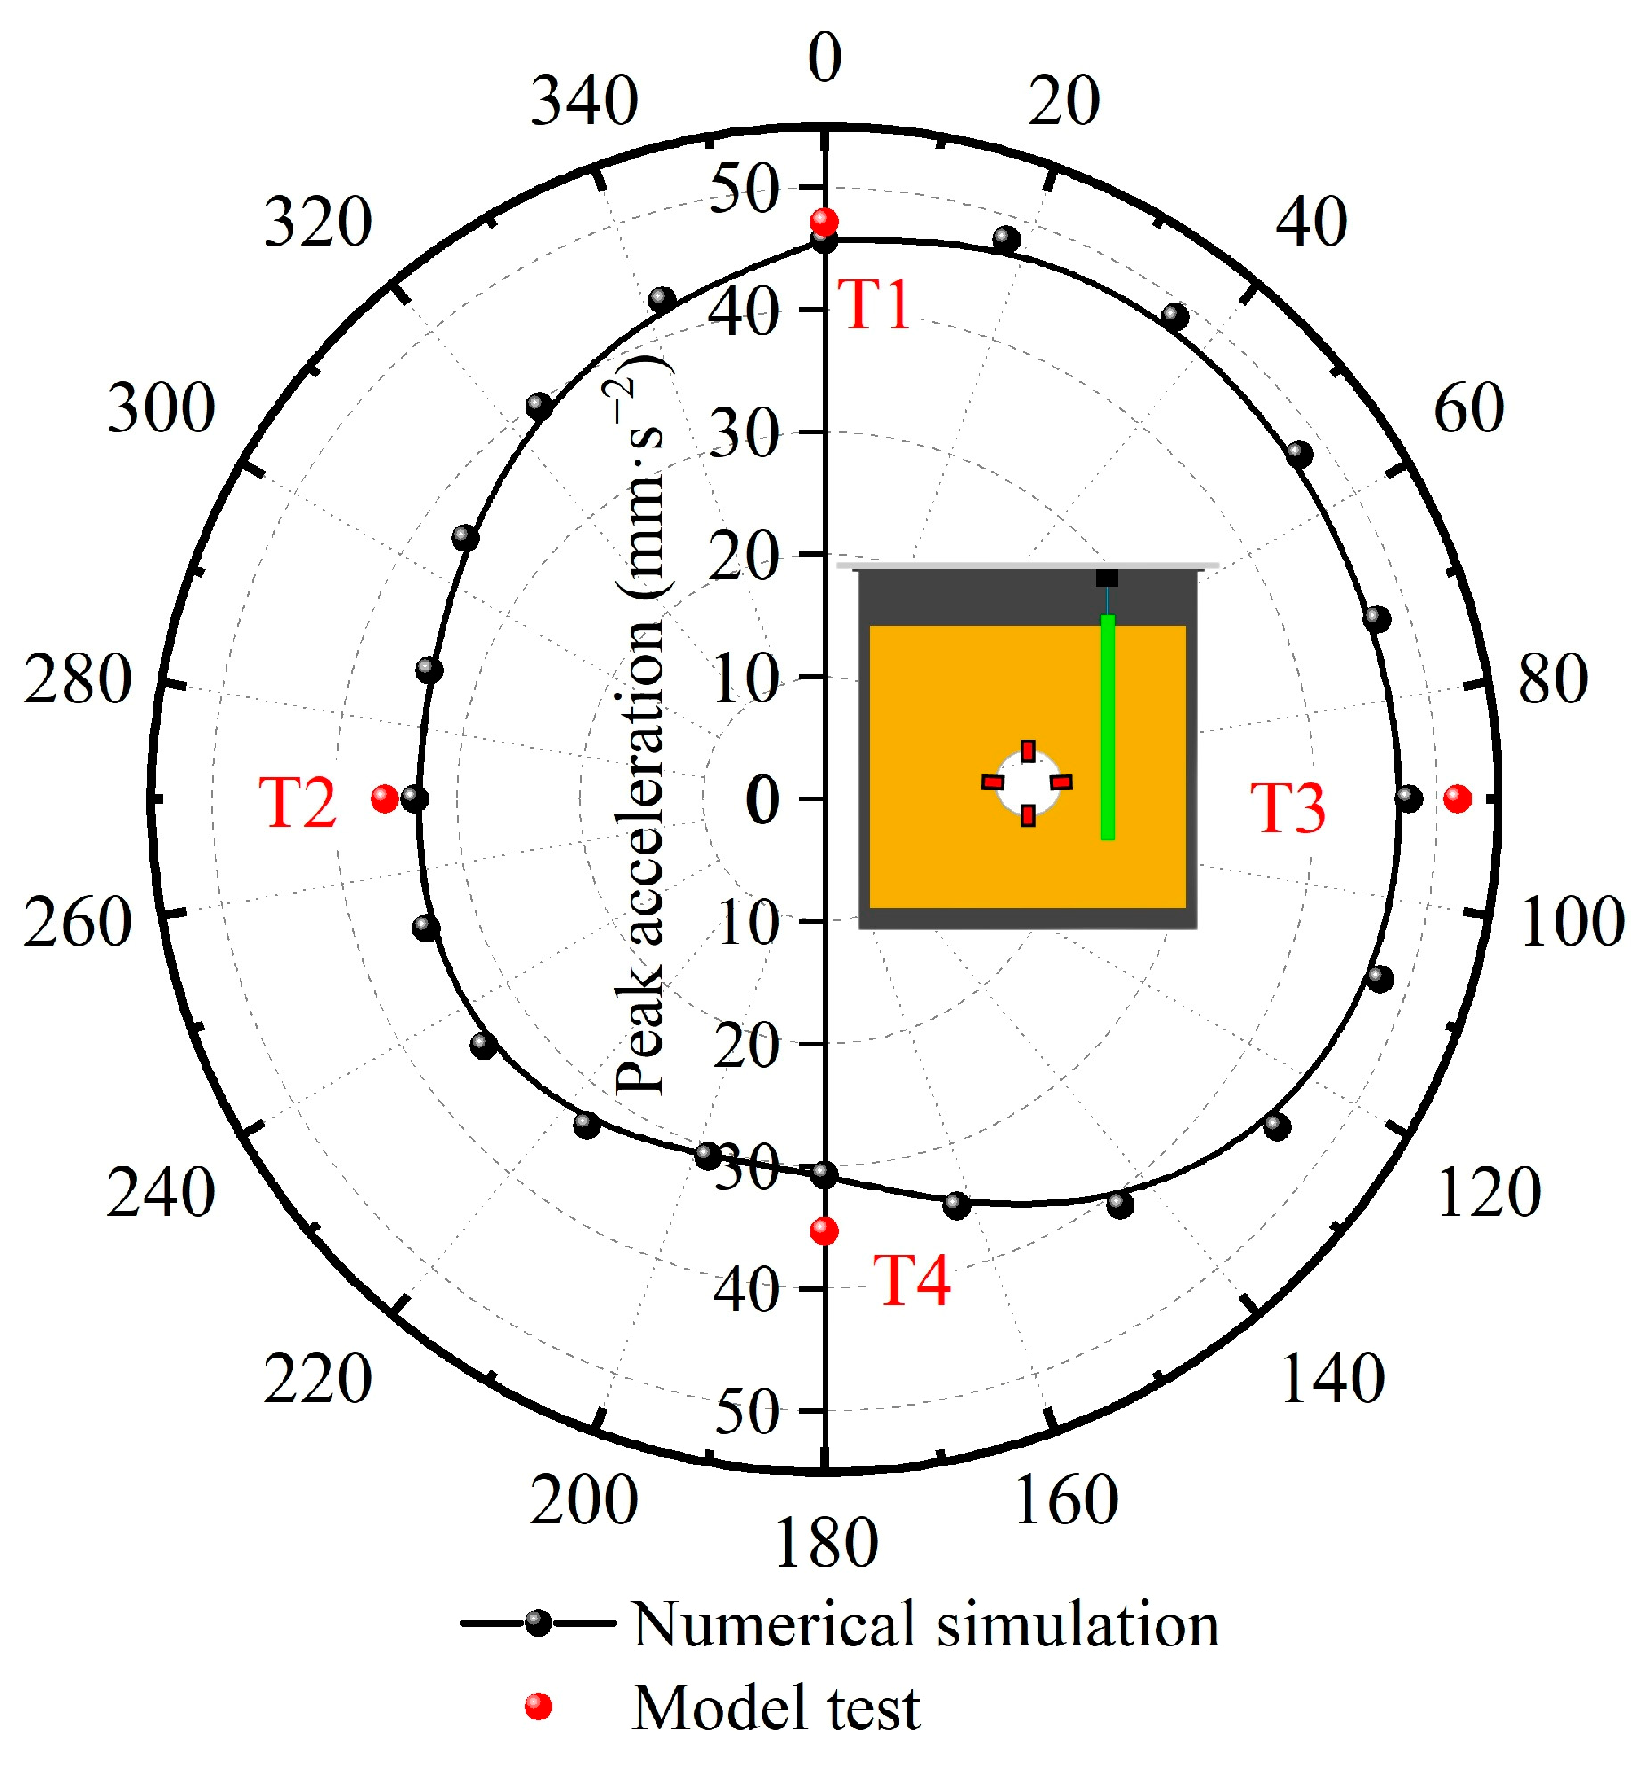
When the high-speed train load acted on the bridge–tunnel overlapping structure, the train vibration was transmitted to the pile foundation along the bridge and then transmitted to the tunnel structure through the soil layer. Due to the different distances from the pile foundation at different tunnel positions and the superposition and reflection of the vibration load during the transmission process, the dynamic responses at different positions in the tunnel structure will be different. Therefore, in the model test and numerical simulation, the vibration load of the high-speed train at a speed of 350 km/h was selected for loading, and four acceleration monitoring points, T1–T4, were arranged for the monitoring and analysis. To more clearly describe the dynamic response at different positions of the segment under vibration load, the peak acceleration (PPA) at different positions of the segment was extracted and shown in
Figure 9.
Figure 9 shows that the simulated results are close to the model test results, further verifying the reliability of the test results. The PPA of the tunnel section was highest at the arch waist near the pile side (T3) and the lowest at the tunnel invert (T4). The PPA at the arch waist near the pile side (T3) was 1.46 times the invert (T4) and 1.44 times the arch waist away from the pile side (T2). Therefore, when the train vibration load acts on a side-crossing pile foundation, it will have the greatest influence on the arch waist of the tunnel structure near the pile foundation, and it should be monitored during train operation.
3. Dynamic Response of Overlapping Structures under the Synergistic Effect of High-Speed Railway and Subway Train Loads
During train operation, on the one hand, the vibration load is constantly moving, and on the other hand, the vibration loads generated by the high-speed railway above the bridge and the subway train in the underground tunnel operating simultaneously will affect each other. Therefore, the movement and superposition effect of the vibration load of the trains should be considered. A numerical simulation was used to study the dynamic response characteristics of the bridge–tunnel overlapping structure under the synergistic action of the vibration load of the high-speed railway and subway trains under different loading methods.
3.1. Numerical Modeling and Parameters
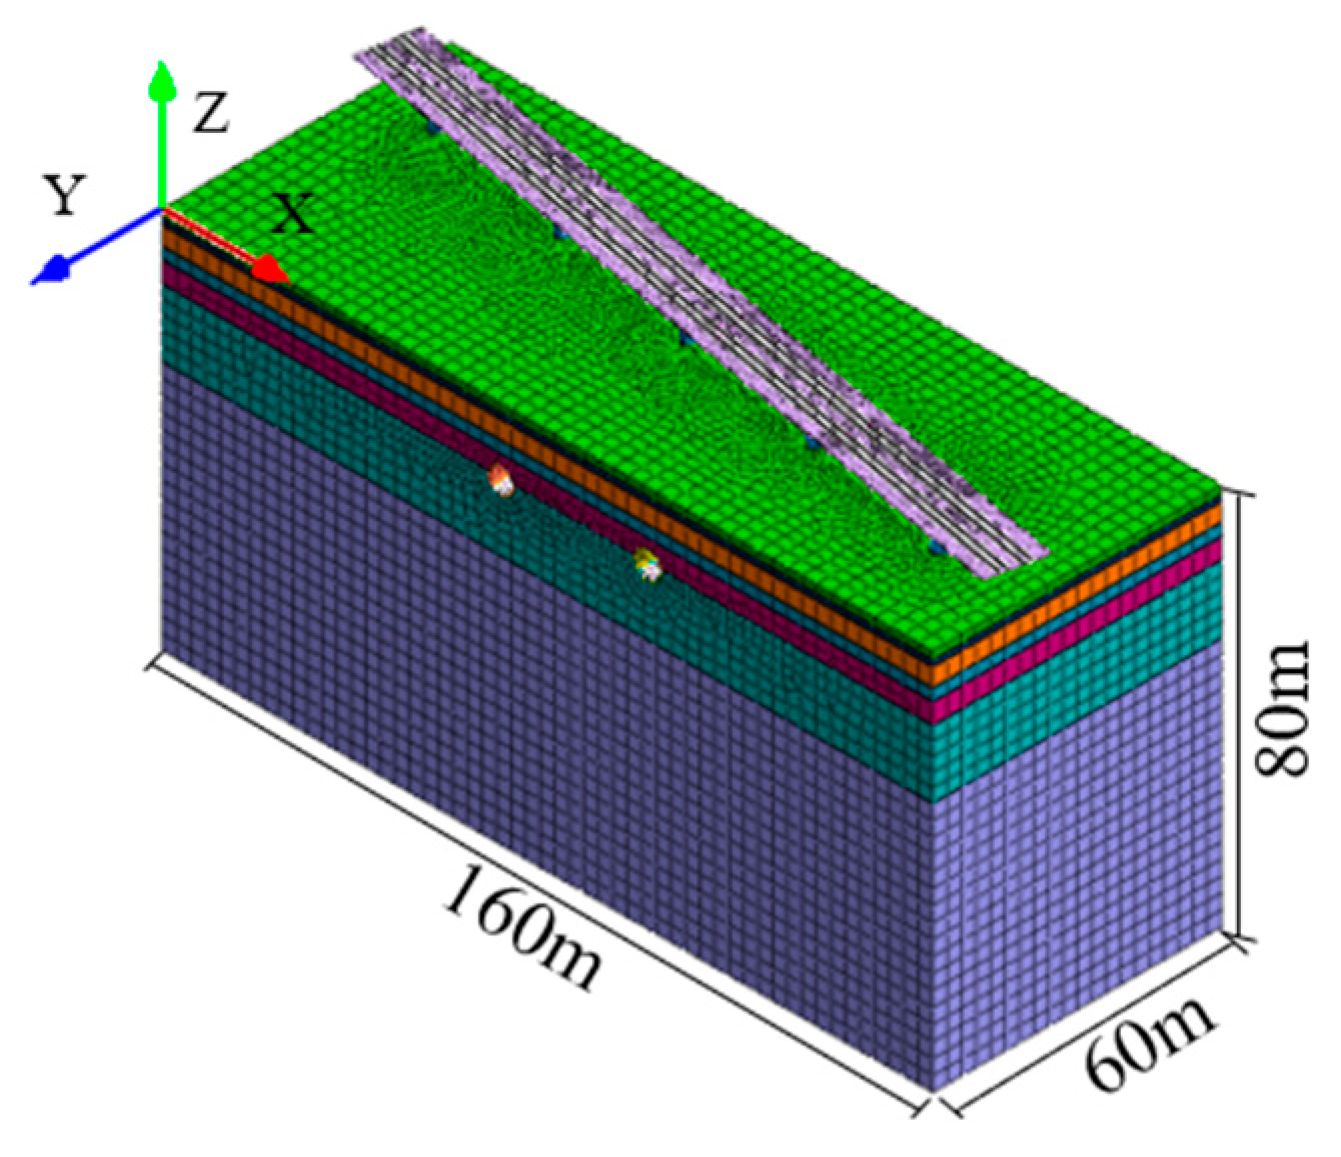
Considering the influence of the boundary effects in the dynamic analysis, the transverse width, longitudinal length, height, and viaduct height of the model were 60 m, 160 m, 80 m, and 6.79 m, respectively, based on a detailed survey report and engineering design. The main structures considered in the numerical simulation were steel rails, shield tunnel segments, bridge pile foundations, bridges, and bridge piers. They were simulated using the elasticity constitutive model.
Table 2 and
Table 3 present the parameters of the structures and soil.
Figure 10 shows a schematic of the numerical model.
3.2. Simulation of Superimposed Train Vibration Load
According to the literature [
24], train vibrations are generated mainly due to track unevenness, and the vibration caused by wheel–rail contact is transmitted to the tunnel structure along the rails and fasteners. In the numerical simulation, the vibration load of a moving train can be simulated by constantly updating the wheel–rail force and position coordinates of each wheel as the time steps progress. The vibration load time history curve of the high-speed trains is the same as shown in
Figure 5.
Figure 11 shows the vibration load time history curve of the subway train for a train speed of 100 km/h.
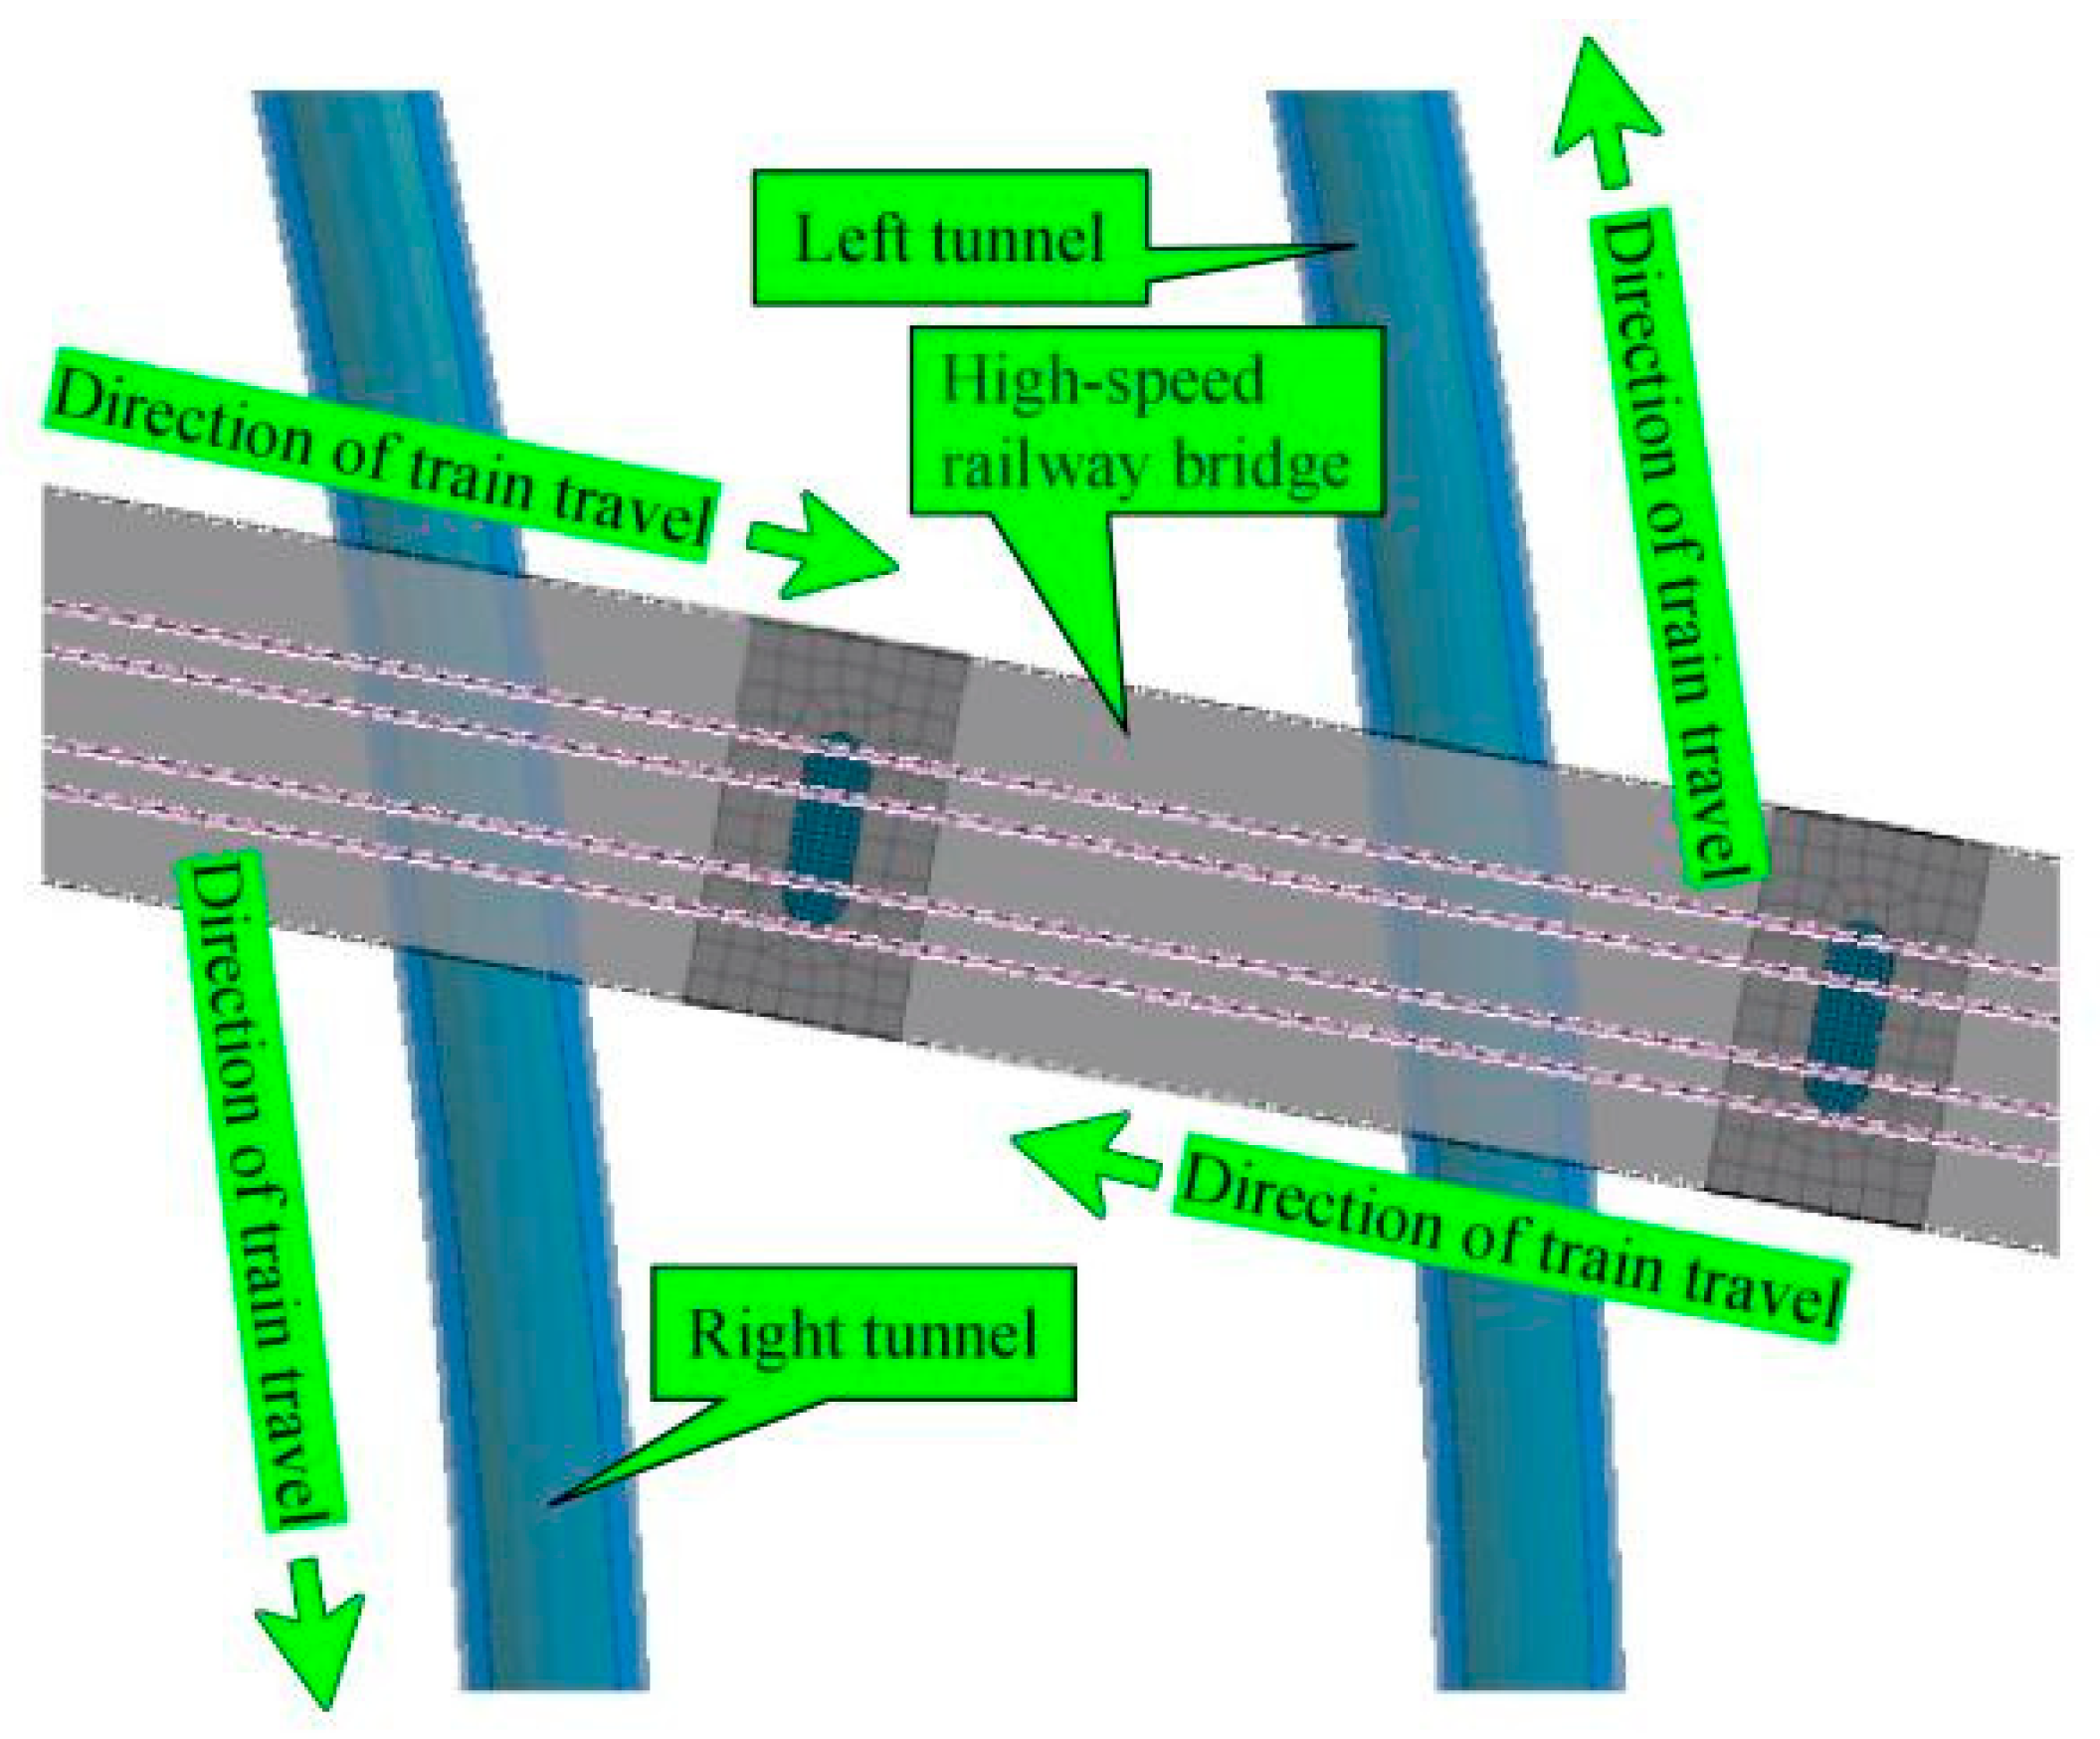
Figure 12 shows the driving direction of the high-speed railway and subway trains.
3.3. Monitoring Point Arrangement and Condition Design
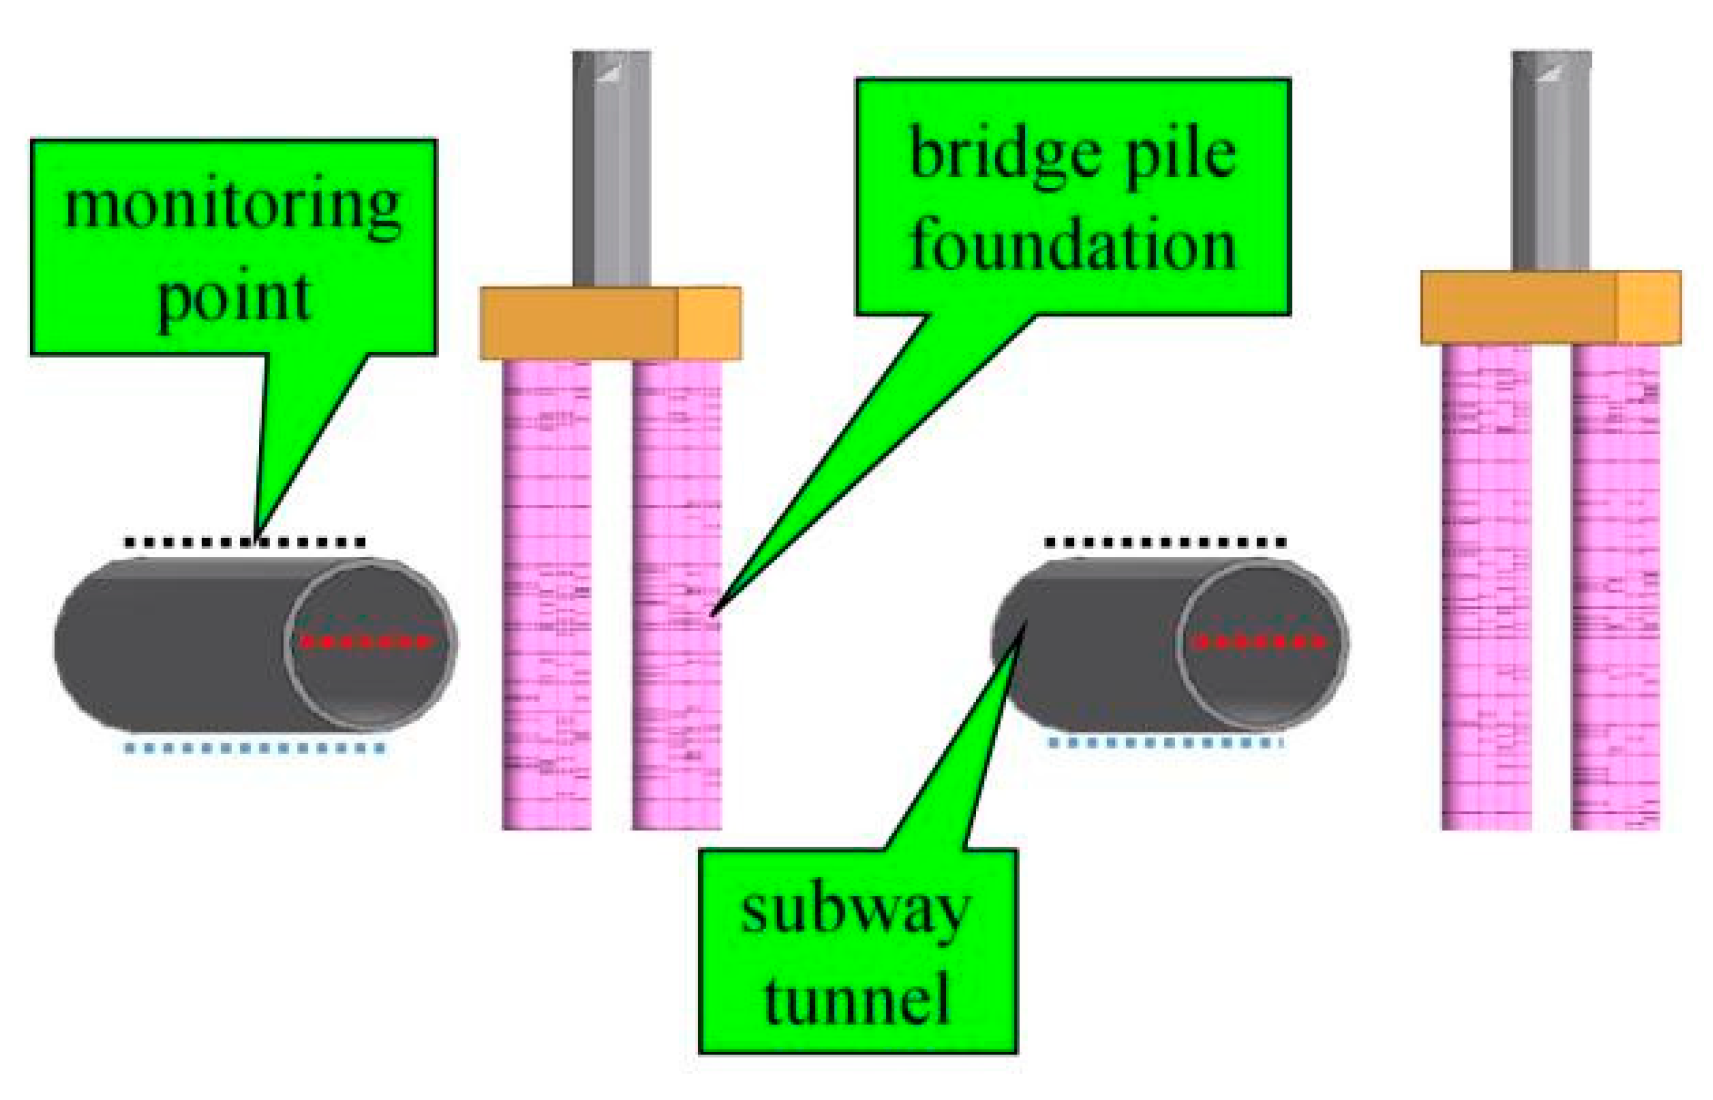
As shown in
Figure 13, monitoring points are arranged at the vault, hance, and arch bottom of the left and right lines along the axis of the tunnel at equal intervals. Considering the dynamic response characteristics of the overlapping structure under train vibration load movement and superposition effect, two different loading conditions were set, as listed in
Table 4.
3.4. Analysis of Results
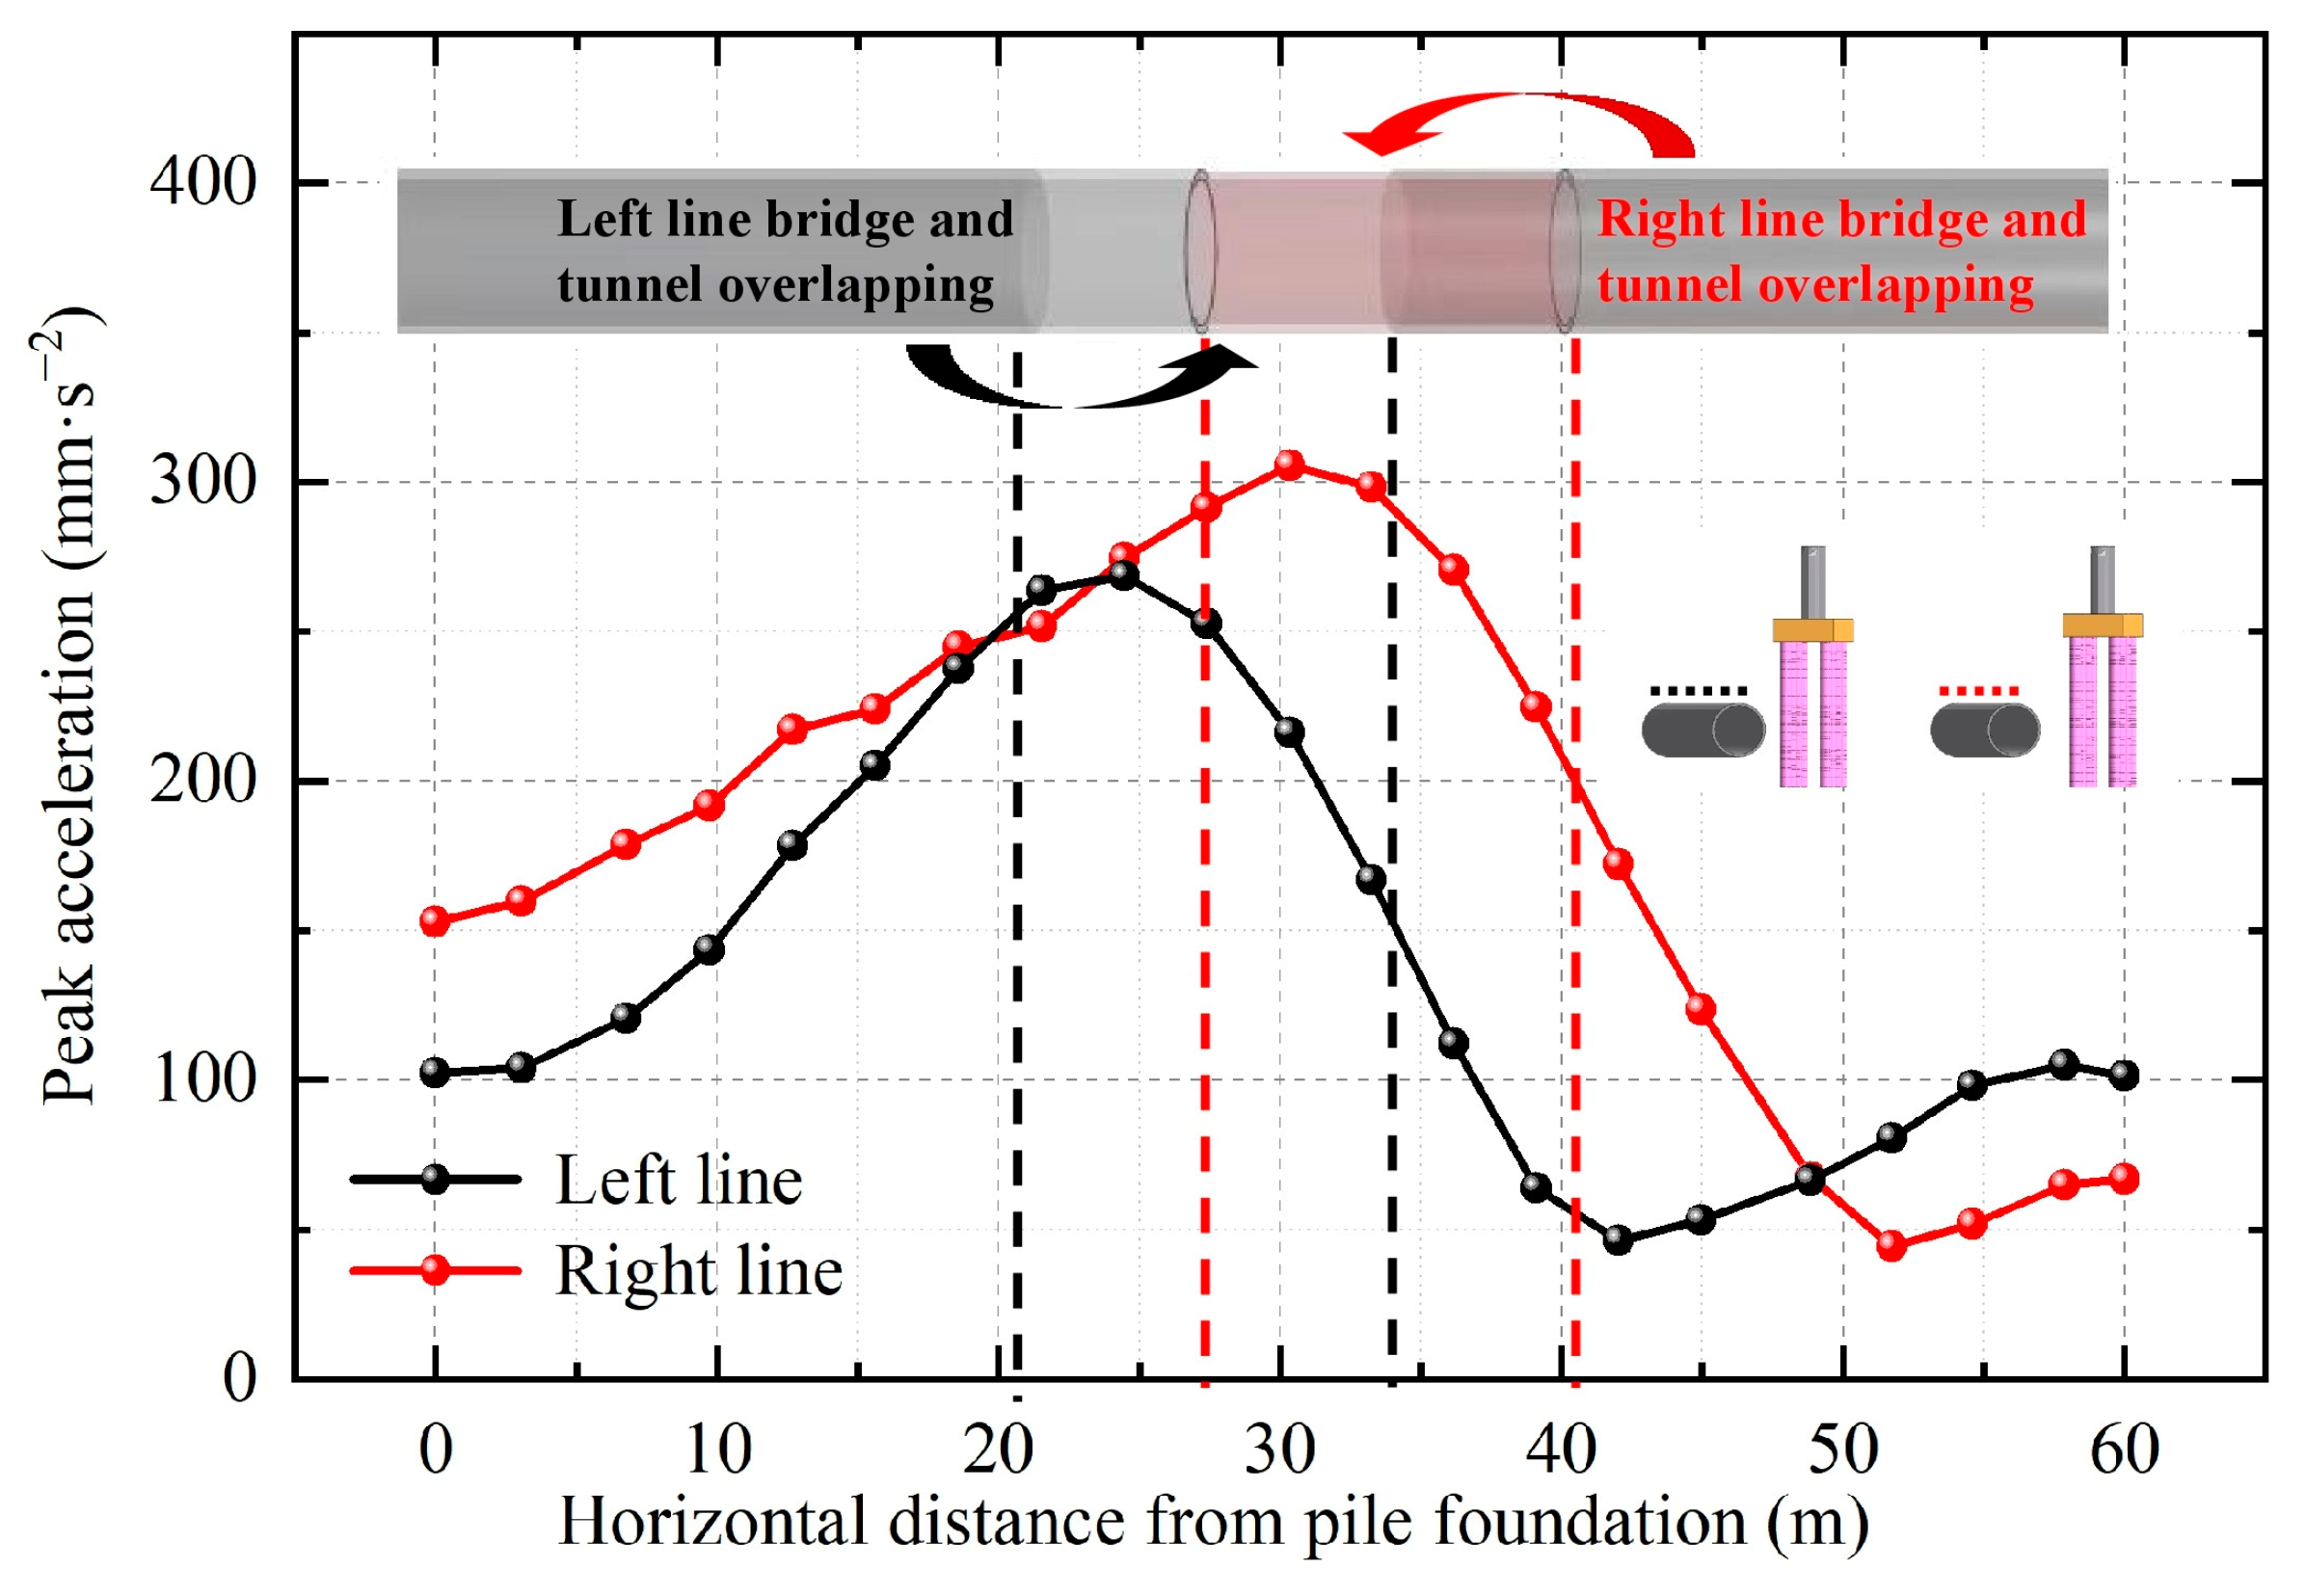
The dynamic responses of the tunnel vaults on the left and right lines were plotted, as shown in
Figure 14. When the high-speed railway train and the subway train run simultaneously, the dynamic response of both the left and right tunnel vaults started to increase rapidly at a distance of approximately 10 m from the bridge–tunnel overlapping structure, and the dynamic response changes tended to stabilize at distances greater than 10 m. Therefore, monitoring and measurement within 10 m near the overlapping structure of the bridge and tunnel should be strengthened in the operation process to ensure safety in the operation stage. The dynamic response of the tunnel structure vault was highest at the bridge–tunnel overlapping structure, and the dynamic response index of the right tunnel was slightly greater than the left tunnel.
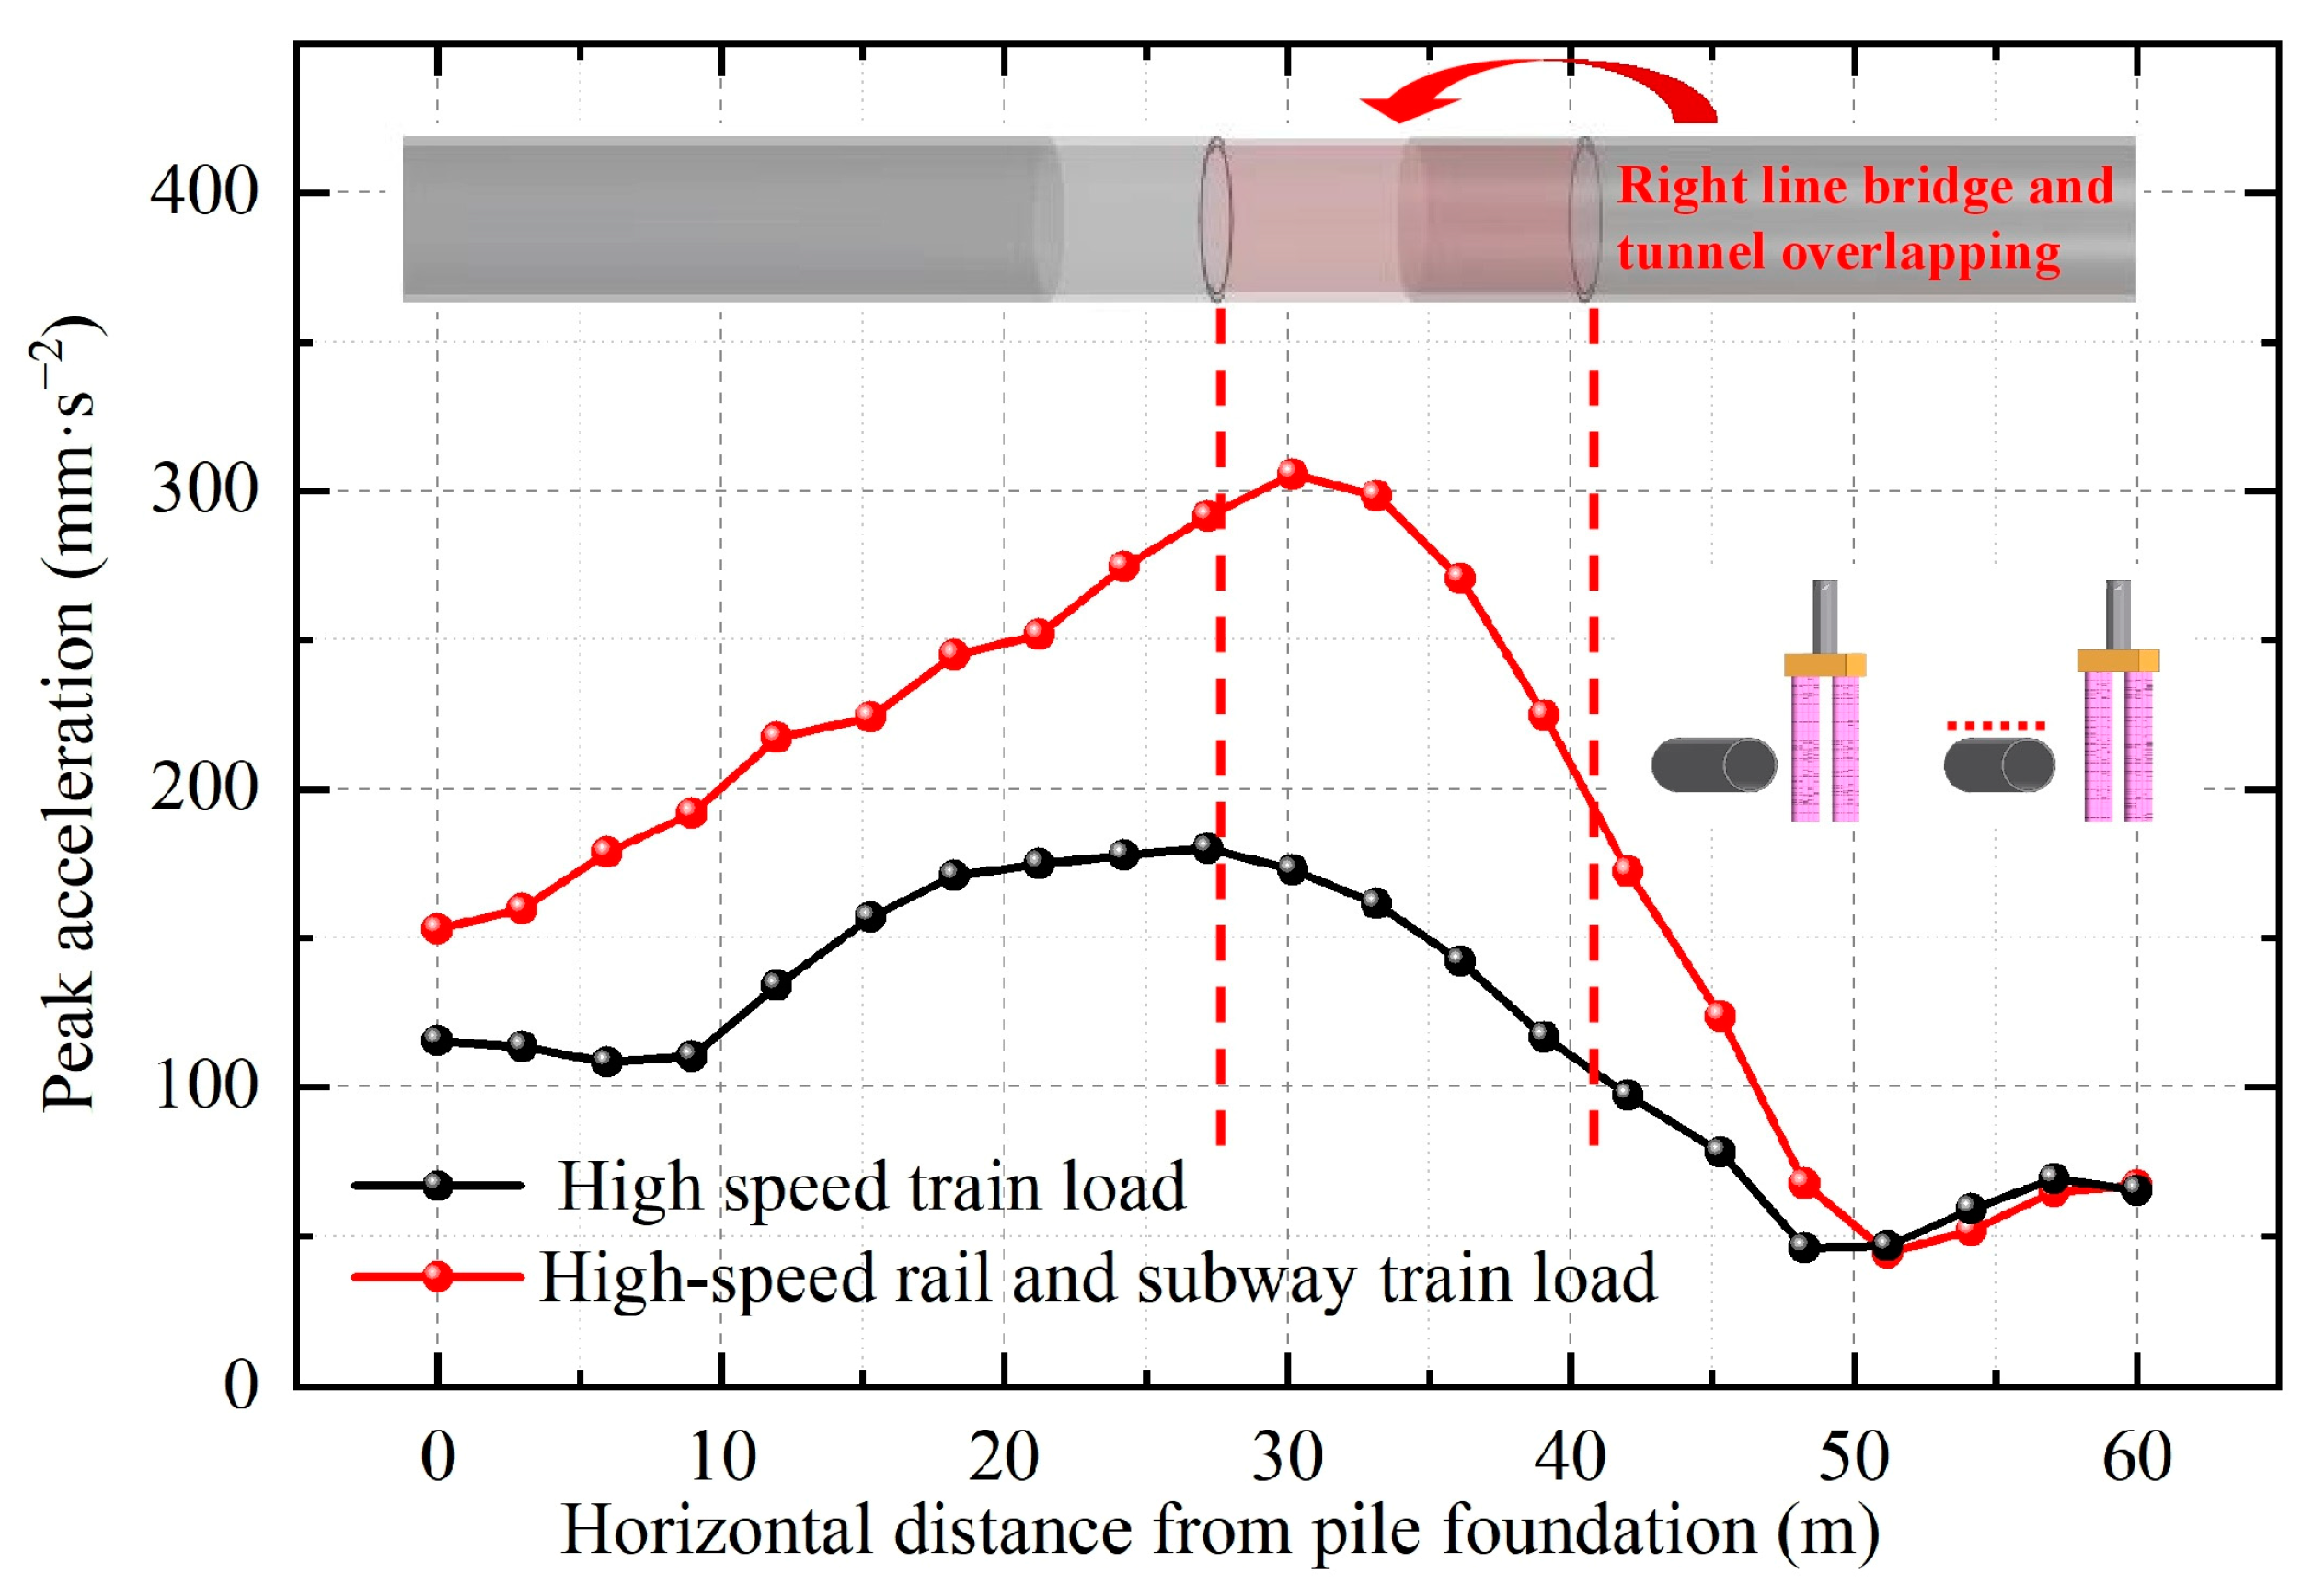
The dynamic response of the vault of the right tunnel under different working conditions is plotted, as shown in
Figure 15.
Figure 16 shows the dynamic response comparison of the right tunnel when the trains run simultaneously. The PPA of the tunnel was greater when it was close to the bridge–tunnel overlapping structure, and the dynamic response started to increase significantly within approximately 10 m near the bridge–tunnel overlapping structure, further verifying the above conclusion. The dynamic response of the right tunnel was significantly enhanced when the trains moved simultaneously compared with when only the high-speed train was running.
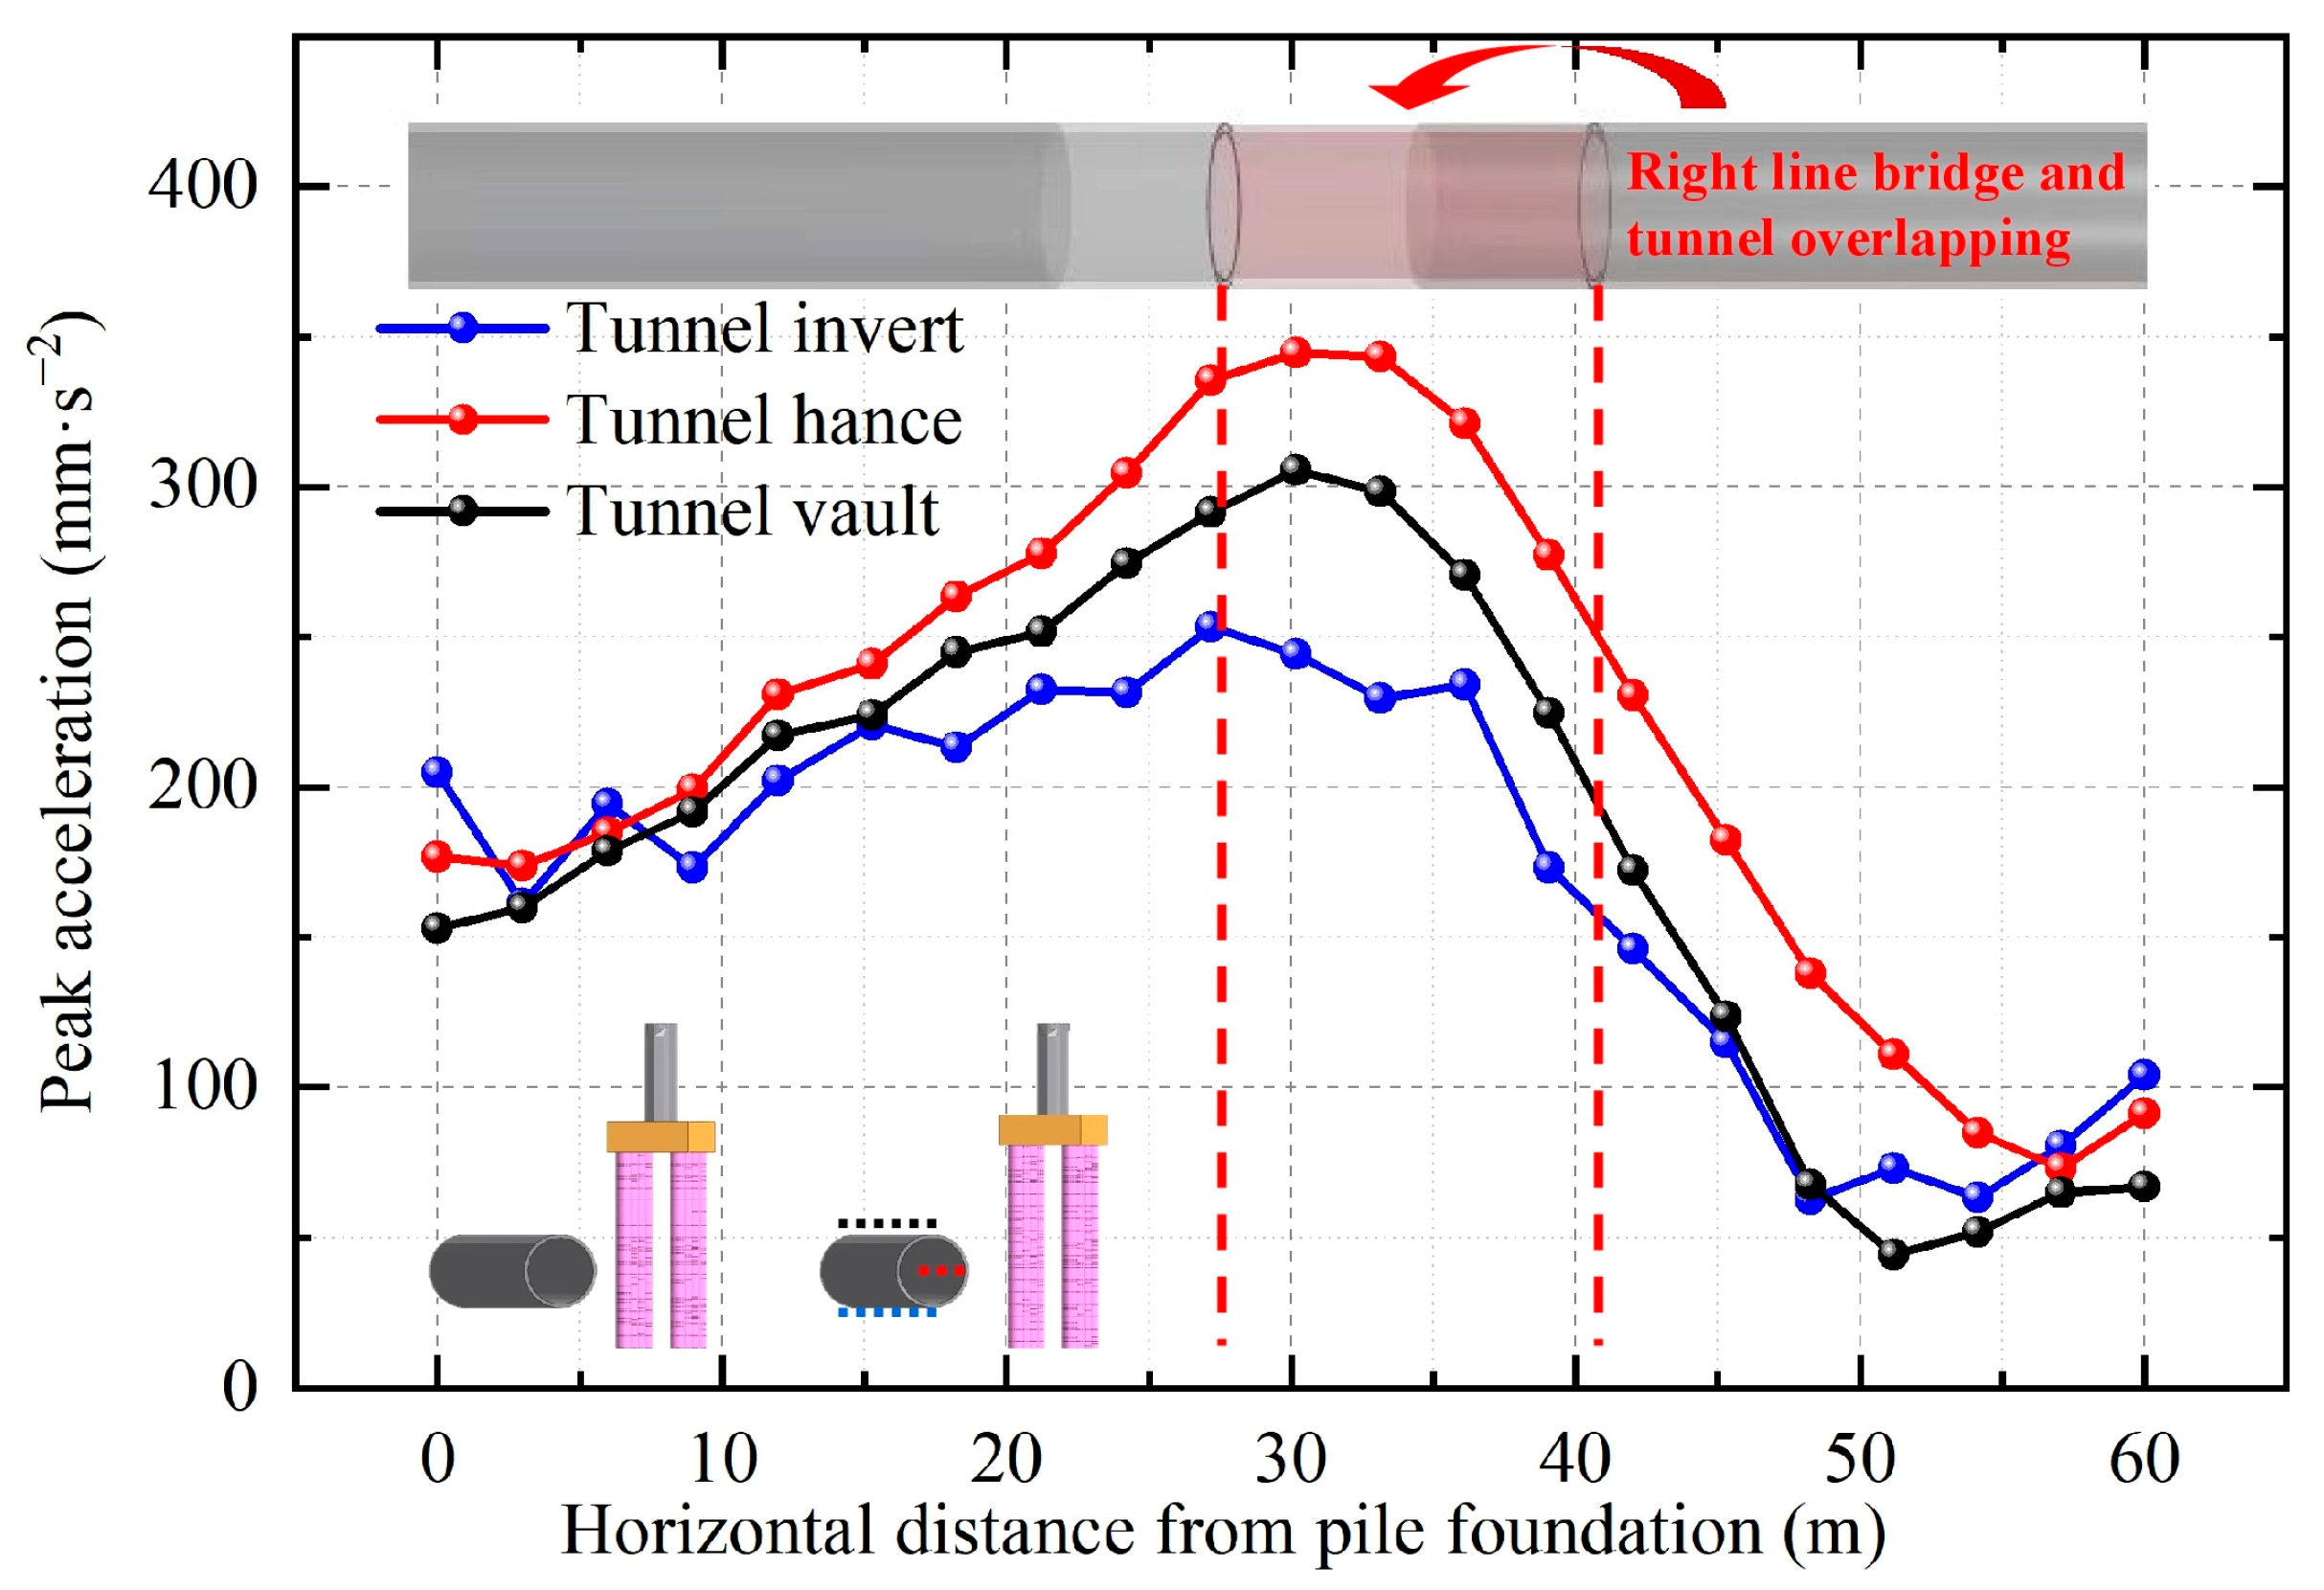
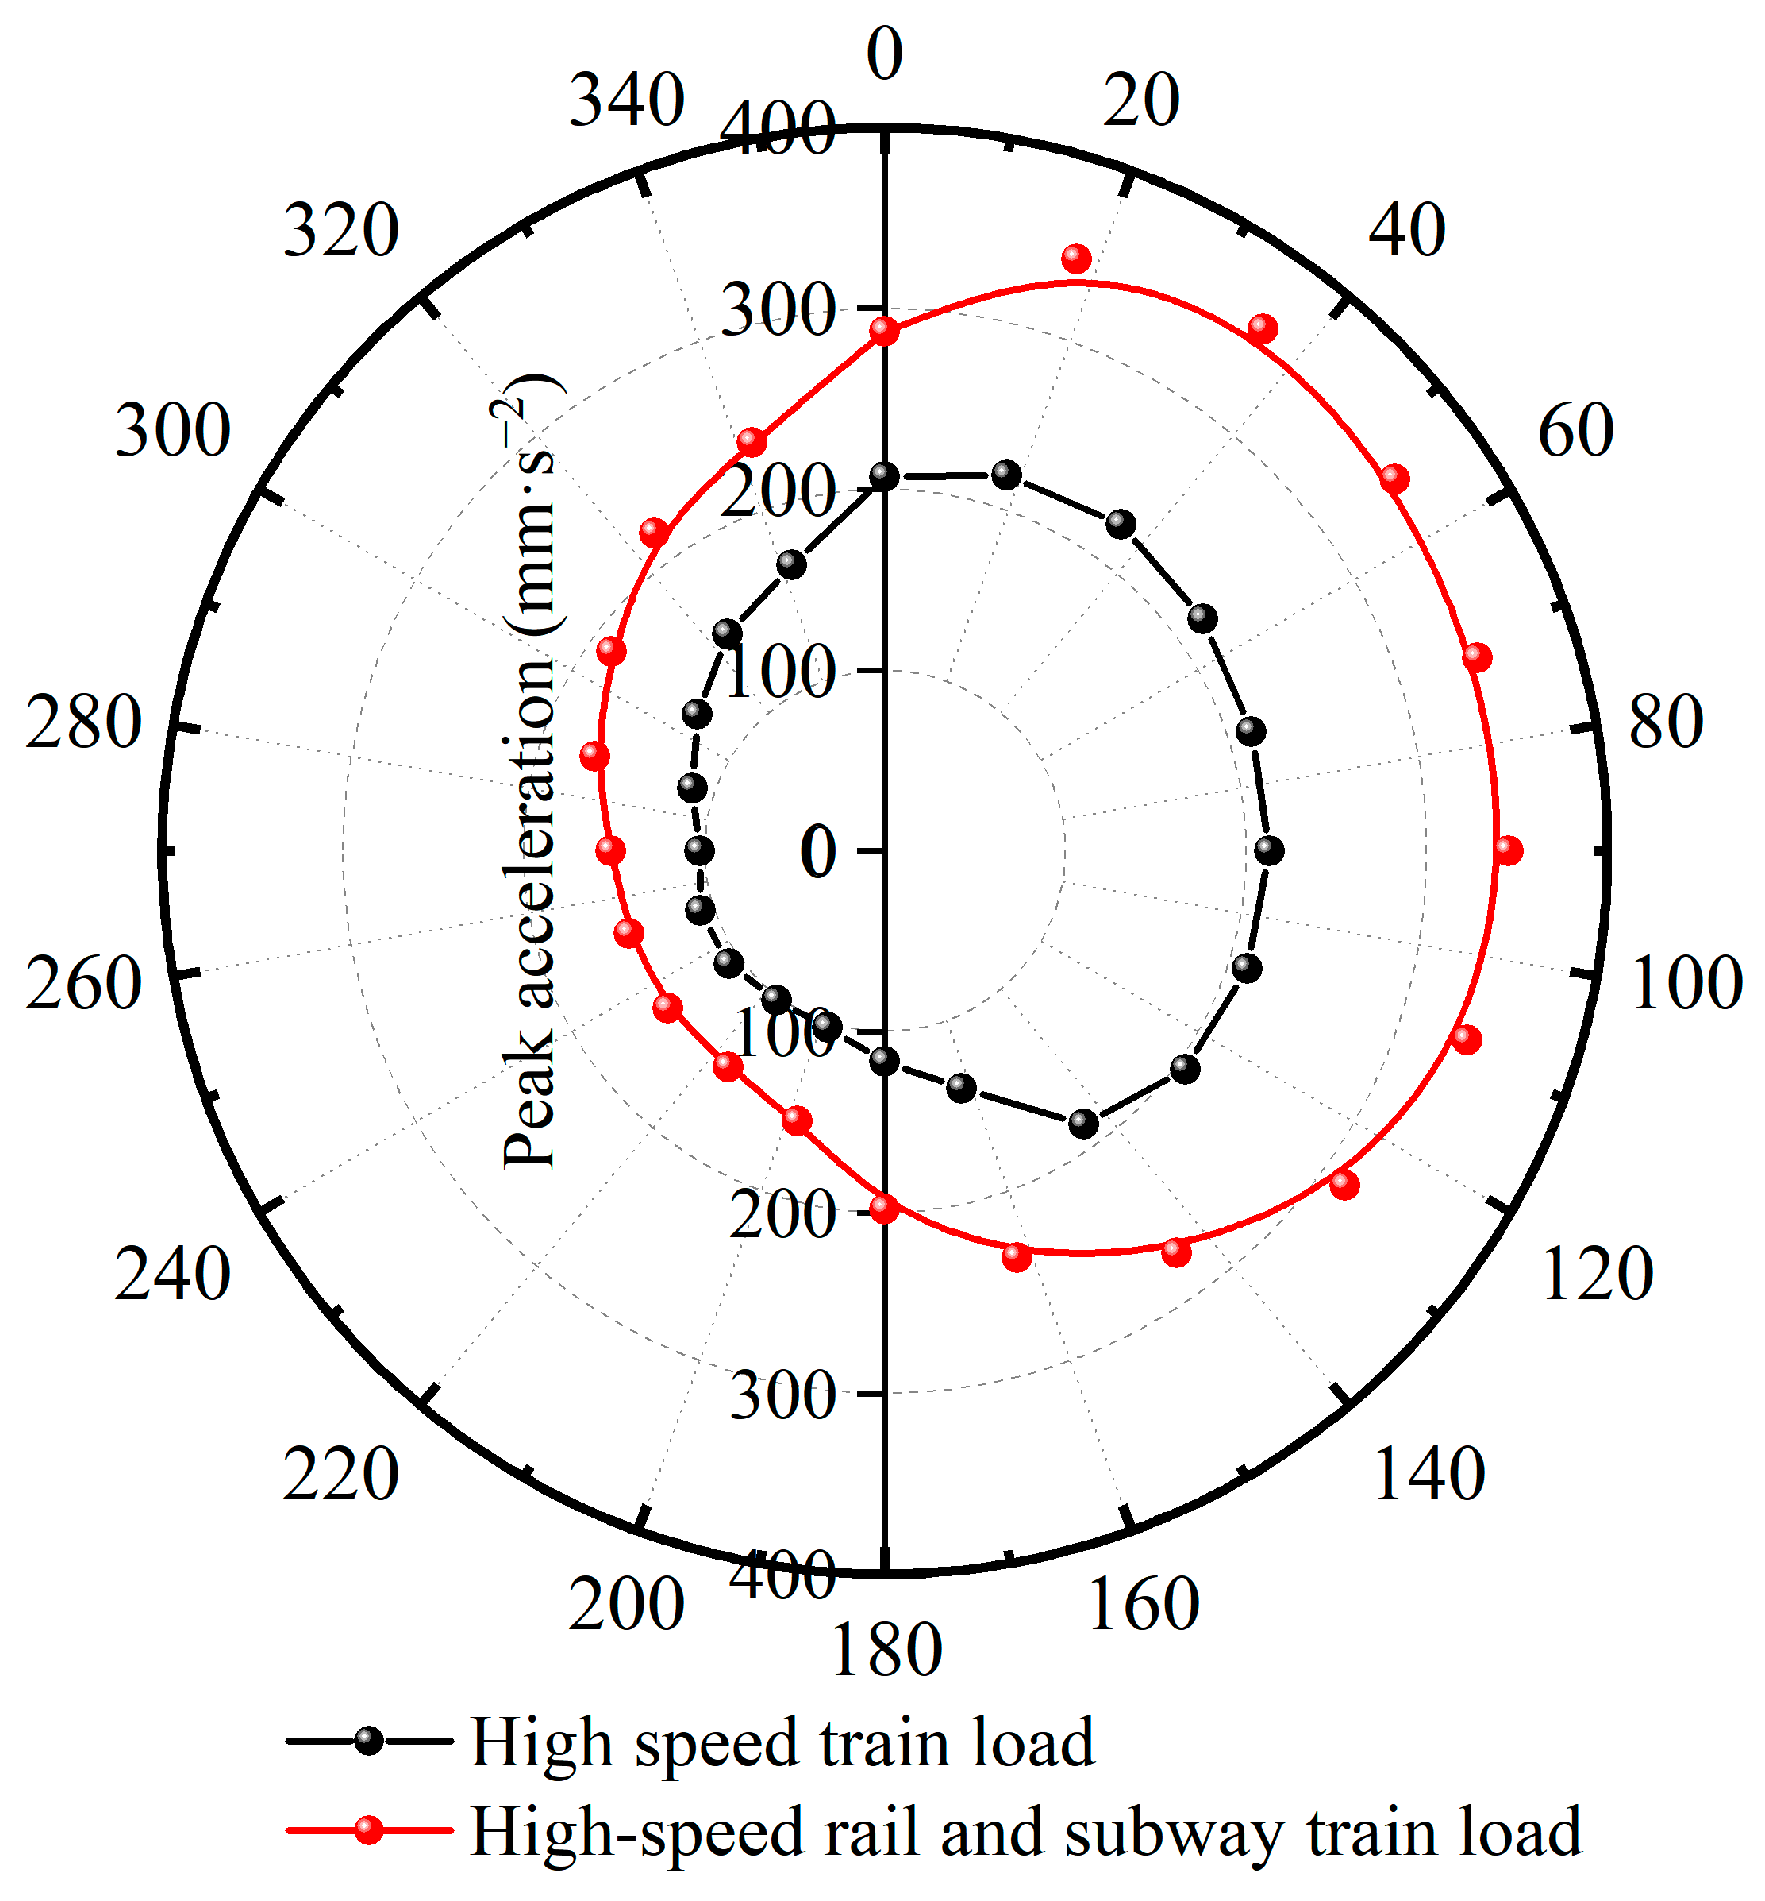
To further analyze the dynamic characteristics of the bridge–tunnel overlapping structure, monitoring sections were selected at the overlapping structure, and monitoring points were arranged along the circumferential direction of the tunnel monitoring section, as shown in
Figure 17. The PPA at the monitoring points was extracted, and the PPA curve of the right-line tunnel monitoring section was plotted, as shown in
Figure 18.
The analysis combined with
Figure 16 and
Figure 18 showed that the monitoring points at the vault (T1), hance (T3), and arch bottom (T4) have the following characteristics along the tunnel alignment when the trains move together. The hance (T3) exhibited the highest dynamic response, followed by the vault (T1), and lastly the arch bottom (T4). In addition, the dynamic response of the monitoring section near the pile foundation side was significantly greater than far from the pile foundation side; in particular, the PPA was 2.38 times greater. This is due to the fact that when the vibration of the high-speed trains propagates to the vicinity of the subway tunnel through the bridge, pier, and pile foundation structures, on the one hand, the train vibration attenuation will be relatively small due to the close distance to the pile foundation side, and on the other hand, the hollow subway tunnel acts as a bad medium for vibration, hindering the propagation of the vibration waves.
A comparison between
Figure 9 and
Figure 18 shows that compared with the dynamic response under the vibration load of a single-point train, the PPA under the vibration load of a moving train increased significantly. The PPA under the moving vibration load at the vault (T1) increased by approximately 358%. It increased at the hance (T3) near the pile side by approximately 280% and at the hance (T2) away from the pile side, and it increased by approximately 206% at the bottom (T4) of the tunnel arch. This indicates that the dynamic response of the bridge–tunnel overlapping structure increases due to the moving effect of the vibration load. Further analysis of
Figure 18 shows that the PPA increased substantially under the superimposed vibration load of the high-speed railway and subway trains. The PPA at the vault (T1) increased by approximately 39% under the superimposed load. The PPA at the hance (T3) near the pile foundation increased by approximately 62%. The PPA at the hance (T2) away from the pile foundation increased by approximately 48%, and at the bottom (T4) of the tunnel arch, it increased by approximately 70%. This shows that the superimposed effect of the high-speed railway and subway train loads leads to an increase in the dynamic response of the bridge–tunnel overlapping structure. This may be due to the superposition of the dynamic responses generated by the multi-point vibration loads at the monitoring point. Hence, the train movement and superposition effect need to be considered when conducting studies related to the bridge–tunnel overlapping structure under train vibration loads.
4. Conclusions
The close-distance undercrossing of the Datong-Xi’an high-speed railway bridge by the Xi’an subway line 14 was taken as the research subject. The dynamic response characteristics of this bridge–tunnel overlapping structure under the synergistic effect of the vibration loads generated by the high-speed railway and subway trains were studied using a combination of numerical simulation and model tests. The main conclusions are as follows:
(1) The dynamic response of the bridge–tunnel overlapping structure increased with the increase in the frequency under the full frequency domain single-point sweep vibration load, particularly in the range of 0–40 Hz. The dynamic response of the tunnel hance near the pile foundation side was significantly greater than the vault and invert, indicating the presence of localized effects.
(2) Under the synergistic effect of the vibration load of the high-speed railway and subway trains, the dynamic response of the tunnel structure rapidly increased within approximately 10 m from the bridge–tunnel overlapping structure, beyond which it tended to stabilize. Therefore, monitoring and measurement measures should be strengthened at distances within twice the tunnel diameter near the bridge–tunnel overlapping structure during the subway tunnel construction and operation processes.
(3) The dynamic response of the bridge–tunnel overlapping structure enhanced significantly under the action of the moving train vibration loads, with the PPA increasing by 358% at the tunnel vault (T1), 358% at the tunnel hance (T3) near the pile side, 280% at the tunnel hance (T2) far from the pile side, and approximately 206% at the tunnel invert (T4). Therefore, the movement effect of the train vibration load should be considered when conducting relevant studies under train vibration loading.
(4) The simultaneous operation of the high-speed railway and subway train led to a further increase in the PPA, with an average increment of approximately 50% compared with under the high-speed train loads alone. Therefore, the superposition effect of the train vibration load should be considered when conducting research related to bridge–tunnel overlapping structures under train vibration loads.
In summary, the dynamic response of bridge–tunnel overlapping structures is influenced by the frequency, location, and combined effect of vibration loads from high-speed railway and subway trains. Understanding these dynamic characteristics is important for ensuring the safety and structural integrity of such overlapping structures.
Author Contributions
Conceptualization, S.X.; data curation, Z.W.; funding acquisition, Z.G. and H.F.; investigation, Z.G.; methodology, S.X.; project administration, Y.Z. and H.F.; resources, Y.Z.; software, Q.X. and Z.W.; supervision, H.F.; validation, Q.X.; writing—original draft, S.X.; writing—review and editing, Q.X. All authors have read and agreed to the published version of the manuscript.
Funding
This study was financially supported by the National Natural Science Foundation of China (No. 52308272), the Natural Science Foundation of Hebei Province (No. E2020210068), the Science and Technology Project of Hebei Education Department (No. BJK2023079), and the Young Elite Scientists Sponsorship Program by CAST (No. 2021QNRC001).
Institutional Review Board Statement
Not applicable.
Informed Consent Statement
Not applicable.
Data Availability Statement
Data are contained within the article.
Conflicts of Interest
The authors declare no conflict of interest.
References
- Li, C.; Zhong, Z.; He, G.; Liu, X. Response of the ground and adjacent end-bearing piles due to side-by-side twin tunnelling in compound rock strata. Tunn. Undergr. Space Technol. 2019, 89, 91–108. [Google Scholar] [CrossRef]
- Deng, E.; Yang, W.; He, X.; Ye, Y.; Zhu, Z.; Wang, A. Transient aerodynamic performance of high-speed trains when passing through an infrastructure consisting of tunnel–bridge–tunnel under crosswind. Tunn. Undergr. Space Technol. 2020, 102, 103440. [Google Scholar] [CrossRef]
- Peng, F.; Ma, S. Analysis of experimental data on the effect of double-line parallel shield tunneling on the deformation of adjacent buildings. Alex. Eng. J. 2021, 60, 3957–3963. [Google Scholar] [CrossRef]
- Mayoral, J.M.; De La Rosa, D.; Alcaraz, M.; Barragan, E. Tunnel-soil-bridge seismic interaction on soft clay. Soil Dyn. Earthq. Eng. 2023, 164, 107619. [Google Scholar] [CrossRef]
- Shan, Y.; Cheng, G.; Gu, X.; Zhou, S.; Xiao, F. Optimization of design parameters of displacement isolation piles constructed between a high-speed railway bridge and a double-line metro tunnel: From the view point of vibration isolation effect. Comput. Geotech. 2021, 140, 104460. [Google Scholar] [CrossRef]
- Yoo, C.; Abbas, Q. Interaction between two-arch tunnel and pile supported bridge—An experimental investigation. Tunn. Undergr. Space Technol. 2021, 112, 103869. [Google Scholar] [CrossRef]
- Qiu, J.; Liu, D.; Zhao, K.; Lai, J.; Wang, X.; Wang, Z.; Liu, T. Influence spatial behavior of surface cracks and prospects for prevention methods in shallow loess tunnels in China. Tunn. Undergr. Space Technol. 2024, 143, 105453. [Google Scholar] [CrossRef]
- Qiu, J.; Liu, Y.; Qian, X.; Ma, C.; Liu, J.; Liu, T.; Han, H.; Ma, P. Guarantee rate statistics and product-moment correlation analysis of the optimal deformation allowance for loess tunnel in China. Environ. Earth Sci. 2024, 11263. [Google Scholar] [CrossRef]
- Zheng, Y.; Yang, J.; Liao, B.; Ma, S.; Zhong, H.; Lei, J. Investigation on the concrete strength performance of underlying tunnel structure subjected to train-induced dynamic loads at an early age. Constr. Build. Mater. 2022, 337, 127622. [Google Scholar] [CrossRef]
- Shi, C.; Wang, A.; Sun, X.; Yang, W. Research on the movement law and traffic safety zoning of spalled blocks in the linings of high-speed railway tunnels. Tunn. Undergr. Space Technol. 2022, 128, 104614. [Google Scholar] [CrossRef]
- Fu, Q.; Yuan, J. Experimental and Numerical Study of the Dynamic Response of XCC Pile–Raft Foundation under High-Speed Train Loads. Appl. Sci. 2021, 11, 9260. [Google Scholar] [CrossRef]
- Zhang, J.; Gao, G.; Bi, J. Analysis of vibration mitigation for CFG pile-supported subgrade of high-speed railway. Soil Dyn. Earthq. Eng. 2023, 164, 107612. [Google Scholar] [CrossRef]
- Yang, W.; Zhang, C.; Liu, D.; Tu, J.; Yan, Q.; Fang, Y.; He, C. The effect of cross-sectional shape on the dynamic response of tunnels under train induced vibration loads. Tunn. Undergr. Space Technol. 2019, 90, 231–238. [Google Scholar] [CrossRef]
- Guo, J.; Xu, L.; Xu, C.; Chen, R.; Lin, J. Dynamic response analysis on stress and displacement of the shield tunnel structure and soil layer under train-induced vibration in Xiamen Metro Line 6. Sustainability 2022, 14, 11962. [Google Scholar] [CrossRef]
- Xu, Q.; Zhu, Y.; Xu, S.; Fan, H.; Wang, D.; Wang, C.; Zhang, M.; Xing, D.; Li, Y. Dynamic Response of Pile-Soil Foundation with an Adjacent Tunnel under the High-Speed Train Loads: A Case Study. Appl. Sci. 2022, 12, 7170. [Google Scholar] [CrossRef]
- Yang, W.; Ma, G.; Tu, J.; Kou, H.; Zhang, Y.; Fang, Y.; He, C. Effects of voids on the dynamic response of tunnels under train-induced vibration loads. Int. J. Phys. Model. Geotech. 2023, 23, 77–91. [Google Scholar] [CrossRef]
- Ding, Z.; Huang, X.; Sun, M.-M.; Xu, L.-Y.; Huang, Z.-G.; Zhou, Q.-H. Experimental study on the influence of cracks on tunnel vibration under subway train load. Tunn. Undergr. Space Technol. 2023, 142, 105444. [Google Scholar] [CrossRef]
- Zhang, X.; Zhou, S.; He, C.; Di, H.; Si, J. Experimental investigation on train-induced vibration of the ground railway embankment and under-crossing subway tunnels. Transp. Geotech. 2021, 26, 100422. [Google Scholar] [CrossRef]
- Yang, W.; Hussein, M.; Marshall, A. Centrifuge and numerical modeling of ground-borne vibration from an underground tunnel. Soil Dyn. Earthq. Eng. 2013, 51, 23–34. [Google Scholar] [CrossRef]
- Thusyanthan, N.; Masabhushi, S. Experimental study of vibrations in underground structures. Geotech. Eng. 2003, 156, 75–81. [Google Scholar] [CrossRef]
- Gupta, S.; Hussein, M.; Degrande, G.; Hunt, H.; Clouteau, D. A comparison of two numerical models for the prediction of vibrations from underground railway traffic. Soil Dyn. Earthq. Eng. 2007, 27, 608–624. [Google Scholar] [CrossRef]
- Zhang, Z.; Song, Z.; Lai, J.; Qiu, J.; Cheng, Y.; Zhang, J. Critical slowing down precursor information for the acoustic emission response characteristics of defective tuffs. Theor. Appl. Fract. Mech. 2024, 129, 104220. [Google Scholar] [CrossRef]
- Zan, W.; Lai, J. Experimental and applied research on similar materials to granular mixtures for the solid-liquid coupling model test of an underwater tunnel. Constr. Build. Mater. 2024, in press. [Google Scholar]
- Pan, C.; Pande, G. Preliminary finite element analysis of dynamic load response of train in loess tunnel. J. Civ. Eng. 1984, 17, 18–28. (In Chinese) [Google Scholar]
- Yu, H.; Zhou, X. Study on dynamic response of three-dimensional cross railway tunnel under dynamic load of high speed train. J. Railw. 2015, 37, 103–111. (In Chinese) [Google Scholar]
- Chen, J.; Meng, D.; Li, J. Research on the dynamic response of prestressed pipe pile supported and geogrid reinforced subgrade. Chin. J. Undergr. Space Eng. 2020, 16, 679–686. (In Chinese) [Google Scholar]
- Gao, G.; Bi, J.; Chen, J. Vibration mitigation performance of embankments and cuttings in transversely isotropic ground under high-speed train loading. Soil Dyn. Earthq. Eng. 2021, 141, 106478. [Google Scholar] [CrossRef]
- Fiala, P.; Degrande, G.; Augusztinovicz, F. Numerical modelling of ground-borne noise and vibration in buildings due to surface rail traffic. J. Sound Vib. 2007, 301, 718–738. [Google Scholar] [CrossRef]
- Hatzigeorgiou, G.D.; Beskos, D.E. Soil—structure interaction effects on seismic inelastic analysis of 3-D tunnels. Soil Dyn. Earthq. Eng. 2010, 30, 851–861. [Google Scholar] [CrossRef]
Figure 1.
Datong–Xi’an high-speed railway bridge.
Figure 1.
Datong–Xi’an high-speed railway bridge.
Figure 2.
Test system schematic.
Figure 2.
Test system schematic.
Figure 3.
Layout of the monitoring points.
Figure 3.
Layout of the monitoring points.
Figure 4.
Sinusoidal sweep load curve.
Figure 4.
Sinusoidal sweep load curve.
Figure 5.
Vibration load time history curve of the high-speed train.
Figure 5.
Vibration load time history curve of the high-speed train.
Figure 6.
Numerical calculation model of a bridge–tunnel overlapping structure.
Figure 6.
Numerical calculation model of a bridge–tunnel overlapping structure.
Figure 7.
Dynamic response curves of the bridge–tunnel overlapping structure at the monitoring points.
Figure 7.
Dynamic response curves of the bridge–tunnel overlapping structure at the monitoring points.
Figure 8.
Monitoring the dynamic response curve of the section.
Figure 8.
Monitoring the dynamic response curve of the section.
Figure 9.
Peak acceleration response curve of the monitoring section at 350 km/h.
Figure 9.
Peak acceleration response curve of the monitoring section at 350 km/h.
Figure 10.
Numerical calculation model.
Figure 10.
Numerical calculation model.
Figure 11.
Vibration load time history curve of the subway train.
Figure 11.
Vibration load time history curve of the subway train.
Figure 12.
Direction of train travel.
Figure 12.
Direction of train travel.
Figure 13.
Layout of the monitoring points on the tunnel profile.
Figure 13.
Layout of the monitoring points on the tunnel profile.
Figure 14.
Comparison of the dynamic responses of the left and right tunnel arches when high-speed and subway trains run simultaneously.
Figure 14.
Comparison of the dynamic responses of the left and right tunnel arches when high-speed and subway trains run simultaneously.
Figure 15.
Comparison of the dynamic response of the right tunnel arch under different working conditions.
Figure 15.
Comparison of the dynamic response of the right tunnel arch under different working conditions.
Figure 16.
Comparison of the dynamic response of the right line tunnel during train operation.
Figure 16.
Comparison of the dynamic response of the right line tunnel during train operation.
Figure 17.
Layout of the monitoring points at the tunnel cross-section.
Figure 17.
Layout of the monitoring points at the tunnel cross-section.
Figure 18.
Peak acceleration response curve of the tunnel monitoring section on the right line.
Figure 18.
Peak acceleration response curve of the tunnel monitoring section on the right line.
Table 1.
Physical and mechanical parameters of the prototype and model.
Table 1.
Physical and mechanical parameters of the prototype and model.
| Surrounding Rock | Elastic Modulus (MPa) | Shear Modulus (MPa) | Poisson’s Ratio |
|---|
| Prototype | 66 | 25.38 | 0.3 |
| Model | 4.5 | 1.73 | 0.3 |
Table 2.
Structural parameters.
Table 2.
Structural parameters.
| Structure | Material | Elastic Modulus (GPa) | Poisson’s Ratio | Density (g/cm3) |
|---|
| Rail | Steel | 2100 | 0.3 | 78.35 |
| Duct Piece | C50 | 35.5 | 0.2 | 2.5 |
| Pile Foundation | C40 | 34 | 0.2 | 2.5 |
| Bridges, Piers, Caps | C40 | 34 | 0.2 | 2.5 |
Table 3.
Formation parameters.
Table 3.
Formation parameters.
| Name | Elastic Modulus (MPa) | Density (g/cm3) | Poisson’s Ratio | Internal Friction Angle (°) | Cohesive Force (kPa) | Lift Height (m) |
|---|
| Miscellaneous Fill | 20 | 1.8 | 0.34 | 10 | 10 | 1.7 |
| Silty Sand | 36 | 1.68 | 0.3 | 29 | 0 | 1.3 |
| Medium sand | 44.4 | 1.73 | 0.28 | 31 | 0 | 3.8 |
| Silty clay | 30 | 1.93 | 0.3 | 20 | 22 | 2.5 |
| Medium sand | 52.4 | 1.97 | 0.28 | 32.5 | 0 | 4.3 |
| Silty clay | 25.2 | 1.91 | 0.3 | 20.5 | 23 | 14.1 |
| Medium sand | 66 | 2.06 | 0.27 | 34 | 0 | 52.3 |
Table 4.
Numerical simulation conditions.
Table 4.
Numerical simulation conditions.
| Working Condition | Loading | Velocity (km/h) |
|---|
| 1 | High-Speed Railway | 350 |
| 2 | High-Speed Railway | 350 |
| Metro | 100 |
| Disclaimer/Publisher’s Note: The statements, opinions and data contained in all publications are solely those of the individual author(s) and contributor(s) and not of MDPI and/or the editor(s). MDPI and/or the editor(s) disclaim responsibility for any injury to people or property resulting from any ideas, methods, instructions or products referred to in the content. |
© 2024 by the authors. Licensee MDPI, Basel, Switzerland. This article is an open access article distributed under the terms and conditions of the Creative Commons Attribution (CC BY) license (https://creativecommons.org/licenses/by/4.0/).


 ,
, 


