Article

Driving Force–Pressure–State–Impact–Response-Based Evaluation of Rural Human Settlements’ Resilience and Their Influencing Factors: Evidence from Guangdong, China

1
School of Public Administration, South China University of Technology, Guangzhou 510640, China
2
Committee of the Communist Youth League of China, Guangxi University, Nanning 530004, China
*
Authors to whom correspondence should be addressed.
Sustainability 2024, 16(2), 813; https://doi.org/10.3390/su16020813
Submission received: 13 December 2023 / Revised: 8 January 2024 / Accepted: 16 January 2024 / Published: 17 January 2024

Abstract

:
During urbanization, rural human settlements experience dual pressures from both ecology and culture. Strengthening resilience can enhance the system’s ability to withstand external pressures and restore equilibrium, providing a new research perspective and practical approach for the sustainable development of rural areas. Yet, there are limited reports in the literature on evaluating and improving rural human settlements resilience. To fill this gap, the paper establishes an evaluation system utilizing the DPSIR framework and entropy method. It employs 115 counties and districts in Guangdong Province as samples to evaluate rural human settlements’ resilience in 2020. The Geographically Weighted Regression (GWR) model is used to analyze spatial differences and the influencing mechanisms of various factors on resilience. The results suggest that the overall rural human settlements’ resilience in Guangdong Province is relatively low, showing a concentrated spatial distribution and also variations in the levels and spatial distributions of resilience across different dimensions. Moreover, various dimensions of resilience significantly impact rural human settlements. The driving force resilience coefficients are all significantly positive, with higher values in Western Guangdong and Eastern Guangdong. The pressure resilience coefficients are all significantly negative, decreasing from east to west. The state resilience coefficients show an overall positive correlation, with lower values in the central and northern parts and higher values in the eastern and western parts. The impact resilience and response resilience coefficients are generally positive, with higher values in the Pearl River Delta. This paper extends the theoretical framework for evaluating and analyzing rural human settlements’ resilience, offering empirical evidence to optimize their resilience in a geographical context.

1. Introduction

Rural areas are a vital component of human habitation, intricately intertwined with people’s lives. According to United Nations statistics, rural populations make up over half of the global population, with 79% of the world’s impoverished individuals being impoverished rural residents. As of 2021, the rural population of China is 498.35 million, accounting for 35.3% of the total population [1]; in Guangdong Province, the rural population is 32.18 million, representing 25.4% of the total population. Rural human settlements worldwide are undergoing deterioration, exacerbated by the rapid progression of urbanization that intensifies population, social, and environmental conflicts in these areas. Ecological livability plays a crucial role in rural revitalization as favorable rural human settlements constitute the greatest advantage and are a valuable asset of rural areas. It serves as a vital foundation for the sustainable development of rural communities. However, owing to China’s extended focus on urban-centric development, rural areas, agriculture, and farmers remain in disadvantaged positions. The overall development level of rural human settlements remains relatively low, with shortcomings persisting in areas such as environmental hygiene, infrastructure, public services, and housing construction [2]. Especially in rural areas, where income levels are low, environmental pollution increases the income-related health inequality of people [3]. As living standards continue to rise, the current situation falls short of meeting the needs of rural residents, emphasizing the imperative need to address and enhance rural human settlements [4].
It is essential to acknowledge that the transformation, development, and ascension of rural areas constitute a process that transcends the laws of nature and disrupts the balance of resources, implying potential risks and crises. The continuous effects of China’s urban–rural integration construction continuously erodes the stability and adaptability of the rural human settlements system [5,6]. Correspondingly, the rural revitalization strategy places greater emphasis on stimulating intrinsic vitality, enhancing sustainable development capabilities, and inevitably encounters a comprehensive shift in awareness and conceptual renewal in the improvement of rural human settlements [7]. Faced with a complex scenario, the traditional government-led “rigid regulation” model has gradually faded, revealing passivity and predicaments in the evolving risk response. The primary objective of the rural revitalization strategy encompasses “ecological livability, cultural civility in villages, thriving industries, effective governance, and prosperous lives [8]”. In this context, researchers are increasingly focusing on the resilience of rural human settlements. The enhancement of rural human settlements’ resilience plays a part in the decisive role of the market in allocating energy, improving the efficiency of energy allocation and utilization and thereby reducing carbon emissions and promoting green development [9], further enhancing the organizational and cohesive power of rural communities and promoting the revitalization of ecology, organization, and culture. A favorable human settlement also facilitates talent attraction and retention, boosts agricultural productivity, and stimulates talent and industry revitalization, ultimately achieving economic prosperity and comprehensive revitalization. Therefore, enhancing rural human settlements’ resilience aligns logically with the internal connotations of the rural revitalization strategy.
Resilience refers to a system’s capacity to maintain stability when facing external disturbances or its ability to self-organize and adapt when intrinsic balance is disrupted [10]. Originating from studies in mechanics and engineering [11], the concept of resilience has evolved and found applications in various fields such as ecology [12,13], social ecosystems [14], and management. It underwent progression from engineering resilience to ecological resilience and then to evolutionary resilience [15]. Reducing the vulnerability of the rural human settlements system while comprehensively enhancing resilience significantly improves efficiency and promotes sustainable development. This approach aids rural areas in effectively addressing challenges and ensuring the health and well-being of residents [16]. Resilience, a forefront topic in rural sustainable development research, can be linked back to the concept of adaptive management proposed by Holling [17]. Researchers have explored various perspectives, including Rural Ecological Resilience [18,19,20], Rural Residents’ Livelihood Resilience [21,22,23,24], and Rural Settlements’ Resilience [25,26]. However, research on the resilience of rural human settlements is limited, with the focus primarily on individual ecological systems. Research content predominantly revolves around resilience concepts, indicators [27], comprehensive evaluations [28], influencing factors [29], etc., often neglecting the internal operational mechanisms and mutual interactions of systemic resilience.
The literature indicates that the rural human settlements system comprises natural, economic, and social elements [30], with this paper focusing on indicators derived from these elements. Typically, the rural human settlements system embodies three dimensions: nature, economy, and society [31]. Urban and rural ecological resilience research has utilized models like the Pressure–State–Response (PSR) model and Driving Force–Pressure–State–Impact–Response (DPSIR) model [32,33,34,35,36,37]. In comparison to the PSR model, the DPSIR model intricately depicts the relationship between the ecological environment and human activities. Within the DPSIR model, the social and economic “Driving Force(D)” exerts “Pressure (P)” on rural human settlements, inducing changes in the existing “State (S)” and subsequently having an “Impact (I)” on human activities. This cascade of events leads to a “Response (R)”, forming a comprehensive cause-and-effect chain. The DPSIR framework captures the causal relationships among five-dimensional indicators, facilitating the analysis of the rural human settlements system’s structure. It establishes a robust foundation for evaluating the resilience of rural human settlements.
Taking into account the factors mentioned above, this paper develops a resilience measurement system for rural human settlements. It is based on the DPSIR framework and integrates natural, economic, and social aspects. Employing the entropy method, we evaluate the resilience of rural human settlements in Guangdong Province and utilize the GWR model to identify influencing mechanisms [38], proposing specific optimization strategies. This not only furnishes theoretical backing for bolstering the resilience of rural human settlements but also provides decision-making references for rural areas to confront uncertain risks and enhance regional management capabilities. To a certain extent, it enriches and advances the theoretical perspectives of rural resilience and ecological civilization.

2. Construction of Rural Human Settlements’ Resilience Evaluation System

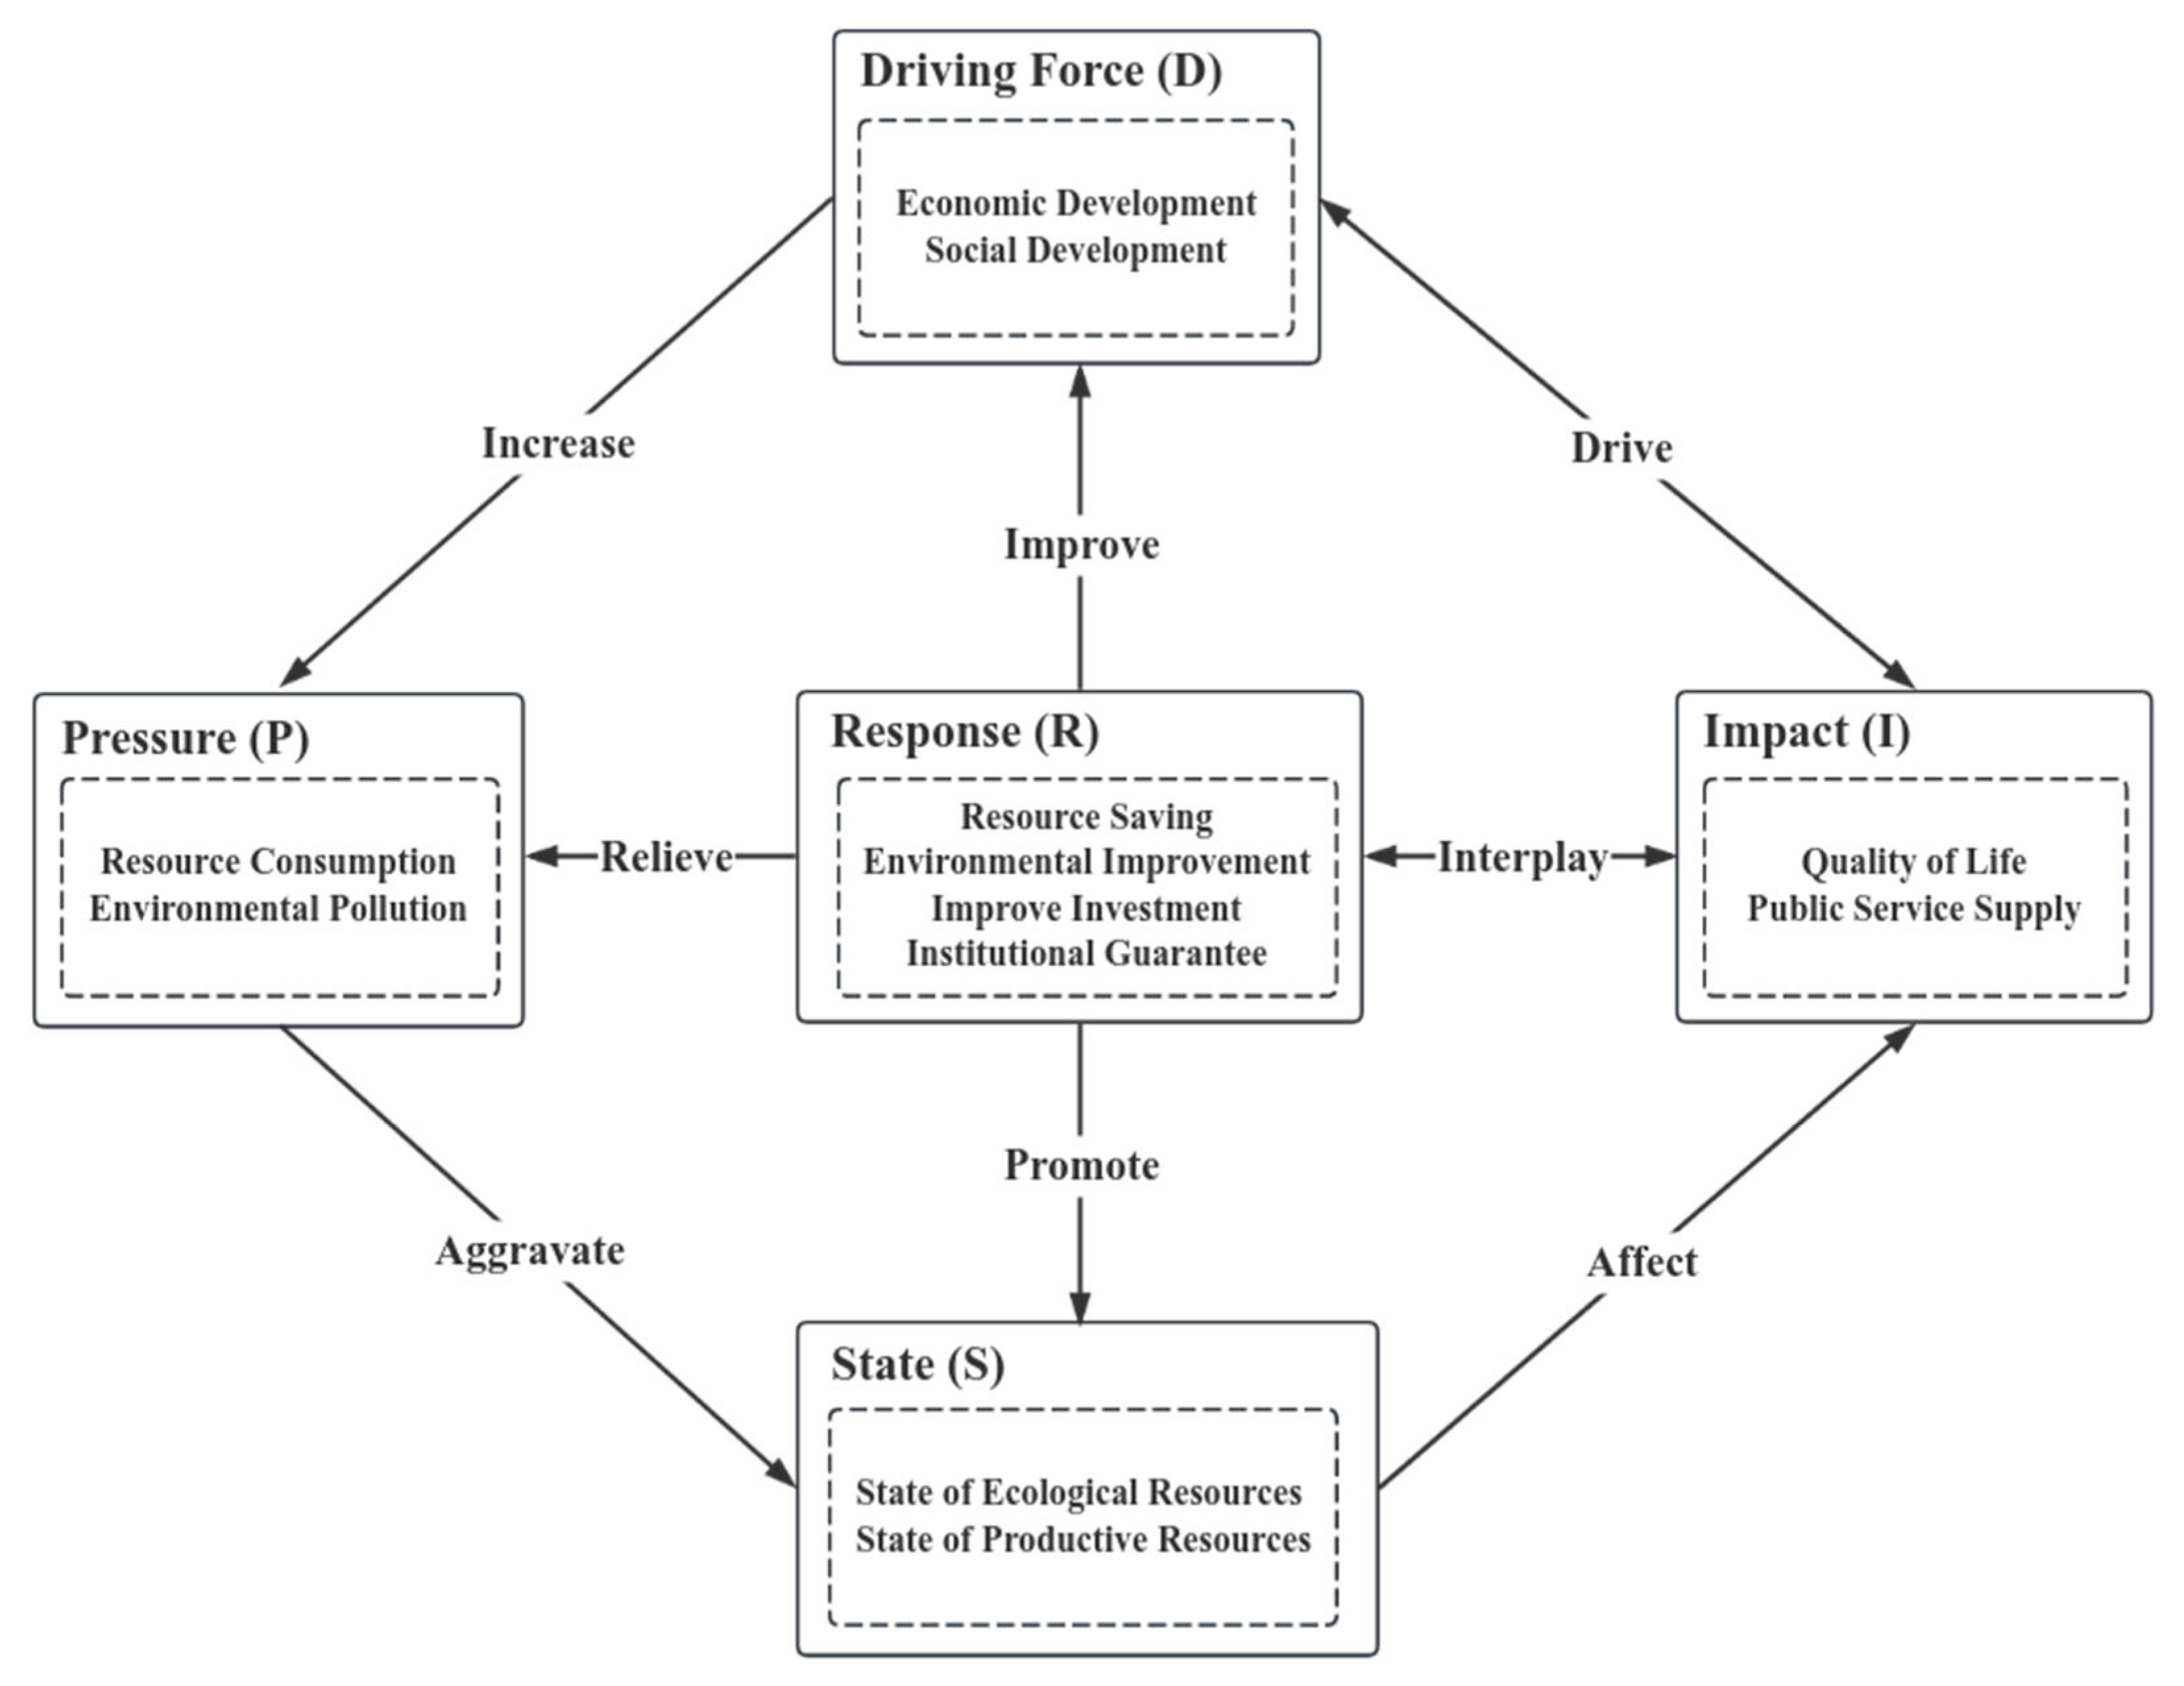
2.1. Application of the DPSIR Model

The DPSIR model, introduced by the Organisation for Economic Co-operation and Development (OECD) in the 1990s, has been extensively adopted by the European Environment Agency (EEA) as a primary framework for establishing environmental quality-assurance systems [39]. Following the OECD’s DPSIR model structure, this study regards “Driving Force” as the fundamental factor propelling the enhancement of rural human settlements. It delineates alterations in human actions associated with economic and social development, population growth, and more. “Pressure” encompasses the threats and stresses induced by human activities, such as resource consumption and utilization, emissions of pollutants, and changes in lifestyles. The term “State” signifies alterations in the conditions of rural human settlements under pressure. “Impact” pertains to the effects on social and economic aspects and the lives of rural residents. “Response” includes the measures undertaken by humans to alleviate pressure and enhance the resilience and adaptability of rural human settlements in the face of impacts.
The DPSIR model applied to the resilience of rural human settlements elucidates the interconnected relationships among nature, economy, and society. It facilitates the assessment of the carrying capacity and thresholds of each subsystem and their repercussions on human activities. The model underscores the inherent mechanisms of interaction and mutual constraints between human activities and rural human settlements. In the absence of disturbances, production activities focused on pursuing economic benefits, serving as the core driving force (D), stand as the primary catalyst for changes in rural human settlements. Simultaneously, due to resource consumption and environmental pollution, these activities continuously exert pressure (P) on rural human settlements. As pressure accumulates to a certain extent, external disturbances are more likely to trigger imbalances and reconstruction in the system, resulting in a sharp decline in resilience and profound changes in the state (S) of rural human settlements. Consequently, this impacts (I) human activities. Humans respond (R) to these impacts through policy regulation, pollution control, and restoration compensation measures, preventing and reducing the effects and losses caused by disturbances. The DPSIR model, with its complete causal chain, effectively explains the entire process and stages of resilience evolution, as shown in Figure 1. It provides a unique perspective for constructing a resilience evaluation indicator system for rural human settlements.

2.2. Rural Human Settlements’ Resilience Evaluation System Construction

Constructing a resilience evaluation system for rural human settlements based on the DPSIR model, this study delves into key factors influencing the operation of the system. These factors encompass driving force, pressures, operational states, changes in system impacts, and activities that maintain the balance of the ecosystem. Upholding the principles of scientific rigor, systematicity, universality, and data availability, and drawing on prior research and experimental requirements, this study initially identified 20 indicators across five dimensions of driving force, pressure, state, impact, and response (Table 1).
Utilizing the Pearson correlation coefficient method [41], 17 indicators with strong correlations were screened out, except D3, R6, and R7 (Figure 2), culminating in the establishment of a resilience evaluation indicator system for rural human settlements.
The driving force (D) comprises dynamic factors that propel changes in rural human settlements. These include the per capita disposable income of rural residents and the per capita output value of agriculture, forestry, animal husbandry, and fisheries, reflecting economic, productivity, and labor dynamics. These driving forces influence pressure, state, and response factors, serving as the driving sources for the development and changes in rural human settlements.
Pressure (P) refers to the factors imposing pressure on the rural human settlements. This includes per capita electricity consumption, per capita daily domestic water consumption, fertilizer intensity, and pesticide intensity, reflecting resource consumption and environmental pollution. These factors impact state and response elements, influencing environmental quality and the health of rural residents.
State (S) represents the current condition of rural human settlements. Indicators such as the rural greening rate, per capita arable land holding, per capita construction land area, and the permanent population of households reflect the ecological environment level and characteristics of resources and population in rural areas. State factors are influenced by driving forces and pressures, and they, in turn, affect other elements.
Impact (I) refers to the influence of rural human settlements on residents’ quality of life. Indicators such as the number of hospital beds per thousand people and average years of education reflect the provision of public goods in rural areas, directly affecting the social security level of rural residents in education, healthcare, and other aspects.
Response (R) indicators focus on the feedback of human activities on the natural, social, and living environment and their impact on residents’ lives. Indicators such as the proportion of administrative villages with sewage treatment, the proportion of harmless treatment of household garbage, the popularization rate of village water supply, the coverage rate of village planning and management, and the density of rural road networks reflect the response and efforts of rural residents to enhance the resilience of the human settlements.

3. Materials and Methods

3.1. Study Area

Guangdong Province is situated in the southernmost part of mainland China and covers a total area of 179,800 square kilometers. It administers 21 cities. The terrain exhibits higher elevations in the north and lower elevations in the south, characterized by predominantly mountainous and hilly landscapes in the northern part and plains and plateaus in the southern part. The provincial area is categorized into four regions based on economic development, regional characteristics, and main functions, namely the Pearl River Delta, Eastern Guangdong, Western Guangdong, and Northern Guangdong, as illustrated in Figure 3. Guangdong Province places significant emphasis on the improvement of rural human settlements. Since 2017, the provincial government has earmarked CNY 160 billion over a 10-year period for rural human settlements’ improvement and infrastructure construction, culminating in the establishment of the “Guangdong experience” in rural human settlements’ improvement. However, notable development disparities exist among different regions, and deficiencies persist in rural human settlements. Taking into account factors such as geographical location, economic development level, rural management proficiency, and administrative traditions, the efficacy and limiting factors of rural human settlements’ improvement closely align with the focal points of this study. Therefore, Guangdong Province was selected as the research subject. Given the substantial number of administrative villages and considerations regarding the feasibility and accuracy of obtaining statistical data, this study adopts county-level administrative divisions as the fundamental research units.

3.2. Data Sources

The data utilized in this study primarily encompass socio-economic, ecological resource, public service, and infrastructure data. The principal reference sources include the “Guangdong Rural Statistical Yearbook”, “Guangdong Statistical Yearbook”, “Guangdong Construction Yearbook”, “Guangdong Health Yearbook”, and other relevant publications. The research spans 115 county-level administrative regions across the 20 prefecture-level cities of Guangdong Province. Notably, according to the data from the “Guangdong Rural Statistical Yearbook (2021)”, due to complete urbanization, Shenzhen has no relevant rural data and is excluded from the scope of this study.

3.3. Research Methodology

The evaluation method adopted in this study involves three key steps. Firstly, constructing an evaluation indicator system for the resilience of rural human settlements based on the DPSIR framework and determining the weights of each indicator using the entropy method. Secondly, employing the weighted combination method to comprehensively evaluate the resilience level of rural human settlements in each county, thereby analyzing spatial heterogeneity. Lastly, utilizing the Geographically Weighted Regression (GWR) model to analyze the spatial differences in influencing factors affecting the resilience of rural human settlements in Guangdong Province.

3.3.1. Determine the Weights of Indicators Using the Entropy Method

(1)
Apply the extreme value method to standardize the indicator data. Use the following formula:
S t a n d a r d i z a t i o n   o f   p o s i t i v e   i n d i c a t o r s   X i j = X i j X m i n X m a x X m i n
S t a n d a r d i z a t i o n   o f   n e g a t i v e   i n d i c a t o r s   X i j = X m a x X i j X m a x X m i n
In this formula, X i j represents the value of the j t h indicator for the i t h sample, X m a x denotes the maximum value of the j t h indicator, and X m i n represents the minimum value of the j t h indicator. To prevent the standardized value from being zero, when X i j = 0 , X i j = X i j + ∆ (where ∆ is a very small number, dependent on numerical precision).
(2)
Calculate the weight of the j t h indicator for the i t h evaluation sample.
S i j = X i j i = 1 n X i j 0 S i j 1
(3)
Calculate the entropy value of the j t h indicator.
e j = K i = 1 m S i j l n S i j
(4)
Calculate the information entropy redundancy of the j t h indicator.
d j = 1 e j
(5)
Calculate the weight of the j t h indicator.
W j = d j i = 1 m d j
The formula is as follows: S i j represents the weight value of the j t h indicator for the i t h evaluation sample. e j denotes the information entropy value of the j t h indicator, and d j represents the information entropy redundancy of the j t h indicator. W j denotes the weight coefficient value of the j t h indicator.

3.3.2. Evaluation of Rural Human Settlements’ Resilience

Add up the layer attributes of the five dimensions: driving force, pressure, state, impact, and response to obtain the resilience of rural human settlements. The calculation formula is as follows:
U = j = 1 17 W j X i j
In the equation, U represents the rural human settlements’ resilience. X i j represents the standard value of the j t h indicator for the i t h evaluation sample.

3.3.3. Geographically Weighted Regression Model

Taking the resilience of rural human settlements as the dependent variable and the resilience in each dimension as independent variables, a Geographical weighted regression (GWR) model is constructed to explore the spatial differences in the main influencing factors of rural human settlements [42]. Assuming the existence of a series of explanatory variables and the explained variable, the GWR model is as follows:
Y i = β 0 ( u i , v i ) + j = 1 p β j ( u i , v i ) X i j + ε i   ( i = 1 , 2 , m ; j = 1 , 2 , n )
In the equation, ( u i , v i ) are the coordinates of the i t h sampling point in space, β j ( u i , v i ) is a continuous function β j ( u , v ) ; ε i is the residual value of the i t h sample.

4. Results

4.1. Rural Human Settlements’ Resilience Evaluation Indicators System

In the context of the research background outlined in Section 2.2, this paper used the Pearson correlation coefficient method. Within the DPSIR model framework, 17 indicators were chosen. Subsequently, using relevant data from 2020, the entropy weight method (Equations (1)–(6)) was applied to calculate indicator weights, resulting in the construction of the rural human settlements’ resilience evaluation indicators system (Table 2).

4.2. Rural Human Settlements’ Resilience Horizontal Spatial Patterns

To illustrate the variations in the resilience levels of rural human settlements across different regions, the natural breakpoint method of ArcGIS was used. Based on the criteria outlined in Table 3, the factors associated with rural human settlements, encompassing driving force, pressure, state, impact, response, and overall resilience levels of the 115 counties and districts in Guangdong Province, were classified into three levels: low, medium, and high. The outcomes are depicted in Table 3.

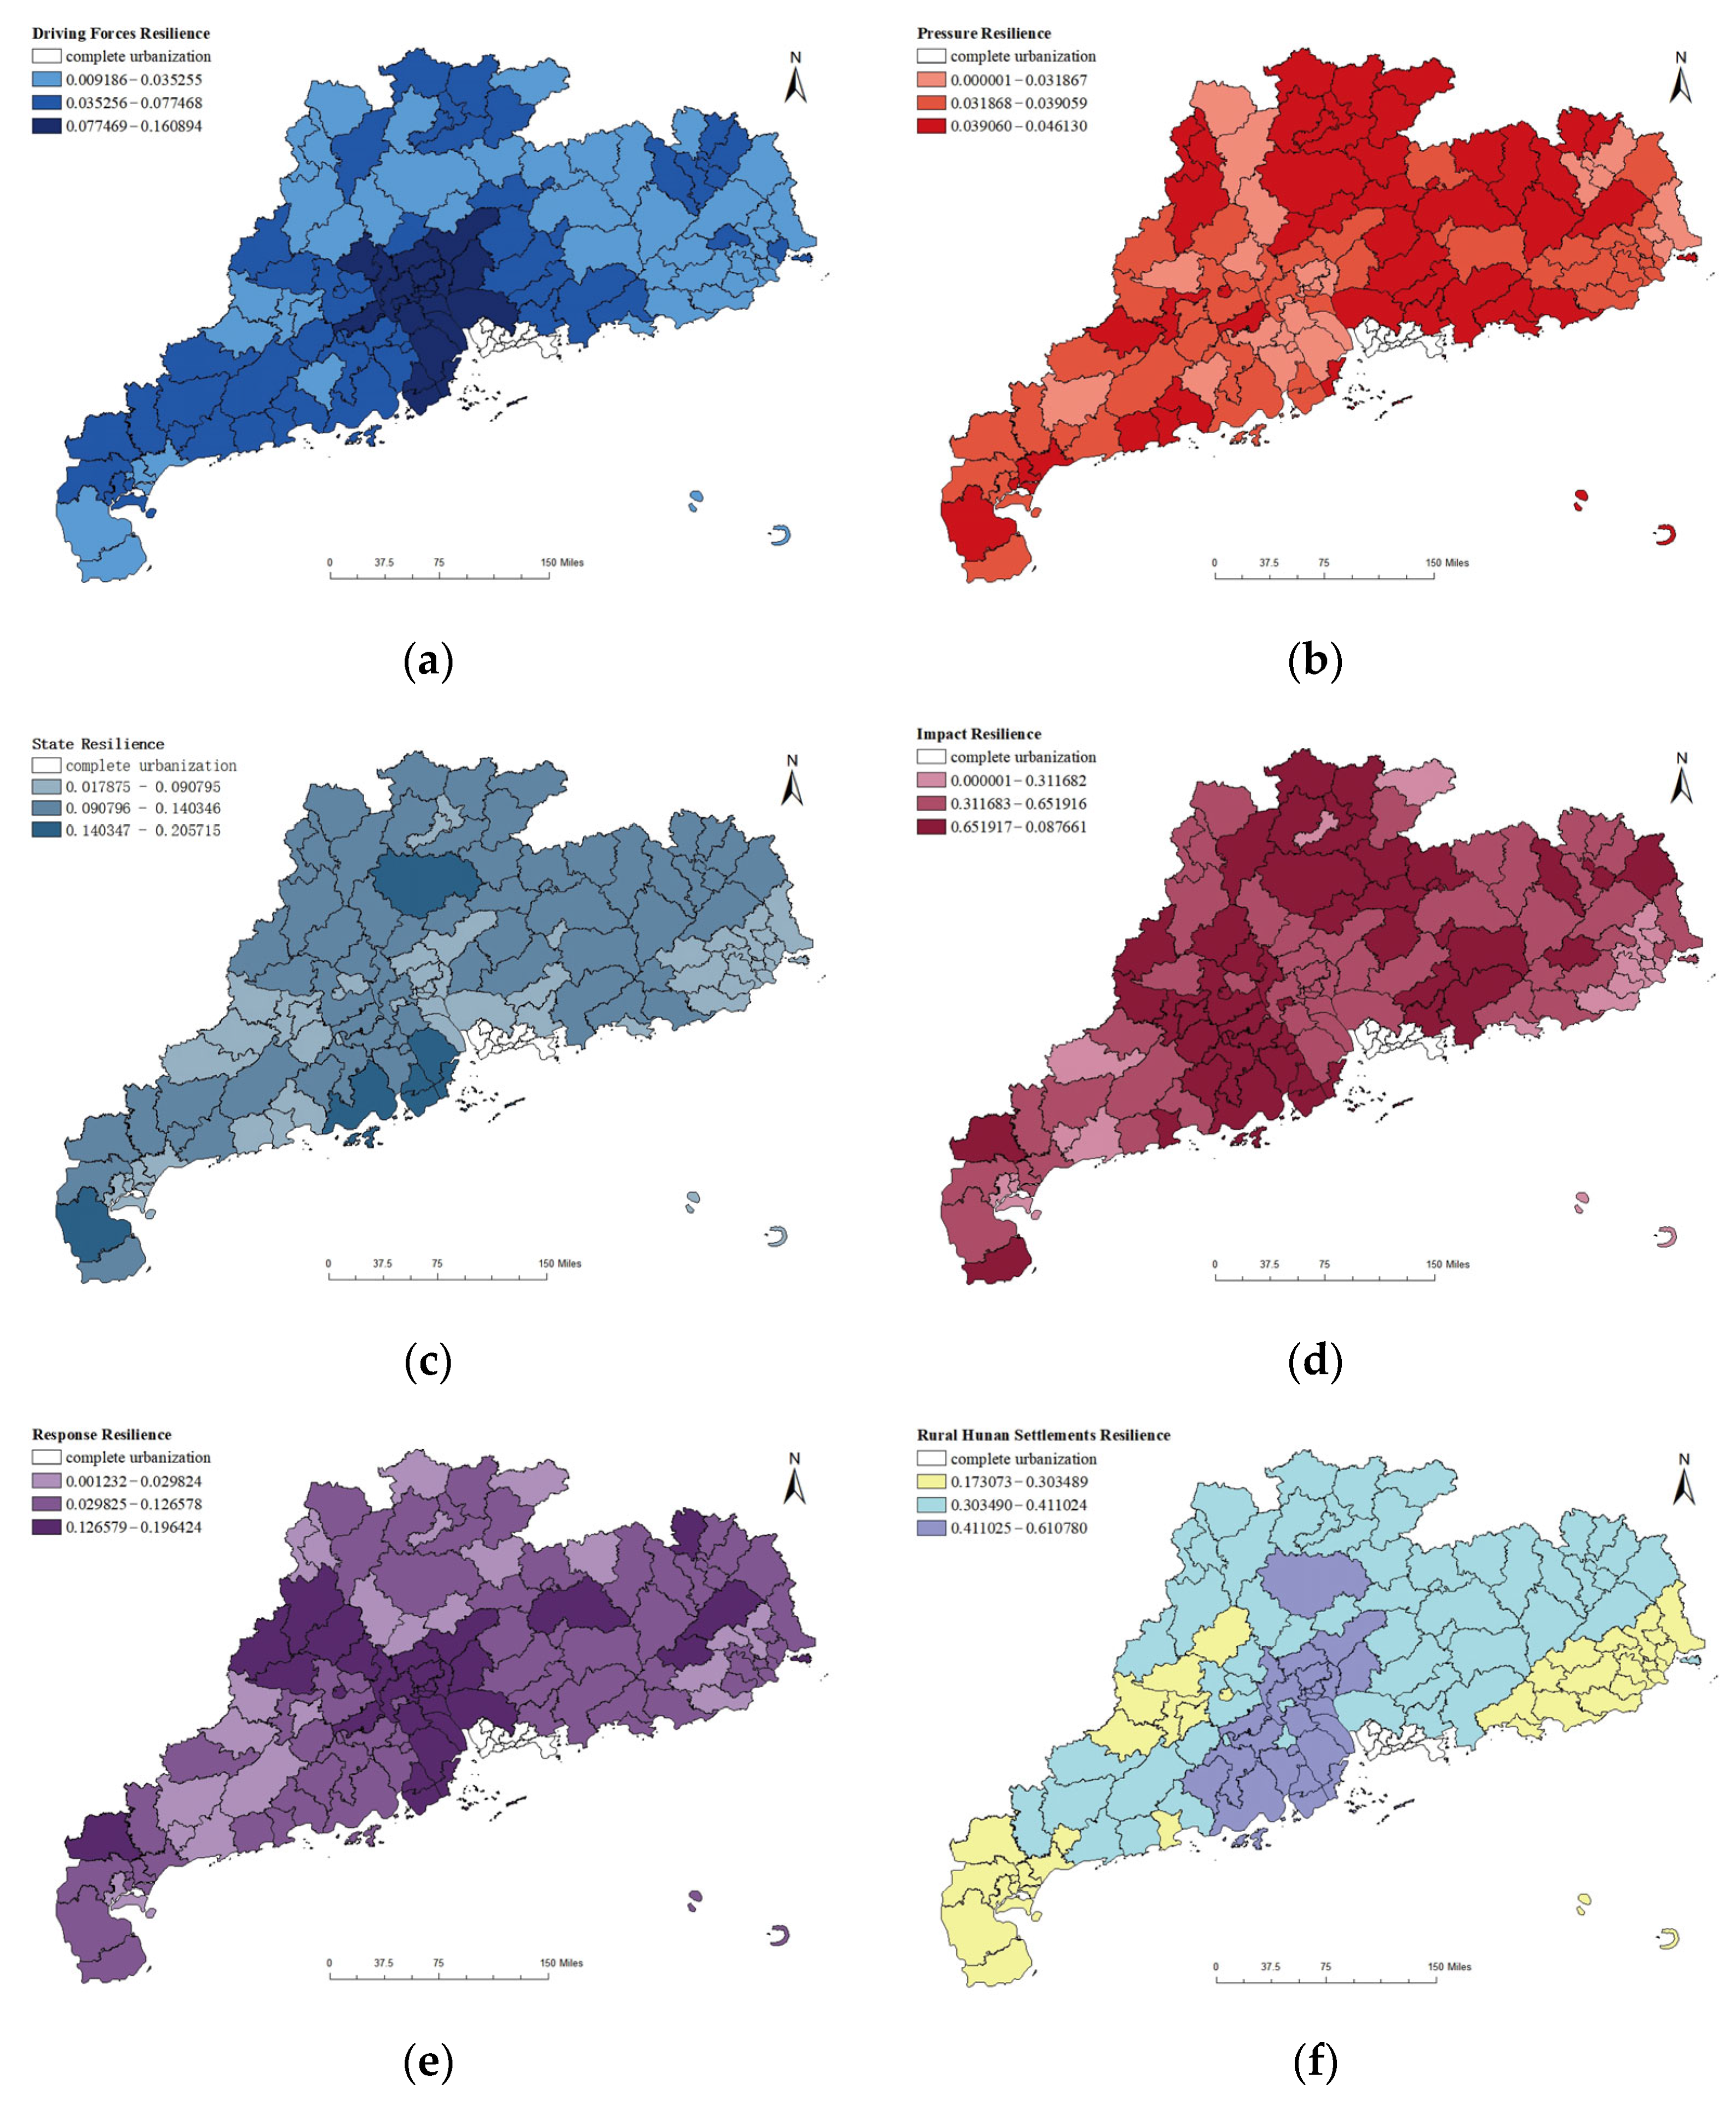
4.2.1. Spatial Distribution Characteristics of Driving Force Resilience

The resilience of rural human settlements in Guangdong, concerning driving force, spans from 0.0092 to 0.1609, with an average of 0.0507. Approximately 67.57% of the counties and districts (75 in total) exhibit driving force resilience for rural human settlements equal to or lower than the average. The driving force indicators primarily mirror the regional agricultural productivity and economic development level. As indicated by the spatial distribution in Figure 4a, the overall driving force resilience in Guangdong Province is relatively low. Based on practical analysis, the Pearl River Delta region demonstrates higher driving force resilience, attributed to its high level of openness, concentration of production resources, and robust collective rural economy, resulting in the highest level of agricultural economic development. Western Guangdong, benefiting from its natural resource advantages in the agriculture and marine industries, follows as the second-highest in agricultural economic development. Conversely, Northern Guangdong and Eastern Guangdong, characterized by mountainous and hilly terrain, exhibit a relatively lower level of agricultural development, resulting in a lower level of driving force resilience.

4.2.2. Spatial Distribution Characteristics of Pressure Resilience

The resilience of rural human settlements of Guangdong, in terms of pressure, ranges from 0.0178 to 0.0461, with an average of 0.0372. Approximately 59.46% of the counties and districts (66 in total) exhibit pressure resilience for rural human settlements equal to or higher than the average. Recognizing that relying solely on driving force indicators cannot fully depict the level of resilience, pressure indicators, which reflect the impact of human activities on human settlements, are considered. This includes the ecological perspective of the efficiency of agricultural economic development. As depicted in the spatial distribution in Figure 4b, with the exceptions of Dongguan and Huizhou, most cities in the Pearl River Delta have lower scores and rank lower. The rural residents in the Pearl River Delta region are relatively active, with significant energy consumption in production and daily life. Therefore, they exert relatively high pressure on the rural human settlements, resulting in lower agricultural development efficiency compared to Eastern Guangdong, Western Guangdong, and Northern Guangdong.

4.2.3. Spatial Distribution Characteristics of State Resilience

The resilience of rural human settlements in Guangdong, in terms of state, ranges from 0.0336 to 0.2057, with an average of 0.0980. Approximately 46.87% of the counties and districts (52 in total) exhibit state resilience for rural human settlements equal to or lower than the average. The state indicators reflect the comprehensive level of rural resources, encompassing ecological and human resources. Examining the spatial distribution in Figure 4c, it can be observed that most counties and districts in the Northern Guangdong region and the Pearl River Delta region rank higher. This is as they primarily benefit from a favorable natural environment and abundant resource endowments in these regions.

4.2.4. Spatial Distribution Characteristics of Impact Resilience

The impact resilience of rural human settlements in Guangdong ranges from 0.0156 to 0.1139, with an average of 0.0697. Approximately 45.95% of the counties and districts (51 in total) exhibit impact resilience for rural human settlements equal to or lower than the average. A higher score in the impact indicators implies that the residents can enjoy higher-quality public service supply. Examining the spatial distribution in Figure 4d, it can be observed that the Pearl River Delta, Northern Guangdong, and Western Guangdong have significantly higher scores than Eastern Guangdong, indicating that there is considerable room for improvement in public services in Eastern Guangdong.

4.2.5. Spatial Distribution Characteristics of Response Resilience

The response resilience of rural human settlements in Guangdong ranges from 0.0370 to 0.2148, with an average of 0.1406. Approximately 59.46% of the counties and districts (66 in total) exhibit a response resilience equal to or below the average. The response indicator reflects the action intensity and final effectiveness of various participants in the process of rural human settlements’ improvement. From Figure 4e, it can be observed that the Pearl River Delta benefits from a relatively solid economic foundation, exhibiting higher response resilience, indicating that there is a scale effect in the investment in rural human settlements improvement, where a larger investment scale corresponds to a higher level of response resilience.

4.2.6. Spatial Distribution Characteristics of Rural Human Settlements’ Resilience

From Figure 4f, it can be observed that the overall resilience of rural human settlements in the 115 counties and districts of Guangdong is relatively low, with an index ranging from 0.1731 to 0.6108 and an average of 0.3473. Only three counties and districts have an index above 0.6 (equivalent to 60 points on a percentage scale). The high-level counties and districts are relatively concentrated, mainly in the Pearl River Delta, including cities such as Zhuhai, Guangzhou, Jiangmen, and Foshan. On the other hand, low-level counties and districts are mainly concentrated in Western Guangdong and Eastern Guangdong, including cities like Zhanjiang and Jieyang. It is evident that, despite Guangdong Province’s relatively robust economic foundation, the rural human settlements’ resilience does not exhibit a positive correlation with the level of economic development. In practice, governmental attention and investment offer robust support for enhancing the quality of rural human settlements. However, the political and social ecology, characterized by “strong government, weak society”, lacks the internal dynamics to improve the rural living environment. This deficiency leads to a lack of sustainable development capacity, consequently resulting in an overall low resilience level.

4.3. The Spatial Differences of Factors Affecting the Rural Human Settlements Resilience

Furthermore, this study employed ArcGIS to conduct a spatial autocorrelation analysis of the rural human settlements resilience in the 115 counties and districts of Guangdong in 2020. Table 4 presents the Moran I index for the spatial autocorrelation of rural human settlements’ resilience, along with the Moran I indices for the dimensions of driving force, pressure, state, impact, and response. At the 1% confidence level, the Moran I indices for rural human settlements’ resilience and its dimensions all exhibit significant positive values, indicating a pronounced spatial clustering effect for these indices.
According to Equation (8), this study analyzed the spatial variations in the impact of resilience in each dimension on the overall resilience of rural human settlements. The robustness of the model is presented in Table 5. The R-squared values for driving force resilience, pressure resilience, state resilience, influence resilience, and response resilience are all greater than 0.6, indicating that the estimated results effectively reflect the statistical relationships among the variables.

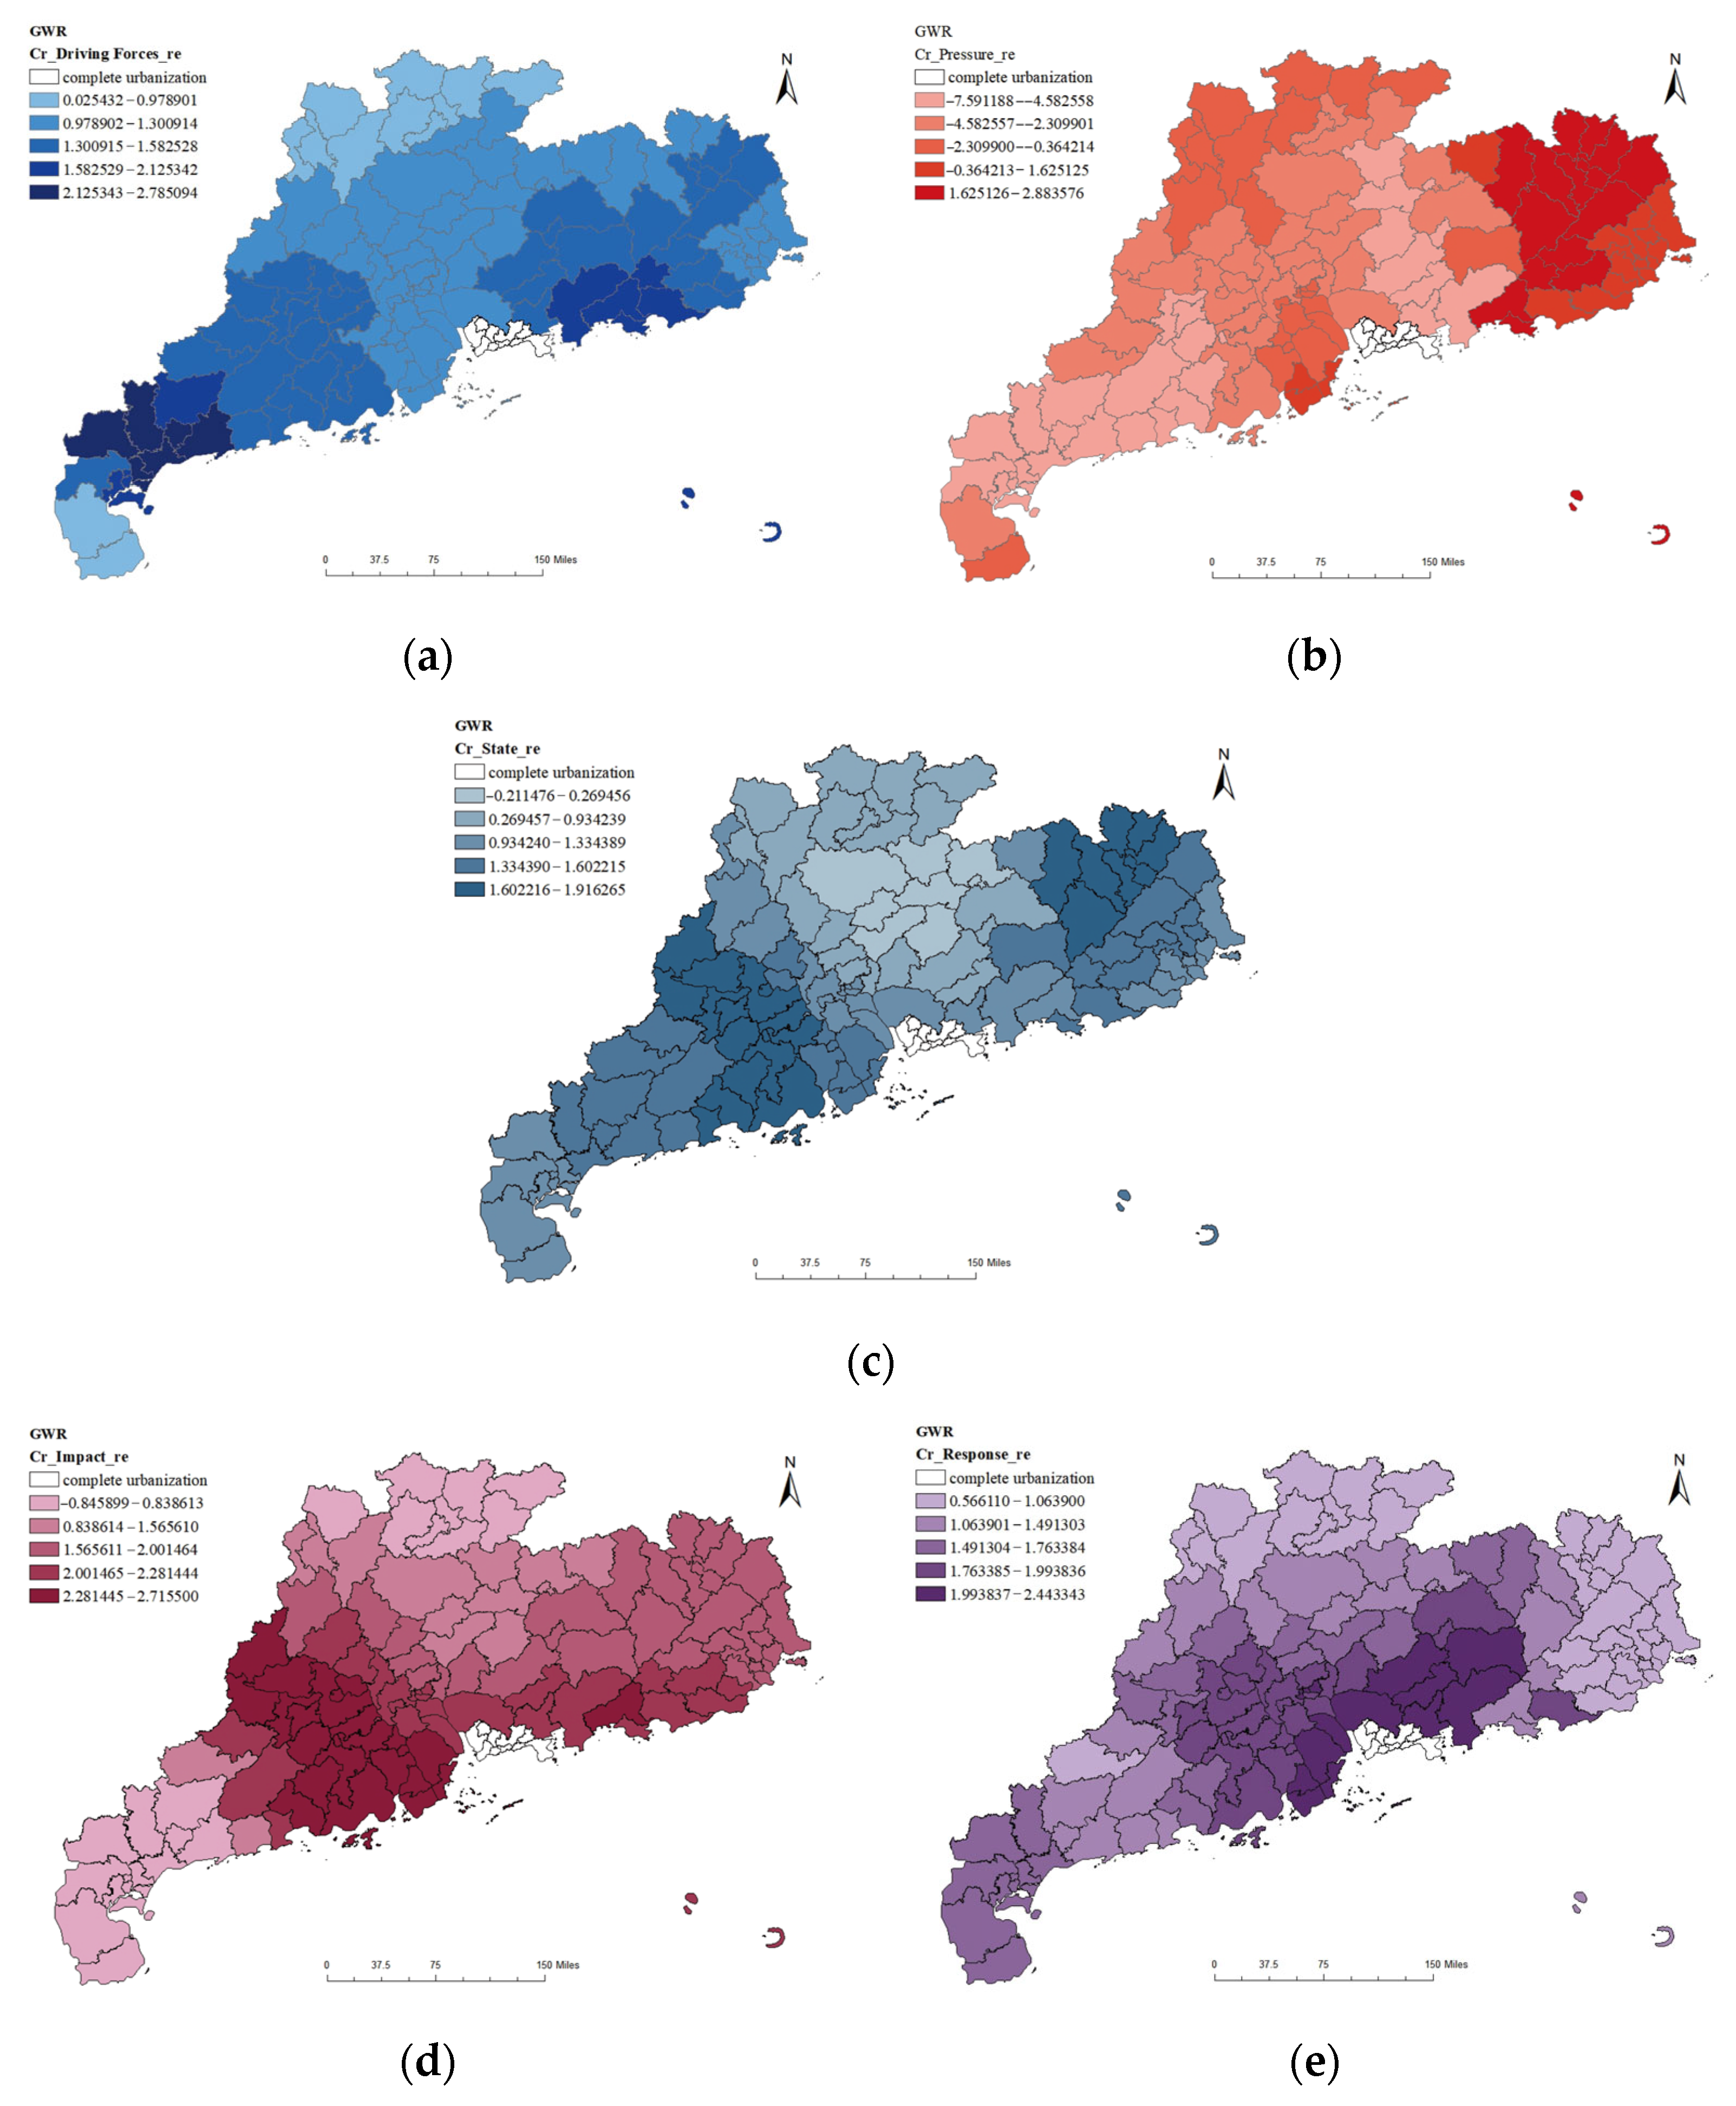
4.3.1. Spatial Distribution Characteristics of the Coefficient of Driving Force Resilience

Figure 5a displays the spatial distribution of the impact of driving force resilience on the resilience of rural human settlements in Guangdong. The coefficient of driving force resilience is significantly positive, with a mean value of 1.34. Examining specific indicators, this suggests that elevating rural residents’ income levels and improving agricultural production efficiency contribute to enhancing the resilience of rural human settlements. Economic development is the primary need in rural areas and the core driving force for implementing improvements in rural human settlements. The higher the income of farmers, the more resilient their livelihoods are when facing sudden events such as natural disasters, enabling a rapid recovery of rural human settlements after encountering shocks. Geospatially, regions with higher coefficients of driving force resilience are concentrated in the western, and some eastern, parts of Guangdong. The spatial distribution pattern is relatively concentrated, indicating that the positive impact of driving force resilience on the resilience of rural human settlements is more pronounced in Western Guangdong and Eastern Guangdong compared to other areas. Unlike the Pearl River Delta, rural residents in Western and Eastern Guangdong have lower incomes and less robust foundations for agricultural development. This results in a greater marginal impact of driving forces on the rural human settlements’ resilience.

4.3.2. Spatial Distribution Characteristics of the Coefficient of Pressure Resilience

In Figure 5b, the coefficient of pressure resilience consistently exhibits significance and negativity, with an average value of −2.10. This suggests that pressure resilience has a significantly negative impact on the resilience of rural human settlements. Considering specific indicators, a lower pressure resilience implies that the production and daily activities of rural residents exert greater pressure on rural human settlements [43]. From a spatial perspective, pressure resilience decreases from east to west, and the spatial distribution pattern is relatively concentrated. Regions with lower pressure coefficients are mainly concentrated in Western Guangdong. Guangdong Province witnesses substantial fertilizer and pesticide use in agriculture, with per-unit usage once ranking among the highest globally, causing soil and water pollution. While the agriculture in Western Guangdong is developed, the negative impact of pressure resilience on the ecological environment cannot be underestimated. Therefore, the negative influence of pressure resilience in Western Guangdong on the rural human settlements’ resilience surpasses that of other areas.

4.3.3. Spatial Distribution Characteristics of the Coefficient of State Resilience

In Figure 5c, the coefficient of state resilience is consistently significant and positive, with an average value of 1.21. This indicates that state resilience has a significant positive impact on the resilience of rural human settlements. State resilience primarily characterizes the ecological resource endowment of rural human settlements in the region. A robust state resilience implies higher buffering capacity, which helps absorb and mitigate impacts from both internal and external sources, maintaining system stability. Spatially, the state resilience coefficient shows a trend of being lower in the central and northern parts and higher in the eastern and western parts, with a relatively concentrated spatial distribution. This suggests that the positive impact of state resilience on the resilience of rural human settlements in Northern Guangdong is lower than in other regions. As the green ecological barrier of Guangdong, Northern Guangdong possesses a more advantageous natural resource endowment, resulting in a lower marginal effect of state resilience compared to other areas.

4.3.4. Spatial Distribution Characteristics of the Coefficient of Impact Resilience

In Figure 5d, the coefficient of impact resilience is consistently significant and positive, with an average value of 1.63. This indicates that impact resilience significantly and positively influences the resilience of rural human settlements. High impact resilience implies better provision of public services and living conditions, contributing to the overall quality and self-organizational capacity of rural residents. Spatially, the impact resilience coefficient shows a lower trend in Western Guangdong, Northern Guangdong, and Eastern Guangdong, while it is higher in the Pearl River Delta. The spatial distribution is relatively concentrated, signifying that the impact resilience in the Pearl River Delta has a more substantial impact compared to other areas. The Pearl River Delta boasts a developed industrial economy and high openness, attracting a significant number of mobile populations. With a population density much higher than the national average, it is more sensitive to the supply of public services such as healthcare and education.

4.3.5. Spatial Distribution Characteristics of the Coefficient of Response Resilience

In Figure 5e, the coefficients of response resilience are consistently positive, with an average value of 1.46. This indicates a significant positive impact of response resilience on the resilience of rural human settlements. Regions with higher response resilience implement more effective and substantial measures in rural human settlements’ improvement, facilitating swift recovery after facing disturbances. Spatially, the Pearl River Delta exhibits higher coefficients of response resilience, and the spatial distribution is relatively concentrated. The Pearl River Delta benefits from a strong economic development foundation, leading to larger financial investments in rural human settlements’ improvement. Consequently, the corresponding impact of response resilience is also more pronounced.

5. Discussion

Rural human settlement systems face susceptibility to diverse events, including urban–rural integration, industrialization, and natural disasters. Due to the prolonged urban development bias in Guangdong, the overall level of rural human settlements remains relatively low. Resilience theory provides a meaningful and practical analytical perspective and method to enhance the systemic resilience, aiming to improve rural human settlements. Considering these findings, three recommendations are proposed to continually strengthen the resilience of rural human settlements:
Firstly, embrace the concept of green development, innovate the transformation of ecological resources into economic value, and stimulate the endogenous dynamics of rural human settlements’ improvement. The government should increase guidance and investment in rural green industries, prioritizing ecological benefits, reducing the pressure of human production activities, promoting the scale operation of agriculture, focusing on characteristic projects and industrial chains to enhance economic efficiency, improving the income of rural residents, and fostering rural residents’ enthusiasm and initiative to enhance the quality of human settlements [44]. Efforts should be made to reduce the pollution caused by rural residents’ production and daily life, improve environmental quality, and enhance residents’ health. Furthermore, it is necessary to actively promote clean, low-carbon, and efficient use of energy, improve carbon emission efficiency, and optimize traditional rural production and lifestyles with high energy consumption and carbon emissions.
Secondly, the government should intensify investment in social security and infrastructure construction [45] and specifically strengthen public infrastructure construction and public service supply in Eastern Guangdong, Western Guangdong, and Northern Guangdong to enhance the ability of rural human settlements to withstand risks and shocks, enabling rapid recovery. Furthermore, governments should broaden the reach of social security, encompassing medical care and agricultural subsidies, to consistently enhance the livelihood resilience of rural residents [46]. Additionally, improving the learning and innovation capabilities of the system helps disrupt the current equilibrium, facilitating development and progression towards an optimal state. Therefore, offering higher-quality education and public services, while elevating the knowledge and cultural proficiency of rural residents, contributes to the evolutionary improvement of rural human settlements’ resilience.
Thirdly, the government should persist in advancing digital rural development and raising the standard of intelligent and sophisticated improvement. They should also leverage digital technology to empower management innovations and technological applications, enabling 24/7 risk monitoring, early warning systems, rapid responses, and collaborative efforts among multiple stakeholders. This approach will furnish technical support for fortifying the resilience of rural human settlements [47].
This study has several limitations. The study sample is based on county-level regions, and despite the substantial volume of data, the exclusion of certain counties and districts in China due to validity issues may impact the generalizability of the findings. Panel data were not employed as the research project was initiated in 2020. The analysis predominantly centered on macro variables, overlooking the examination of the influence of micro variables. In the future, our research could be expanded in two key aspects. Firstly, there is potential for further collection of time-series data to facilitate spatiotemporal analysis. Secondly, we can explore the incorporation of additional variables from diverse perspectives, enabling a more comprehensive and multidimensional analysis of issues related to rural human settlements’ resilience.

6. Conclusions

Based on sample data of rural human settlements in 115 counties and districts in Guangdong Province in 2020, the resilience of rural human settlements was calculated using the DPSIR model and entropy method. The Geographically Weighted Regression (GWR) model was employed to analyze the spatial differences in the influencing factors of rural human settlements. The conclusions drawn from this comprehensive analysis are as follows:
Firstly, the overall resilience of rural human settlements in Guangdong Province is relatively low, with a concentrated spatial distribution. The resilience level is significantly higher in the Pearl River Delta compared to other areas, followed by Northern Guangdong. Conversely, regions with lower resilience are predominantly concentrated in Western Guangdong and Eastern Guangdong. Additionally, a noticeable spatial clustering effect is observed for the resilience dimensions of driving force (D), pressure (P), state (S), impact (I), and response (R).
Secondly, notable spatial differences exist in the distribution of influencing factors across different dimensions of rural human settlements’ resilience. The driving force resilience is low and concentrated, pressure resilience is low and relatively dispersed, state resilience is high and relatively dispersed, impact resilience is high and concentrated, and response resilience is high and concentrated.
Thirdly, different influencing factors exhibit varied effects on the resilience of rural human settlements, and there are significant spatial variations in the coefficients of these factors. The coefficients of driving force resilience are all significantly positive, with higher values in Western Guangdong and Eastern Guangdong, indicating that the positive impact of driving force resilience in these regions is higher than in other areas. The coefficients of pressure resilience are all significantly negative, showing a decreasing spatial distribution from east to west, indicating that the negative impact of pressure resilience in Western Guangdong is higher than in other areas. The coefficients of state resilience show an overall positive correlation, with a trend of lower values in the central and northern parts and higher values in the eastern and western parts, indicating that the positive impact of state resilience in Northern Guangdong is lower than in other areas. The coefficients of impact resilience are generally significantly positive, with higher values in the Pearl River Delta, indicating that the positive impact of impact resilience in the Pearl River Delta is higher than in other areas. The coefficients of response resilience are generally positive, with higher values mainly distributed in the Pearl River Delta, indicating that the positive impact of response resilience in the Pearl River Delta is higher than in other areas.

Author Contributions

Writing—original draft preparation and writing—review and editing, X.C.; conceptualization and validation, S.L.; investigation and formal analysis, F.R. All authors have read and agreed to the published version of the manuscript.

Funding

This research was funded by the National Social Science Foundation of China under Grant 21AGL027.

Institutional Review Board Statement

Not applicable.

Informed Consent Statement

Not applicable.

Data Availability Statement

Data are contained within the article.

Conflicts of Interest

The authors declare no conflicts of interest.

References

  1. Lin, S.; Hou, L. SDGs-oriented evaluation of the sustainability of rural human settlement environment in Zhejiang, China. Heliyon 2023, 9, e13492. [Google Scholar] [CrossRef] [PubMed]
  2. Hu, Q.; Wang, C. Quality evaluation and division of regional types of rural human settlements in China. Habitat Int. 2020, 105, 102278. [Google Scholar] [CrossRef]
  3. Liao, L.; Du, M.; Chen, Z. Environmental pollution and socioeconomic health inequality: Evidence from China. Sustain. Cities Soc. 2023, 95, 104579. [Google Scholar] [CrossRef]
  4. Shi, J.; Yang, X. Sustainable Development Levels and Influence Factors in Rural China Based on Rural Revitalization Strategy. Sustainability 2022, 14, 8908. [Google Scholar] [CrossRef]
  5. Li, X.; Yu, B.; Cui, J.; Zhu, Y. Building a New Framework for Evaluating the Livability of Living Space on the Basis of the Daily Activities of Rural Residents: A Case Study of Jianghan Plain. Int. J. Environ. Res. Public Health 2022, 19, 10615. [Google Scholar] [CrossRef]
  6. Zhang, K.H.; Song, S. Rural-urban migration and urbanization in China: Evidence from time-series and cross-section analyses. China Econ. Rev. 2003, 14, 386–400. [Google Scholar] [CrossRef]
  7. Wang, H.; Zhuo, Y. The Necessary Way for the Development of China’s Rural Areas in the New Era-Rural Revitalization Strategy. Open J. Soc. Sci. 2018, 6, 97–106. [Google Scholar] [CrossRef]
  8. Liu, Q.; Gong, D.; Gong, Y. Index system of rural human settlement in rural revitalization under the perspective of China. Sci. Rep. 2022, 12, 10586. [Google Scholar] [CrossRef]
  9. Du, M.; Wu, F.; Ye, D.; Zhao, Y.; Liao, L. Exploring the effects of energy quota trading policy on carbon emission efficiency: Quasi-experimental evidence from China. Energy Econ. 2023, 124, 106791. [Google Scholar] [CrossRef]
  10. Folke, C.; Carpenter, S.R.; Walker, B. Resilience thinking: Integrating resilience, adaptability and transformability. Ecol. Soc. 2010, 15, 20. [Google Scholar] [CrossRef]
  11. Holling, C.S. Resilience and Stability of Ecological Systems. Annu. Rev. Ecol. Syst. 1973, 4, 1–23. [Google Scholar] [CrossRef]
  12. Timpane-Padgham, B.L.; Beechie, T.; Klinger, T. A systematic review of ecological attributes that confer resilience to climate change in environmental restoration. PLoS ONE 2017, 12, e0173812. [Google Scholar] [CrossRef] [PubMed]
  13. Roberts, C.P.; Twidwell, D.; Angeler, D.G.; Allen, C.R. How do ecological resilience metrics relate to community stability and collapse? Ecol. Indic. 2019, 107, 105552. [Google Scholar] [CrossRef]
  14. Holling, C.S.; Gunderson, L.H. Panarchy: Understanding Transformations in Human and Natural Systems; Island Press: Washington, DC, USA, 2002. [Google Scholar]
  15. Holling, C.S. Engineering resilience versus ecological resilience. In Engineering within Ecological Constraints; National Academy Press: Washington, DC, USA, 1996; p. 31. [Google Scholar]
  16. Ma, L.; Tao, T.; Li, Z.; Wu, S.; Zhang, W. Study on spatial divergence of rural resilience and optimal governance paths in oasis: The case of Yongchang County in the Hexi Corridor of China. Environ. Dev. Sustain. 2023, 168, 116–122. [Google Scholar] [CrossRef]
  17. Walker, B.; Holling, C.S.; Carpenter, S.R.; Kinzig, A. Resilience, Adaptability and Transformability in Social-ecological Systems. Ecol. Soc. 2004, 9, 2. [Google Scholar] [CrossRef]
  18. Cumming, G.S. Introducing Spatial Resilience. In Spatial Resilience in Social-Ecological Systems; Springer: Dordrecht, The Netherlands, 2011; pp. 1–5. [Google Scholar] [CrossRef]
  19. Zhang, Y.; Yang, Y.; Chen, Z.; Zhang, S. Multi-criteria assessment of the resilience of ecological function areas in China with a focus on ecological restoration. Ecol. Indic. 2020, 119, 106862. [Google Scholar] [CrossRef]
  20. Windle, G. What is resilience? A review and concept analysis. Rev. Clin. Gerontol. 2011, 21, 152. [Google Scholar] [CrossRef]
  21. Zhang, Y.; Xie, X.; Qiu, X. Study on Livelihood Resilience of Rural Residents under the Rural Revitalization Strategy in Ethnic Areas of Western Sichuan, China. Agriculture 2023, 13, 1957. [Google Scholar] [CrossRef]
  22. Tian, Q.; Guo, L.; Zheng, L. Urbanization and Rural Livelihoods: A Case Study from Jiangxi Province, China. J. Rural Stud. 2016, 47, 577–587. [Google Scholar] [CrossRef]
  23. Marschke, M.; Berkes, F. Exploring Strategies That Build Livelihood Resilience: A Case from Cambodia. Ecol. Soc. 2006, 11, 42. [Google Scholar] [CrossRef]
  24. Yang, X.; Li, X.; Lu, K.; Peng, Z. Integrating Rural Livelihood Resilience and Sustainability for Post-Disaster Community Relocation: A Theoretical Framework and Empirical Study. Nat. Hazards 2022, 116, 1775–1803. [Google Scholar] [CrossRef]
  25. Zhou, J.; Hou, Q. Resilience assessment and planning of suburban rural settlements based on complex network. Sustain. Prod. Consum. 2021, 28, 1645–1662. [Google Scholar] [CrossRef]
  26. Sun, Y.; Zhai, B.; Saierjiang, H.; Chang, H. Disaster adaptation evolution and resilience mechanisms of traditional rural settlement landscape in Xinjiang, China. Int. J. Disaster Risk Reduct. 2022, 73, 102869. [Google Scholar] [CrossRef]
  27. Khezri, S.; Dehrashid, A.A.; Bijani, M.; Valizadeh, N.; Nasrollahizadeh, B.; Izadi, F.; Dehrashid, H.A.; Azadi, H.; Scheffran, J. Resilience of human settlements against landslide risk: The case of Kurdistan Province, Iran. Land Degrad. Dev. 2021, 32, 5360–5377. [Google Scholar] [CrossRef]
  28. Jurjonas, M.; Seekamp, E. Rural coastal community resilience: Assessing a framework in eastern North Carolina. Ocean Coast. Manag. 2018, 162, 137–150. [Google Scholar] [CrossRef]
  29. Yang, M.; Jiao, M.; Zhang, J. Spatio-Temporal Analysis and Influencing Factors of Rural Resilience from the Perspective of Sustainable Rural Development. Int. J. Environ. Res. Public Health 2022, 19, 12294. [Google Scholar] [CrossRef] [PubMed]
  30. Zhao, X.; Sun, H.; Chen, B.; Xia, X.; Li, P. China’s rural human settlements: Qualitative evaluation, quantitative analysis and policy implications. Ecol. Indic. 2019, 105, 398–405. [Google Scholar] [CrossRef]
  31. Janssen, M.A.; Bodin, Ö.; Anderies, J.M.; Elmqvist, T.; Ernstson, H.; McAllister, R.R.J.; Olsson, P.; Ryan, P. Toward a network perspective of the study of resilience in social-ecological systems. Ecol. Soc. 2006, 11, 15. [Google Scholar] [CrossRef]
  32. Chen, M.; Jiang, Y.; Wang, E.; Wang, Y.; Zhang, J. Measuring urban infrastructure resilience via pressure-state-response framework in four Chinese municipalities. Appl. Sci. 2022, 12, 2819. [Google Scholar] [CrossRef]
  33. Zhang, Y.; Chen, Z.; Tang, B.; Sun, H. Analysis of spatio-temporal characteristics of urban economic resilience and influencing factors in Guangdong-Hong Kong-Macao Greater Bay Area. Front. Public Health 2022, 10, 922096. [Google Scholar] [CrossRef]
  34. Ghasemi, S.; Javid, A.H.; Farsad, F.; Robati, M.; Farshchi, P. An evaluation of the marine environmental resilience to the north of Qeshm Island. Environ. Monit. Assess. 2021, 193, 859. [Google Scholar] [CrossRef] [PubMed]
  35. Da Costa Silva, G. Climate change and the water–energy nexus: An urban challenge. J. Water Clim. Chang. 2014, 5, 259–275. [Google Scholar] [CrossRef]
  36. Nathwani, J.; Lu, X.; Wu, C.; Fu, G.; Qin, X. Quantifying security and resilience of Chinese coastal urban ecosystems. Sci. Total Environ. 2019, 672, 51–60. [Google Scholar] [CrossRef]
  37. Xie, X.; Zhou, G.; Yu, S. Study on Rural Ecological Resilience Measurement and Optimization Strategy Based on PSR-“Taking Weiyuan in Gansu Province as an Example”. Sustainability 2023, 15, 5462. [Google Scholar] [CrossRef]
  38. Zhou, J.; Hou, Q.; Dong, W. Spatial Characteristics of Population Activities in Suburban Villages Based on Cellphone Signaling Analysis. Sustainability 2019, 11, 2159. [Google Scholar] [CrossRef]
  39. Zhao, R.; Fang, C.; Liu, H. Evaluating urban ecosystem resilience using the DPSIR framework and the ENA model: A case study of 35 cities in China. Sustain. Cities Soc. 2021, 72, 102997. [Google Scholar] [CrossRef]
  40. Zhong, Q.; Chen, Y.; Yan, J. Comprehensive evaluation of community human settlement resilience and spatial characteristics based on the supply–demand mismatch between health activities and environment: A case study of downtown Shanghai, China. Glob. Health 2023, 19, 87. [Google Scholar] [CrossRef]
  41. Dong, X.; Shi, T.; Zhang, W.; Zhou, Q. Temporal and Spatial Differences in the Resilience of Smart Cities and Their Influencing Factors: Evidence from Non-Provincial Cities in China. Sustainability 2020, 12, 1321. [Google Scholar] [CrossRef]
  42. Allen, C.R.; Angeler, D.G.; Cumming, G.S.; Folke, C.; Twidwell, D.; Uden, D.R. Quantifying spatial resilience. J. Appl. Ecol. 2016, 53, 625–635. [Google Scholar] [CrossRef]
  43. Wang, C.; Ren, M.; Li, H.; Zhu, Y. Understanding the Rural Production Space System: A Case Study in Jiangjin, China. Sustainability 2019, 11, 2811. [Google Scholar] [CrossRef]
  44. Fang, Y.; Zhu, F.; Qiu, X. Effects of natural disasters on livelihood resilience of rural residents in Sichuan. Habitat Int. 2018, 76, 19–28. [Google Scholar] [CrossRef]
  45. Hamilton, M.C.; Thekdi, S.A.; Jenicek, E.M. Case studies of scenario analysis for adaptive management of natural resource and infrastructure systems. Environ. Syst. Decis. 2013, 33, 89–103. [Google Scholar] [CrossRef]
  46. He, R.; Guo, S.; Deng, X.; Zhou, K. Influence of Social Capital on the Livelihood Strategies of Farmers under China’s Rural Revitalization Strategy in Poor Mountain Areas: A Case Study of the Liangshan Yi Autonomous Prefecture. J. Mt. Sci. 2022, 19, 958–973. [Google Scholar] [CrossRef]
  47. Wang, C.; Zhang, T.; Xu, W.; Ruan, H.; Tang, J. Social Capital, Technological Empowerment, and Resilience in Rural China. Int. J. Environ. Res. Public Health 2021, 18, 11883. [Google Scholar] [CrossRef]
Figure 1. DPSIR model construction framework of “Driving Force-Pressure-State-Impact-Response” [40].
Sustainability 16 00813 g001
Figure 2. Results of Pearson correlation coefficient analysis for rural human settlements’ resilience indicators.
Sustainability 16 00813 g002
Figure 3. Regional division of Guangdong Province.
Sustainability 16 00813 g003
Figure 4. (a) Spatial distribution characteristics of driving force resilience; (b) spatial distribution characteristics of pressure resilience; (c) spatial distribution characteristics of state resilience; (d) spatial distribution characteristics of impact resilience; (e) spatial distribution characteristics of response resilience; (f) spatial distribution characteristics of rural human settlements’ resilience.
Sustainability 16 00813 g004
Figure 5. (a) Coefficient spatial distribution of driving force resilience index; (b) coefficient spatial distribution of pressure resilience index; (c) coefficient spatial distribution of state resilience index; (d) coefficient spatial distribution of impact resilience index; (e) coefficient spatial distribution of response resilience index.
Sustainability 16 00813 g005
Table 1. Evaluation indicators library of rural human settlements’ resilience.
DimensionTypeIndicatorsDefinition and Interpretation
Driving Force
(D)
Economic DevelopmentPer capita disposable income of rural residents (D1)Rural residents’ income level
Per capita output value of agriculture, forestry, animal husbandry, and fishery (D2)Agricultural productivity indicators
Social DevelopmentNatural population growth rate (D3)Rate of population development
Pressure (P)Resource ConsumptionPer capita electricity consumption (P1)Electricity resource consumption intensity
Per capita daily water consumption (P2)Water resource consumption intensity
Environmental PollutionFertilizer application intensity (P3)Impact of fertilizers on land
Pesticide application intensity (P4)Impact of pesticide on land
State
(S)
State of Ecological ResourcesRural greening rate (S1)Green coverage of rural human settlements
State of Productive ResourcesPer capita cultivated land (S2)Cultivated land resource level
Per capita construction land (S3)Construction land resources level
Number of permanent residents in a household (S4)Rural population density
Impact
(I)
Quality of LifeNumber of hospital beds per thousand people (I1)Bed density in healthcare institutions
Public Service SupplyAverage years of education in rural areas (I2)Level of education of rural residents
Response (R)Environmental ImprovementProportion of administrative villages for domestic sewage treatment (R1)Coverage of rural domestic sewage treatment
Proportion of harmless treatment of domestic waste (R2)Coverage of harmless treatment of rural domestic waste
Improve InvestmentWater supply penetration rate in villages (R3)Pure water supply coverage
Density of rural road network (R4)Construction status of highway facilities
Institutional GuaranteeCoverage of village planning and management (R5)Coverage of village scientific planning
Implementation of the red line for cultivated land (R6)Minimum value of land area under cultivation
Resource SavingWater-saving irrigation area (R7)Land area where water-saving irrigation technologies are applied
Table 2. Rural human settlements’ resilience evaluation indicators system.
Target LevelCriterion LevelIndicator LevelForward or
Reverse
Indicator WeightData Source
Rural Human Settlements ResilienceDriving Force
(D)
Per capita disposable income of rural residents (D1)+0.091Guangdong Rural Statistical Yearbook (2021)
Per capita output value of agriculture, forestry, animal husbandry, and fishery (D2)+0.098Guangdong Rural Statistical Yearbook (2021)
Pressure
(P)
Per capita electricity consumption (P1)0.015Guangdong Rural Statistical Yearbook (2021)
Per capita daily water consumption (P2)0.021Guangdong Statistical Yearbook (2021)
Fertilizer application intensity (P3)0.020Guangdong Rural Statistical Yearbook (2021)
Pesticide application intensity (P4)0.024Guangdong Rural Statistical Yearbook (2021)
State
(S)
Rural greening rate (S1)+0.071Guangdong Rural Statistical Yearbook (2021)
Per capita cultivated land (S2)+0.116Guangdong Rural Statistical Yearbook (2021)
Per capita construction land (S3)+0.158Guangdong Construction Yearbook (2021)
Number of permanent residents in a household (S4)+0.026Guangdong Rural Statistical Yearbook (2021)
Impact
(I)
Number of hospital beds per thousand people (I1)+0.059Guangdong Health Yearbook (2021)
Average years of education in rural areas (I2)+0.051Guangdong Health Yearbook (2021)
Response
(R)
Proportion of administrative villages for domestic sewage treatment (R1)+0.082Guangdong Rural Statistical Yearbook (2021)
Proportion of harmless treatment of domestic waste (R2)+0.043Guangdong Rural Statistical Yearbook (2021)
Water supply penetration rate in villages (R3)+0.037Guangdong Rural Statistical Yearbook (2021)
Coverage of village planning and management (R4)+0.061Guangdong Rural Statistical Yearbook (2021)
Density of rural road network (R5)+0.027Guangdong Construction Yearbook (2021)
Table 3. Rating criteria for resilience of rural human settlements.
Indices GradingDriving Force_rePressure_reState_reImpact_reResponse_reRural Human Settlements_re
Lower level0.0092–0.03530.0178–0.03190.0336–0.07980.0156–0.04480.0370–0.09450.2170–0.3405
Medium level0.0354–0.07750.0320–0.03910.0799–0.12370.0449–0.07930.0946–0.15140.3406–0.4722
Higher level0.0776–0.16090.0392–0.04610.1238–0.20570.0794–0.11390.1515–0.21480.4723–0.6680
Table 4. Moran I index of Rural human settlements’ resilience.
VariableRural Human Settlements_reDriving Force_rePressure_reState_reImpact_reResponse_re
Moran I0.85680.75350.28800.38060.61310.6825
Z score21.2709 **18.7810 **7.3388 **9.6176 **15.2102 **16.9744 **
Note: ** stand for significance at 1%.
Table 5. The estimated results of the Geographically Weighted Regression (GWR) model.
VariableR2AICcSigmaBandwidth
Cr_Driving Force_re0.778012−363.9730060.0442150.98121
Cr_Pressure_re0.715482−335.9064570.0501541.02808
Cr_State_re0.846307−402.7117130.0369520.98121
Cr_Impact_re0.665403−335.6585320.0516431.63761
Cr_Response_re0.826513−394.2826810.0387160.98121
Disclaimer/Publisher’s Note: The statements, opinions and data contained in all publications are solely those of the individual author(s) and contributor(s) and not of MDPI and/or the editor(s). MDPI and/or the editor(s) disclaim responsibility for any injury to people or property resulting from any ideas, methods, instructions or products referred to in the content.

