Abstract
The presence of artificial reefs (ARs) in the south of Portugal that were deployed a few decades ago and the corroboration of fishing patterns and other activities related to the use of these habitats have not been followed. It is important to note that monitoring the use of ARs was difficult in the past but is currently facilitated by the application of non-intrusive tools. In the present study, an approach is developed where, based on monitoring data from fishing and non-fishing boats, influence diagrams (IDs) are constructed to provide some evidence on fisheries or other use patterns and consequent AR effectiveness as coastal tools. These IDs allow us to infer various usefulness scenarios, namely catches, which are tangible, and satisfaction, which is intangible, and overall assessment of ARs and nearby areas in terms of human activities. After calibrating the Bayesian ID based on monitoring evidence, the obtained model was evaluated for several scenarios. In the base case, which assumes the occurrence of more fishing than recreation (assuming 3:1, respectively), the obtained utility is 18.64% (catches) and 31.96% (satisfaction). Of the scenarios run, the one that obtained the best results in the utility nodes together was the second one. The use of these tailored tools and approaches seems to be of fundamental importance for the adequate management of coastal infrastructures, particularly with regard to the inference of fishing resources and their sustainable use. An adequate interpretation based on the use of these tools implies being able to safeguard the ecological balance and economic sustainability of the communities operating in these areas.
1. Introduction
Pioneering structures that can now be called artificial reefs (ARs) were discovered by chance but had immediate utility to humans. An observed increase in fish (i.e., food production) was found in these artificial habitats due to the fortuitous existence of three-dimensional fish-aggregator structures [1,2]. For some decades now, there has been a decision to deploy artificial reefs on marine seabeds and lakes all over the world [3,4].
Reef placement is, however, not arbitrary and several documents regulating the placement of structures have also been created [5,6]. This reef placement is also very dependent on the regulations and legislation of the different countries that adopt this type of structure [1,7,8].
ARs are often thought to improve biodiversity in places devoid of three-dimensional structures, which are known to be aggregators of marine life, but also to allow people to know and enjoy these structures in their potential to create biodiversity [9]. There are many studies have demonstrated the usefulness of artificial reefs in biodiversity enhancement [10,11]. Some others have provided insight into ARs in the provision of various ecosystem services [12,13,14]. Activities such as scientific diving make it possible to demonstrate this type of improvement [15]. There are also experimental fishery studies that allow us to verify the usefulness of ARs in the production of commercial fish [16,17,18,19].
Concerning management, and particularly monitoring human use in reef areas—despite the growing interest in the 1990s regarding binomial MPAs and ARs [20], particularly in monitoring and evaluating the effectiveness of MPAs—there is, to date, a great lack of studies that address this issue systematically. One of the reasons why this happens is the difficulty in obtaining use data, not only non-intrusively but also in a scientifically reliable way. Until the early 2000s, obtaining reef monitoring data was only possible through the collection of primary data, mainly through either direct field observations on board research vessels or by identifying stakeholders who were willing to answer questionnaires or be interviewed about reef benefits [21,22,23]. Both forms had some degree of inherent intrusion.
However, with the advancement of technology and decision analysis techniques, the possibility of developing more reliable approaches to the collection of primary data for socioeconomic monitoring purposes has increased [24,25]. In this regard, high-resolution cameras have been utilized in the last decade, for example [26,27].
A practical example of non-intrusive monitoring occurs when working with data from vessels that have an automatic identification system (AIS), which is a signal emission technology on board for satellite and terrestrial reception systems [28]. Vessels that meet these conditions—the AIS is a vessel-tracking system, used as a global tool since 2004—allow vessels to be tracked from various perspectives, such as route tracking by the companies that own them, safety and ease of providing assistance in the case of need, and scientific purposes [29,30]. In the tracking of vessels for scientific purposes, it can be applied in the case of transport of goods or people, fishing monitoring, and recreational activities [31].
Most of the activities related to the use of ARs (e.g., fishing, recreational SCUBA diving) are conducted on a small-scale and are data-poor or data-limited [32]. Bayesian modeling allows for inferences about the probabilities of the occurrence of phenomena, even in data-poor conditions. Bayesian networks have already been used in research on ARs, particularly in work related to monitoring colonization and trophic relationships [33,34]. However, approaches using Bayesian networks in monitoring human use of ARs are still scarce.
The objective of this article is to conceptualize a methodology that facilitates the analysis of georeferenced data—coming mainly from fishing vessels but also recreational vessels or passenger transport—from AIS signals emitted by vessels that are usable through Industry 4.0 tools. The approach taken in this article is to develop an appropriate sampling procedure to monitor and infer, with the aid of influence diagrams, the use of ARs and surrounding areas in the sustainable exploitation of coastal living resources. Regarding the data collection itself, this approach is conducted in a more sustainable way as it does not require many energy resources. After this introduction, there is a literature review section covering the four topics considered important in this study. Next comes the materials and methods section covering the study site, data collection, data mining, vessel typology and behavior, and Bayesian modeling with influence diagrams. Next comes the results considering the base case and some analyzed scenarios. Afterward comes the discussion of the results obtained and the potential of using Bayesian networks for similar studies. Finally, conclusions are drawn and some recommendations are included.
2. Literature Review
2.1. ARs in Portugal
The deployment of ARs in the South of Portugal was conducted for the first time in 1989–90. Subsequently, after satisfactory results of reef colonization were verified, the pilot project was extended [35]. It was only in the 2000s that it was possible to make an approach to reef efficiency for fishing [16,36] and the importance of modules in SCUBA diving options [37]. These experimental fisheries allowed the inference of the capacity of aggregation or production of fish, due to the presence of the new structures. In the same way, it was possible to infer a little about the contribution of these areas in terms of reef biomass production and the exploitation of the fishery resources of specific species due to the ARs' effects [32].
2.2. Progress in Artificial Reef Monitoring
In AR monitoring via field sampling through direct site observation, not only were sampling costs high, but sampling was very time-consuming [38]. However, these studies of observation of fishing patterns have been fundamental, as they provide some evidence about catches and the sustainability of fishery resources and their consequent renewability [39,40,41]. Proving the use of ARs was difficult in the past because sampling methods were intrusive and deterrent. Nowadays, the methods are facilitated by the application of non-intrusive tools such as onboard Vessel Monitoring Systems (VMSs) and AIS, which can be tracked by Industry 4.0 IoT applications [42,43].
2.3. Presence and Behavior of Vessels
Vessels that are eligible for a reef-monitoring approach are those engaged in fishing, recreational or passenger transport activities [2,21,44,45]. Despite being important, the Algarve AR case study analyzed here was considered only as complementary to other alternative fishing areas for sea-related recreational activities [46]. In the case of fishing, vessels that operate trawl gear occupy areas further offshore in the Algarve coast and consequently do not benefit from the reef effect. Artificial reefs have sometimes been created as a deterrent to this fishing gear [47,48]. Regarding other active gear such as purse seine nets, ARs can in some way facilitate the fishing process, which is most often directed at pelagic species [49]. However, the fishing gear that could benefit most from the presence of ARs is passive gear, namely nets (trammel and gillnets), traps and pots [50].
2.4. Decision Analysis Using Influence Diagrams
Influence diagrams (IDs) were developed in the 1970s by decision analysts [51,52,53]. An ID presupposes intuitive and easy-to-understand semantics and compact graphical and mathematical representations to support decision making [54]. It is a generalized form derived from a Bayesian network, which includes not only probabilistic inference but also scenarios for making decisions based on the criterion of maximum expected utility [55,56]. The potential of IDs is great, and they are a tool that we believe is especially useful for approaching the monitoring of AR use in relation to different human activities. There are few applications with these Bayesian tools in the context that we decided to explore in this research.
3. Materials and Methods
3.1. Study Site
For the purposes of this research, the south of mainland Portugal, the Algarve coast, was selected. Several AR systems exist in this area. In the surroundings, there are several fishing and recreational ports. Potential users have activities based on these locations (Figure 1). Vessel positioning data were acquired from maritime traffic service networks [57].
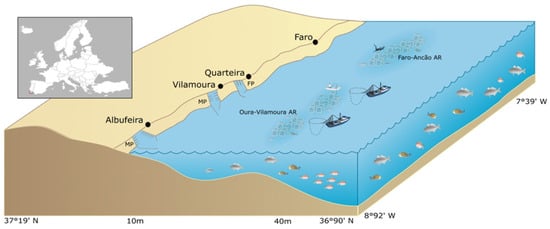
Figure 1.
Infographic representing three artificial reef systems on the central Algarve coast (Portugal), showing the main locations where there are operators who use them (fishing and recreational ports or marinas of Albufeira, Vilamoura, Quarteira and Faro). The figure was created by AM and JC using Inkscape (version 1.3, https://inkscape.org).
The ARs in the study sites are modular porous concrete structures with cubic and octagonal shapes and occupy areas of approximately 6 km2 (Oura and Vilamoura) [14] and 12.2 km2 (Faro-Ancão) [36]. The ARs are found between 16 and 40 m deep [35], and their distance from the coast varies depending on the slope but can be up to almost 6.5 km [14].
3.2. Data Collection
As pointed out in [58], access to vessel geopositioned data can enhance scientific research particularly when conducting monitoring tasks. To track vessels, marked spatial-temporal data were used, provided by MarineTraffic [59]. These data are collected from the AIS, which relies on a collaborative approach through a self-reporting system. This AIS system allows vessels to transmit information related to their identification and positioning (latitude and longitude coordinates and time information). There is also the transmission of other information from various onboard devices, such as the vessel’s location and speed over time. However, it should be noted that there are some limitations to this system, as only larger fishing boats and passenger vessels are required to have an AIS. However, it is expected that in the near future, it will be frequent practice for all vessels to have this system installed on board.
AIS systems allow vessels to share data with other ships, satellites and AIS stations. Inland antennas capture AIS information, and an AIS receiver processes it, sending it over the internet to a database for storage and utilization (Figure 2).
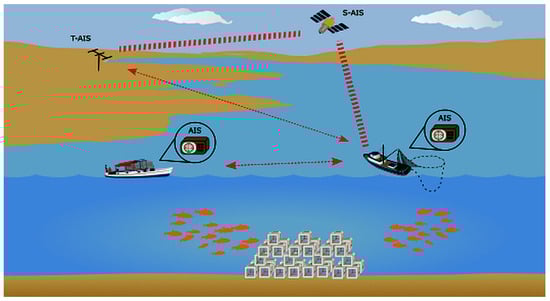
Figure 2.
Representation of the communication system via AIS. Vessels transmit signals for satellite (S-AIS) and terrestrial (T-AIS) reception systems, which are broadcast via satellite to networked equipment (e.g., MarineTraffic data can be viewed on multiple devices). The figure was created by AM and JC using Inkscape (version 1.3, https://inkscape.org).
As a rule, it is in the warmer months that more leisure activities are developed, namely diving. Trips for recreational fishing purposes are distributed throughout the year but with a greater incidence in summer, due to the more pleasant temperatures. This season also coincides with the time when most people have the most free time available. Practicing leisure water activities at sea, such as diving, enhances the physical and mental health of practitioners [60].
In the present study—and considering annual variation—it was decided to compare seasonal vessel activities and patterns. So, it was decided to use information on fish activity around ARs in winter (January, February and March) and summer (July, August and September) for the years 2022 and 2023. The data acquired include information on each individual boat (MMSI) with their status (motion), speed (knots), positioning (latitude and longitude coordinates), direction or navigation route, date (year, month and day) and time (hours and minutes of the day) and the station that collected the signal.
3.3. Data Screening
Data mining consisted of several phases (Figure 3). First, it was necessary to clean up all data that were not relevant to the study. The data to be excluded at this stage were from stationary vessels or those that are in inland areas such as in ports and types of vessels not relevant such as cruise ships, tugboats or personal vessels. In the second phase, it was important to distinguish between the typologies of the selected vessels. These vessels of interest for the study are fishing, recreational, and passenger boats.
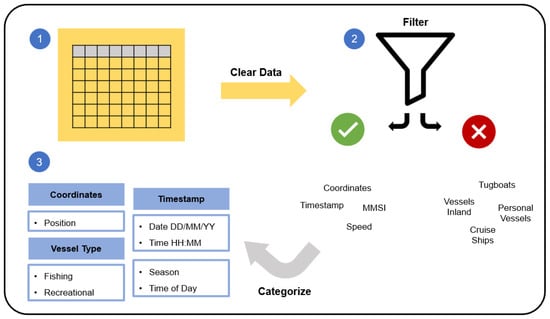
Figure 3.
Diagram illustrating the procedure from the raw database: its screening, sorting through filters and its subsequent categorization for a posteriori modeling.
3.4. Type of Vessels and Motion
From the inference of the data, it is possible to verify which fishing vessels have eligible gear and those not (or less) eligible for AR use. The literature also provides corroborating information in this regard [61,62]. In vessels operating with active gear, trawlers mostly operate outside the AR area, due to technical and legal limitations. Seiners are eligible for fishing in the reef zone. With regard to vessels using static gear, such as multi-gear fleets or artisanal fleets, gillnets and trammel nets, traps and pots are deployed in the AR vicinity or between the AR groups.
Recreational boats have to be linked to their potential to develop leisure activities, such as recreational diving and sport fishing. The owners of this type of vessel do not have gear licenses, only licenses for leisure activities.
Likewise, the vessels that have a passenger transport license can be rented as charter boats to develop activities related to sport fishing or diving. This type of activity can be linked to professional activities that are part of maritime tourism.
The speed at which vessels move, as well as their successive positions, is important to understand their situation [63]. The distinct types of boats also have different navigating speeds. In addition to navigating speeds, the vessels also have specific speeds for fish detection purposes: stationary or drifting for gear set-up, or diver collection if it is a recreational vessel. In the case of recreational vessels, they usually navigate at higher velocities, but their behavior and patterns vary according to the activity. Therefore, in the case of fishing vessels, as the various stages of fishing are known, it is possible to use vessel speed to understand if the boat is fishing or just navigating, which allows us to better understand fishing activity patterns (Figure 4).
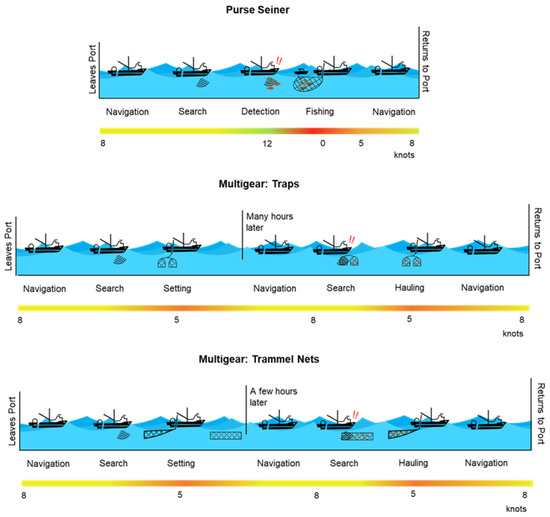
Figure 4.
Illustration of speed and fishing vessel activity stages driven by data. Each stage, regardless of the type of vessel, takes a different amount of time depending on conditions such as the distance covered and weather. The vessel icon is the same for all vessel types to make it easier to understand, as each vessel is different in reality.
For example, since leaving port, purse seiners navigate at a regular speed in search of fish aggregations with the help of echo-sounders until they detect fish assemblages. When shoals of fish are detected, there is an increase in boat velocity in order to surround the fish. This occurs when the fishing stage begins. It begins with the help of an auxiliary boat to set the purse net around the shoal, and the fishing stage ends by manually hauling the net full of fish caught into the vessel [61]. In this stage, the purse seiner is stopped, and the speed is zero knots or slightly above in the case that it is drifting. Depending on varied reasons, the vessel can repeat the cycle of navigating–searching–detecting to find another shoal of fish or it can keep navigating to return to the origin port to berth.
For artisanal fisheries or multi-gear, there are cases of gill or trammel nets and traps/pots. Their behavior is similar: both set out to navigate at a faster speed, then start to haul or deploy nets or traps/pots, which necessitates slowing down the speed [64]. Both nets and traps/pots are usually left in the sea despite variations in the soaking time of gears. However, in Algarve, regardless of the static gear use, hours or days after gear setting, boats return to the port before hauling [65,66]. Then, they return to the fishing ground from the port at a higher navigating speed.
Access to AIS data from the MarineTraffic application’s big data allows us to infer the behavior of vessels. There are several authors who have used this information for scientific work, including contributions to the improvement of sustainable fisheries as referenced, e.g., [67,68].
3.5. Influence Diagrams
Influence diagrams were used in the context of Bayesian analysis to determine the factors that influence the usefulness of ARs (Figure 5). Influence diagrams are representations where there is at least one node representing a decision that can be chosen by the decision makers. Another node represents the utility associated with certain outcomes [69,70,71]. In the present case, an influence diagram was developed from the primary data derived from AIS data. The diagrams specify the structure of the causal relationships between the variables (nodes). In this example, variables were identified that were considered of interest and that represented the respective nodes in the influence diagram. In total, the model includes twelve nodes: three decision nodes (rectangles with square edges), seven chance nodes (rectangles with round edges) and two utility nodes (hexagons). In this study, the open-source Bayesian network program OpenMarkov [72] was used to build and develop the model scenarios, based on real data from the AIS.
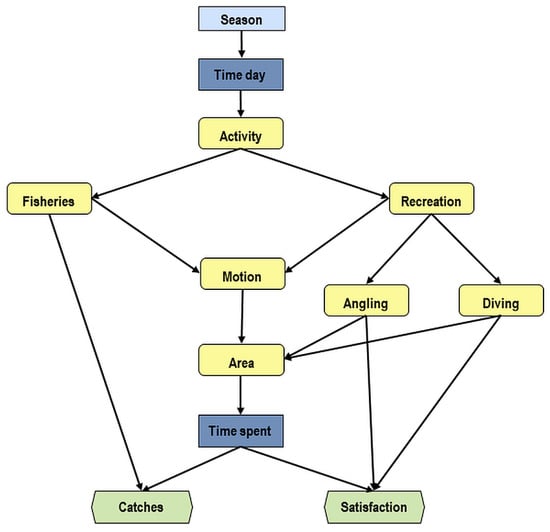
Figure 5.
Illustration using a simple Bayesian influence diagram (ID) for the purpose of modeling the system in the present study. Rounded rectangles represent chance nodes, rectangles represent decision nodes and hexagons represent utility nodes.
The main objective of the ID was to infer the combinations of reef use and surrounding areas where the usefulness of human activities can be maximized, namely in the capture of living resources (professional fishing) and in the satisfaction of the practice of recreational activities (recreational fishing and diving). For each decision and chance node, several discrete states were considered (ranging from two to four), while for each utility node, continuous states were considered, as can be seen in Table 1.

Table 1.
Nodes used in the influence diagram (ID), their types, description and discretization.
4. Results
Decision and chance nodes were determined from the AIS data and the ratio between human activities (i.e., the presence of fisheries and recreation boats in different spatial-temporal setting combinations). Based on these primary data sources, it was possible to construct condition probability tables (CPTs) for the nodes included in the ID. For instance, the values selected for the CPT of the decision node ‘Time spent’ consisted of finding probabilities for boats spending their recorded activity time in three discretization states, i.e., less than one hour, between 1 and 4 h and over 4 h (Table 2).
Table 2.
Conditional probability table (CPT) of two chance nodes of the influence diagram: (a) ‘Fisheries’ and (b) ‘Recreation’.
The following influence diagram starts from a base case, where the main activity conducted was fishing (75%) rather than recreation (25%). The model takes into consideration equal probabilities for motion, angling and diving chance nodes. It is important to note that—as previously mentioned in the materials and methods section—only larger vessels and passenger boats contribute to the results presented here in the ID.
In relation to recreational activities, the type of vessel with the highest value is charter, followed by sailboats and passenger vessels. For fisheries, the main type of vessel used is a seiner, followed by other types of vessels and multi-gear. As for the area, it is considered that the outer area of the reef has the highest value of probability (0.50%), than other nearby areas, followed by the area over the reef and the inner area. These variables give a probability of 18.64% for the catch utility node and 31.96% for the satisfaction (Figure 6).
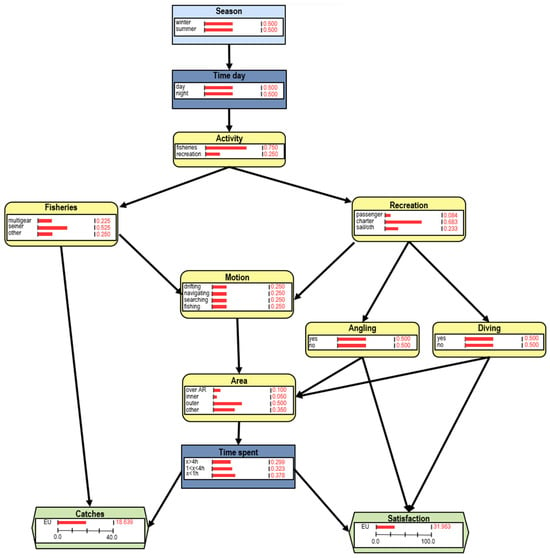
Figure 6.
Bayesian influence diagram base case run in OpenMarkov [72], which is an open-source program available from http://www.openmarkov.org/.
In the various scenarios using the influence diagram, it can be seen that as there is greater fishing activity (larger catches), the usefulness of recreational activities decreases (Table 3). This is because there is a certain competition for space between fishing and recreational activities. Within fishing, it can be seen that fishing catches are maximized for passive gear, but even so, they rarely reach close to 30% of the total catch utility for these vessels (scenario 2), even if they use these areas for periods longer than 4 h. Seiners do not exceed 24% of the total catch utility nearby ARs.
Table 3.
Base case and three hypothetical scenarios using the OpenMarkov program [72]. The base case is supported by the set of all the data with no evidence under analysis. Each of the scenarios run in ID is based on random conditions in the decision node (time spent) according to different combinations of human fishing and recreation activities, vessel speed and area of use (chance nodes) and the resulting expected utility (utility nodes of catches and satisfaction).
In the case of recreational activities, it can be seen that total satisfaction (100%) occurs only in the case of use for angling activities, in which recreational users can fulfill the expectations created. As far as diving activities are concerned, satisfaction is only partial, because the AR groups are monotonous structures that do not generate grand expectations a priori from divers [37,73].
5. Discussion
5.1. Access to the AR Areas and the Potential of AIS Data
As ARs are submerged, their access is limited, and consequently, their observation can only be conducted through remote detection by electronic equipment (e.g., echo sounds) installed on boats or through diving or fishing activities (scientific, professional or recreational) that allow ‘direct’ contact with the structures. However, the fact that ARs are subject to some inaccessibility does not invalidate the understanding of their role at a socioeconomic level [74].
The possibility of collecting a large amount of data via AIS for a well-defined spatial–temporal situation implies that for those data to be useful, adequate screening is essential [75]. It is important to discard data relating to vessels that are stationary and whose activity is not related to reef use. In the case of trawl boats, there may be many routes coinciding with reef areas, but these vessels will only be in transit or navigate in a reef area as they do not have gear eligible for use in ARs [73].
Although there is no great difficulty in collecting vessel positioning data, their analysis is somewhat difficult. This difficulty arises from the great diversity not only of the type of vessels but also their movement dynamics. Vessels are normally anchored in a harbor (commercial fishing boats) or marina (transport, charter or recreational vessels). When these boats move at sea, they can present varied behavioral patterns. They may be navigating at a more or less constant cruising speed or may be conducting detection maneuvers (e.g., echo-sound or sonar in search of schools of fish, a suitable depth, or certain bottom types of anchoring). Other behaviors may include vessels that may be a little adrift according to the tides. All these different motions (vessel behaviors) are related to specific activities in the water [76].
It is important to be able to contextualize the behavior of vessels present in the information provided by AIS data. It is important to know what activities are related to these vessels, their annual and circadian dynamics, as well as the interaction with other activities that operate in the same spaces, and study them in the context of this inference work.
In the case of fishing vessels, there is activity throughout the year, although these activities depend on bringing fish to land, and they can be compromised if the weather conditions are unfavorable and there is a ban on leaving by maritime authorities [77]. It is also in the winter season, particularly when conditions are more unfavorable, that the boats stay ashore and go for maintenance and repair. With regard to vessel behavior in circadian rhythms, in summer, purse seiners generally go to the sea a little later, while other types of fishing do not have major differences in their daily behavior [78].
In the case of recreational vessels, there is much greater activity during the summer months, due not only to there being more favorable conditions for practicing leisure activities at sea but also more time available for people to practice these types of activities, particularly when they are on vacation. There are many businesses linked to boat rental and service provision that operate essentially at these seasons of the year [79].
Therefore, to analyze the above-referred type of vessel positioning data, it is important to have reference points and know about the types of vessels and their activities, and have means to corroborate this information (e.g., triangulation through questionnaires and interviews) [80]. In the present study, through the geo-spatial distribution of data, it was possible to construct a plausible ID with several discretization levels. As shown in the results, the ID, when run according to various expected combinations of use based on AIS data, helps us to understand how sustainable the activities conducted are in the context and dependence of the AR area of influence.
5.2. Scenario Analysis Using Influence Diagrams
The base case adjusts to the situation where fishing vessels occur three times more often than recreational vessels—regardless of the season of the year or time of day—and seiners correspond to a little more than half of the eligible observations. This situation assumes that AR areas are used in a relatively low proportion—i.e., 10% of the total area under analysis is assumed (Figure 6)—and that these recreational activities are practiced in an identical proportion (i.e., half angling and half diving). This base case also assumes that most activities—whether fishing or recreation—primarily use areas further away from reef areas. Most of the time, vessel activity time is relatively short (i.e., most spend less than 1 h in the same location). This base case assumes a relatively low utility in catches (tangible), presenting the lowest value of all when compared to the scenarios that were evaluated.
In the case of scenario 1, it is evaluated when there is no recreational activity and only purse seiner fishing, practiced exclusively in the reef area, where the fishing trip(s) last up to 4 h. Here, there is a slight increase in catches as well as satisfaction (intangible). This scenario assumes that there is no interference between activities, but there is a limitation—carrying capacity—of the AR area itself that offers limited possibilities in the case of seiner catches (generally pelagic fish species) and the slight increase in satisfaction of being given the possibility of having living resources for future recreational activities (namely species not targeted by purse seiner gear).
In the case of scenario 2, everything is similar to the previous scenario, with the difference being that multi-gear fishing is passive. In this scenario, the behavior of the vessels is different, as the vessel will launch the gear for a relatively brief period, leave the gear fishing continuously for some time and some hours later haul the gear on board. Generally, it is during the hauling process that fish from the catch are counted. In this type of passive gear, there is generally greater selectivity. Therefore, the satisfaction of fishing in these areas is greater than in the case of boats with active gear (e.g., seiners). In this scenario, despite the gear remaining permanently in the reef zone under continuous fishing, the utility in terms of satisfaction for recreational activities is identical to that in scenario 1.
In the third scenario, it is assumed that in fisheries, activities there are only purse seiners, and in recreational activities, both angling and diving are present. Under these conditions, it seems that this is the scenario where recreational activities obtain the least satisfaction, as there is some competition for space.
5.3. Potential Derived from Influence Diagrams
The expected results for usefulness (catches and satisfaction) show that there is a certain incompatibility at the same time. This is explained by the fact that, generally, an increase in catches in the reef area will reduce satisfaction, at least on the part of divers (i.e., there would be less marine life, as they were subtracted from the catch). This fact is in line with the literature, e.g., [3,21,81].
The use of Bayesian modeling approaches helps in structuring data and their analysis to better understand phenomena that occur under certain circumstances [82,83,84,85,86,87,88,89]. Similarly, structuring the data and their analysis with influence diagrams allows us to understand the dynamics in reef areas. The use of the OpenMarkov program is an added value for structuring and analyzing the various possible scenarios that appear plausible [72,90]. The structuring of the chance nodes through the different types of vessel and the activities that may be related to them, the location possibilities in relation to the distance from the reef, as well as the decision nodes related essentially to the time of year, circadian activity and weather duration to practice the different activities, allow us to draw very important lessons in terms of potential catches (professional fishing) and satisfaction with the activity practiced (recreational activities and tourism).
If we move to another geography or scale the analysis, it can be noticed that sustainable fishing governance is desirable as a primary objective. It is essential to maintain biodiversity, whatever the level of interaction of human activities under analysis [91].
6. Conclusions
With access to data for a specific, well-defined temporal and spatial period, it becomes possible to conduct adequate sampling and know the type of use by diverse types of vessels in the AR area. Triangulating data to exclude information that is not relevant—e.g., trawlers operate in more offshore areas and their gear is not eligible for use in ARs—and the appropriate analysis of the remaining data are essential to understand the dynamics of the use of reef areas. With these data, it is possible to use influence diagrams to build scenarios to understand patterns of human use of AR areas.
In the present case study, it was somehow managed to build a way to monitor patterns of human use in a well-defined reef area off the central coast of the Algarve (Portugal). With this ID model approach, it was possible:
- -
- to move forward in order to work with the data in more detail;
- -
- to be able to infer the sustainability of the resources generated in the reef area (i.e., services and products);
- -
- to align with the United Nations’ sustainable development goals (SDGs), namely goals 12 and 14 (sustainable consumption and production and life under water, respectively).
Finally, it is important to highlight that despite still having some limitations, this type of approach can be replicated for similar monitoring studies anywhere and for more or less extended periods. This approach, being non-intrusive and allowing researchers to work with a large amount of data, gives us the freedom to stress that the inferences resulting from the analyses are quite realistic.
The use of Bayesian influence diagrams is recommended as a feasible and comprehensive approach for cases that present some evidence of human activities in coastal areas, regardless of whether they are AR areas or not. Thus, the use of IDs, particularly when exploring several use scenarios, requires caution due to several adjustments to the models and their constant plausibility checks.
Author Contributions
Writing—original draft preparation, J.R.; methodology, J.R.; artwork, A.M. and J.C.; building and running the ID model, J.R., A.M. and J.C.; writing—review and editing, F.L. and B.D. All authors have read and agreed to the published version of the manuscript.
Funding
This work is funded by Portuguese national funds through FCT—Foundation for Science and Technology within the scope of the projects UIDB/04020/2020, UIDB/04326/2020, UIDP/04326/2020, LA/P/0101/2020 and 2022.01783.PTDC and the Individual Calls to Scientific Employment Stimulus 2021.02180.CEECIND (JR) and 2022.04803.CEECIND (FL).
Institutional Review Board Statement
Not applicable.
Informed Consent Statement
Not applicable.
Data Availability Statement
Data are contained within the article.
Acknowledgments
The authors are grateful to the three anonymous reviewers who contributed immensely to the undeniable improvement of the manuscript.
Conflicts of Interest
The authors declare no conflict of interest. The funders had no role in the design of the study; in the collection, analyses, or interpretation of data; in the writing of the manuscript; or in the decision to publish the results.
References
- Baine, M. Artificial reefs: A review of their design, application, management and performance. Ocean Coast. Manag. 2001, 44, 241–259. [Google Scholar] [CrossRef]
- Pickering, H.; Whitmarsh, D.; Jensen, A. Artificial reefs as a tool to aid rehabilitation of coastal ecosystems: Investigating the potential. Mar. Pollut. Bull. 1999, 37, 505–514. [Google Scholar] [CrossRef]
- Sutton, S.G.; Bushnell, S.L. Socio-economic aspects of artificial reefs: Considerations for the Great Barrier Reef Marine Park. Ocean Coast. Manag. 2007, 50, 829–846. [Google Scholar] [CrossRef]
- Hylkema, A.; Hakkaart, Q.C.; Reid, C.B.; Osinga, R.; Murk, A.J.; Debrot, A.O. Artificial reefs in the Caribbean: A need for comprehensive monitoring and integration into marine management plans. Ocean Coast. Manag. 2021, 209, 105672. [Google Scholar] [CrossRef]
- MacDonald, J.M. Artificial Reef Debate: Habitat Enhancement or Waste Disposal? Taylor & Francis: Abingdon, UK, 1994. [Google Scholar]
- Fabi, G.; Spagnolo, A.; Bellan-Santini, D.; Charbonnel, E.; Çiçek, B.A.; García, J.J.G.; Jensen, A.C.; Kallianiotis, A.; Santos, M.N.D. Overview on artificial reefs in Europe. Braz. J. Oceanogr. 2011, 59, 155–166. [Google Scholar] [CrossRef]
- Stone, R.B. National Artificial Reef Plan; US Department of Commerce, National Oceanic and Atmospheric Administration, National Marine Fisheries Service: Silver Spring, MD, USA, 1985.
- Techera, E.J.; Chandler, J. Offshore installations, decommissioning and artificial reefs: Do current legal frameworks best serve the marine environment? Mar. Policy 2015, 59, 53–60. [Google Scholar] [CrossRef]
- Seaman, W., Jr.; Grove, R.; Whitmarsh, D.; Santos, M.N.; Fabi, G.; Kim, C.G.; Relini, G.; Pitcher, T. Artificial Reefs as Unifying and Energizing Factors in Future Research and Management of Fisheries and Ecosystems; CRC Press: Boca Raton, FL, USA, 2011; pp. 7–30. [Google Scholar]
- Lee, M.O.; Otake, S.; Kim, J.K. Transition of artificial reefs (ARs) research and its prospects. Ocean Coast. Manag. 2018, 154, 55–65. [Google Scholar] [CrossRef]
- Vivier, B.; Dauvin, J.C.; Navon, M.; Rusig, A.M.; Mussio, I.; Orvain, F.; Boutouil, M.; Claquin, P. Marine artificial reefs, a meta-analysis of their design, objectives and effectiveness. Glob. Ecol. Conserv. 2021, 27, e01538. [Google Scholar] [CrossRef]
- Chen, J.L.; Chuang, C.T.; Jan, R.Q.; Liu, L.C.; Jan, M.S. Recreational benefits of ecosystem services on and around artificial reefs: A case study in Penghu, Taiwan. Ocean Coast. Manag. 2013, 85, 58–64. [Google Scholar] [CrossRef]
- Leitao, F.; Santos, M.N.; Monteiro, C.C. Contribution of artificial reefs to the diet of the white sea bream (Diplodus sargus). ICES J. Mar. Sci. 2007, 64, 473–478. [Google Scholar] [CrossRef][Green Version]
- Ramos, J.; Lino, P.G.; Himes-Cornell, A.; Santos, M.N. Local fishermen’s perceptions of the usefulness of artificial reef ecosystem services in Portugal. PeerJ 2019, 6, e6206. [Google Scholar] [CrossRef] [PubMed]
- Hunter, W.R.; Sayer, M.D.J. The comparative effects of habitat complexity on faunal assemblages of northern temperate artificial and natural reefs. ICES J. Mar. Sci. 2009, 66, 691–698. [Google Scholar] [CrossRef]
- Whitmarsh, D.; Santos, M.N.; Ramos, J.; Monteiro, C.C. Marine habitat modification through artificial reefs off the Algarve (southern Portugal): An economic analysis of the fisheries and the prospects for management. Ocean Coast. Manag. 2008, 51, 463–468. [Google Scholar] [CrossRef]
- Scarcella, G.; Grati, F.; Bolognini, L.; Domenichetti, F.; Malaspina, S.; Manoukian, S.; Polidori, P.; Spagnolo, A.; Fabi, G. Time-series analyses of fish abundance from an artificial reef and a reference area in the central-Adriatic Sea. J. Appl. Ichthyol. 2015, 31, 74–85. [Google Scholar] [CrossRef]
- Lima, J.S.; Zappes, C.A.; Di Beneditto, A.P.M.; Zalmon, I.R. Ethnoecology and socioeconomic around an artificial reef: The case of artisanal fisheries from southeastern Brazil. Biota Neotropica 2020, 19. [Google Scholar] [CrossRef]
- Yuan, Y.; Feng, J.; Xian, W.; Zhang, H. Analysis of the Ecosystem Characteristics and Ecological Carrying Capacity of the Main Commercial Fish in the Artificial Reef Ecosystem in Laizhou Bay Using the Ecopath Model. Sustainability 2022, 14, 13933. [Google Scholar] [CrossRef]
- Claudet, J.; Pelletier, D. Marine protected areas and artificial reefs: A review of the interactions between management and scientific studies. Aquat. Living Resour. 2004, 17, 129–138. [Google Scholar] [CrossRef]
- Milon, J.W.; Holland, S.M.; Whitmarsh, D.J. Social and economic evaluation methods. In Artificial Reef Evaluation: With Application to Natural Marine Habitats; CRC Press LLC: Boca Raton, FL, USA, 2000; pp. 165–194. [Google Scholar]
- Seaman, W.; Jensen, A.C. Purposes and Practices of Artificial Reef Evaluation; CRC Press LLC: Boca Raton, FL, USA, 2000; pp. 2–19. [Google Scholar]
- Ramos, J.; Santos, M.N.; Whitmarsh, D.; Monteiro, C.C. Stakeholder analysis in the Portuguese artificial reef context: Winners and losers. Braz. J. Oceanogr. 2011, 59, 133–143. [Google Scholar] [CrossRef]
- Lima, J.S.; Zalmon, I.R.; Love, M. Overview and trends of ecological and socioeconomic research on artificial reefs. Mar. Environ. Res. 2019, 145, 81–96. [Google Scholar] [CrossRef]
- Ramm, L.A.; Florisson, J.H.; Watts, S.L.; Becker, A.; Tweedley, J.R. Artificial reefs in the Anthropocene: A review of geographical and historical trends in their design, purpose, and monitoring. Bull. Mar. Sci. 2021, 97, 699–728. [Google Scholar] [CrossRef]
- Wood, G.; Lynch, T.P.; Devine, C.; Keller, K.; Figueira, W. High-resolution photo-mosaic time-series imagery for monitoring human use of an artificial reef. Ecol. Evol. 2016, 6, 6963–6968. [Google Scholar] [CrossRef] [PubMed]
- Becker, A.; Taylor, M.; McLeod, J.; Lowry, M. Application of a long-range camera to monitor fishing effort on an offshore artificial reef. Fish. Res. 2020, 228, 105589. [Google Scholar] [CrossRef]
- Kodheli, O.; Lagunas, E.; Maturo, N.; Sharma, S.K.; Shankar, B.; Montoya, J.F.M.; Duncan, J.C.M.; Spano, D.; Chatzinotas, S.; Kisseleff, S.; et al. Satellite communications in the new space era: A survey and future challenges. IEEE Commun. Surv. Tutor. 2020, 23, 70–109. [Google Scholar] [CrossRef]
- Pezzani, L.; Heller, C. AIS Politics: The contested use of vessel tracking at the EU’s maritime frontier. Sci. Technol. Hum. Values 2019, 44, 881–899. [Google Scholar] [CrossRef]
- Serra-Sogas, N.; O’Hara, P.D.; Pearce, K.; Smallshaw, L.; Canessa, R. Using aerial surveys to fill gaps in AIS vessel traffic data to inform threat assessments, vessel management and planning. Mar. Policy 2021, 133, 104765. [Google Scholar] [CrossRef]
- Wolsing, K.; Roepert, L.; Bauer, J.; Wehrle, K. Anomaly detection in maritime AIS tracks: A review of recent approaches. J. Mar. Sci. Eng. 2022, 10, 112. [Google Scholar] [CrossRef]
- Roa-Ureta, R.H.; Santos, M.N.; Leitão, F. Modelling long-term fisheries data to resolve the attraction versus production dilemma of artificial reefs. Ecol. Model. 2019, 407, 108727. [Google Scholar] [CrossRef]
- Rouse, S.; Porter, J.S.; Wilding, T.A. Artificial reef design affects benthic secondary productivity and provision of functional habitat. Ecol. Evol. 2020, 10, 2122–2130. [Google Scholar] [CrossRef]
- Zhang, R.; Liu, H.; Zhang, Q.; Zhang, H.; Zhao, J. Trophic interactions of reef-associated predatory fishes (Hexagrammos otakii and Sebastes schlegelii) in natural and artificial reefs along the coast of North Yellow Sea, China. Sci. Total Environ. 2021, 791, 148250. [Google Scholar] [CrossRef]
- Santos, M.N.; Monteiro, C.C. The Olhao artificial reef system (south Portugal): Fish assemblages and fishing yield. Fish. Res. 1997, 30, 33–41. [Google Scholar] [CrossRef]
- Leitao, F.; Santos, M.N.; Erzini, K.; Monteiro, C.C. Fish assemblages and rapid colonization after enlargement of an artificial reef off the Algarve coast (Southern Portugal). Mar. Ecol. 2008, 29, 435–448. [Google Scholar] [CrossRef]
- Ramos, J.; Santos, M.N.; Whitmarsh, D.; Monteiro, C.C. The usefulness of the analytic hierarchy process for understanding reef diving choices: A case study. Bull. Mar. Sci. 2006, 78, 213–219. [Google Scholar]
- Ramos, J.; Santos, M.N.; Whitmarsh, D.; Monteiro, C.C. Patterns of use in an artificial reef system: A case study in Portugal. Bull. Mar. Sci. 2006, 78, 203–211. [Google Scholar]
- Lunn, K.E.; Dearden, P. Monitoring small-scale marine fisheries: An example from Thailand’s Ko Chang archipelago. Fish. Res. 2006, 77, 60–71. [Google Scholar] [CrossRef]
- Palmer, M.C.; Wigley, S.E. Using positional data from vessel monitoring systems to validate the logbook-reported area fished and the stock allocation of commercial fisheries landings. N. Am. J. Fish. Manag. 2009, 29, 928–942. [Google Scholar] [CrossRef]
- Salaün, J.; Pioch, S.; Dauvin, J.C. Artificial Reef Stakeholders in France: A Social-Network Analysis. In Impact of Artificial Reefs on the Environment and Communities; IGI Global: Hershey, PA, USA, 2022; pp. 21–47. [Google Scholar]
- Gardner, C.; Goethel, D.R.; Karnauskas, M.; Smith, M.W.; Perruso, L.; Walter, J.F., III. Artificial attraction: Linking vessel monitoring system and habitat data to assess commercial exploitation on artificial structures in the Gulf of Mexico. Front. Mar. Sci. 2022, 9, 772292. [Google Scholar] [CrossRef]
- Ito, P.; Costa, J.; Ramos, J. Pilot Monitoring to Investigate the Usefulness of Artificial Reefs Using Vessel Tracking Technology and Cloud Computing: A Case Study in Southern Portugal; International Institute of Fisheries Economics & Trade: Corvallis, OR, USA, 2022. [Google Scholar]
- Brock, R.E. Beyond fisheries enhancement: Artificial reefs and ecotourism. Bull. Mar. Sci. 1994, 55, 1181–1188. [Google Scholar]
- Ricci, S.W.; Bohnenstiehl, D.R. Monitoring visitation at North Carolina artificial reef sites using high spatiotemporal resolution PlanetScope imagery. Reg. Stud. Mar. Sci. 2022, 55, 102511. [Google Scholar] [CrossRef]
- Monteiro, P.V. The Role of knowledge-intensive service activities on inducing innovation in co-opetition strategies: Lessons from the maritime cluster of the Algarve region. Int. J. Manag. Enterp. Dev. 2016, 15, 78–95. [Google Scholar] [CrossRef]
- Muñoz-Pérez, J.J.; Gutiérrez Mas, J.M.; Naranjo, J.M.; Torres, E.; Fages, L. Position and monitoring of anti-trawling reefs in the Cape of Trafalgar (Gulf of Cadiz, SW Spain). Bull. Mar. Sci. 2000, 67, 761–772. [Google Scholar]
- Tessier, A.; Verdoit-Jarraya, M.; Blouet, S.; Dalias, N.; Lenfant, P. A case study of artificial reefs as a potential tool for maintaining artisanal fisheries in the French Mediterranean Sea. Aquat. Biol. 2014, 20, 255–272. [Google Scholar] [CrossRef]
- Flávio, H.; Seitz, R.; Eggleston, D.; Svendsen, J.C.; Støttrup, J. Hard-bottom habitats support commercially important fish species: A systematic review for the North Atlantic Ocean and Baltic Sea. PeerJ 2023, 11, e14681. [Google Scholar] [CrossRef] [PubMed]
- Santos, M.N.; Monteiro, C.C. Comparison of the catch and fishing yield from an artificial reef system and neighbouring areas off Faro (Algarve, south Portugal). Fish. Res. 1998, 39, 55–65. [Google Scholar] [CrossRef]
- Shachter, R.D. Evaluating influence diagrams. Oper. Res. 1986, 34, 871–882. [Google Scholar] [CrossRef]
- Howard, R.A.; Matheson, J.E. Influence diagrams. Decis. Anal. 2005, 2, 127–143. [Google Scholar] [CrossRef]
- Kjærulff, U.; Madsen, A.L. Bayesian Networks and Influence Diagrams: A Guide to Construction and Analysis; Springer: New York, NY, USA, 2010. [Google Scholar]
- Shenoy, P.P. A comparison of graphical techniques for decision analysis. Eur. J. Oper. Res. 1994, 78, 1–21. [Google Scholar] [CrossRef]
- Watthayu, W.; Peng, Y. A Bayesian network based framework for multi-criteria decision making. In Proceedings of the 17th International Conference on Multiple Criteria Decision Analysis, Whistler, BC, Canada, 6–11 August 2004. [Google Scholar]
- Bielza, C.; Gomez, M.; Shenoy, P.P. Modeling challenges with influence diagrams: Constructing probability and utility models. Decis. Support Syst. 2010, 49, 354–364. [Google Scholar] [CrossRef]
- Xiao, Z.; Fu, X.; Zhang, L.; Goh, R.S.M. Traffic pattern mining and forecasting technologies in maritime traffic service networks: A comprehensive survey. IEEE Trans. Intell. Transp. Syst. 2019, 21, 1796–1825. [Google Scholar] [CrossRef]
- Yang, D.; Wu, L.; Wang, S.; Jia, H.; Li, K.X. How big data enriches maritime research–a critical review of Automatic Identification System (AIS) data applications. Transp. Rev. 2019, 39, 755–773. [Google Scholar] [CrossRef]
- MarineTraffic—Global Ship Tracking Intelligence. Available online: www.marinetraffic.com (accessed on 10 January 2022).
- Lloret, J.; Gómez, S.; Rocher, M.; Carreño, A.; San, J.; Inglés, E. The potential benefits of water sports for health and well-being in marine protected areas: A case study in the Mediterranean. Ann. Leis. Res. 2023, 26, 601–627. [Google Scholar] [CrossRef]
- Wise, L.; Murta, A.G.; Carvalho, J.P.; Mesquita, M. Qualitative modelling of fishermen’s behaviour in a pelagic fishery. Ecol. Model. 2012, 228, 112–122. [Google Scholar] [CrossRef]
- Zhang, Y.; Li, W. Dynamic maritime traffic pattern recognition with online cleaning, compression, partition, and clustering of AIS data. Sensors 2022, 22, 6307. [Google Scholar] [CrossRef] [PubMed]
- Mesquita, M.; Murta, A.G.; Paias, A.; Wise, L. A metaheuristic approach to fisheries survey route planning. Int. Trans. Oper. Res. 2017, 24, 439–464. [Google Scholar] [CrossRef]
- He, P.; Chopin, F.; Suuronen, P.; Ferro, R.S.; Lansley, J. Classification and illustrated definition of fishing gears. In FAO Fisheries and Aquaculture Technical Paper; United Nations Food and Agriculture Organization (FAO): Rome, Italy, 2021; pp. I–94. [Google Scholar]
- Pereira, F.; Vasconcelos, P.; Moreno, A.; Gaspar, M.B. Catches of Sepia officinalis in the small-scale cuttlefish trap fishery off the Algarve coast (southern Portugal). Fish. Res. 2019, 214, 117–125. [Google Scholar] [CrossRef]
- Petetta, A.; Vasapollo, C.; Virgili, M.; Bargione, G.; Lucchetti, A. Pots vs trammel nets: A catch comparison study in a Mediterranean small-scale fishery. PeerJ 2020, 8, e9287. [Google Scholar] [CrossRef]
- Farella, G.; Tassetti, A.N.; Menegon, S.; Bocci, M.; Ferrà, C.; Grati, F.; Fadini, A.; Giovanardi, O.; Fabi, G.; Raicevich, S.; et al. Ecosystem-based MSP for enhanced fisheries sustainability: An example from the northern Adriatic (Chioggia—Venice and Rovigo, Italy). Sustainability 2021, 13, 1211. [Google Scholar] [CrossRef]
- Han, X.; Armenakis, C.; Jadidi, M. Modeling vessel behaviours by clustering AIS data using optimized dbscan. Sustainability 2021, 13, 8162. [Google Scholar] [CrossRef]
- Anaya, A.R.; Luque, M.; García-Saiz, T. Recommender system in collaborative learning environment using an influence diagram. Expert Syst. Appl. 2013, 40, 7193–7202. [Google Scholar] [CrossRef]
- Díez, F.J.; Luque, M.; Bermejo, I. Decision analysis networks. Int. J. Approx. Reason. 2018, 96, 1–17. [Google Scholar] [CrossRef]
- Arora, P.; Boyne, D.; Slater, J.J.; Gupta, A.; Brenner, D.R.; Druzdzel, M.J. Bayesian networks for risk prediction using real-world data: A tool for precision medicine. Value Health 2019, 22, 439–445. [Google Scholar] [CrossRef]
- OpenMarkov. OpenMarkov is an Open-Source Software Tool for Probabilistic Graphical Models. Developed by the Research Centre for Intelligent Decision-support Systems of the UNED in Madrid, Spain. Version 0.4.0. 2021. Available online: http://www.openmarkov.org/ (accessed on 16 December 2023).
- Seaman, W. Structure in the Sea: The Science, Technology and Effects of Purpose-Built Reefs and Related Surfaces; Elsevier: Amsterdam, The Netherlands, 2022. [Google Scholar]
- Tessier, A.; Francour, P.; Charbonnel, E.; Dalias, N.; Bodilis, P.; Seaman, W.; Lenfant, P. Assessment of French artificial reefs: Due to limitations of research, trends may be misleading. Hydrobiologia 2015, 753, 1–29. [Google Scholar] [CrossRef]
- Yan, Z.; Xiao, Y.; Cheng, L.; Chen, S.; Zhou, X.; Ruan, X.; Li, M.; He, R.; Ran, B. Analysis of global marine oil trade based on automatic identification system (AIS) data. J. Transp. Geogr. 2020, 83, 102637. [Google Scholar] [CrossRef]
- Ferreira, M.D.; Campbell, J.N.; Matwin, S. A novel machine learning approach to analyzing geospatial vessel patterns using AIS data. GIScience Remote Sens. 2022, 59, 1473–1490. [Google Scholar] [CrossRef]
- Schreiber, M.A.; Ñiquen, M.; Bouchon, M. Coping strategies to deal with environmental variability and extreme climatic events in the Peruvian anchovy fishery. Sustainability 2011, 3, 823–846. [Google Scholar] [CrossRef]
- Feijó, D.; Marçalo, A.; Bento, T.; Barra, J.; Marujo, D.; Correia, M.; Silva, A. Trends in the activity pattern, fishing yields, catch and landing composition between 2009 and 2013 from onboard observations in the Portuguese purse seine fleet. Reg. Stud. Mar. Sci. 2018, 23, 97–106. [Google Scholar] [CrossRef]
- Moreira, C.O. Portugal as a tourism destination. Paths and trends. Méditerranée. Rev. Géographique Pays Méditerranéens/J. Mediterr. Geogr. 2018. [Google Scholar] [CrossRef]
- Barclay, K.; Voyer, M.; Mazur, N.; Payne, A.M.; Mauli, S.; Kinch, J.; Fabinyi, M.; Smith, G. The importance of qualitative social research for effective fisheries management. Fish. Res. 2017, 186, 426–438. [Google Scholar] [CrossRef]
- Blount, C.; Komyakova, V.; Barnes, L.; Smith, M.L.; Zhang, D.; Reeds, K.; McPhee, D.; Taylor, M.D.; Macbeth, W.; Needham, E. Using ecological evidence to refine approaches to deploying offshore artificial reefs for recreational fisheries. Bull. Mar. Sci. 2021, 97, 665–698. [Google Scholar] [CrossRef]
- Barton, D.N.; Kuikka, S.; Varis, O.; Uusitalo, L.; Henriksen, H.J.; Borsuk, M.; de la Hera, A.; Farmani, R.; Johnson, S.; Linnell, J.D. Bayesian networks in environmental and resource management. Integr. Environ. Assess. Manag. 2012, 8, 418–429. [Google Scholar] [CrossRef]
- Haapasaari, P.; Mäntyniemi, S.; Kuikka, S. Involving stakeholders in building integrated fisheries models using Bayesian methods. Environ. Manag. 2013, 51, 1247–1261. [Google Scholar] [CrossRef]
- Ban, S.S.; Pressey, R.L.; Graham, N.A. Assessing the effectiveness of local management of coral reefs using expert opinion and spatial Bayesian modeling. PLoS ONE 2015, 10, e0135465. [Google Scholar] [CrossRef] [PubMed]
- Martin, S.L.; Stohs, S.M.; Moore, J.E. Bayesian inference and assessment for rare-event bycatch in marine fisheries: A drift gillnet fishery case study. Ecol. Appl. 2015, 25, 416–429. [Google Scholar] [CrossRef] [PubMed]
- Naranjo-Madrigal, H.; van Putten, I.; Norman-López, A. Understanding socio-ecological drivers of spatial allocation choice in a multi-species artisanal fishery: A Bayesian network modeling approach. Mar. Policy 2015, 62, 102–115. [Google Scholar] [CrossRef]
- Coccoli, C.; Galparsoro, I.; Murillas, A.; Pınarbaşı, K.; Fernandes, J.A. Conflict analysis and reallocation opportunities in the framework of marine spatial planning: A novel, spatially explicit Bayesian belief network approach for artisanal fishing and aquaculture. Mar. Policy 2018, 94, 119–131. [Google Scholar] [CrossRef]
- Doll, J.C.; Jacquemin, S.J. Introduction to Bayesian modeling and inference for fisheries scientists. Fisheries 2018, 43, 152–161. [Google Scholar] [CrossRef]
- Stohs, S.M.; Harmon, K.M. Bayesian prediction of fishery biological impacts from limited data: A deep-set buoy gear case study. Fish. Res. 2022, 249, 106228. [Google Scholar] [CrossRef]
- Díez, F.J.; Arias, M.; Pérez-Martín, J.; Luque, M. Teaching Probabilistic Graphical Models with OpenMarkov. Mathematics 2022, 10, 3577. [Google Scholar] [CrossRef]
- Butt, M.J.; Zulfiqar, K.; Chang, Y.C.; Iqtaish, A.M. Maritime dispute settlement law towards sustainable fishery governance: The politics over marine spaces vs. audacity of applicable international law. Fishes 2022, 7, 81. [Google Scholar] [CrossRef]


Disclaimer/Publisher’s Note: The statements, opinions and data contained in all publications are solely those of the individual author(s) and contributor(s) and not of MDPI and/or the editor(s). MDPI and/or the editor(s) disclaim responsibility for any injury to people or property resulting from any ideas, methods, instructions or products referred to in the content. |
© 2024 by the authors. Licensee MDPI, Basel, Switzerland. This article is an open access article distributed under the terms and conditions of the Creative Commons Attribution (CC BY) license (https://creativecommons.org/licenses/by/4.0/).