Article

Unfolding the Transitions in Sustainability Reporting

HEC Lausanne, Faculty of Business and Economics, University of Lausanne, 1015 Lausanne, Switzerland
*
Author to whom correspondence should be addressed.
These authors contributed equally to this work.
Sustainability 2024, 16(2), 809; https://doi.org/10.3390/su16020809
Submission received: 7 November 2023 / Revised: 6 January 2024 / Accepted: 10 January 2024 / Published: 17 January 2024

Abstract

:
The sustainable development goals (SDGs) have been widely embraced by organizations as a sign of their commitment to sustainability. In this study, we develop a novel SDG-related bidirectional encoder representations from transformers (BERT) model, using the neural network methodology, to determine the thematic evolution of European banks’ sustainability reports. We train this model on the OSDG-CD corpus, which we extend by labeling approximately 10,000 sentences based on SDGs content. The classification capabilities of this model appear to be very effective. Analysts who use our methodology can make faster decisions about the sustainability claims of financial institutions. Our methodology can be extended to non-financial entities. By analyzing the sustainability reports of 98 listed banks covering the accounting periods ranging from 2010 to 2022, we can identify the temporal emphasis of the SDGs. By 2022, climate action had emerged as the most important focus theme. We further validate our classification methodology by establishing a strong correlation between the evolution of SDG prevalence and relevant macroeconomic indicators. We also reveal a difference in focus between various European regions. Finally, we use word counts and k-means cluster analysis to document changes in the objectives of banks by investigating their discussion content.

1. Introduction

This study aims to provide a tool to analyze how European banks’ sustainability reports disclose their commitment to addressing the Sustainable Development Goals (SDGs) established by the United Nations (UN) in 2015 [1]. For the reader’s convenience, Table A1 provides in its first two columns the objective of each SDG and its number. Sustainability per se is a broadly defined term (see [2]), and focusing on the SDGs provides guidelines on how to structure our research. In this research, we focus on a panel of European banks for various reasons. It is well known that European banks play a different role in economic growth than American banks since European non-financial companies rely mostly on banks for financing. In the U.S., in contrast, firms tend to rely on competitive stock markets for financing [3]. Since banks can orient non-financial firms’ projects, they can also play a directing role in guiding firms toward adopting sustainability-enhancing projects in addition to what the regulatory framework may impose. They can also direct households in their investment decisions and help authorities develop new projects. Since banks play such an important role, understanding their stance on SDGs is therefore a systemically relevant question. By focusing on a subset of possible countries, we also generate homogeneity in the reports. As shown in [4], the countries’ legal origin strongly affects the firms’ interest in CSR and, by extension, in the sustainable development goals.
Analysts who seek to rapidly compare reports from different companies are confronted with a large volume of information, which slows their decision-making. Our research, which is methodological in nature, aims to develop a solution for analysts and researchers in general to automate this task. Our methodology also applies to firms at large.
We contribute not only to the field at the methodological level but also to the field at the economic level. A survey paper [5] on banking reporting on sustainability asked how the introduction of Directive 2022/2464 in Europe, which requires mandatory sustainability disclosure, could affect the disclosure of banks. In 2022, the United Kingdom enacted two mandatory climate-related financial disclosure laws. Interestingly, in our research, we cover the period from 2010 to 2022, which saw the enactment of Directive 2014/95/EU in 2017 to introduce mandatory non-financial disclosure. Therefore, with our methodology, we can begin to grasp the possible consequences of the introduction of new regulations. Our findings suggest that more banks will produce specific sustainability reports. Those banks that already have nonmandatory financial disclosure on sustainability will report more. We do not anticipate, however, a change in terms of what will be disclosed. Understanding the urgency of climate-related action may, however, change the emphasis of the discussions and the policies of banks. We will not only be able to classify the various sentences according to their SDG-related content but also analyze the texts in depth to gain a better understanding of what is said.
The most closely related research to ours is [6]. These authors gathered various financial statements, such as management reports from annual reports, standalone documents, integrated reports, and other reports, for the 2017 accounting period from BankFocus. They obtained textual content for 262 banks that they analyzed manually, i.e., without the help of content analysis software. In a painstaking effort, they gathered information on the SDGs discussed and other bank-specific variables. The authors justified the necessity of manual classification by arguing that statements can be introduced by one of the 17 SDG icons rather than text. As a consequence, they claimed that their document represents the only methodological reference for combining sustainability disclosure with the SDGs. We seek to improve upon this claim by introducing a state-of-the-art text-analysis system that overcomes the challenge of automatically classifying sentences according to their SDG-related wording. This new methodology, its validation, and its first application are summarized in the next sections. By applying our methodology to sustainability reports, we can discuss additional dimensions such as changes over time regarding the emphasis of certain SDGs. To demonstrate that our methodology confirms and simplifies their approach, it should be mentioned that, by comparing the rankings of SDG popularity for our reports and for the accounting period 2017 with theirs, we obtained a highly significant correlation of 0.55. The correlation with findings from the consultancy industry is somewhat different regarding issues such as workplace, gender, and responsible consumption [7,8]. We explain this difference by the fact that the consultancy industry considers all industrial sectors and not specifically the banking sector, as we do here.
Furthermore, our ranking is in line with SDG ratings of firms in general and with ratings of banks [9]. Note that, in this latter paper, sustainability-related text is also classified manually.
In this contribution, we introduce an advanced text analysis method that is also used by Internet search engines. Before discussing its function, it is useful to briefly retrace the history of text analysis. This is not a new method; however, it has experienced explosive development in recent years due to the availability of digitized text, faster computers, and theoretical development on how to estimate neural networks (NNs), which currently provide the most powerful approach. The textbook by [10] provides a good idea of how text analysis has evolved over the years. In the early days, sentences were decomposed into their words, and those words were then counted, leading to summary statistics. In addition, thematic dictionaries with predefined wordings capturing certain themes were developed (initially, mostly in sociology). Many of the earlier applications focused on the question of whether a sentence or a text were expressed in a positive or negative tone. It became possible to construct scores to measure the relevance of certain themes. Methods for querying texts to find themes in the text were also developed. The term frequency-inverse document frequency (tf-idf) approach introduced by [11] allowed us to down-weigh overall frequent words but over-weigh words that appear in a given text. For a modern discussion, see [12,13]. Such weighted wordings are found to provide simple ways to query a text. These early approaches, also called bag-of-words methods, have several limitations. The understanding of text is very limited because the order in which words are treated is as if they were thrown in a bag unrelated to their position in a sentence. Additionally, they cannot capture groups of words such as New York. Furthermore, they cannot understand more general concepts since the order of the words does not play a role.
Modern natural language processing (NLP) techniques, notably the bidirectional encoder representations from transformers (BERT) model [14], eventually emerged. After training a model on a specific dataset, such techniques allow for the classification of sentences with great precision according to their content. The idea of those methods is to expose NNs to sentences where words are missing and to train the NN to learn the probability of missing words. In this paper, we train an existing BERT-type NN on a dataset filled with classified SDG-related topics. These training sentences are either open-source or hand-classified by us. This approach results in a cutting-edge classifier based on BERT to enhance the semantic mapping of wording within the SDG context. Our novel BERT model proves to be a valuable tool for classifying SDG-related texts in the banking sector, with an overall F1 score of 0.93. Once we have obtained a satisfactory classifier, we apply the methodology to bank sustainability reports covering the period from 2010 to 2022. This allows us to make statements about the prominence of certain SDG topics over time and over geographic regions. By investigating the content of the sentences according to the SDG classification, we can glean some understanding of how banks approach the various SDGs.
The structure of this paper is as follows. In the following section, we discuss both the relevant literature on sustainability research and the related state-of-the-art text analysis. In Section 3, we discuss the data that we use to train BERT and the data that we use to analyze our classifications. In Section 4, we discuss how we train the neural network. In Section 5, we demonstrate that our network is well trained. We then discuss which SDGs banks emphasize over time across countries, and we demonstrate that the topics discussed are related to macroeconomic variables. In Section 6, we investigate the themes that are actually discussed in the various SDGs. This further validates our methodology. Finally, we conclude in Section 7. A technical appendix contains tables of descriptive statistics. The Supplementary Materials contains detailed figures with more details related to the main tables of this paper.

2. Related Literature

This paper connects sustainability with state-of-the-art text analysis. In this section, we discuss the relevant literature. We first discuss SDG reporting and then our text classification methodology.

2.1. Sustainable Development Goal Reporting and Relevant Research

“Transforming our world: the 2030 Agenda for Sustainable Development” is a United Nations policy adopted in 2015 that aimed to tackle social, economic, and environmental challenges globally by 2030 [1]. The resulting 17 SDGs, accompanied by 169 targets, emphasize areas such as poverty, well-being, climate change, and equality, among others. The SDGs present a noticeable departure from previous leading paradigms of sustainable development, such as the Millennium Development Goals (MDGs) and the “Washington Consensus” [15]. The United Nations member states are expected to adopt the SDG framework into their strategic blueprints and to keep track of their progress toward achieving their goals during the designated time span of 15 years [16].
Sustainability reports and integrated reports are the primary sources that companies may use to highlight alignment with Agenda 2030 by reporting on the SDGs. The United Nations Global Compact (UNGC) and Global Reporting Initiative (GRI) have jointly established a platform named “Business Reporting on the SDGs” to empower organizations to integrate SDG reporting and their business processes [17,18]. Additionally, innovations in accounting practices and technologies have been suggested for the successful implementation of the SDGs [19]. However, [20] suggests that a mere 30–35% of companies have referenced SDGs in public disclosures. Similarly, [21] finds that only 16% of companies have incorporated SDGs into their reports, highlighting that firms are not keen on SDG reporting. Similar figures are reported in studies from consultancy industries [7,8].
As [22] mention, ESG issues tend to be increasingly important, and even the highest levels of management now address them. Ref. [23] discusses different approaches to addressing sustainability within the banking sector and why banks may engage in SDG activities.
The phenomenon of SDG reporting has been extensively interpreted by institutional theory, as firms need to conform to existing norms. Legitimacy theory is also favored since organizations aim to cultivate a positive public perception [21]. These differences can be attributed to the intrinsic characteristics of the banking industry, which focus on addressing issues that have a direct impact on business risk [24].
The SDGs can also guide research related to sustainability accounting and reporting, as they provide a widely accepted interpretation of sustainable development. Although the relationship between nonfinancial reporting and financial performance remains indeterminate, considering the prevalent practices of impression management and greenwashing among firms, a higher degree of SDG reporting does not inherently equate to a greater alignment with sustainable development [25]. Moreover, [26] claim that financial performance is negatively correlated with SDG adoption and reporting. Organizations with higher profitability have more resources at their disposal, which may enable them to demonstrate more commitment toward sustainability issues such as the SDGs.
Moreover, studies concerning SDG reporting have been undertaken within the banking sector. Ref. [27] employ the well-established framework of the GRI performance indicators for a comparative assessment of the non-financial performance disclosed in annual sustainability reports and find an overall low contribution to SDGs. Ref. [28] find that certain SDGs are more relevant to businesses than are others. Ref. [6] develop a compound index to evaluate the contribution provided by European banks and find that SDG 8 and SDG 13 are high-impact goals for the banking sector. Furthermore, Ref. [29] provides insights into the impact of sustainability on financial performance within the banking sector. The first paper documents a non-linear relation between ESG expenditures and bank value for banks in emerging countries. The channel for this appears to be a lower cost of equity.
Finally, it appears useful to mention the survey paper by [30]. The authors rank past research activities related to the 17 SDGs. Our research is not focused on any particular SDG; we ask more general questions: which SDGs are relevant for the banking industry, and what are banks saying when they discuss themes related to certain SDGs?

2.2. Overview of Existing Methods for SDG Classification

With the advent of ESG reporting standards, an increasing number of companies are starting to release sustainability reports. For the analysis of those reports, it is therefore essential to develop a method to accurately and reliably assign text to individual SDGs. This step is crucial, as it serves as a necessary precondition for carrying out any in-depth analysis of actions undertaken toward commitment to the SDGs. Ref. [31] propose a defined typology and characterization approach to understanding interactions between the SDGs. Furthermore, AI technology could be utilized to upgrade the semantic analysis of SDGs [32]. The initial state-of-the-art AI tool was developed by the Organization for Economic Co-operation and Development (OECD), in which [33] implemented a tree-based decision algorithm to link project-based flows to the SDGs. Moreover, [34] introduce the Open Source SDG (OSDG) project and tool, which was designed to effectively assign various forms of text, such as scientific research, research projects, technology outputs, or documents, to specific SDGs. Ref. [35] employed a gradient boosting decision tree to binarily classify SDG-related tweets on Twitter into an information class or an action class. Ref. [36] proposed using a naive Bayes classifier to divide news articles into related SDGs, and [37] used the FastText algorithm to identify whether and how firms communicate about the SDGs on social media to investigate whether they are trying to increase their legitimacy or they are linked to the firm’s core business. However, research is ongoing with the emergence of new language processing models, such as transformers and BERT [14]. Ref. [38] proposed a Japanese BERT model for semantic mapping of SDG-related practices and issues, for visualizing SDG connections based on goal co-occurrence, and for matching local challenges and potential solutions. Ref. [39] proposed a fine-tuned SDG-related BERT model to quantify the degree of correspondence of a text to an SDG.

2.3. BERT

Transformer models can process all the input data in parallel and focus on the relationships between all the elements in the sequence [40]. The architecture of BERT is a multilayer bidirectional transformer encoder [14]. Each of these encoders is composed of two sublayers: a multihead self-attention mechanism and a positionwise fully connected feedforward network. Upon adding special tokens to mark the beginning ([CLS]) and separation ([SEP]) of input sentences, the BERT model tokenizes input using WordPiece [41] as its word embedding [42]. Embedding is a convenient lower-dimensional vector representation of a word, among other words. BERT has two main tasks: the masked language model (MLM) and next-sentence prediction (NSP). The MLM is a process in which 15% of the words in each sentence are masked randomly, and the model is trained to predict these masked words based on the context of unmasked words, enabling the model’s bidirectional nature. NSP involves training the model to comprehend the relationship between sentences by predicting whether the second sentence in a pair of sentences is likely to follow the first sentence. Compared to the bag-of-word [13] and tf-idf [12] methods, BERT outperforms traditional NLP approaches [43]. Moreover, the performance of BERT on various standard datasets has demonstrated its superiority over that of previously published models. On the GLUE dataset (General Understanding Evaluation), BERT achieved average improvements of 4.5% and 7% for standard and large neural networks, respectively. On the SQuAD dataset (Stanford Question Answering Dataset), BERT achieved an F1 score of 83.1 compared to the previous best of 78.0, approaching human-level performance at 89.5. Additionally, in the SWAG test (The Situations With Adversarial Generations), BERT’s accuracy reached 86.3, outperforming human expert performance at 85.0 [14].
BERT epitomizes the application of transfer learning [44] in enhancing task-specific performance in NLP. This process involves leveraging the model pretrained on a large-scale corpus from the English Wikipedia and the Toronto BookCorpus and introducing an additional output layer designed for specific NLP tasks, which is fine-tuned with a smaller, task-specific dataset. BERT processes input sentences and produces token representations, which are subsequently directed to the additional output layers for various tasks, such as sequence tagging, question answering, and classification. Remarkably, the fine-tuning process of BERT is efficient, requiring only approximately one hour on a Cloud TPU or a few hours on a GPU [14]. An extension of BERT is the RoBERTa model [45]. The main difference between the two models is that BERT was trained on 16 GB of the Wikipedia corpus, whereas RoBERTa was trained on a more diverse corpus consisting of 160 GB of uncompressed text. This 10-fold increase explains why RoBERTa understands sentences even better than BERT does. A technical issue is that RoBERTa adopts a batch size of 8000 instead of 256, contributing to an enhancement of learning efficiency. Ref. [46] trained BERT on finance corpora and fine-tuned it for sentiment classification, which showed improvements compared to the original BERT. The authors in Ref. [47] trained BERT on biomedical corpora and found that BioBERT largely outperformed BERT on various biomedical text-mining tasks. The authors in Ref. [48] further trained the BERT model with ESG domain corpora, which can be further fine-tuned for downstream tasks. Fine-tuning BERT models on in-domain data can improve their effectiveness on downstream tasks.

3. Data

3.1. Sustainability Reports of European Banks

The sustainability reports for all European banks under investigation were collected from their official websites. The sample comprises 98 listed banks (which are presumably the most influential ones), with 816 reports covering the period from 2010 to 2022. In our analysis, we focus purely on banks and not on financial intermediaries in general. This, and our choice of studying listed banks, could explain why the sample of banks is smaller than in [6] who analyze 262 European banks. Table 1 provides descriptive statistics of all the reports utilized in this study. Notably, as the top panel shows, the volume of reports released by banks significantly increased from 60 to more than 80 in 2017, which can be explained by the fact that non-financial reporting by firms in general and for banks specifically became mandatory in 2017 following Directive 2014/95/EU. Possible encouragement of the Task Force on Climate-related Financial Disclosures (TCFD) may also have contributed to this increase in reporting. In the lower panel, we categorize banks into four geographical groups: Central and Eastern Europe, Western Europe, Northern Europe, and Southern Europe, which allows for further nuanced geographical analyses. This regional grouping adheres to the classification system employed by the Publications Office of the European Union. We note that, despite the lower number of banks present in Northern Europe than in Central and Eastern Europe, the volume of sustainability reports originating from Northern European banks exceeds that from Central and Eastern European banks over the span of 13 years. This discrepancy could indicate a more advanced integration of sustainability principles within the Northern European banking sector, thereby leading to more extensive disclosure of corporate transparency in this region. All the reports are provided in the Portable Document Format (PDF) and are converted to text files using the “pdftotext” package in Python 3.11. Each text file was encoded in UTF-8 format and meticulously verified to verify successful conversion.

3.2. Input Dataset for the Fine-Tuned BERT Model

To fine-tune the RoBERTa model to enhance comprehension of SDG-related wording in the banking sector, we use labeled data from both UN-related sources and banks’ sustainability reports. The UN-related dataset, comprising both the OSDG Community Dataset (OSDG-CD) and manually annotated texts from UN reports, is utilized to train our novel BERT model with the specific linguistic patterns associated with the SDGs. We also include texts from banks’ sustainability reports, which allows the model to capture the linguistic nuances within the banking sector when addressing SDGs, thereby improving its performance in banking-specific contexts. Table A1 in the Appendix A shows a sample of labeled sentences classified into 17 SDG categories and an unrelated category with the number 0. This last category includes sentences that are unrelated to any of the other SDGs. The inclusion of this category is necessary to allow the neural network to detect non-SDG sentences.
The OSDG-CD database contains labels for determining the quality of the classification and information on the number of reviewers. We filter this dataset by requiring a consistency rate of 100%, and we take only those sentences that have been reviewed by at least five OSDG volunteers. This choice should guarantee that the data are as reliable as possible. Additionally, we manually labeled 9736 sentences from banks’ sustainability reports. This effort required more than 240 h of work. At this stage, we randomly selected 7576 sentences from the 9736 sentences that we combined with the UN-related dataset. In total, 19,617 sentences are used as inputs for fine-tuning the pretrained RoBERTa model to learn how to determine the probability that a given input sentence refers to a certain SDG topic. If a sentence refers to more than one SDG, we retain the one to which the RoBERTa model associates the highest probability.
We split these aggregated data into training and validation sets with a splitting ratio of 80:20. The remaining 2160 sentences of Bank reports are set aside as unseen data to test the performance of our novel RoBERTa model. We test our RoBERTa model on actual bank reports rather than on some of the OSDG-CD sentences since this is the focus of our research.
Table 2 presents the statistics of the input dataset used for model fine-tuning. We obtain a correlation between the OSDG-CD sentences and our classified sentences of 0.44, which indicates that banks’ reports are similar to the OSDG-CD dataset but not identical. We believe that this complementarity is useful for training the RoBERTa model. As this table shows, SDGs 16 (governance), 5 (gender equality), and 4 (education) are particularly prominent among the OSDG-CD dataset, and SDGs 4 (education), 3 (health), and 12 (responsible consumption) are particularly prominent in our sentences.
Since the training dataset is imbalanced, this could skew the performance of our model. We address this imbalance by recalculating the class weight, emphasizing classes with fewer labeled texts. Further details regarding this procedure can be found in Section 4.1.1.

3.3. Government, Macroeconomic, Healthcare, and Climate-Related Factors

To validate our classification method, we decided to correlate the prevalence of the various SDGs with macroeconomic indicators via regression analysis. For this purpose, Table A2 enumerates each factor’s name and corresponding sources. The chosen factors include government expenditures, macroeconomic indicators, healthcare statistics, and climate-related parameters. This dataset is specific to each European country and is annualized. For the reader interested in the details of those variables, we aggregated the data across the European regions. These metrics are collected from global institutions such as the World Bank (WB), the International Monetary Fund (IMF), and the United Nations Economic Commission for Europe (UNECE).

4. Methodology

4.1. Novel BERT Model

Our goal is to match sentences to the 17 SDGs or to indicate that there is no match. For this purpose, we obtained the BERT and RoBERTa frameworks, which we trained on several question-and-answer datasets. This allowed us to confirm that RoBERTa indeed does a better job of classifying sentences. For this reason, we retained the RoBERTa model. At this stage, we trained our RoBERTa model on a labeled dataset from the OSDG-CD and performed further training on manually annotated texts derived from the bank’s sustainability reports. This approach is inspired by [49], who propose conducting supplementary fine-tuning on a larger, intermediate dataset (OSDG-CD) before fine-tuning on a few-sample dataset (here, the manually annotated dataset). Their study showed that transferring models that were fine-tuned on Multi-Genre Natural Language Inference (MNLI) [50] can lead to significant improvement in downstream tasks.

4.1.1. Data Preprocessing

We begin by transforming our raw input dataset into a format processable by the RoBERTa model. The original tabular dataset is loaded into a pandas DataFrame. Subsequently, we employ the “batch_encode_plus()” function of “RobertaTokenizerFast” from the Hugging Face transformers library to convert our textual data into a numerical form that the RoBERTa model can process, called embedding. Each sentence is tokenized with a maximum sequence length of 512 tokens. Next, we package the tokenized data with corresponding labels into PyTorch tensors and pass them to “DataLoader” with a specific “Sampler.” For the training data, we employ a “RandomSampler” to shuffle the data. For the validation data, we employ a “SequentialSampler” to feed in the data in the original order. Finally, to address the issue of the imbalanced training dataset, we use the “compute_class_weight” function from the sklearn library to recalculate the class weights. By setting the “class_weight” parameter to “balanced,” the function adjusts weights inversely proportional to the class frequencies to assign higher importance to the minority classes during the training. The adjusted class weights are then converted to a PyTorch tensor and pushed to the graphics processing unit (GPU), ensuring that they are available in the subsequent training. We use the Python language and associated packages.

4.1.2. Fine-Tuning RoBERTa

We utilize the benefits of pretrained weights of the RoBERTa model on a large English language corpus. To help the pretrained RoBERTa model comprehend domain-specific vocabulary, we fine-tune it on the SDG corpus to help the model study the nuance of SDG-related content.
We start by loading the pretrained RoBERTa model, wherein we freeze the original 12 encoders to preserve its knowledge. Next, in transfer learning, we add a novel architecture on top of the RoBERTa model, which is trained to adapt the model to the characteristics of SDG-related content. This new architecture comprises a five-layer neural network, including a fully connected layer increasing the dimension from 768 to 1024, a dropout layer to prevent overfitting [51], a hyperbolic tangent (tanh) activation function, another fully connected layer reducing the dimension to 18, and a LogSoftmax layer.
Upon defining the above architecture, we employ the AdamW optimizer and a learning rate scheduler from the transformer library. Weight decay is a common regularization technique used in training machine learning models to prevent overfitting [52]. AdamW, an improved version of the popular Adam algorithm, was introduced by researchers at OpenAI [53]. This is also the company behind ChatGPT. AdamW enhances the efficiency of weight decay by applying it directly to the weights instead of through the optimization step, making the effect of weight decay independent of the learning rate. Moreover, the learning rate scheduler dynamically adjusts the learning rate through a warmup phase throughout the training process. We use the “get_linear_schedule_with_warmup” function from the transformer library, which is particularly effective when training a transformer model such as BERT [40].
In the fine-tuning phase, we implement training and validation loops. The model iterates over batches of data from the training data loader. Each batch is pushed to the GPU and split into data (sentence ID and attention masks) and labels. We proceed by performing a forward pass of the model to obtain the predictions. Next, we perform backpropagation to compute the gradients of the model parameters and apply gradient clipping to avoid exploding gradients. Afterward, we update the model parameters with the optimizer’s step function. Upon completing each epoch, we compute the average loss and concatenate the predictions from all batches. We incorporate the aforementioned adjusted weights into the negative log-likelihood loss function (NLLLoss). This ensures a balanced consideration of all classes, thereby leading to more robust and unbiased model performance. In the validation phase, we track the model’s performance on unseen data and record the validation loss. Additionally, we adjust the learning rate scheduler to ensure that the learning rate evolves with the model’s training progress. Eventually, we retain the best-generalized model that yields the highest validation accuracy, thereby allowing us to ready reliable future predictions on unseen data.

4.2. Utilizing the Novel RoBERTa Model for Report Classification

We employ the retained RoBERTa model for classifying texts in banks’ reports into SDG topics. The classification involves two main steps: encoding sentences and predicting the topic.
After breaking down each report into sentences, the RoBERTa tokenizer encodes the sentences to the sentence ID and attention masks, which are the inputs for the BERT model. All the encoded sentences are matched in size with the model’s architecture through padding or truncation to a maximum length of 512 tokens (that is, words such as “paper” or groups of words with a specific meaning such as “New York”.) Subsequently, we feed the encoded sentences into our novel RoBERTa model, which runs in the evaluation mode to generate predicted labels without calculating gradients. The output from the model is a set of logits that are subsequently passed to a softmax function to generate the probabilities corresponding to the various SDGs. The SDG with the highest probability is identified as the predicted SDG for the sentence. This process repeats for each report, resulting in a collection of CSV files, each containing all the sentences in the report and their predicted topic with the associated probability. At this stage, the collection of CSV files can be further analyzed in terms of their economic content.

5. Results

5.1. Performance of Our Novel RoBERTa Model

The performance of the classification task on each SDG was evaluated using precision, recall, and the F1 score. Precision measures the number of true positives relative to the total number of predicted positives. Recall measures the number of true positives in the total number of true positives. F1 is the harmonic mean between precision and recall scaled in such a manner that this statistic ranges from 0 to 1. A higher score corresponds to a better classification. Accuracy measures the number of correct predictions out of the total number of predictions. The macroaverage is the average accuracy across all possible classes. As shown in Table 3, the accuracy (accu.), and the macro average (m.avg.) all reached 0.93, demonstrating that our model can differentiate texts across various SDGs effectively.
The best F1 score is obtained for SDGs 2, 6, and 13, followed by marginally lower scores for SDGs 1, 3, and 9. Overall, the classification is very satisfactory for all SDGs. The worst performer is SDG 10, with a score of 0.81, which is still respectable. We verified that the quality of the prediction was unrelated to the training sample.

5.2. Evolution of SDG Prevalence over Time

To gain insights into the prevalence and evolution of each SDG, for each report, we sum the total number of words for all sentences classified under a given SDG. This provides a score of the degree to which each SDG is discussed. For a given report, all the SDGs are then ranked according to this score. This ranking serves as an indicator of the incidence of each SDG, with a ranking of 1 denoting the most prevalent topic.
The first exercise is to investigate how often a given SDG has been discussed over time. To do so, we consider the matrix indicating for each report the ranks for all SDGs over time. We then obtain the median of all the reports for a given year. We focus here on the median, which is a robust measure. In the Supplementary Materials, we provide box plots for each SDG and its temporal evolution. This allows for a more detailed analysis of the minimum, maximum, and interquartile frequency of each SDG across reports.
Table 4 shows how the 17 SDGs evolved from 2010 to 2022. The most discussed SDGs are displayed in red, and the least discussed ones are in green. There are several striking features. We notice very homogenous patterns over time for a few of the SDGs and structural changes around the fiscal years 2019 and 2020 for others. As mentioned in the literature, for 2017, the hierarchy of relevance was significantly correlated with the results found in the literature [6]. Here, we are able to extend those results to the entire time period of 2010–2022.
If we focus first on 2010, the most frequently discussed SDGs are 8 (work), 12 (responsible consumption), 17 (partnerships), 9 (industry), and 16 (peace, justice). However, by 2022, the most discussed SDGs were 13 (climate action), 12, 7 (clean energy), 17, and 16, which reveals, as expected, the relevance of environmental issues. The consistently high ranking of SDG 17 aligns with the insights provided by [23]. They suggest that shareholder and lender engagement, which are often encapsulated within the framework of SDG 17, play a crucial role in steering industries toward a more sustainable trajectory. The least frequently mentioned SDGs in 2010 were 10 (inequalities), 14 (life below water), 1 (poverty), 6 (clean water), and 2 (hunger). Interestingly, in 2022, according to our methodology, those SDGs remain the least mentioned ones.
We can now focus on possible structural changes over time. We notice that the ranking (and therefore also the colors) changes very little for the fiscal year 2017 when the EU Directive 2017/95 became mandatory. Since we are investigating the sustainability reports of listed banks, we interpret those findings to mean that banks produced more reports from that year on; see Table 2. The content reported, however, remained homogeneous. Banks that started producing reports likely found inspiration in content from their peers. An investigation of the shape of the entire distribution of ranks for a given SDG is provided in Supplementary Materials, confirming our findings. In particular, the standard deviation of ranks did not change over time, demonstrating that banks did not report in a more homogenous manner.
Our prediction concerning the mandatory sustainability disclosure Directive 2022/2464 is that banks will produce more reports, possibly longer ones, but that the content of the discussion will not necessarily be affected.
As shown in Table 4, between 2018 and 2019, there was a jump in the ranking of SDG 13 related to climate change. Between 2019 and 2022, this topic became even more discussed. This increase in discussion of SDG 13 coincides with the publication by the EU of a supplement to the 2017 guidelines on nonfinancial reporting on climate-related information. This applies to financial institutions with more than 500 employees, which is the case for our listed banks.
We also note that, since 2019, with the unprecedented health crisis due to the COVID-19 pandemic, structural changes have occurred among several SDGs. As the rank of some of the SDGs improved, in parallel, the rank of others decreased. The SDGs gaining in popularity are 3 (health), 7 (energy), 13 (climate), and 15 (life on land), whereas SDGs 4 (education), 8 (work), 9 (industry), and 17 (partnership) dropped in ranking. These findings show that not only the relevance of climate- and energy-related issues increased but also health concerns as individuals shifted to working from home to adapting to the new situation. These findings are consistent with the studies by [6,54]. They also match [55,56,57], who suggest that the unprecedented health crisis due to the COVID-19 pandemic and its economic effects necessitate a reevaluation of banks’ priorities concerning the SDGs in response to urgent health needs (SDG 3) and economic disruptions (SDGs 8 and 9). Ref. [55] address the impact of the COVID-19 pandemic on GDP, income, and exports, pointing out the critical role of banks in supporting healthcare and economic recovery.
To strengthen the validity of these arguments, we carry out regression analysis to explore the relationships between the prevalence of SDGs and various indicators.

5.3. Regression Analysis

Encouraged by these reasonable findings, we propose that one could attempt to further validate our methodology by relating the changes in SDG levels that indeed change over time with some macroeconomic variables. Since some of the SDGs, such as SDG 6, remain constant, it appears futile to try to explain them by some variables. For this purpose, we decided to carry out regression analysis to explore the relationship between the prevalence of SDGs and various indicators. In those OLS regressions, the incidence of an SDG is the dependent variable, and variables such as health status and climate-related indicators are the left-hand variables. Note that we do not imply causal direction in our regressions. We view those regressions more like correlations with statistical significance.
To enable the reader to perform an easier comparison of the impact of a unit change in an explanatory variable, we studentize the dependent variable by subtracting the mean and dividing it by the standard deviation.
The results are presented in Table 5. Current health expenditure has a significant direct correlation with the prevalence of SDG 3, aligning with the increasing focus on SDG 3 to support public health during the pandemic. In Table 5, a positive coefficient indicates that an increase in a right-hand-side variable leads to a greater prevalence of the SDG, i.e., a better rank (1 being the best).
The next regression relates SDG 7 (energy) to the energy intensity level, which is a measure of how much energy is required to produce a unit of output (measured by GDP). As Table A4 from the Appendix A demonstrates, due to energy-improving technology, this measure decreased between 2010 and 2020. Another opportunity for banks to contribute to green industries is through supporting large-scale renewable energy projects addressed by SDG 7 [58]. This also corresponds to a rising emphasis on renewable energy, as shown in Table A4, which indicates that the growth rate for the renewable energy share in the total final energy consumption has more than doubled in 2020. The parameter estimator of the second regression in Table 5 confirms that banks also talked much more about this topic.
Next, in this table, we find the regression concerning SDG 8 (work and growth). SDG 8 fell from being top-ranked in 2010 to being 7th-ranked in 2022. For these SDGs, we were able to find three potential explanatory variables: a measure of CO 2 emissions, one on employment, and one on low carbon technology. Since CO 2 emissions fell and unemployment decreased during the period of 2010–2020, the prevalence of SDG8 also decreased. For instance, as Table A5 reveals, unemployment at the European level fell from 8.9% to 5.7% by 2020. We are also able to corroborate the evolution of SDG 8 by finding that an increase in the trade of low-carbon technology products leads to a decrease in the focus on SDG 8.
In Columns 6 and 7 of Table 5, we relate SDG 9 (industry), a decreasingly popular SDG, with expenditures on economic affairs and expenditures on housing and community amenities. SDG 9 is negatively influenced by expenditures on economic affairs but positively influenced by expenditures on housing and community amenities. The outbreak of the pandemic led banks and governments to prioritize economic affairs to address immediate financial crises. Conversely, funds allocated for housing and community amenities were redirected to urgent pandemic-related needs.
In the last column, we find the relation between SDG 13 (climate action) and greenhouse gas emissions. SDG 13 represents the strategic effort of banks to mitigate climate-related financial risks [23]. Table 5 shows that a reduction in GHG emissions is accompanied by a heightened focus on SDG 13.
Overall, the high statistical significance of the parameters appears to validate our classification methodology.

5.4. Regional Differences

To delve into sustainable progress within the European Union, it is crucial to highlight regional disparities. To provide a more comprehensive understanding of the significant shifts in key SDGs over time, we further segmented all the reports into four geographic groups: western, northern, southern, and central and eastern Europe. In Table 6, we follow the same color code as in Table 4, with red (green) being the most (least) mentioned SDG. As we immediately notice, within some of the categories, there exist different regional nuances. Western, southern, and central and eastern Europe witnessed a remarkable surge in the ranking of SDG 3 (health). This increase suggests that heightened attention should be given to healthcare concerns during the outbreak of the COVID-19 pandemic in 2020. However, northern Europe displayed a conservative increase. This observation aligns with the level of healthcare services across European regions, as evidenced by the data presented in Table A3. Northern European countries have demonstrated extensive public health coverage. Such well-established healthcare conditions likely mitigated the potentially disruptive effects of the outbreak of the COVID-19 pandemic at the start of 2020, thereby maintaining the relative stability of the focus on SDG 3 in Northern Europe. SDG 13 (climate) demonstrated a continuous upward trend from 2019 onward. The most substantial increase was observed in Central and Eastern Europe. This increase can be related to the changes in greenhouse gas (GHG) emissions shown in Table A6. Over the period from 2017 to 2021, GHG emissions decreased by 22% for Northern European countries which had already a low level of GHG emissions. For western and southern Europe, the corresponding variations are −11% and −13%. Unfortunately, for central and eastern countries, the change is +9%. Also, this is starting from the highest level in Europe. The year 2021 marked a distinct divergence in government expenditures on environmental protection within the EU. While other EU regions cut back on their environmental spending, central and eastern Europe was the only region in which spending was bolstered, denoting an enhanced commitment to climate action within this region. This coincides with a sharp increase in the prevalence of SDG 13 for those countries.

6. Content Analysis of the Various SDGs

Thus far, we have investigated the overall prevalence of the various SDGs. In this section, we aim to further analyze which themes these SDGs are related to. Banks can be interested in improving their own behavior, or they can do so by their actions toward their lenders, depositors, or investors. For this purpose, in this section, we rely on word counts and a more sophisticated algorithm that finds clusters among sentences of similar meaning. Let us briefly discuss these two approaches.

6.1. Word Counts and k-Means

As a first analysis of the evolving trends of particular words within each SDG, we take the total set of sentences for a given year, for all banks, and for a predetermined SDG. We retain the most frequent words and place them in a figure for each year; see Figure A1. Next, we implement the k-means algorithm, which consists of grouping the sentences into baskets. For further details on this algorithm and its implementation in the context of textual analysis, please refer to Appendix B. Since a graphical representation of the resulting clusters of sentences is challenging, we considered clusters of sentences and manually matched the words previously retained by associating colors with the different clusters. We also provided intuitive labels for the clusters, which can be found at the bottom of Figure A1. Whenever words appear systematically over several years, we join those words with lines to graphically highlight trends.
Note that the k-means classification determines the number of required clusters to encompass all the information in the data to a reasonable degree. Since the algorithm used detects the optimal number of clusters, the number of themes detected changes over time. For instance, we obtain only four clusters for SDG 4 (education) but seven clusters for many other SDGs, such as SDG 13.
Since we both work with the word counts and with the clustering of sentences, some of the content of the clustered sentences will be incorporated in the discussion of the word counts.

6.2. Trends in the Wording within SDGs

Figure A1 shows the 17 plots with the temporal evolution of wording. Even though we also present the evolution of less mentioned SDGs, namely 1, 2, 6, 10, 11, and 15, we will focus our discussion on SDGs where there has also been a noticeable structural change since 2019. These are SDGs 3, 7, 8, 9, and 13.

6.2.1. SDG 3

SDG 3 focuses primarily on partnerships with healthcare organizations and on employee well-being, both of which involved adapting to the outbreak of COVID-19 but returning to general healthcare issues later, mirroring the decline of its ranking to the pre-pandemic level from 2020 to 2022, as presented in Table 4.
Financial partnerships have consistently gained significant attention, albeit with nuanced shifts in specific focuses over time. In earlier years, philanthropic endeavors were prominent, especially those targeting children. The collaborations also concerned national health programs, upgrading healthcare infrastructure, health insurance, medical research, and accessibility of medical services. Subsequently, the discussion expanded to include early detection and prevention, emphasizing regular health check-ups, vaccinations, and awareness campaigns. The outbreak of COVID-19 in 2020 pivoted attention to combating the virus, including donating medical equipment and supporting related research. In 2021, the focus extended to personalized care and community outreach with the rise of telemedicine, virtual care, and new diagnostic centers. By 2022, attention had returned to improving medical systems.
In addition, employee well-being was another priority and gained particular attention during the pandemic. Initially, the emphasis was on health and safety guidelines at the workplace. With the outbreak of COVID-19 in 2020, the emphasis moved to flexible working hours and remote work options to combat the virus. In response to updated guidelines from health authorities, banks imposed travel restrictions, quarantine measures, and physical workspace rearrangements.

6.2.2. SDG 7

SDG 7 encapsulates adaptive investments and funding mechanisms in response to changing energy and environmental challenges. In the early years, the focus was on the development and capacity of renewable energy resources, from wind and hydroelectric power to a broader spectrum of renewable sources, such as solar photovoltaic systems, energy from waste, and biomass technologies. From 2015 onward, financial support for energy efficiency, especially in operations and infrastructure, took center stage, including initiatives to optimize heating, ventilation, and air conditioning (HVAC) systems, lighting, and machinery. Concurrently, banks introduced green loans and other tailored financial products to support renewable and energy-efficiency projects.
Furthermore, since 2020, there has been a shift to a detailed breakdown of energy consumption and emissions. Banks categorized their energy and emissions according to their energy consumption patterns (heating, power generation, vehicle, etc.), types of emissions (Scope 1, 2, and 3), sources of emissions (fuel, propane gas, natural gas, diesel, electricity, etc.), measurements of emissions (energy intensity), and efforts to reduce emissions (LED lighting, equipment upgrades, use of electric vehicles, etc.).

6.2.3. SDG 8

In regard to SDG 8, the focus shifted toward a holistic view of employment, adapting to evolving societal norms, technological advancements, and the global work landscape. Initially, the discussions were rooted in basic concerns, such as turnover rates, work arrangements, absenteeism, and workforce demographics. Later, the discussion became more structured, emphasizing career development, work–life balance, and ethical considerations, such as flexible work arrangements, internal mobility, training, inclusivity, and compliance with labor standards. Since 2019, the discussion has expanded to address employee mental health, employer reputation, and ensuring a sense of belonging within the workplace. In response to the digital revolution, skill development pivoted toward digital competencies. From 2020 onward, discussions began to highlight employment statistics, the retention and attraction of skilled professionals, and the importance of job creation.

6.2.4. SDG 9

Moving on to SDG 9, banking operations have been adapting to technological advancements and becoming more user-friendly and efficient; as stated by [59], while banks are not major polluters, there is a need for them to digitize internal processes for cost efficiency and to develop new products and services. Initially, the focus was on Internet access, wireless connectivity, and IP telephony, laying the groundwork for online features such as e-banking, virtual trading, and e-commerce. As the years progressed, banks leaned more toward mobile banking and digital marketing, introducing advanced features such as NFC payments, electronic signatures, and voice biometrics, as well as adopting strategies such as search engine optimization (SEO), affiliation marketing, and programmatic advertising. Starting in 2017, digital transformation became pivotal, which involved embracing technologies such as blockchain, big data, machine learning, cloud computing, application programming interfaces (APIs), the Internet of Things (IoT), and AI-powered voice bots. Concurrently, the focus was on data protection and cybersecurity, incorporating features such as secure mobile payments, mobile authorizations, blockchain for tracking trade transactions, and fingerprint authentication. Furthermore, a customer-centric approach has always been essential in banking. Data collected from customer relationship management (CRM) solutions helped to anticipate customer demands and offer tailored solutions for clients. There has also been growing recognition of the potential impacts of quantum computing.
In addition, banks have been continually providing financial support to both well-established companies and innovative start-ups across sectors such as automation, robotics, life sciences, neuroscience, and MedTech. Moreover, banks have entered strategic partnerships with tech giants such as Amazon, Google, Microsoft, and SAP. Since 2017, their collaborations have expanded to include FinTech firms, research centers, and global incubators.

6.2.5. SDG 13

For SDG 13, the central emphasis was on climate change. In the early years, there was an urgency to address climate change, leading to the creation of related committees and steering groups. Concurrently, collaborative endeavors among banks, non-governmental organizations (NGOs), and governmental agencies were evident. Subsequently, the emphasis moved toward disclosure and transparency, with the Carbon Disclosure Project (CDP) and GHG Protocol playing an instrumental role. Since 2015, the introduction of the Task Force on Climate-related Financial Disclosures (TCFD) has helped such reporting become more standardized. Banks also reacted actively to mitigate climate impacts. For instance, banks provided philanthropic support for climate-related research and adopted lending policies that prevented financial support to companies that evolved from significant environmental risks. The term “carbon footprint” was employed strategically, with banks starting to manage their emissions impact and create financial instruments or funds specifically aimed at climate-friendly projects. Since 2015, many banks have signed global commitments, such as the Global Investor Statement on Climate Change and the Paris Pledge for Action. Using 2 °C and 4 °C climate scenarios as references for the global temperature increase targets set in the Paris Agreement, banks evaluated the potential impact of climate change on their portfolios.
Since 2019, “climate risk” has gained prominence and been integrated into core business and risk management frameworks. Many banks utilize recommendations from the UN Environment Program Finance Initiative (UNEP FI), Financial Stability Board, and TCFD to refine methodologies for assessing climate risks, scenario modeling, and stress tests in evaluating the potential impact of climate change on portfolios and strategies. In addition, governance mechanisms were set to define principles for engagement, set risk appetites, and oversee implementation. Both current exposures to climate-related risks and forward-looking assessments of potential impacts were utilized for scenario-based approaches. The Network for Greening the Financial System (NGFS) offered a standard framework for scenario pathways that highlights both transition and physical risks. Specialists in hydrology, meteorology, and probabilistic modeling work on assessing physical risks. Renowned transition plan assessment techniques, such as the Transition Pathway Initiative (TPI), CDP, Assessing Low Carbon Transition (ACT), Climate Action 100+, and TCFD, were integrated into risk assessment procedures. Furthermore, banks actively participated in the European Central Bank’s climate risk stress tests. The United Nations Climate Change Conference (COP27) in 2022 emphasized the need for immediate climate action, marking the EU’s commitment to climate neutrality despite energy crises.

7. Conclusions

In this study, we examine the European banks’ commitment to the SDGs as presented in their sustainability reports. We leverage a state-of-the-art BERT model to classify the content of 816 bank sustainability reports into 17 SDGs. Our novel BERT-based classifier, which achieved an overall F1 score of 0.93, proves to be a reliable tool for our research.
After classifying each sentence of each bank sustainability report over the 2010–2022 accounting period, we first investigate the temporal evolution of the prevalence of the 17 SDGs. The first step is to confirm the ranking of SDG prevalence previously generated in the literature [6] who examine, however, only a single year of reports and use manual classification. We find that banks mention certain SDGs relatively infrequently; see SDG 1 (poverty), 2 (hunger), 6 (water), 10 (inequality), 14 (life below water), and 15 (life on land). The consequence of neglecting those factors has already been discussed [23]. Some of the SDGs are often mentioned throughout the period; see SDG 8 (work), 9 (industry), 12 (responsible consumption), 16 (strong institutions), and 17 (partnership for the goals). We also notice the emergence of certain themes, particularly those related to the individual, the environment, and the climate. We find that SDG 3 (health) experienced a notable increase in rank in 2020 and then returned to its prepandemic level by 2022, indicating a significant but transient impact of the pandemic on banks’ attention on health issues. Additionally, we note that SDG 7 (clean energy) and 13 (climate action) experienced a jump in 2019.
Then, by using regression analysis, we confirm for those SDGs that experienced temporal evolution that macroeconomic indicators are correlated with this evolution. Next, we consider again the classification of the SDGs, but in addition, we introduce a regional distinction. This new dimension reveals that, for climate action, southern as well as central and eastern European countries lagged behind western and northern Europe. However, since 2019, these countries have undergone remarkable advances in this SDG. This coincided with particular financial campaigns at the EU level.
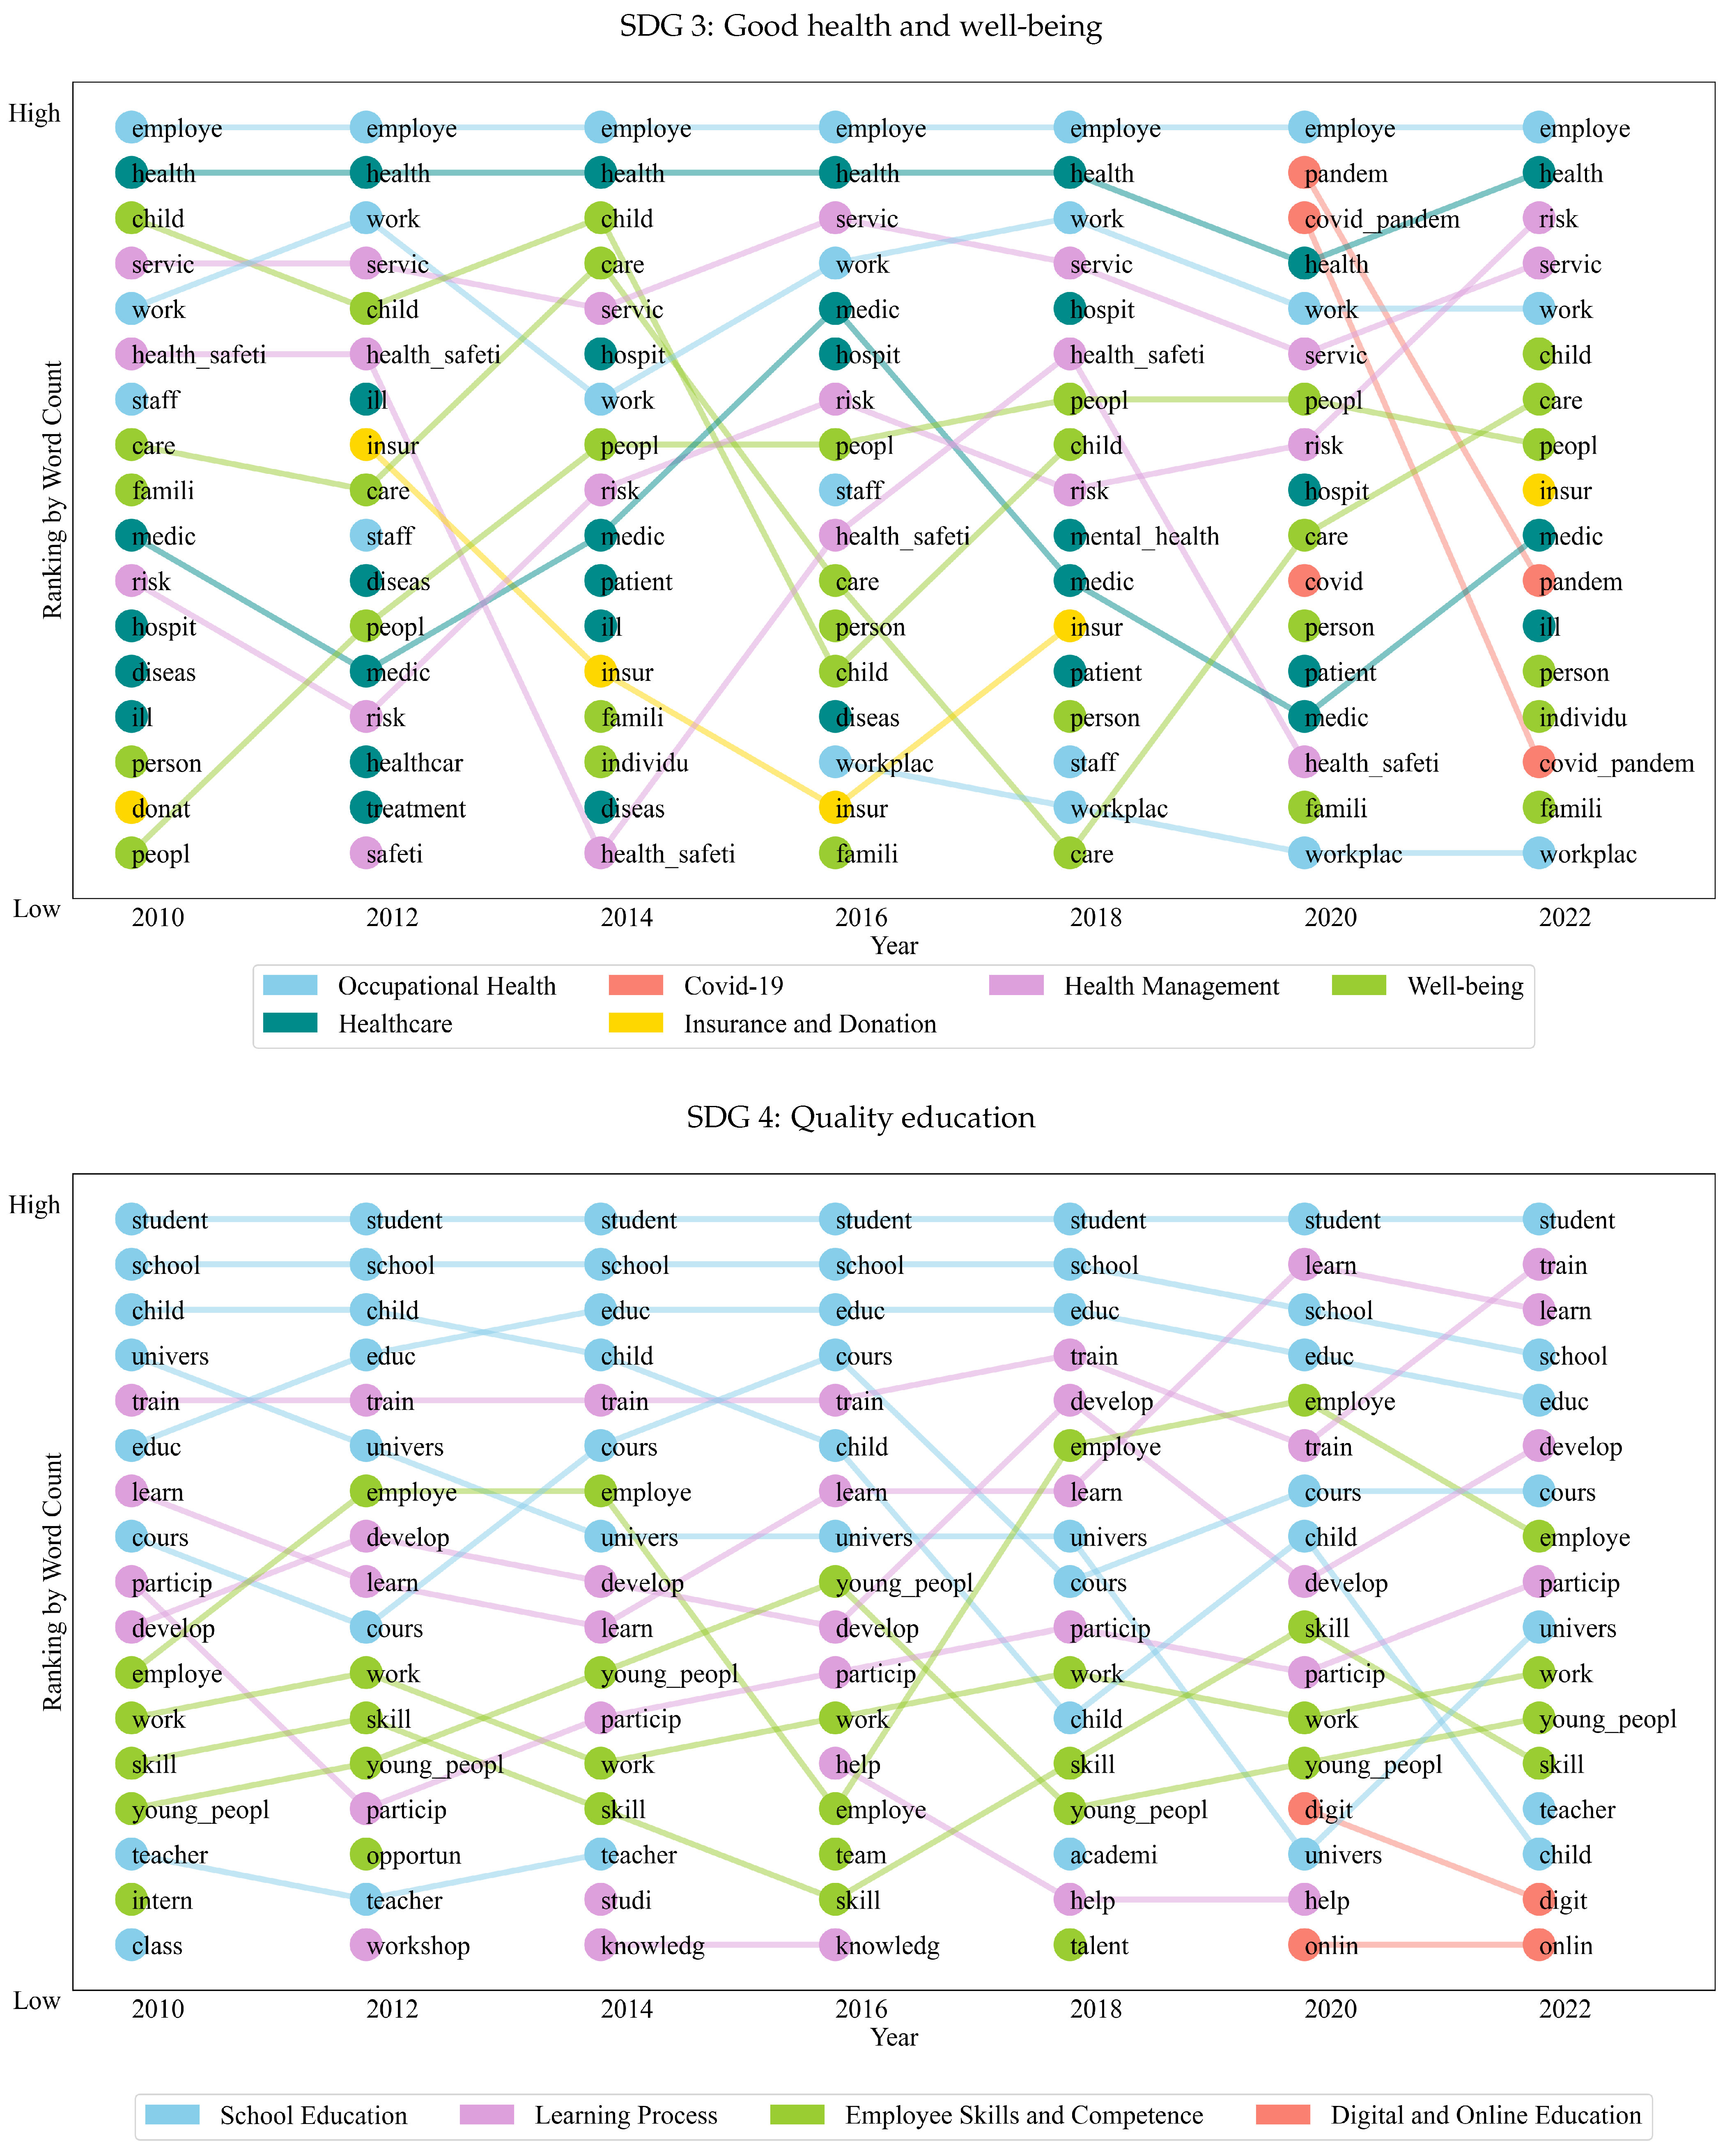
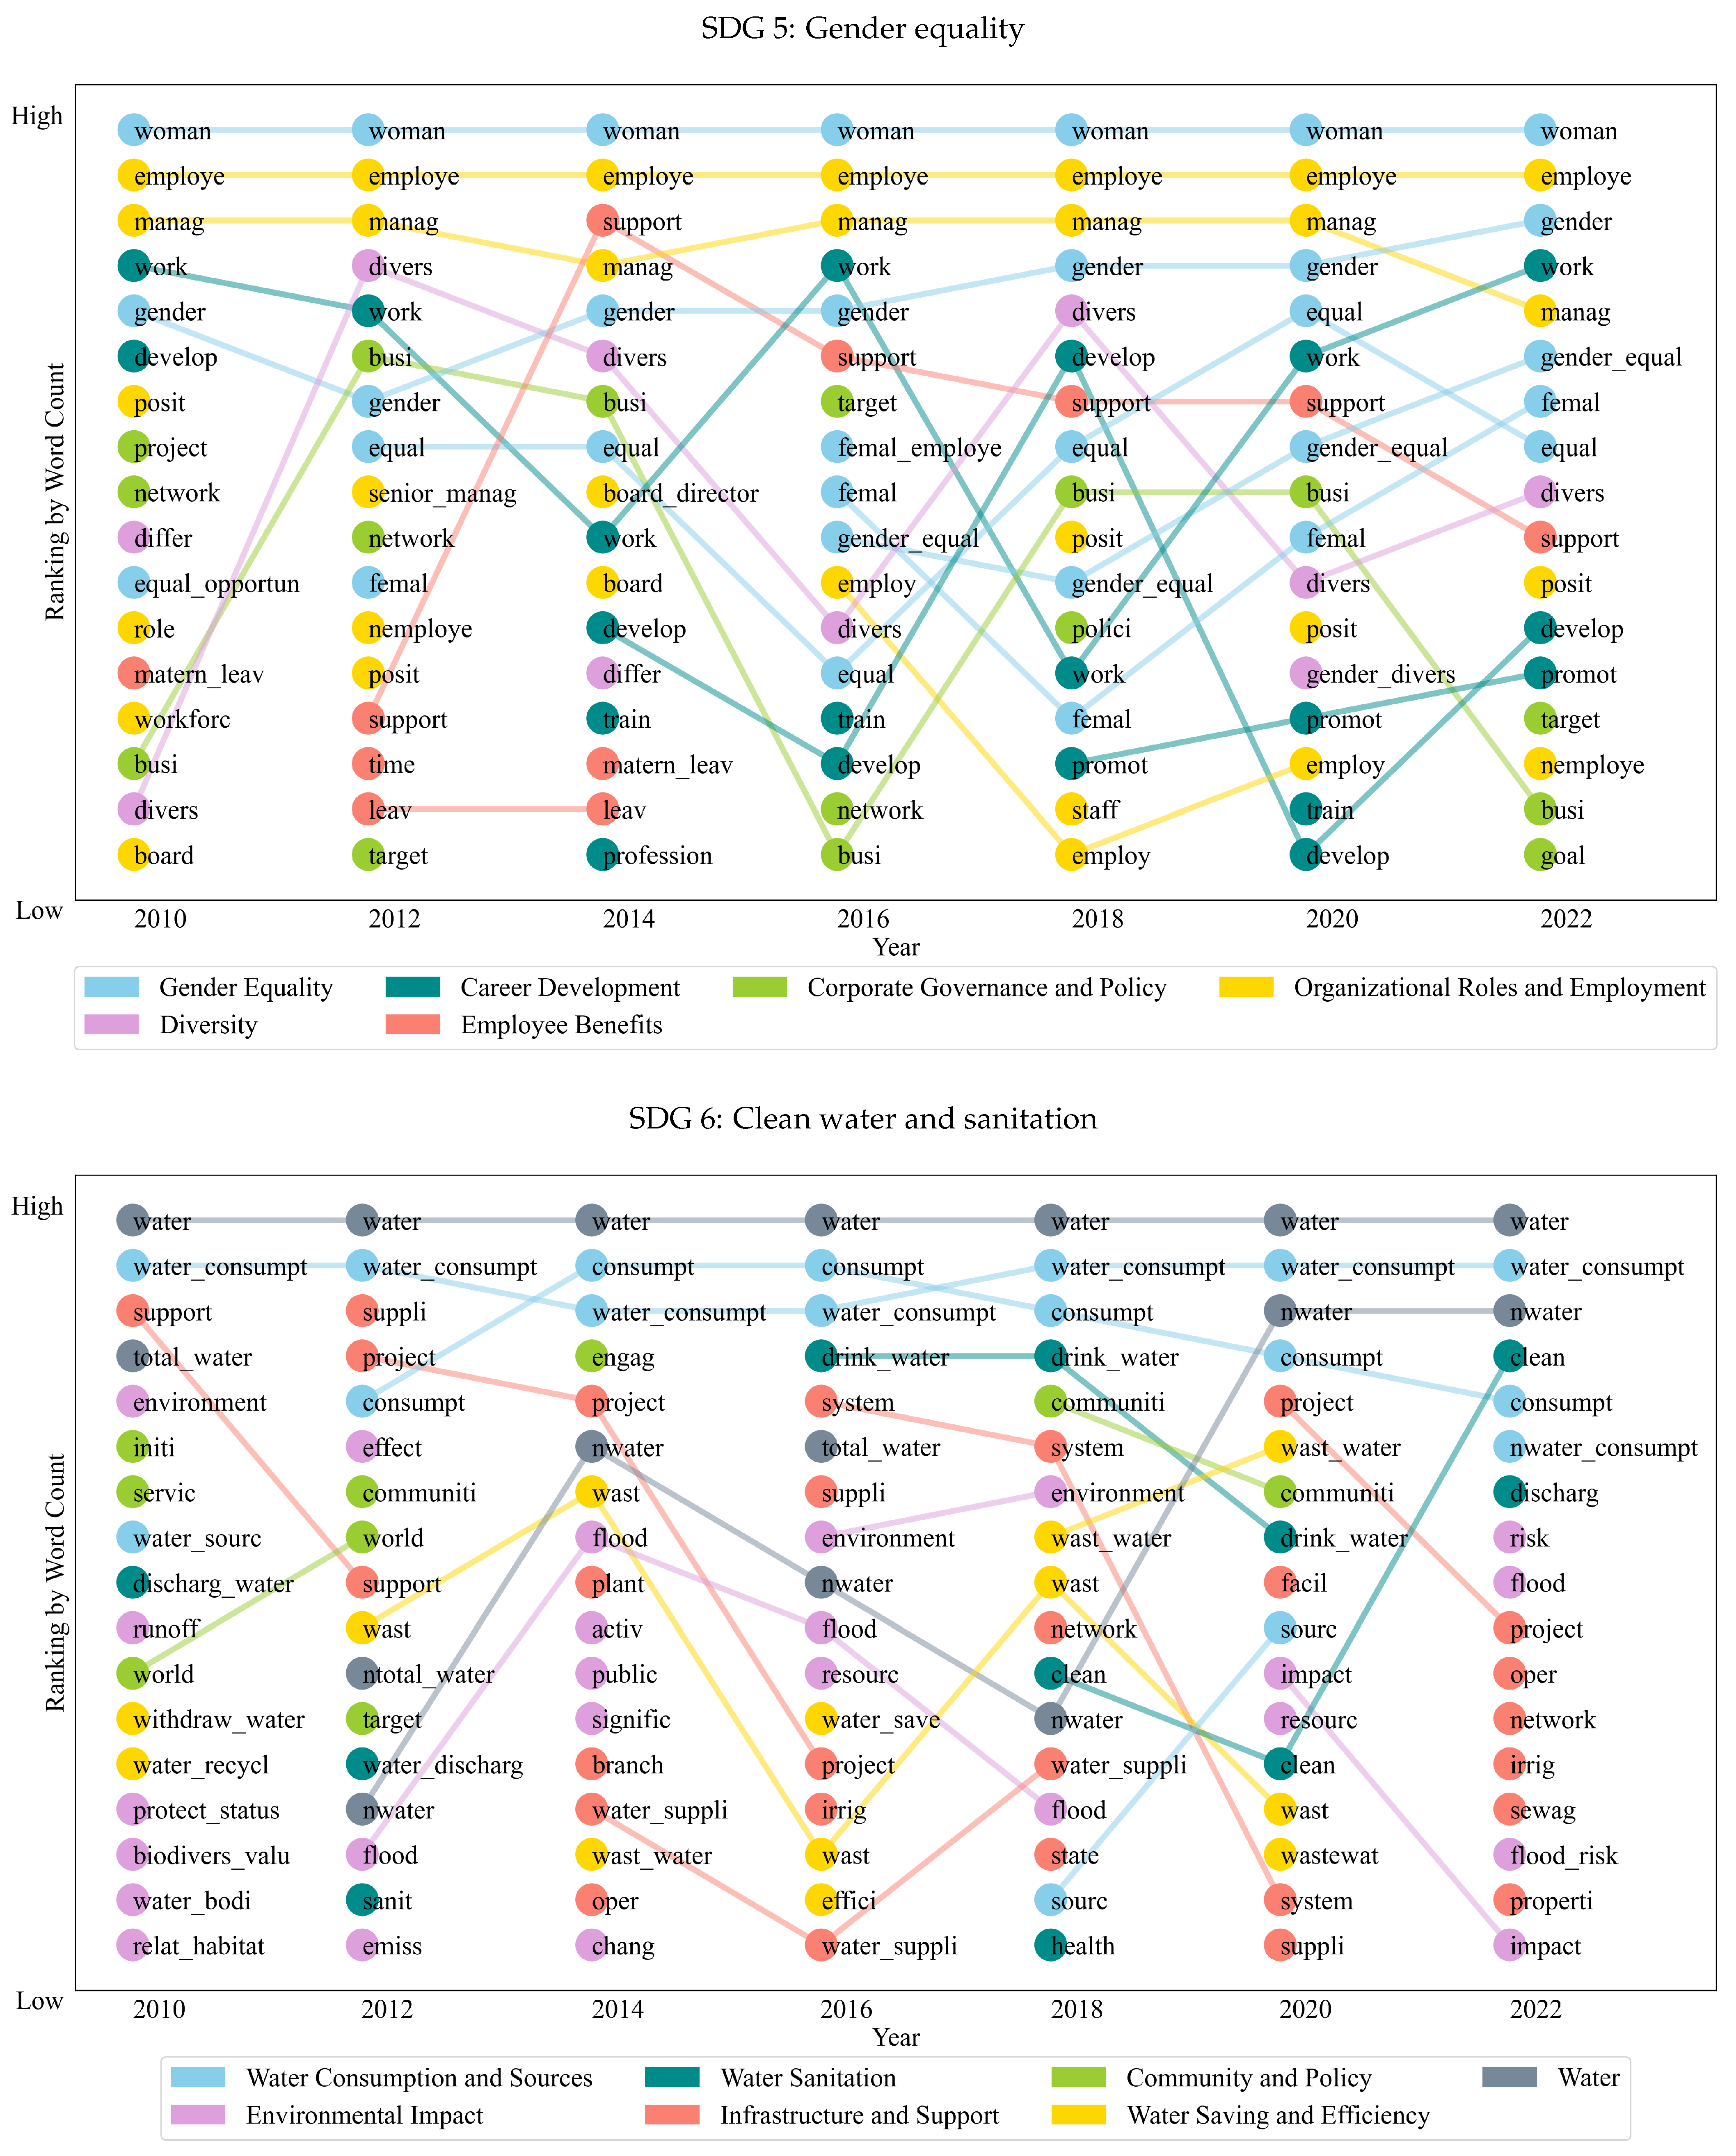
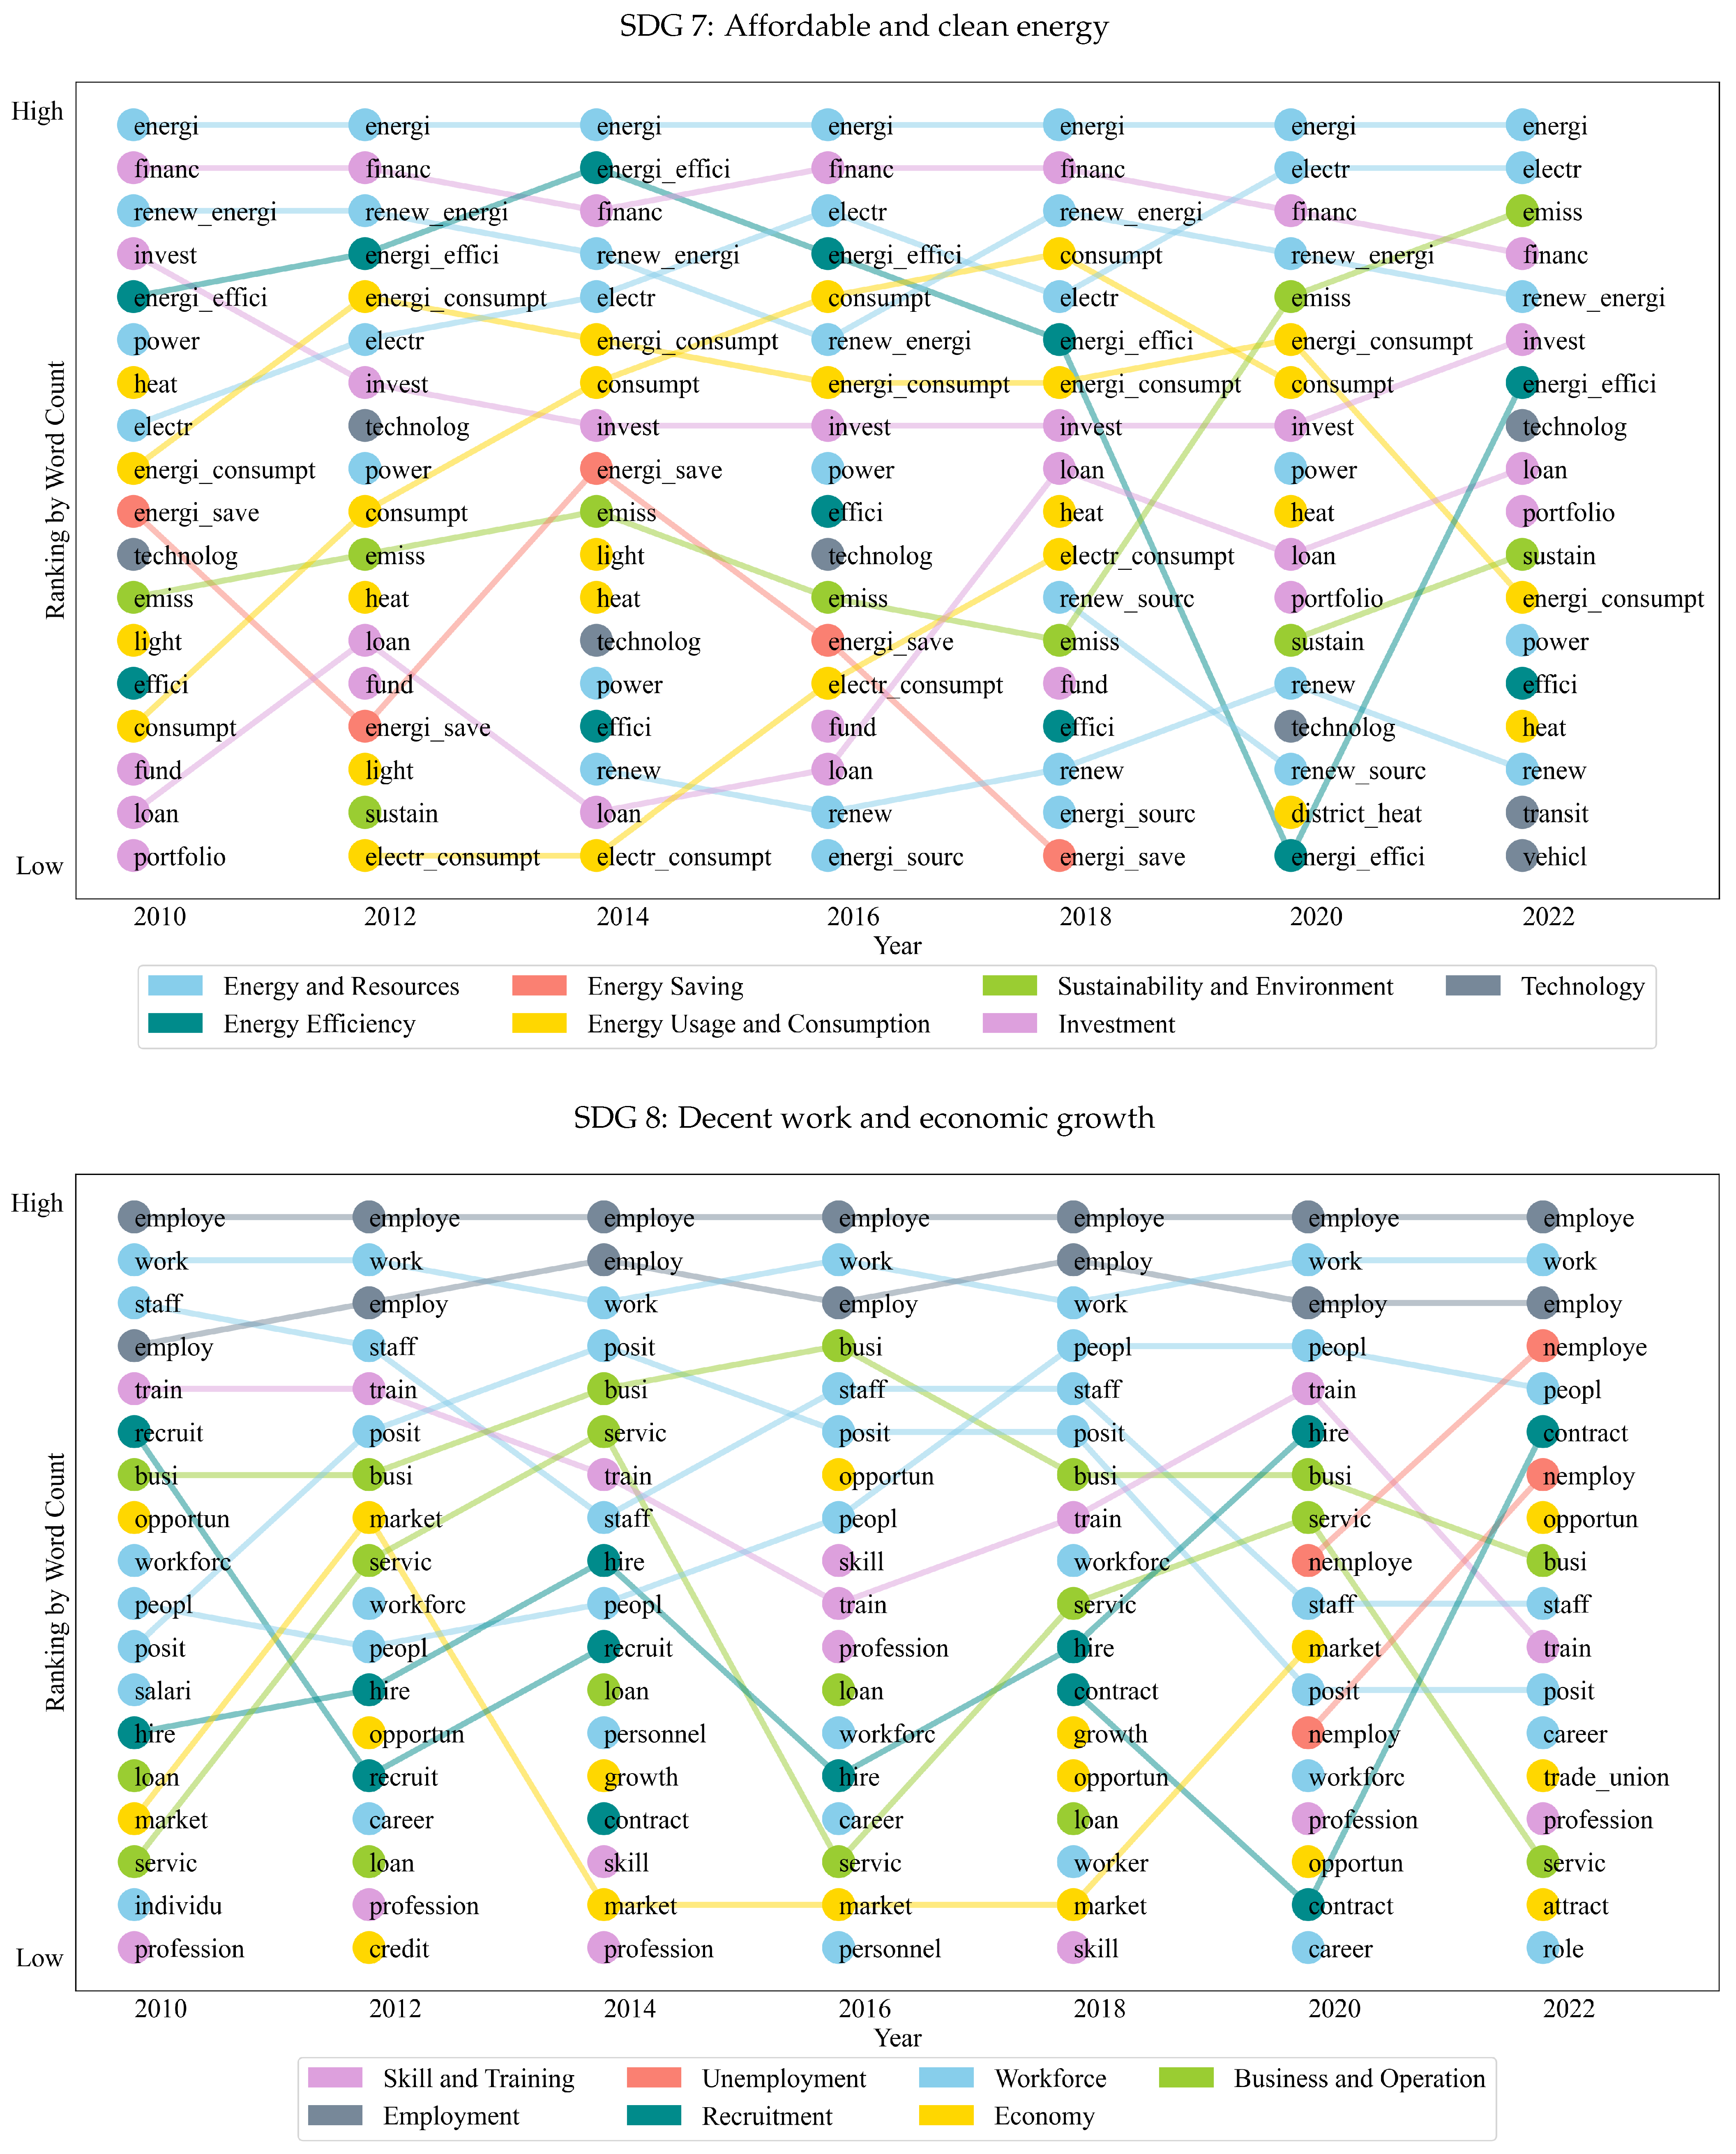
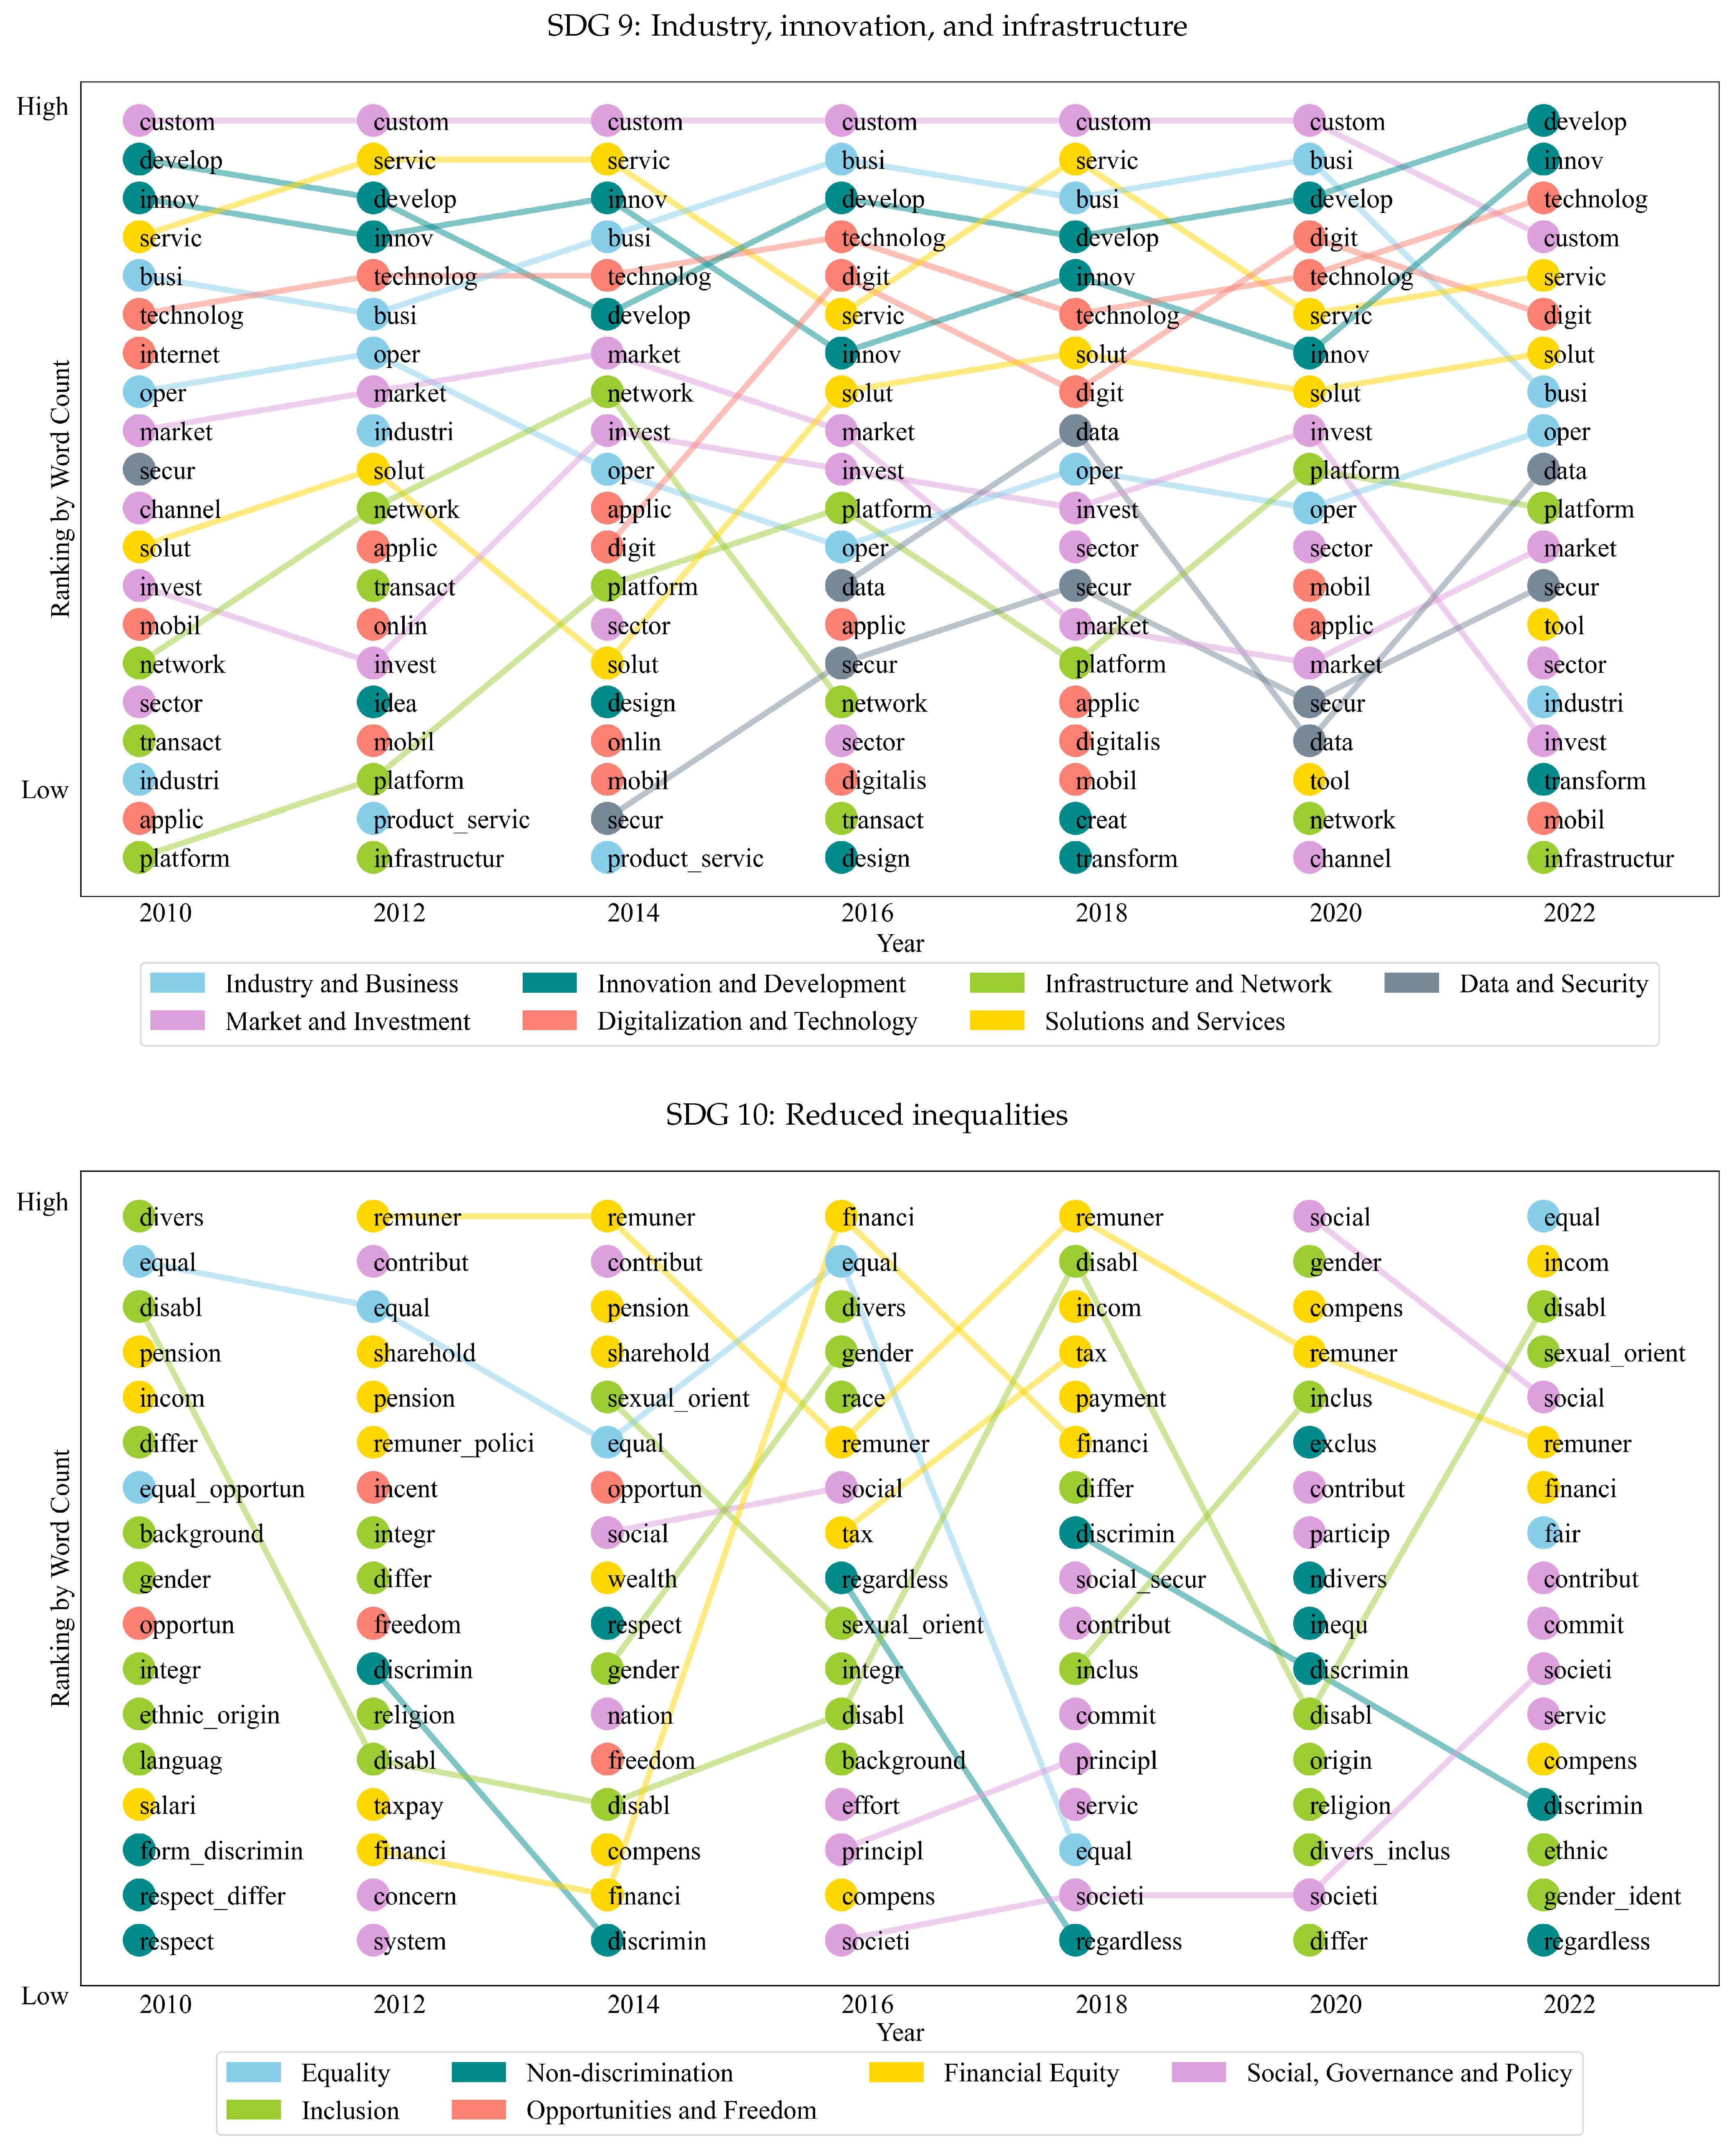
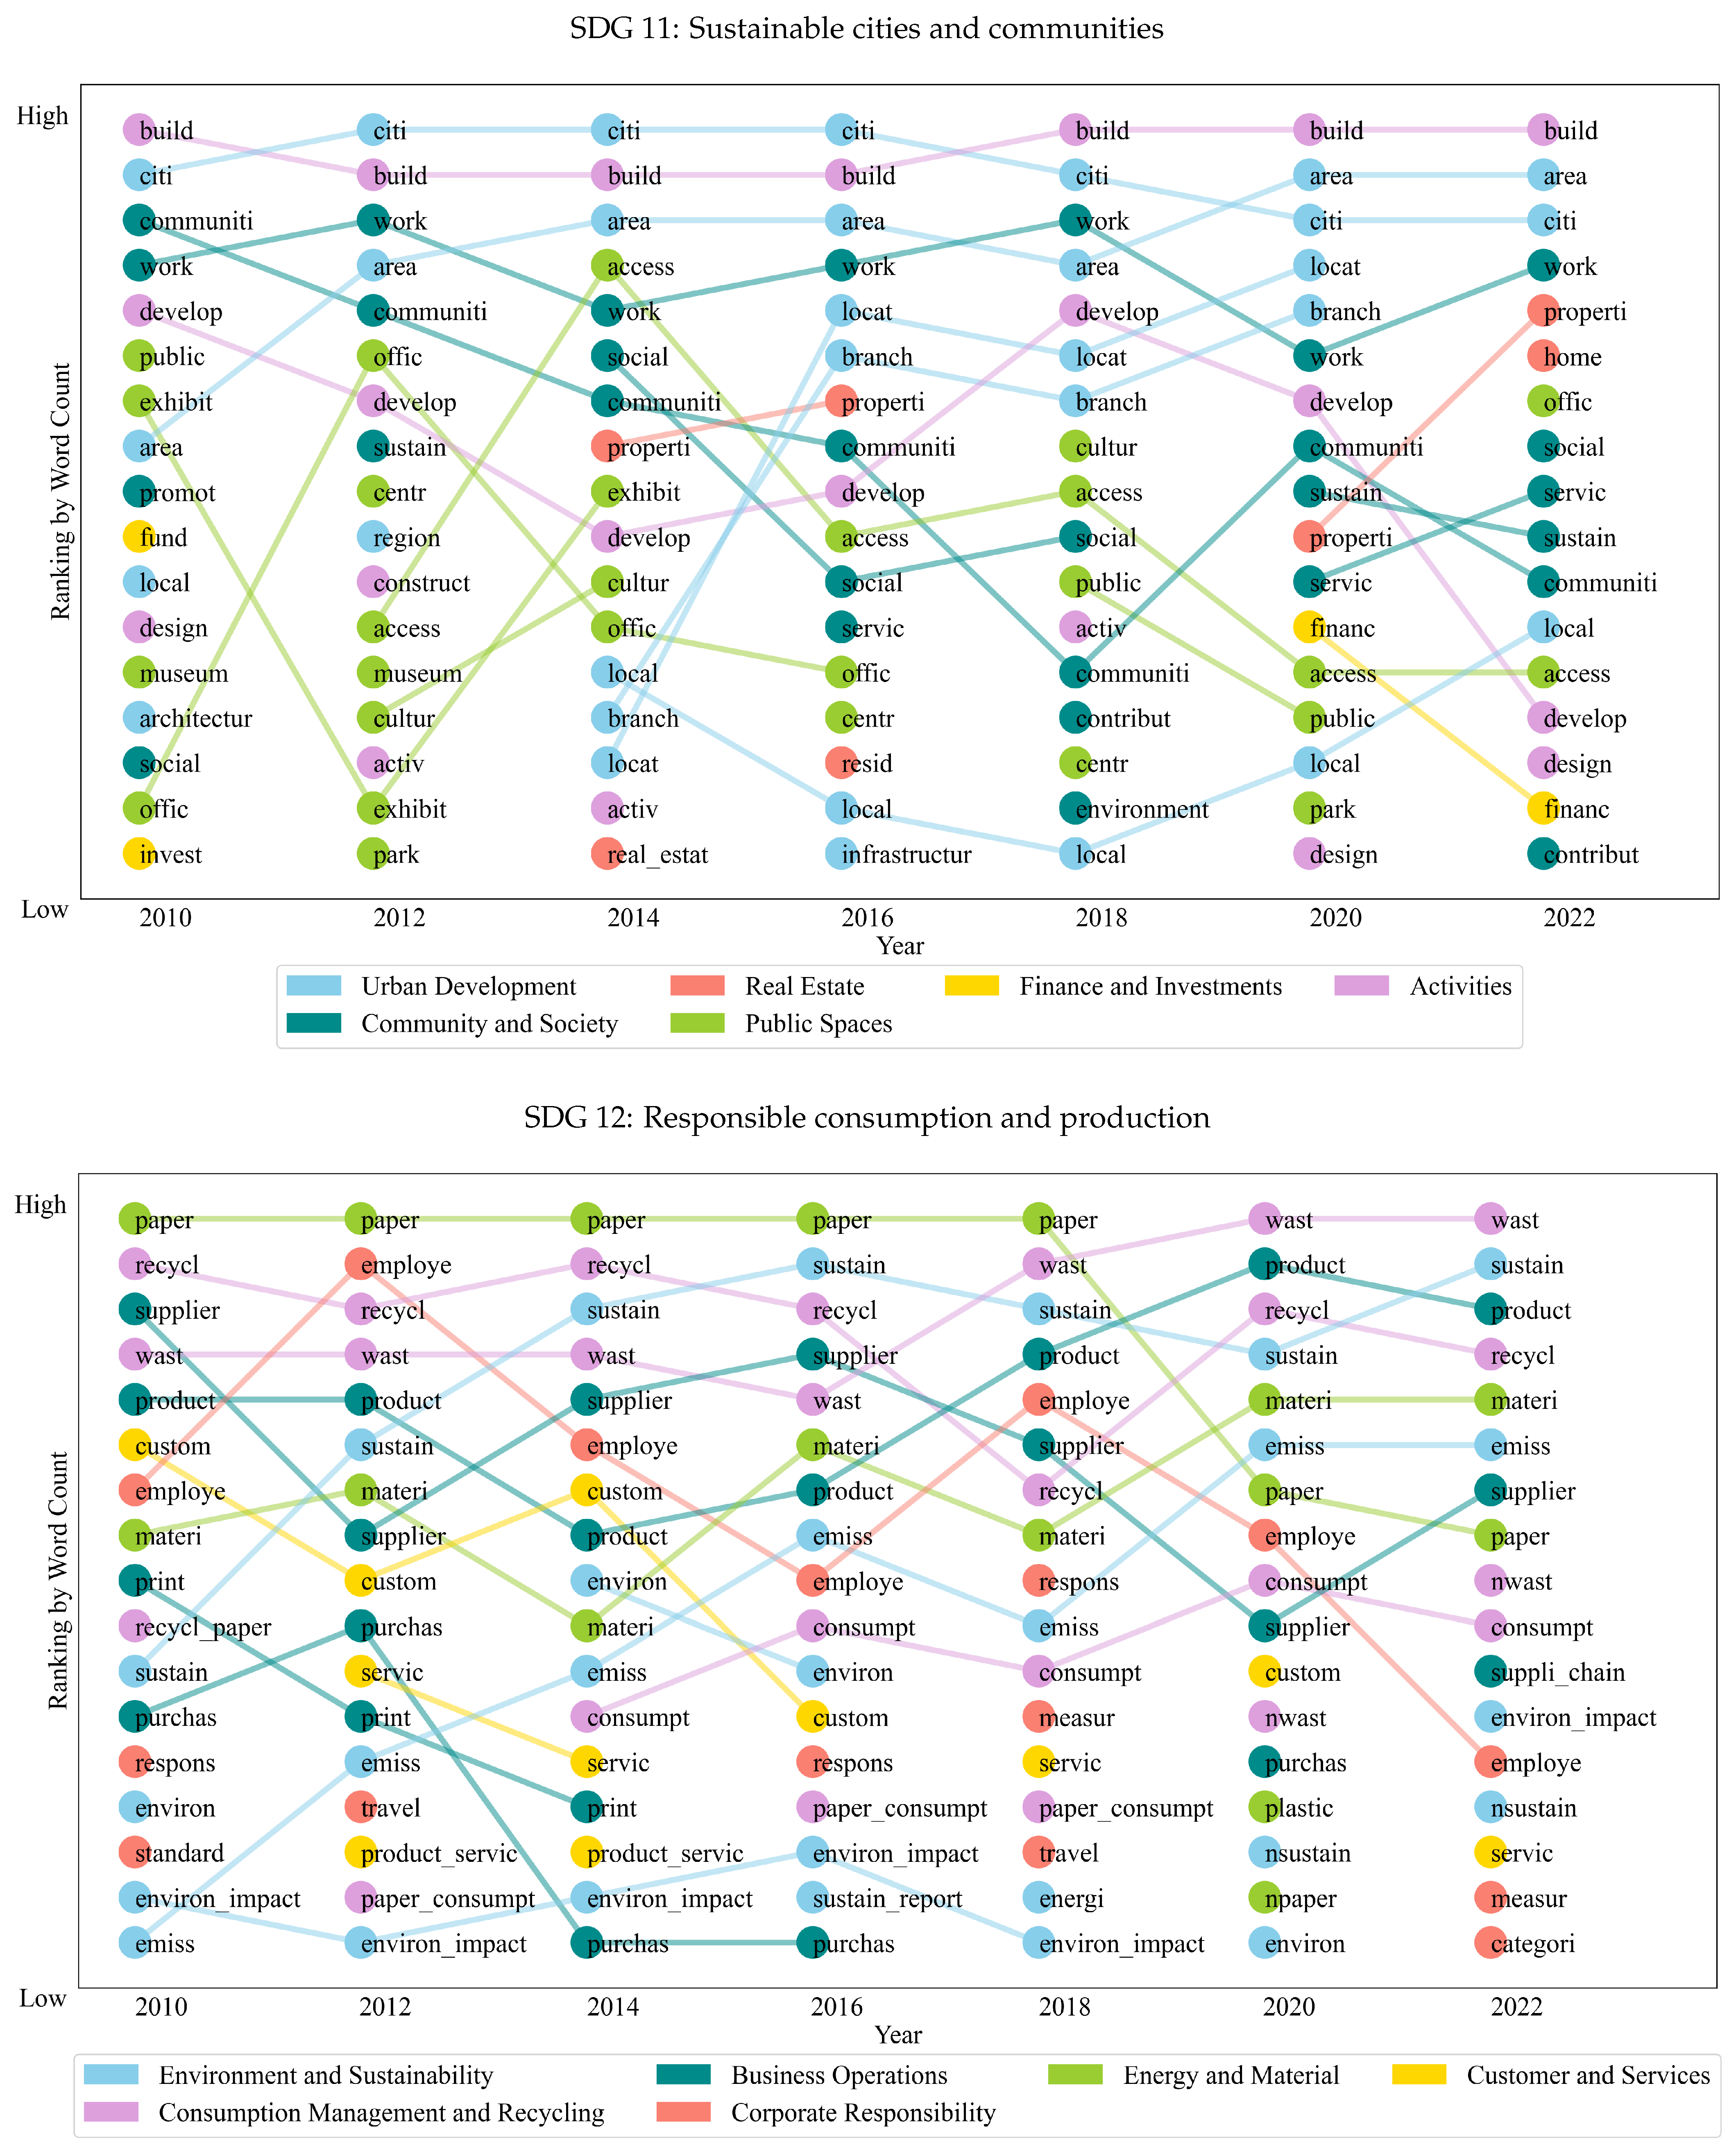
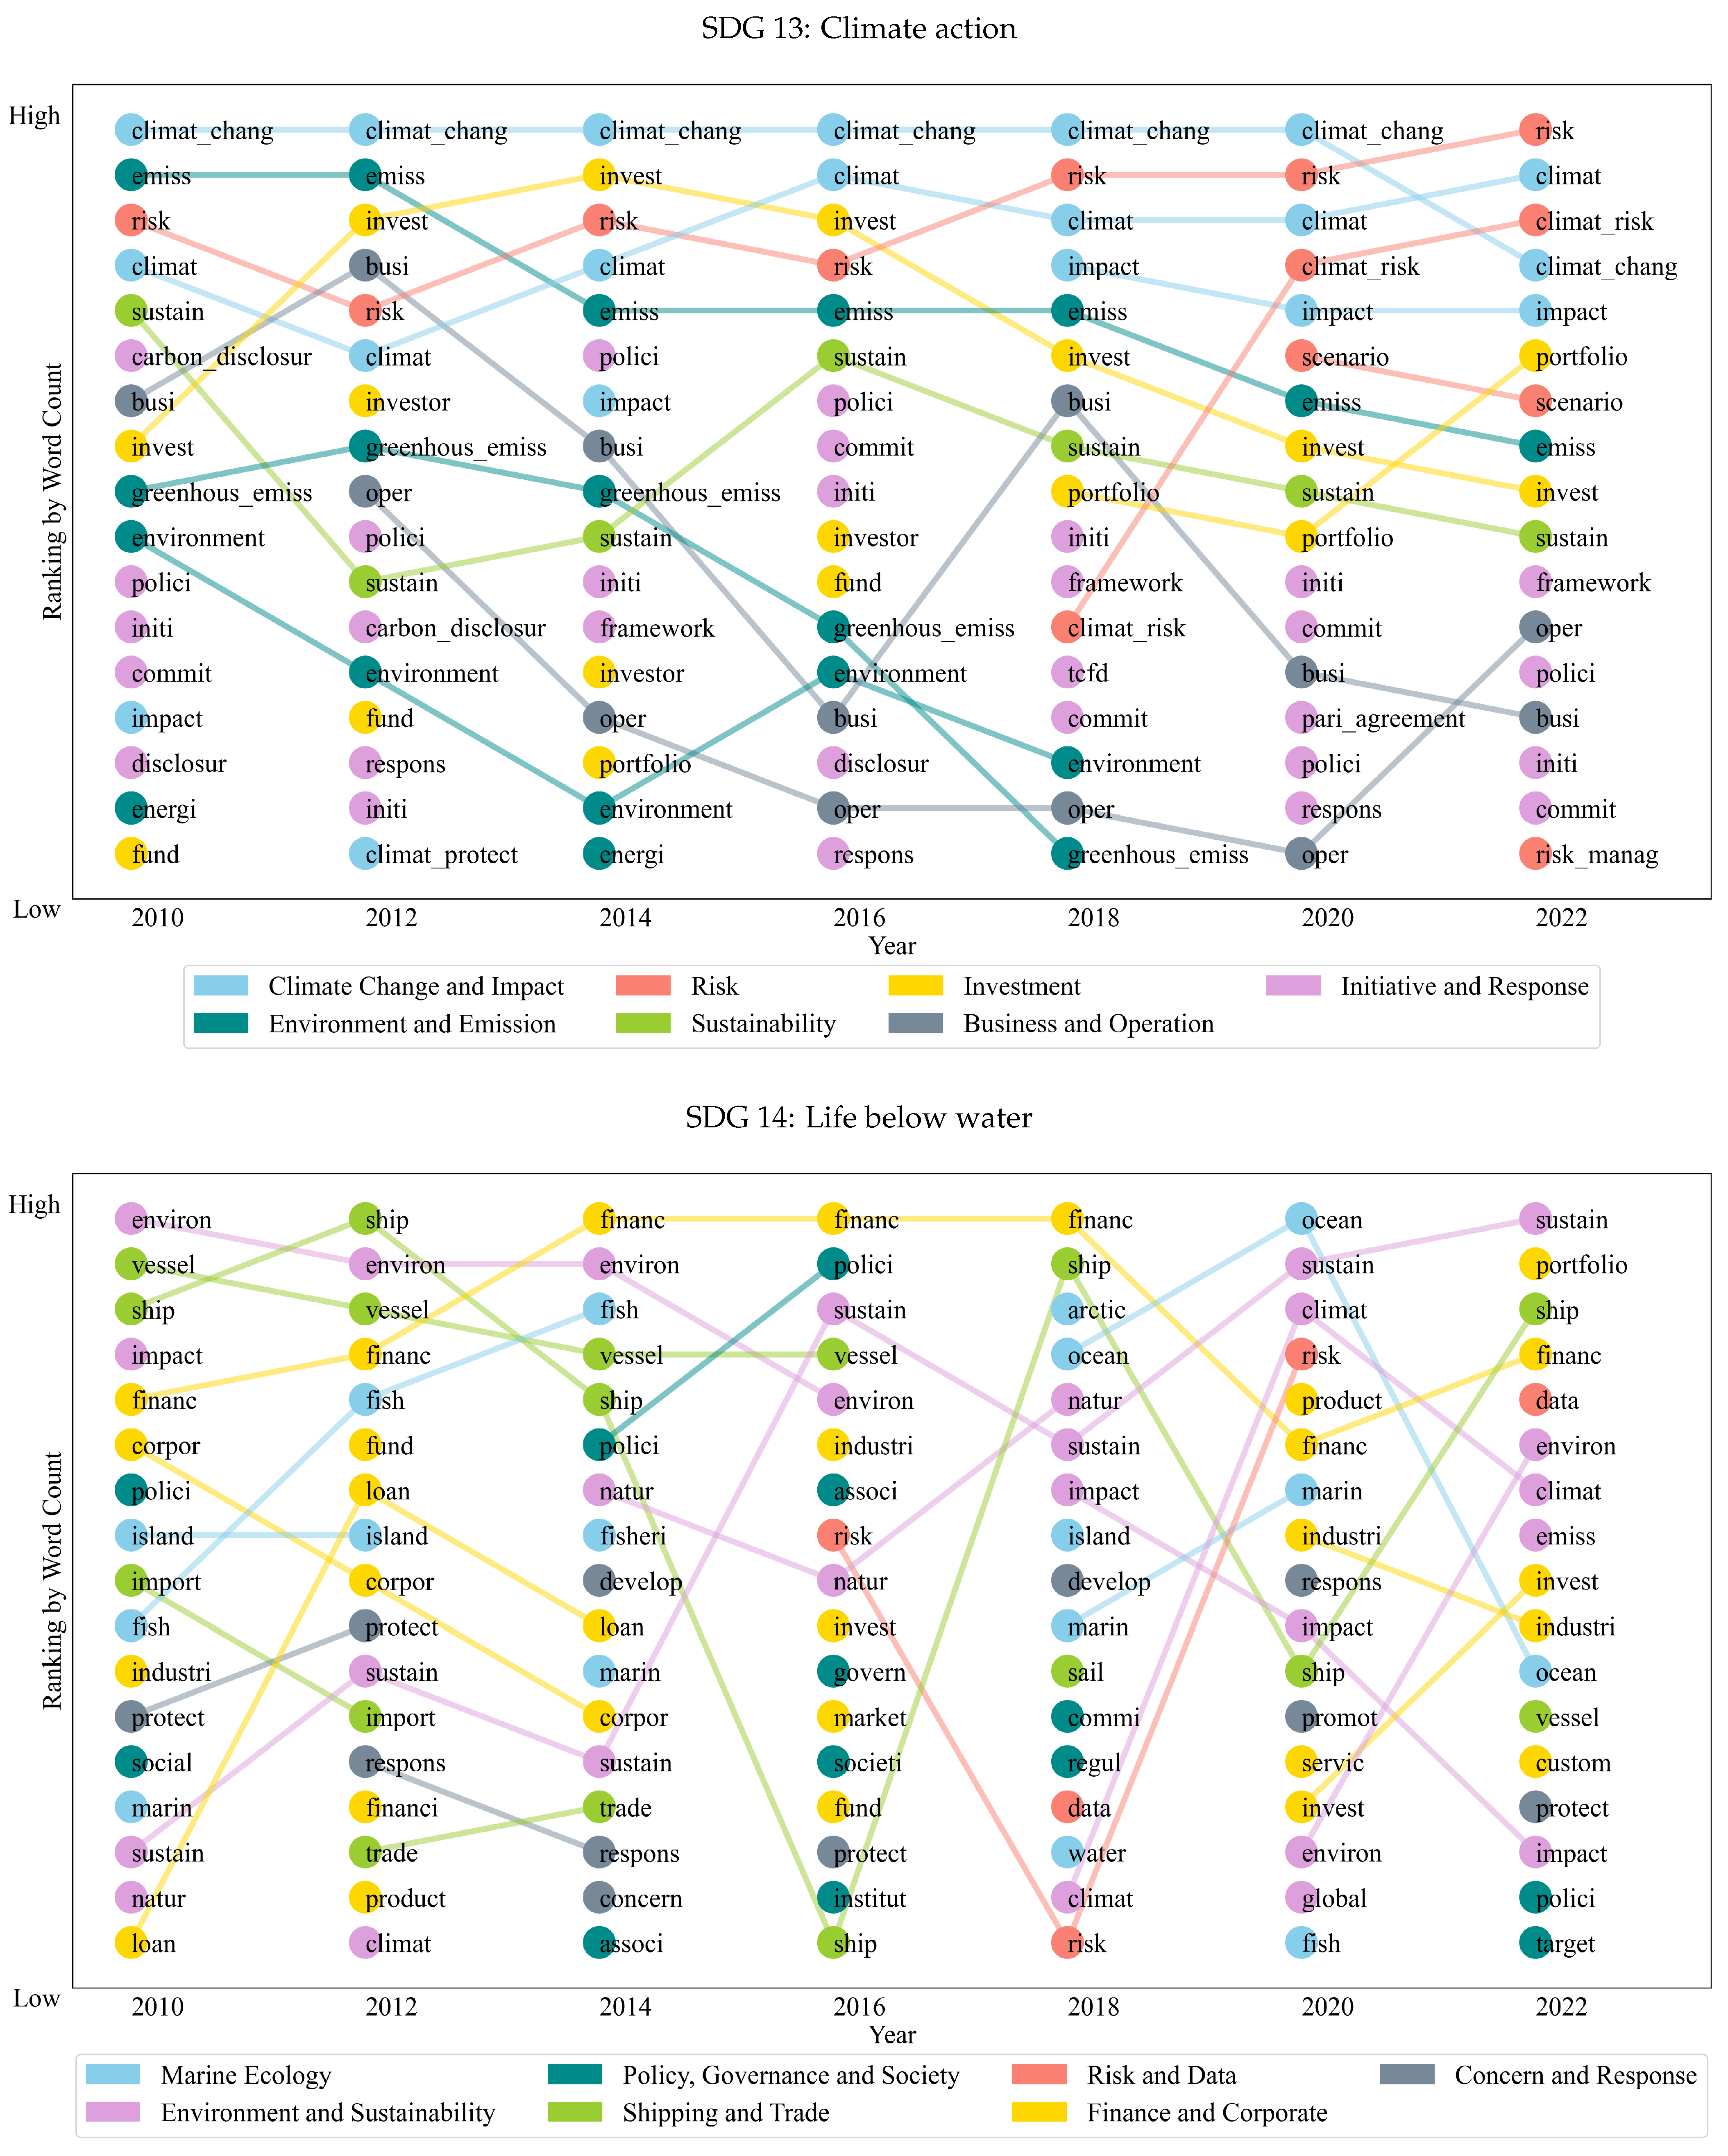
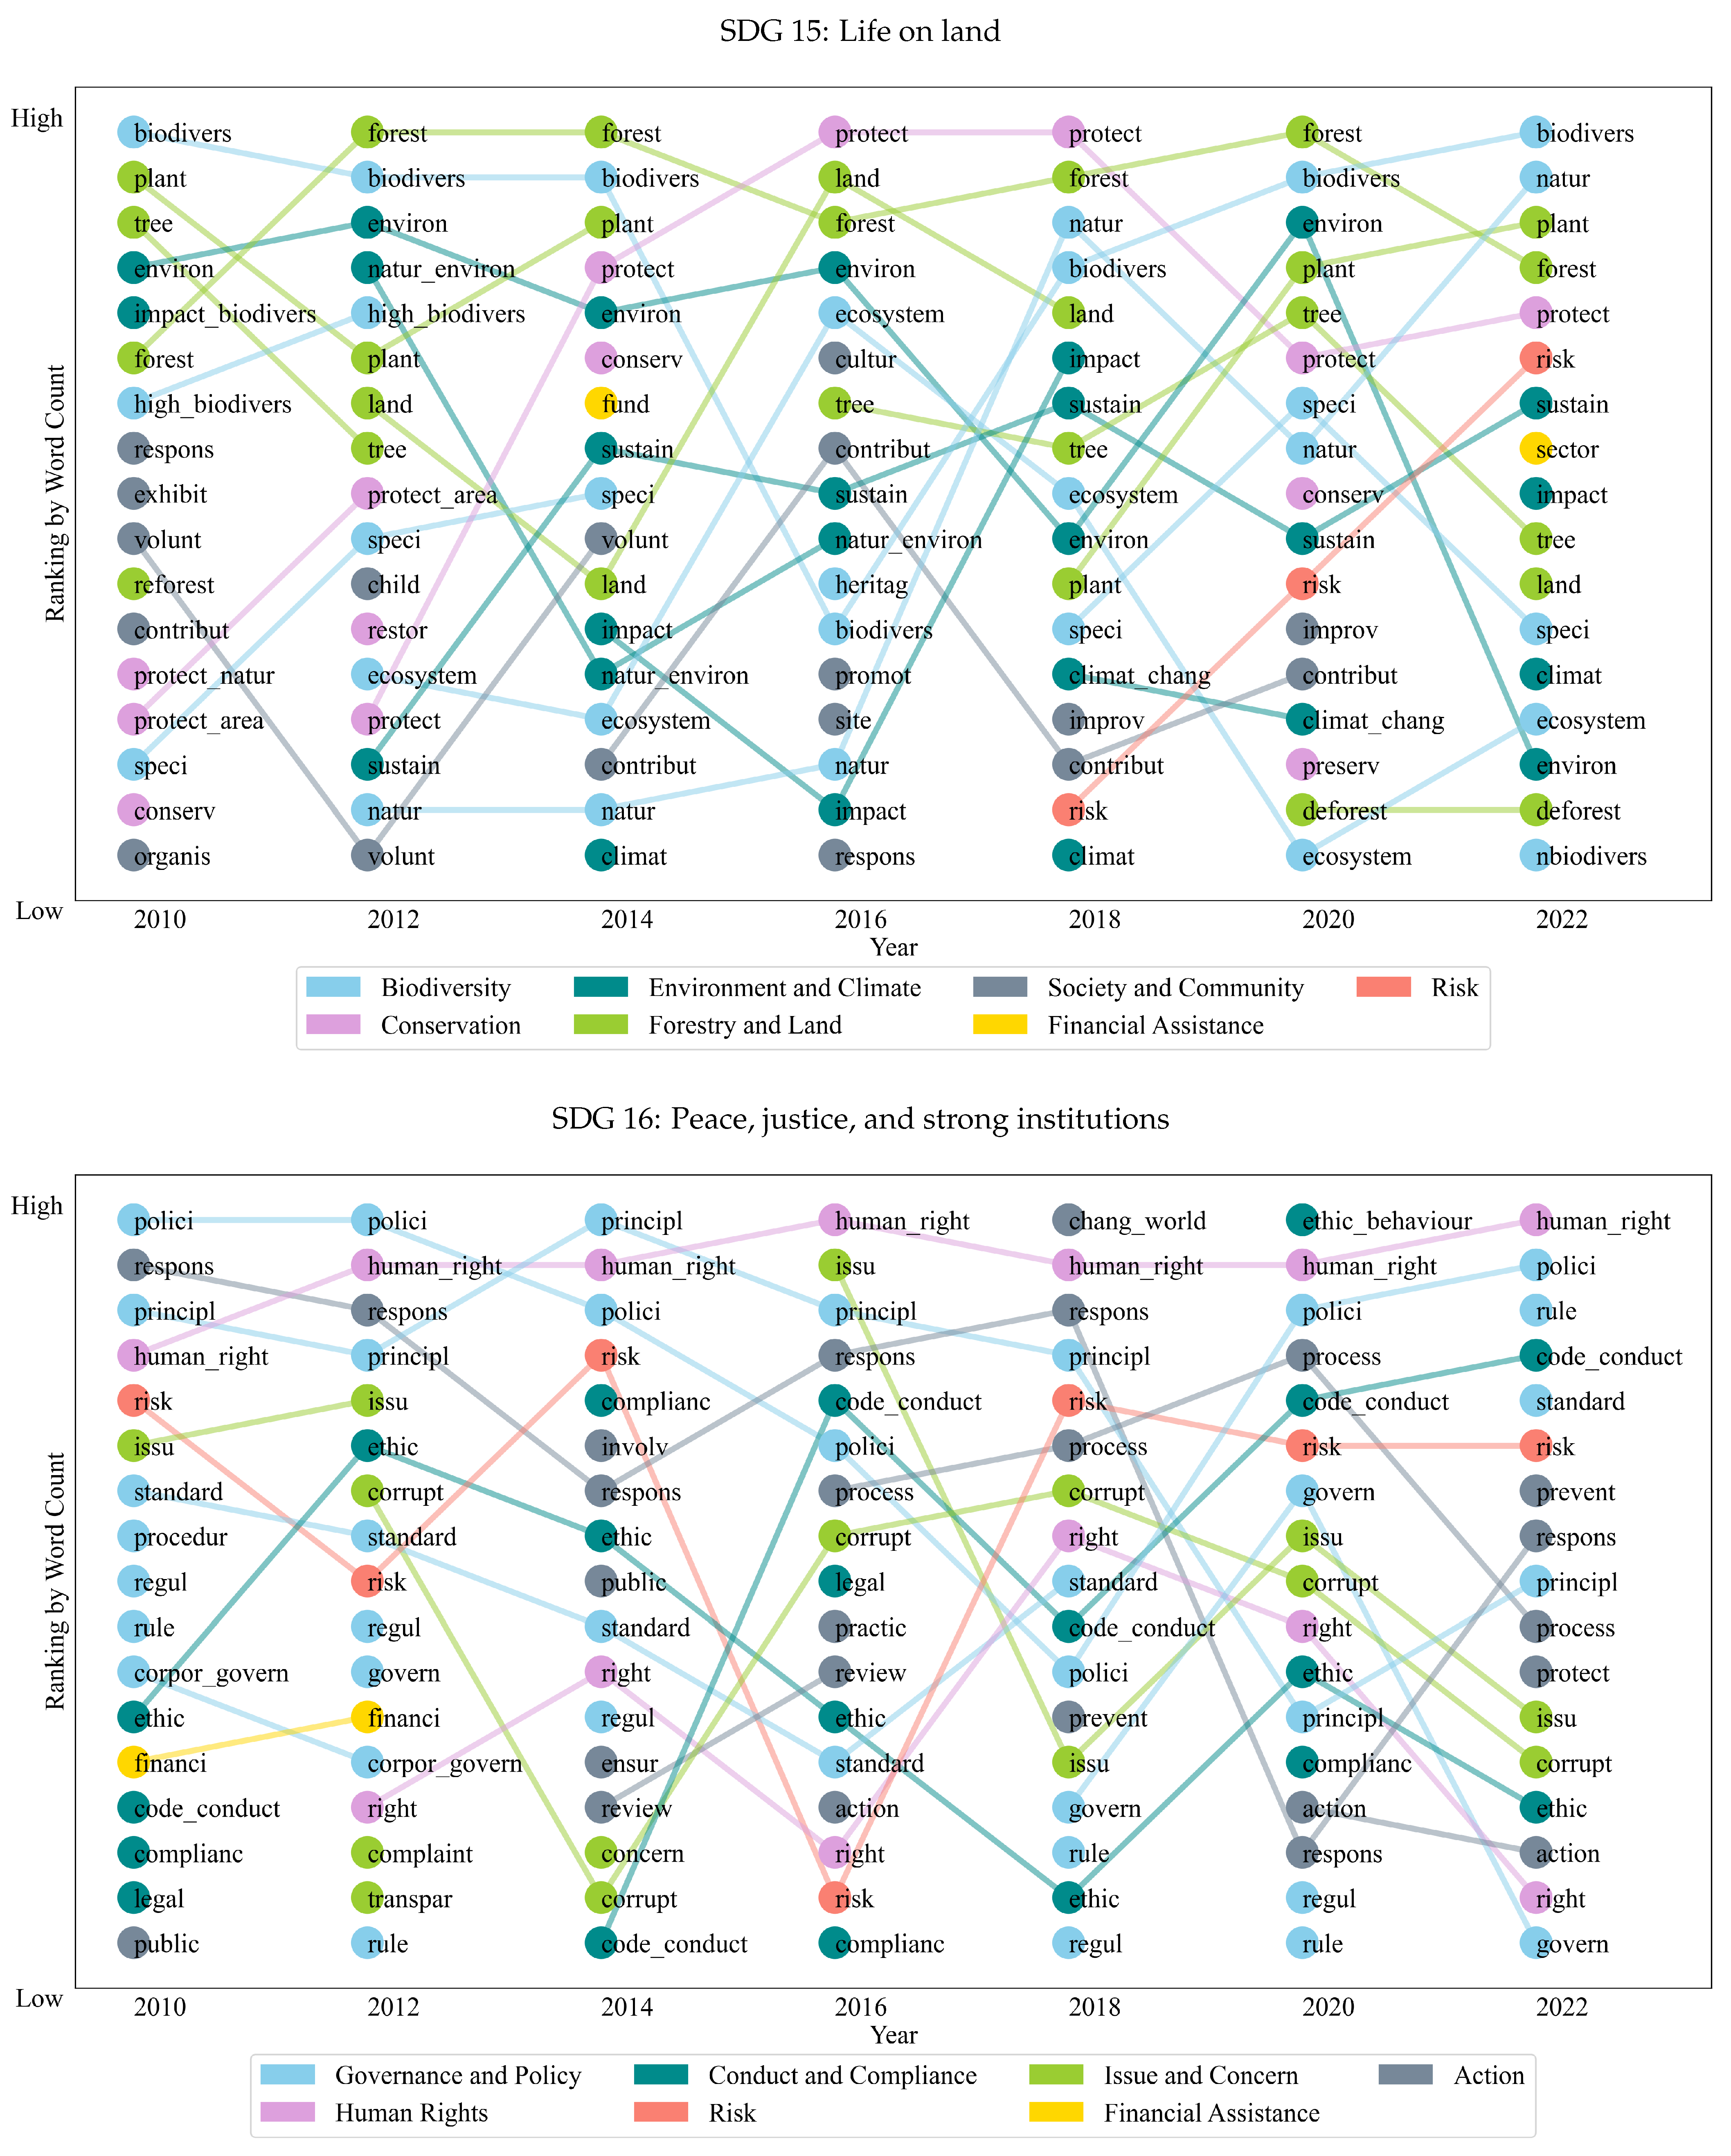
To glean an understanding of the topics that banks discuss within each SDG category, we apply word counts and a clustering algorithm to the bank reports year after year. The cluster analysis (k-means) provides the grouping of themes that we further flesh out with the word counts. Focusing on those SDGs with the strongest temporal evolution, we can observe thematic changes within each SDG. For SDG 3, the COVID-19 pandemic temporarily intensified the emphasis on financial partnerships and employee well-being for combating the virus. However, as the pandemic’s impact diminished, banks’ attention shifted back to prepandemic patterns, indicating the resilience and adaptability of banks in the face of external challenges. SDG 7 has shown banks’ increasing support for sustainable projects. Notably, banks have integrated detailed energy consumption and emissions reporting, reflecting a trend toward transparency and accountability in addressing environmental challenges. In terms of SDG 8, discussions evolved from basic employment metrics to a more comprehensive view, such as work-life balance, employer reputation, and a sense of belonging. Upskilling and reskilling in the digital domain have also gained attention. Starting in 2020, however, the focus shifted toward job creation and unemployment along with the impact of the COVID-19 pandemic on the labor market. With respect to SDG 9, technological developments have transitioned banking operations from traditional methods to digital solutions and from foundational online features to advanced technologies such as blockchain and AI. Such technological advancements have accelerated data generation and improved customer experience. For SDG 13, banks progressed from the early recognition of climate change and collaborative efforts to integrating climate risk into core business operations. These shifts indicate that global events, technological advancements, and societal values influence discussions of SDGs.
These findings have timely implications. We believe our study provides a strong starting point for further exploration of the textual analysis of sustainability-related issues. Our automated tool simplifies the often tedious job of accessing lengthy reports from various companies. This innovation holds promise for transforming practices for both analysts and industry professionals alike.

Supplementary Materials

The following supporting information can be downloaded at: https://www.mdpi.com/article/10.3390/su16020809/s1. This supplement contains detailed figures of box plots of SDG ranks over time for various banks.

Author Contributions

Both authors contributed to equal parts to the conception of the research, the data collection, the programming, and the analysis of the results. All authors have read and agreed to the published version of the manuscript.

Funding

This research received no external funding.

Institutional Review Board Statement

Not applicable.

Informed Consent Statement

Not applicable.

Data Availability Statement

The manually annotated sentences and Python programs are available upon request.

Acknowledgments

We wish to thank Minyue Dong from HEC Lausanne for sharing her database with bank sustainability reports. Additionally, thank you to Richard Crowley from Singapore Management University for useful discussion on the methodology used.

Conflicts of Interest

The authors declare no conflict of interest.

Appendix A

Table A1. Sample of input dataset for model fine-tuning. In this table, we present for each SDG an illustrative sentence.
SDGLabelExample Sentence
No poverty1Its mission is to improve the quality of life of children, families, and communities in poor countries and regions through comprehensive development projects and awareness-raising activities that lead to structural changes which help eradicate poverty.
Zero hunger2In the United States, Bank of the West increased its lending by close to 15% in 2012, becoming one of the leading banks giving loans to the US farming sector.
Good health and well-being3Within the scope of our health management, MLP offers a range of measures such as flu shots, ergonomic workplace advice, employee and management consulting, information on the topic of psychological disposition, as well as crisis counseling in the event of an emergency, which is provided by the psychotherapy outpatient clinic.
Quality education4Coaching in BBVA is an element of development that has demonstrated its value as a technique that allows the professional to grow and strengthen all of his or her abilities through an individual learning process with the support and supervision of a certified coach.
Gender equality5The approach used to calculate the gender pay gap takes into account population clusters that enable assessment based on the concept of equal pay for equal work, while also evaluating the organizational complexity of the roles and the uniformity of the professional skills.
Clean water and sanitation6Extended for three years until December 2019, the program continues to protect five of the world’s most important river basins, and to date has provided 1.65 million people with clean water and 2.5 million people with sanitation in six countries across two continents.
Affordable and clean energy7Achieving energy and climate goals will require continued policy support and a massive mobilization of public and private capital for clean and renewable energy, especially in developing countries.
Decent work and economic growth8Through talent acquisition, we aim to achieve a broad and diverse representation of society in our workforce, reflecting our clients and ensuring employees can reach their full potential at all career stages.
Industry, innovation, and infrastructure9The digital transformation of the financial industry is boosting efficiency through automation of internal processes, with the use of new technologies to remain relevant in the new environment, such as blockchain and the cloud; data exploitation; and new business models (platforms).
Reduced inequalities10Our diversity and inclusion policy makes clear the responsibility of treating colleagues with dignity and respect, and to create an inclusive culture free from discrimination, bullying, harassment, and victimization, irrespective of age, color, disability, ethnic, national origin, gender, gender expression, gender identity, marital status, pregnancy, race, religion or belief, or sexual orientation.
Sustainable cities and communities11A stand-out development last year was the launch of the Foundation’s Red Points Platform, a channel through which the general public can report black spots on roads and in cities, which the Foundation undertakes to refer to the competent authority for remedial action.
Responsible consumption and production12Particular attention is focused on the disposal of office equipment in Italy: before becoming waste, this equipment is subject to a careful recycling analysis. During the COVID-19 emergency, the group’s branches’ and buildings’ attention was also focused on the disposal of personal protective equipment (masks, gloves, etc.)
Climate action13Natixis is pursuing two goals with this innovative initiative; first, to ramp up its commitment to green financing by encouraging the funding of more sustainable activities, including by helping clients active in carbon-intensive sectors adopt more sustainable practices, and second, to incorporate climate risk more systematically in its assessment of financing opportunities.
Life below water14BNP Paribas is taking numerous steps to protect the ocean and its resources in areas such as shipping, fishing and aquaculture, undersea mining, maritime-based renewable energy, or land-based mining with strong impacts on oceans.
Life on Land15To promote good forestry and agribusiness practices and to discourage net forest conversion, our policies also include restrictions on financing activities related to high conservation value forests as well as provisions for the particular scrutiny of peatland operations and the prohibition of financial services for operations in protected areas such as UNESCO World Heritage sites.
Peace, justice, and strong institutions16The movement is already represented in over 100 countries and has produced some successes, such as the creation of international anti-corruption conventions, the persecution of corrupt heads of state, and the impounding of their illegal assets.
Partnerships for the goals17Enhance the Global Partnership for Sustainable Development, complemented by multi-stakeholder partnerships that mobilize and share knowledge, expertise, technology, and financial resources, to support the achievement of the Sustainable Development Goals in all countries, in particular developing countries.
None0This means applying a model according to which we assign the smallest possible credit limit, which is then increased gradually over time for borrowers with good internal credit history, supported by estimates of credit history bureaus, and that have shown their creditworthiness over time.
Table A2. List of government expenditures, macroeconomic indicators, healthcare statistics, and climate-related indicators.
AbbreviationIndicator NameSource
exp_healthCurrent health expenditure (% of GDP)IMF Database
energy_intenEnergy intensity level of primary energy (MJ/constant 2017 PPP GDP)World Bank Database
co2_gdpCarbon dioxide emissions per unit of GDPUNECE Statistical Database
unemployUnemployment, total (% of total labor force) (modeled ILO estimate)World Bank Database
lct_gdpTotal trade in low carbon technology products as percent of GDPIMF Climate Change Indicators Dashboard
exp_eaExpenditure on economic affairs (% of GDP) *IMF Database
exp_amenExpenditure on housing and community amenities (% of GDP)IMF Database
ghg_emissTotal greenhouse gas (GHG) emissions (Million metric tons of CO2 equivalent)IMF Climate Change Indicators Dashboard
* Expenditure on economic affairs includes agriculture, fishing, forestry, hunting, mining, manufacturing, construction, transport, communication, fuel, and energy.
Table A3. Comparison of healthcare services across European regions (in 2019).
RegionMean
(a)(b)(c)
Northern Europe85.2544.55156.49
Western Europe85.1338.20134.48
Southern Europe81.5039.3948.20
Central and Eastern Europe75.5736.9882.70
(a) Universal health coverage (UHC) service coverage, Index; (b) Density of medical doctors, per 10,000 population; (c) Density of nursing and midwifery personnel, per 10,000 population.
Table A4. Energy-related Indicators.
(a) Energy Intensity Level of Primary Energy (MJ/Constant 2017 PPP GDP).
This Is an Indicator of How Much Energy Is Required to Produce One Unit of Output (GDP).
20102011201220132014201520162017201820192020
Northern Europe4.634.184.254.284.053.853.833.803.783.603.53
Western Europe3.443.203.183.152.952.912.882.802.692.632.58
Southern Europe3.103.053.132.932.902.902.832.852.752.632.68
Central and Eastern Europe5.164.964.764.664.464.304.444.354.253.983.99
Europe4.153.933.883.803.633.533.553.493.403.243.22
Growth Rate of Europe (%) −5.52−1.27−1.83−4.60−2.760.47−1.53−2.63−4.78−0.51
(b) Renewable Energy Share in the Total Final Energy Consumption
20102011201220132014201520162017201820192020
Northern Europe39.0040.2542.9042.5344.1046.2345.9047.7047.5549.1051.73
Western Europe11.7412.2113.2413.6914.3814.8814.7915.4116.0616.7418.50
Southern Europe11.2811.4013.2514.8815.0815.2014.8814.7315.9816.1318.30
Central and Eastern Europe15.1114.8315.3916.2516.1816.5116.3315.6916.3317.2618.98
Europe17.3317.6218.9019.5520.0520.7020.5020.7721.3822.2024.16
Growth Rate of Europe (%) 1.687.263.422.563.26−0.971.322.953.848.82
Table A5. Unemployment, total (% of total labor force) (modeled ILO estimate).
2010201120122013201420152016201720182019202020212022
Northern Europe7.076.646.656.766.766.856.626.345.665.566.536.445.38
Western Europe7.637.397.607.777.457.016.525.805.194.735.195.524.56
Southern Europe11.8013.8717.9220.4019.9318.4416.9615.2413.3812.1112.1511.6110.06
Central and Eastern Europe9.638.808.418.447.717.176.555.665.034.975.705.434.84
Europe8.908.819.439.939.508.948.287.426.586.186.746.665.74
Growth Rate of Europe (%) −0.957.035.23−4.29−5.91−7.34−10.46−11.30−6.109.15−1.23−13.77
Table A6. Climate-related Indicators.
(a) Total Greenhouse Gas (GHG) Emissions (Million Metric Tons of CO 2 Equivalent)
201020112012201320142015201620172018201920202021
Northern Europe42.4037.2733.9236.0234.1134.5836.2635.7538.3833.1327.0227.76
Western Europe303.95287.69288.46289.43274.25275.44273.58271.53263.39254.30231.22242.00
Southern Europe217.22215.96212.84192.66186.86190.00186.70194.55187.26177.64159.25170.09
Central and
Eastern Europe
277.91294.20294.54289.58285.69295.65297.60309.81320.74320.87310.79338.31
Europe237.23236.17235.46231.12223.48227.79227.55232.16232.32226.85211.71226.41
Growth rate
of Europe (%)
−0.44−0.30−1.84−3.311.93−0.112.030.07−2.35−6.676.94
(b) Expenditure on Environment Protection (% of GDP)
201020112012201320142015201620172018201920202021
Northern Europe0.490.470.470.500.500.490.500.490.490.500.560.53
Western Europe0.940.920.910.880.850.800.780.770.770.780.840.80
Southern Europe0.740.740.790.930.880.900.870.850.840.850.980.88
Central and
Eastern Europe
0.480.580.680.640.710.750.490.510.560.570.590.63
Europe0.680.700.740.750.750.750.650.650.670.680.730.71
Growth Rate
of Europe (%)
3.755.590.710.35−0.21−13.06−0.362.941.178.83−3.05

Appendix B

In this appendix, we want to provide some technical details on the k-means algorithm and how we used it in our context. Technically, we employ the Universal Sentence Encoder (USE) [60] and k-means clustering [61] to effectively capture the thematic evolution of each key SDG over time. The sentences classified by our trained RoBERTa model are embedded using the USE from the TensorFlow Hub. Such embeddings can be compared using Euclidean distance, which fits well with k-means clustering. USE converts textual data into vectors of numbers, thereby encapsulating the semantic meaning of texts into a format that can be understood by algorithms operating on numbers.
K-means, an unsupervised machine learning technique, segments datasets into clusters by partitioning the data into k distinct clusters, where each data point is grouped with others that are closest in the embedding space.
We use the scikit-learn library in Python to perform k-means clustering. To determine the optimal number of clusters, we adopt the gap statistic method [62]. For each potential number of clusters, the gap statistic computes the difference between the observed intra-cluster variation and the expected intra-cluster variation from a reference dataset, which is generated by randomly shuffling the data. Subsequent to the clustering process, clusters are ranked based on the word count of each SDG, offering insights into the relative prominence of clusters within the SDGs annually.
Figure A1. Transition of words for all SDGs over time.
Sustainability 16 00809 g0a1aSustainability 16 00809 g0a1bSustainability 16 00809 g0a1cSustainability 16 00809 g0a1dSustainability 16 00809 g0a1eSustainability 16 00809 g0a1fSustainability 16 00809 g0a1gSustainability 16 00809 g0a1hSustainability 16 00809 g0a1i

References

  1. United Nations. Transforming Our World: The 2030 Agenda for Sustainable Development; UN General Assembly: New York, NY, USA, 2015. [Google Scholar]
  2. Starks, L.T. Presidential Address: Sustainable Finance and ESG Issues—Value versus Values. J. Financ. 2023, 78, 1837–1872. [Google Scholar] [CrossRef]
  3. Allen, F.; Gale, D. Comparing Financial Systems; MIT Press: Cambridge, MA, USA, 2000. [Google Scholar]
  4. Liang, H.; Renneboog, L. On the foundations of corporate social responsibility. J. Financ. 2017, 72, 853–910. [Google Scholar] [CrossRef]
  5. Baldissera, A. Sustainability reporting in banks: History of studies and a conceptual framework for thinking about the future by learning from the past. Corp. Soc. Responsib. Environ. Manag. 2023, 30, 2385–2405. [Google Scholar] [CrossRef]
  6. Cosma, S.; Venturelli, A.; Schwizer, P.; Boscia, V. Sustainable development and European banks: A non-financial disclosure analysis. Sustainability 2020, 12, 6146. [Google Scholar] [CrossRef]
  7. Blasco, J.L.; King, A.; Jayaram, S. How to Report on the SDGs: What Good Looks Like and Why It Matters; KPMG International: Amstelveen, The Netherlands, 2018. [Google Scholar]
  8. PwC. SDG Reporting Challenge 2017: Exploring Business Communication on the Global Goals; Annual Report; Price Waterhouse Coopers: New York, NY, USA, 2017. [Google Scholar]
  9. Andrea, V.; Carlo, L.; Gabriele, B.; Ruggiero, B.; Fabio, C.; Antonio, C.; Federica, D.; Del Baldo, M.; Valeria, F.; Rossella, L.; et al. The SDGs in the Reports of the Italian Companies Research Document N. 16; Gruppo Di Studio per il Bilancio Sociale: Milan, Italy, 2019. [Google Scholar]
  10. Schütze, H.; Manning, C.D.; Raghavan, P. Introduction to Information Retrieval; Cambridge University Press: Cambridge, UK, 2008; Volume 39. [Google Scholar]
  11. Sparck Jones, K. A statistical interpretation of term specificity and its application in retrieval. J. Doc. 1972, 28, 11–21. [Google Scholar] [CrossRef]
  12. Ramos, J. Using tf-idf to determine word relevance in document queries. Proc. First Instr. Conf. Mach. Learn. 2003, 242, 29–48. [Google Scholar]
  13. Zhang, Y.; Jin, R.; Zhou, Z.H. Understanding bag-of-words model: A statistical framework. Int. J. Mach. Learn. Cybern. 2010, 1, 43–52. [Google Scholar] [CrossRef]
  14. Devlin, J.; Chang, M.W.; Lee, K.; Toutanova, K. BERT: Pre-training of deep bidirectional transformers for language understanding. arXiv 2018, arXiv:1810.04805. [Google Scholar]
  15. Van Zanten, J.A.; Van Tulder, R. Multinational enterprises and the Sustainable Development Goals: An institutional approach to corporate engagement. J. Int. Bus. Policy 2018, 1, 208–233. [Google Scholar] [CrossRef]
  16. OECD. Measuring Distance to the SDG Targets 2017: An Assessment of Where OECD Countries Stand; OECD Publishing: Paris, France, 2018. [Google Scholar] [CrossRef]
  17. UNGC. Reporting on the SDGs. 2023. Available online: https://unglobalcompact.org/take-action/action-platforms/sdg-reporting (accessed on 12 June 2023).
  18. GRI. Business Reporting on the SDGs. 2018. Available online: https://www.globalreporting.org (accessed on 12 June 2023).
  19. Bebbington, J.; Unerman, J. Achieving the United Nations Sustainable Development Goals: An enabling role for accounting research. Account. Audit. Account. J. 2018, 31, 2–24. [Google Scholar] [CrossRef]
  20. Schramade, W. Investing in the UN Sustainable Development Goals: Opportunities for companies and investors. J. Appl. Corp. Financ. 2017, 29, 87–99. [Google Scholar] [CrossRef]
  21. Rosati, F.; Faria, L.G.D. Business contribution to the Sustainable Development Agenda: Organizational factors related to early adoption of SDG reporting. Corp. Soc. Responsib. Environ. Manag. 2019, 26, 588–597. [Google Scholar] [CrossRef]
  22. Edmans, A.; Kacperczyk, M. Sustainable finance. Rev. Financ. 2022, 26, 1309–1313. [Google Scholar] [CrossRef]
  23. Weber, O. Sustainable finance and the SDGs: The role of the banking sector. In Achieving the Sustainable Development Goals; Routledge: London, UK, 2019; pp. 226–239. [Google Scholar]
  24. Schaltegger, S.; Burritt, R. Business cases and corporate engagement with sustainability: Differentiating ethical motivations. J. Bus. Ethics 2018, 147, 241–259. [Google Scholar] [CrossRef]
  25. Talbot, D.; Boiral, O. GHG reporting and impression management: An assessment of sustainability reports from the energy sector. J. Bus. Ethics 2018, 147, 367–383. [Google Scholar] [CrossRef]
  26. Lassala, C.; Orero-Blat, M.; Ribeiro-Navarrete, S. The financial performance of listed companies in pursuit of the Sustainable Development Goals (SDG). Econ. Res. Ekon. Istraživanja 2021, 34, 427–449. [Google Scholar] [CrossRef]
  27. Avrampou, A.; Skouloudis, A.; Iliopoulos, G.; Khan, N. Advancing the Sustainable Development Goals: Evidence from leading European banks. Sustain. Dev. 2019, 27, 743–757. [Google Scholar] [CrossRef]
  28. Khaled, R.; Ali, H.; Mohamed, E.K. The Sustainable Development Goals and corporate sustainability performance: Mapping, extent and determinants. J. Clean. Prod. 2021, 311, 127599. [Google Scholar] [CrossRef]
  29. Azmi, W.; Hassan, M.K.; Houston, R.; Karim, M.S. ESG activities and banking performance: International evidence from emerging economies. J. Int. Financ. Mark. Inst. Money 2021, 70, 101277. [Google Scholar] [CrossRef]
  30. Trane, M.; Marelli, L.; Siragusa, A.; Pollo, R.; Lombardi, P. Progress by research to achieve the Sustainable Development Goals in the EU: A systematic literature review. Sustainability 2023, 15, 7055. [Google Scholar] [CrossRef]
  31. Nilsson, M.; Chisholm, E.; Griggs, D.; Howden-Chapman, P.; McCollum, D.; Messerli, P.; Neumann, B.; Stevance, A.S.; Visbeck, M.; Stafford-Smith, M. Mapping interactions between the Sustainable Development Goals: Lessons learned and ways forward. Sustain. Sci. 2018, 13, 1489–1503. [Google Scholar] [CrossRef] [PubMed]
  32. Vinuesa, R.; Azizpour, H.; Leite, I.; Balaam, M.; Dignum, V.; Domisch, S.; Felländer, A.; Langhans, S.D.; Tegmark, M.; Fuso Nerini, F. The role of artificial intelligence in achieving the Sustainable Development Goals. Nat. Commun. 2020, 11, 233. [Google Scholar] [CrossRef] [PubMed]
  33. Pincet, A.; Okabe, S.; Pawelczyk, M. Linking Aid to the Sustainable Development Goals—A Machine Learning Approach; OECD Development Co-operation Working Papers, No. 52; OECD: Paris, France, 2019. [Google Scholar]
  34. Pukelis, L.; Puig, N.B.; Skrynik, M.; Stanciauskas, V. OSDG–Open-Source approach to classify text data by UN Sustainable Development Goals (SDGs). arXiv 2020, arXiv:2005.14569. [Google Scholar]
  35. Sciandra, A.; Surian, A.; Finos, L. Supervised machine learning methods to disclose action and information in “UN 2030 agenda” social media data. Soc. Indic. Res. 2021, 156, 689–699. [Google Scholar] [CrossRef]
  36. Nugroho, A.; Kusumawardani, S. Distributed classifier for SDGs topics in online news using RabbitMQ message broker. In Proceedings of the Journal of Physics: Conference Series; IOP Publishing: Bristol, UK, 2020; Volume 1577, p. 012026. [Google Scholar]
  37. ElAlfy, A.; Darwish, K.M.; Weber, O. Corporations and Sustainable Development Goals communication on social media: Corporate social responsibility or just another buzzword? Sustain. Dev. 2020, 28, 1418–1430. [Google Scholar] [CrossRef]
  38. Matsui, T.; Suzuki, K.; Ando, K.; Kitai, Y.; Haga, C.; Masuhara, N.; Kawakubo, S. A Natural Language Processing model for supporting Sustainable Development Goals: Translating semantics, visualizing nexus, and connecting stakeholders. Sustain. Sci. 2022, 17, 969–985. [Google Scholar] [CrossRef] [PubMed]
  39. Guisiano, J.; Chiky, R. Automatic classification of multilabel texts related to Sustainable Development Goals (SDGs). In Proceedings of the TECHENV EGC2021, Montpellier, France, 26 January 2021. [Google Scholar]
  40. Vaswani, A.; Shazeer, N.; Parmar, N.; Uszkoreit, J.; Jones, L.; Gomez, A.N.; Kaiser, Ł.; Polosukhin, I. Attention is all you need. Adv. Neural Inf. Process. Syst. 2017, 30, 5998–6008. [Google Scholar]
  41. Wu, Y.; Schuster, M.; Chen, Z.; Le, Q.V.; Norouzi, M.; Macherey, W.; Krikun, M.; Cao, Y.; Gao, Q.; Macherey, K. Google’s neural machine translation system: Bridging the gap between human and machine translation. arXiv 2016, arXiv:1609.08144. [Google Scholar]
  42. Turian, J.; Ratinov, L.; Bengio, Y. Word representations: A simple and general method for semi-supervised learning. In Proceedings of the 48th Annual Meeting of the Association for Computational Linguistics, Uppsala, Sweden, 11–16 July 2010; pp. 384–394. [Google Scholar]
  43. González-Carvajal, S.; Garrido-Merchán, E.C. Comparing BERT against traditional machine learning text classification. arXiv 2020, arXiv:2005.13012. [Google Scholar]
  44. Torrey, L.; Shavlik, J. Transfer learning. In Handbook of Research on Machine Learning Applications and Trends: Algorithms, Methods, and Techniques; IGI Global: Hershey, PA, USA, 2010; pp. 242–264. [Google Scholar]
  45. Liu, Y.; Ott, M.; Goyal, N.; Du, J.; Joshi, M.; Chen, D.; Levy, O.; Lewis, M.; Zettlemoyer, L.; Stoyanov, V. RoBERTa: A robustly optimized BERT pretraining approach. arXiv 2019, arXiv:1907.11692. [Google Scholar]
  46. Howard, J.; Ruder, S. Universal language model fine-tuning for text classification. arXiv 2018, arXiv:1801.06146. [Google Scholar]
  47. Lee, J.; Yoon, W.; Kim, S.; Kim, D.; Kim, S.; So, C.H.; Kang, J. BioBERT: A pre-trained biomedical language representation model for biomedical text mining. Bioinformatics 2020, 36, 1234–1240. [Google Scholar] [CrossRef] [PubMed]
  48. Mehra, S.; Louka, R.; Zhang, Y. ESG-BERT: Language model to help with classification tasks related to companies Environmental, Social, and Governance practices. arXiv 2022, arXiv:2203.16788. [Google Scholar]
  49. Phang, J.; Févry, T.; Bowman, S.R. Sentence encoders on stilts: Supplementary training on intermediate labeled-data tasks. arXiv 2018, arXiv:1811.01088. [Google Scholar]
  50. Williams, A.; Nangia, N.; Bowman, S.R. A broad-coverage challenge corpus for sentence understanding through inference. arXiv 2017, arXiv:1704.05426. [Google Scholar]
  51. Srivastava, N.; Hinton, G.; Krizhevsky, A.; Sutskever, I.; Salakhutdinov, R. Dropout: A simple way to prevent neural networks from overfitting. J. Mach. Learn. Res. 2014, 15, 1929–1958. [Google Scholar]
  52. Krogh, A.; Hertz, J. A simple weight decay can improve generalization. Adv. Neural Inf. Process. Syst. 1991, 4, 950–957. [Google Scholar]
  53. Loshchilov, I.; Hutter, F. Fixing weight decay regularization in Adam. In Proceedings of the ICLR, Vancouver, BC, Canada, 30 April–3 May 2018. [Google Scholar]
  54. Agnello, L.; Sousa, R.M. How does fiscal consolidation impact on income inequality? Rev. Income Wealth 2014, 60, 702–726. [Google Scholar] [CrossRef]
  55. Choi, Y.; Kim, H.j.; Lee, Y. Economic consequences of the COVID-19 pandemic: Will it be a barrier to achieving sustainability? Sustainability 2022, 14, 1629. [Google Scholar] [CrossRef]
  56. Elsamadony, M.; Fujii, M.; Ryo, M.; Nerini, F.F.; Kakinuma, K.; Kanae, S. Preliminary quantitative assessment of the multidimensional impact of the COVID-19 pandemic on Sustainable Development Goals. J. Clean. Prod. 2022, 372, 133812. [Google Scholar] [CrossRef]
  57. Krellenberg, K.; Koch, F. Conceptualizing interactions between SDGs and urban sustainability transformations in COVID-19 times. Politics Gov. 2021, 9, 200–210. [Google Scholar] [CrossRef]
  58. Maffei, L.; Ciervo, A.; Perrotta, A.; Masullo, M.; Rosato, A. Innovative energy-efficient prefabricated movable buildings for smart/co-working: Performance assessment upon varying building configurations. Sustainability 2023, 15, 9581. [Google Scholar] [CrossRef]
  59. Buallay, A. Is sustainability reporting (ESG) associated with performance? Evidence from the E uropean banking sector. Manag. Environ. Qual. Int. J. 2019, 30, 98–115. [Google Scholar] [CrossRef]
  60. Cer, D.; Yang, Y.; Kong, S.Y.; Hua, N.; Limtiaco, N.; John, R.S.; Constant, N.; Guajardo-Cespedes, M.; Yuan, S.; Tar, C.; et al. Universal sentence encoder. arXiv 2018, arXiv:1803.11175. [Google Scholar]
  61. Likas, A.; Vlassis, N.; Verbeek, J.J. The global k-means clustering algorithm. Pattern Recognit. 2003, 36, 451–461. [Google Scholar] [CrossRef]
  62. Tibshirani, R.; Walther, G.; Hastie, T. Estimating the number of clusters in a data set via the gap statistic. J. R. Stat. Soc. Ser. B (Stat. Methodol.) 2001, 63, 411–423. [Google Scholar] [CrossRef]
Table 1. Descriptive Statistics of European Banks’ Sustainability Reports. In total, there are 816 reports for 98 banks between 2010 and 2022. Those reports ventilate across years as in Panel a and across geographic regions as in Panel b. #banks is the number of banks in each country. Cent. and East. EU means Central and Eastern Europe.
(a) Number of Sustainability Reports per Year
EU Region2010201120122013201420152016201720182019202020212022
Western EU13131617171925353738373634
Southern EU11111012121314192020212119
Northern EU3558101113141616171716
Central and Eastern EU4476688141316151310
Total31333843455160828690908779
(b) Distribution of Banks across EU Regions
Western EU#banksSouthern EU#banksNorthern EU#banksCent. and East. EU#banks
Austria3Cyprus3Denmark8Czech Republic2
Belgium1Greece4Finland3Estonia1
France5Italy9Norway3Hungary2
Germany11Spain6Sweden3Poland3
Ireland2 Russia2
Netherlands3 Slovenia2
Switzerland9 Turkey6
United Kingdom6 Romania1
Total40Total22Total17Total19
Table 2. Descriptive statistics of input dataset for model fine-tuning. In this table, we present for each SDG the number of sentences used as inputs from our two data sources. UN-related refers to the OSDG-CD dataset and Banks’ Reports are our hand-classified sustainability reports, as discussed in Table 1.
SDG01234567891011121314151617Total
UN-related131549031580211581183376920388562436438282495412535164129312,041
Banks’ Reports6193393278668855573906386145842575686796273125745463549736
Total1934829642166820431740766155810021146693100696111227241109218764721,777
Table 3. Result of model evaluation on test dataset.
SDG01234567891011121314151617accu.m.avg
precision0.950.920.980.920.910.930.930.930.890.960.880.920.970.921.000.910.890.91 0.93
recall0.980.970.930.970.960.940.990.950.970.950.750.930.911.000.870.950.930.73 0.93
F1-score0.970.950.960.950.930.930.960.940.930.950.810.930.940.960.930.930.910.810.930.93
Table 4. Prevalence of SDGs. Red corresponds to the most frequently discussed SDGs and green to the least discussed ones.
YearSDG 1SDG 2SDG 3SDG 4SDG 5SDG 6SDG 7SDG 8SDG 9SDG 10SDG 11SDG 12SDG 13SDG 14SDG 15SDG 16SDG 17
20101516881015615139310131253
201114167810157241410310141252
201215157710148241410310141152
2013151687101472313949141252
20141516789148231310510141252
201516158891583413949141153
2016161578814833121049141262
2017151587815834129510131242
2018151578815833139410131242
2019161579815834131057131252
20201616310815676141036121163
20211716511815577141143121064
20221616711915477141132121064
Table 5. Results of regression analysis.
SDG 3SDG 7SDG 8SDG 9SDG 13
exp_healthenergy_intenco2_gdpunemploylct_GDPexp_eaexp_amenghg_emiss
0.3143 ***0.2550 **0.3701 ***0.3356 ***−0.3463 ***−0.3469 ***0.5285 ***−0.6865 ***
(0.114)(0.118)(0.110)(0.109)(0.099)(0.099)(0.098)(0.142)
Standard errors are given in parentheses. Estimated by OLS. ** p-value < 0.05, *** p-value < 0.01.
Table 6. Prevalence of SDGs across EU regions. Red corresponds to the most frequently discussed SDGs and green to the least discussed ones.
YearSDG 1SDG 2SDG 3SDG 4SDG 5SDG 6SDG 7SDG 8SDG 9SDG 10SDG 11SDG 12SDG 13SDG 14SDG 15SDG 15SDG 17
WNSEWNSEWNSEWNSEWNSEWN S E W N S E W N S E W N S E W N S E W N S E W N S E W N S E W N S E W N S E W N S E W N S E
2010141615151616161688886898101091416151412677621126444121414128129524441061114141016131214121465553232
2011131614121416161678786987911101116141415678711225442131214131010963246981114141215141311121256562322
2012151715151415161587768762101010111612141469892224424213121616101297254788121314101410121591256652323
2013151516141516161788868876111081215141415688722244231131214161011982458881113141115111315101064462223
201415151613161615138776910851088101614141581088222143311214141711121084547881016141115151413101145461234
2015161416121514151599888866988101513141678963322544113121313911883457781014141015151313111165542233
201616151615151315148878988798612141314167108633324332121114141011106365888111215101415131410855662222
201715161615151515148887967688781514151681089333144431212141410910936467111115131113121313101144442223
201816151615151416148875988788710151414168889322244321212141410101074456781014141214141313121054453222
20191615161515151615886510108788810151514158879322345321212141511101084465651012141113141314121144653222
20201616171616151616472110121098661015141515755767675764121514141110111043333471112111313121291058643343
2021161617161616151668321112118868101515141463488866787513141415101111103454334612111212111091055854244
2022161516161616161679651112111089791515151542666865787414141414111110113345222512813121010101066764444
Disclaimer/Publisher’s Note: The statements, opinions and data contained in all publications are solely those of the individual author(s) and contributor(s) and not of MDPI and/or the editor(s). MDPI and/or the editor(s) disclaim responsibility for any injury to people or property resulting from any ideas, methods, instructions or products referred to in the content.

