Article

A Modular IoT-Based Architecture for Logistics Service Performance Assessment and Real-Time Scheduling towards a Synchromodal Transport System

1
Department of Economics, Management, Industrial Engineering and Tourism (DEGEIT), Campus Universitário de Santiago, University of Aveiro, 3810-193 Aveiro, Portugal
2
Department of Mathematics (DMat) and Center for Research and Development in Mathematics and Applications (CIDMA), Campus Universitário de Santiago, University of Aveiro, 3810-193 Aveiro, Portugal
3
Department of Mechanical Engineering (DEM), Campus Universitário de Santiago, University of Aveiro, 3810-193 Aveiro, Portugal
*
Author to whom correspondence should be addressed.
Sustainability 2024, 16(2), 742; https://doi.org/10.3390/su16020742
Submission received: 3 November 2023 / Revised: 4 January 2024 / Accepted: 10 January 2024 / Published: 15 January 2024

Abstract

:
Logistics is significantly impacted by quality/quantity issues associated with data collection and data sharing restrictions. Nonetheless, public data from national entities and internet-of-things (IoT) solutions enable the development of integrated tools for performance analysis and real-time optimization of logistics networks. This study proposes a three-module data-driven system architecture that covers (a) logistics data collection tools, (b) logistics services performance evaluation, and (c) the transition to synchromodal systems. Module 1 integrates multisource data from national logistics platforms and embedded devices placed within intermodal containers. A multigraph representation of the problem is conceived. Environmental, economic, and operational data are generated and injected into a digital twin. Thus, key performance indicators (KPIs) are computed by simulation or direct transformation of the collected data. Module 2 uses Multi-directional Efficiency Analysis, an optimization algorithm that benchmarks multimodal transportation routes of containers using prior KPIs. Outputs are a technical performance index relevant to logistics clients and improvement measures for logistics service providers. A real case study application of the solution proposed for Module 2 is presented. Module 3 provides real-time scheduling and assignment models using CP-sat solvers, accommodating varying system dynamics and resource availability, minimizing makespan and operational costs.

1. Introduction

Supply chain effectiveness and sustainability are highly affected by common restrictions in data sharing between logistics players, hampering the client’s ability to properly determine the best available logistics solutions [1]. In this sense, publicly available data from national entities and IoT-based solutions, like custom-made sensorized devices, can facilitate the creation of a tool that enables impartial performance analysis and a more realistic optimization of the intermodal network.
Furthermore, driven by the pervasive digitization across numerous industries, both local and international entities tasked with managing transportation and logistics networks are actively seeking to transition or adjust their intermodal systems to synchromodal systems. Synchromodal systems rely on the utilization of real-time data, making them capable of dynamically adapting to various events such as fluctuations in load volume, delays, or staffing shortages, and hence demonstrating greater resilience [2]. The modeling of synchromodal systems involves formulating and solving optimization problems that can effectively optimize the allocation and utilization of resources in response to changing circumstances.
Recognizing the widespread interest in the literature surrounding the following topics: (1) data collection tools for logistics, (2) performance evaluation of logistics services, and (3) the transition from intermodal logistics to synchromodal systems, this research paper introduces a three-module digital tool aimed at fostering sustainable and flexible logistics management. Each module incorporates a solution regarding the aforementioned topics. The first module integrates multisource data from Portugal’s national logistics digital platform (JUL) and embedded monitoring devices placed within containers traveling along an intermodal network. Afterward, a graph representation of a logistics model is conceived. Each node represents either a transportation mean or a location in the network, with environmental, economic, and operational data injected into a digital twin. A set of key performance indicators (KPIs) can be determined by simulation or through direct data transformation from the collected data. Using previously calculated KPIs, the second module offers a benchmarking tool to rank multimodal transportation routes of containers executed by Logistics Service Providers (LSPs). The tool employs Multi-directional Efficiency Analysis (MEA), an enhanced variation of Data Envelopment Analysis (DEA) well-established in Operational Research. This approach yields two key outputs: a technical efficiency index (TEI) for each multimodal transportation route of containers and a corresponding set of improvement measures based on inefficiency analysis. The first output benefits logistics services clients by pinpointing the most efficient routes per LSP. The second output is valuable for LSPs, identifying variables contributing to a lower attributed TEI. Lastly, the third module provides a real-time scheduling and assignment model using the CP-sat solvers, adaptable to varying system dynamics and resource availability, allowing the minimization of the makespan and operational costs.
The proposed three-module architecture is part of the ongoing research within the scope of the Portuguese National Agenda NEXUS, where, for prototyping, some data is synthetically generated and, for testing and validation, real data from the involved companies is used. In what follows, this paper presents a prototype version of the modular architecture. Moreover, this study is also one of the ongoing works about IoT and Artificial Intelligence (AI)-based applications for incorporation into a Multimodal Control Tower. To maintain its brevity, the authors showcase a real case study focused solely on the application of the methodology behind Module 2, as it plays a strategic role in the integration of further modules. Future work will then unveil the practical outcomes of the proposed solutions from Modules 1 and 3 to real-world case studies, delving deeper into their associated formal mathematical models. Nevertheless, the authors are confident that the approach is general enough to be employed in other contexts whenever the requirements are met.
This work, in particular Module 2 and its integration with the other modules, contributes to the literature by providing an integrated tool that enables a transparent evaluation of logistics services, benefiting both logistics clients and LSP players. For the former, it is possible to evaluate the most favorable contract for a given logistics demand creating a more auspicious landscape for contract negotiation; and for the latter, by providing specific improvement directions to increase competitiveness concerning benchmarked rivals.
The structure of the paper is organized as follows:
  • Section 2 provides a brief literature review on the aforementioned research topics;
  • Section 3 introduces the NEXUS Agenda aim and overall project requirements while pinpointing three associated research challenges and the authors’ proposed solutions;
  • Section 4 offers a comprehensive explanation of the proposed digital architecture, where each module is clarified in its separate Section 4.1, Section 4.2 and Section 4.3;
  • Section 5 introduces a simplified case study application of Module 2, starting with a short problem characterization in Section 5.1, Section 5.2 explains the case study data, followed by the MEA parameters formalization in Section 5.3, and results presentation and discussion in Section 5.4;
  • Lastly, Section 6 highlights major conclusions and Section 7 future work within the project.

2. Literature Review

2.1. Data Collection in Logistics

When discussing logistics data, several limitations have been pinpointed in the literature in terms of data quantity and quality, reliability, time, and cost constraints [3]. The establishment of an inclusive and unbiased solution to facilitate data collection in the logistics industry can be arduous and frustrating, involving the utilization of multiple sources and the consolidation of data into a unified database [4].
In the 2022 Interim Report, the European Commission stated that digitalization might serve as a significant catalyst and facilitator for enhancing efficiency, sustainability, simplification, cost reduction, and optimal utilization of resources and infrastructures [5]. In this sense, IoT has been a disruptive technology in the recent decade, with applications ranging from intelligent transport systems (e.g., freight management systems, and traffic flow monitoring and control), to supply chain and quality control management [6]. Nonetheless, logistics is frequently identified as one of the biggest beneficiaries of the IoT revolution, as these are crucial technologies for logistics systems to move towards Physical Internet (PI) paradigms [7,8]. The shift towards more modern methods, such as PI, shows itself to be imperative as current techniques are proving to become unreliable, and both economically and environmentally unsustainable [9].
The benefits of integrating IoT technologies into logistics systems are quite clear, and certain applications are already seeing widespread adoption. One such example has been the extensive implementation of barcode scanners, Radio Frequency Identification (RFID), and geospatial sensor technologies in product traceability and inventory management, then feeding this information into computerized registries [10]. However, the door remains open to further innovation. In the seminal work introduced in [11], several application areas of IoT in logistics are highlighted from a vehicular standpoint. These include vehicle tracking metrics such as speed, acceleration, traveled distance, location, engine telemetry, and fatigue management. Through the combination of these factors, it is possible to provide more accurate real-time monitoring and tracking of supply-chain components. Furthermore, the use of this data enables the analysis of driving patterns, which in turn can contribute to improving driver training and reinforcing safer and more efficient driving practices.
As the transport sector represents one of the largest contributors to Green House Gases (GHG), due to the combustion of fossil fuels, driving efficiency gains added importance. Yet, several other factors show a consequential relationship to vehicle emissions, such as operating mass, and vehicle, weather, and road conditions [12]. This opens the possibility of more comprehensive applications of IoT technologies in this area, by sensing and monitoring these influencing elements and aggregating data into actionable information for logistics services.
In fact, the green development of logistics is one of the main focus areas for the application of IoT technology. For instance, in [13] an IoT platform for GHG emissions monitoring in last-mile delivery is introduced and implemented, demonstrating the feasibility of creating real-time and dynamic models for carbon emissions assessment. These models were made possible by the enrichment of reporting through circumstantial context regarding the vehicle, environmental, and driving behaviors, enabled only through the use of smart embedded devices. However, even in static models, IoT can be of service. One such example occurs in [14], where an intelligent vehicle dispatch mechanism is constructed by utilizing real-time IoT data. Making use of inputs such as geospatial location, and through the combination of path planning algorithms and carbon emission functions, it is possible to minimize pollutant emissions in the green logistics vehicle scheduling problem. Even in green logistics systems based on zero or low-pollution vehicles, IoT proves valuable for scheduling charging operations in fleet management [15].
The ecological footprint of logistics is not solely dependent on emissions produced by the transportation phase, rather being a complex combination of factors. One such factor is the waste derived from improper handling of Environmentally Sensitive Products (ESPs) or perishable goods. In [16], a dynamic route management system for the transportation of perishable products is proposed, emphasizing the optimization of both direct GHG emissions, as well as overall cargo quality and product integrity. By leveraging IoT and utilizing RFID, wireless sensor networks (WSN), and retrieving real-time shipment data, routes could be re-computed more reliably and with a lower mean cost per shipment. Management of products in cold chains has also been a proponent of IoT, particularly for the real-time monitoring of environmental variables such as temperature and humidity [17,18].

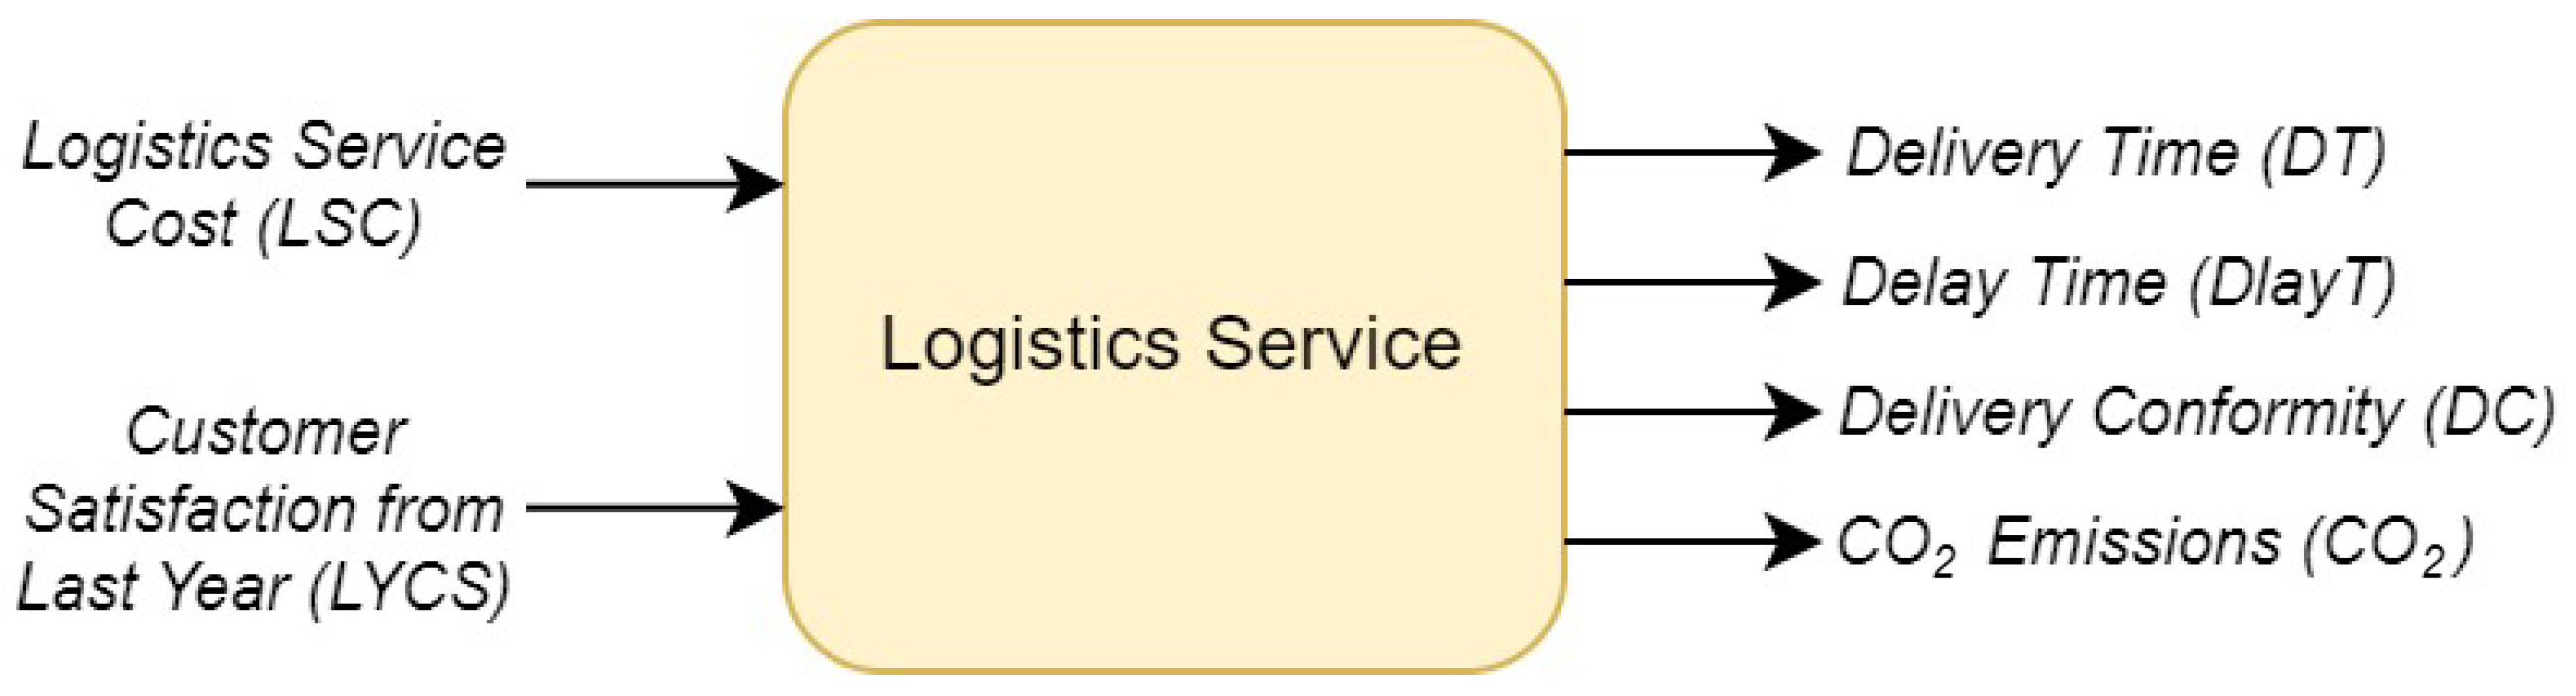
2.2. Performance Evaluation of Logistic Services

Performance measurement and evaluation are paramount to organizational success as they create understanding, shape behavior, and energize people toward competitive results. Over many years, logistics performance has been associated with many distinct concepts, from efficiency to effectiveness, quality to productivity, lacking a universally accepted definition. In this paper, taking into account the particular characteristics of the case study examined in Section 5, and the ideas from the acknowledged work of [19], logistics performance is perceived through five interrelated dimensions:
(D1)
on-time delivery—is related to the ability to deliver the goods to the final logistics client within the contractualized deadline. Nowadays, with the assistance of predictive algorithms [20], logistics managers can negotiate delivery due dates more accurately to their clients. Nevertheless, when atypical events occur, e.g., worker strikes, extraordinary environmental phenomena [21], unexpected vehicle issues and equipment failure, lost or stolen goods, or documentation errors, on-time delivery may be severely affected, so as all other logistics performance dimensions;
(D2)
customer satisfaction—is defined as “the customer’s positive emotional response to an evaluation of perceived differences between the actual experience with a service and prior expectations of it” [22] (p. 150). Literature has shown that companies with a more customer-oriented or service quality-oriented approach have significantly higher customer retention rates and better market share of their services (an increased social/marketing image), enticing new customers into buying the service [23].
(D3)
“fair” prices for inputs—this dimension comprises all costs that may be associated with logistics services, from inventory, namely all expenses for storing and handling products; packaging, which is concerned with preparing goods to ensure product integrity during the logistics service; transport, and all the expenses with the vehicles fleet: fuel, maintenance, insurance, tolls, and others; taxes from governments; incorporation of technology, e.g., a tracking system placed in a vehicle and connected to a system via WiFi, where the final client can visualize where the cargo is located; to all manpower related costs.
(D4)
social responsibility—in logistics, social responsibility is associated with sustainable and ethical practices employed by logistics companies to reduce the negative impact their operations cause on the environment and society. It is directly concerned with the three pillars of sustainability: economic, environmental, and social [24]. More recently, green logistics (with more emphasis on the environmental aspect and overall CO2 emissions reduction) has received substantial interest from researchers, practitioners, and governments. A manifold of new and revolutionary changes in low-carbon transportation infrastructure, transportation electrification and decarbonization, and intelligent transportation systems management have been powered by governmental policies in symbiosis with emerging technologies [25].
(D5)
low loss and damage—this dimension is concerned with measuring and analyzing incorrectly delivered orders (or with errors), and products that have been damaged during handling or transportation. For containerized cargo, the work in [26] mentions that loss or damage of goods/assets ranks number one on the operational risk scale. Thus, exploring the root causes of these occurrences is pivotal in order not to repeat them in the future, as the condition of the order is one of the leading factors of customer satisfaction in logistics service quality [27].
On a major (global) scale, the World Bank has proposed a benchmarking instrument so-called Logistics Performance Index (LPI), an aggregated measure of six KPIs calculated using Principal Component Analysis (PCA), that outlines the efficiency of the logistics sector for each of the 139 involved countries [28]. The KPIs are (C—“Customs”) customs efficiency and border management clearance, (I—“Infrastructure”) trading quality and transport infrastructure, (E—“Ease of shipments arrangement”) the ease of access to competitively priced shipments, (Q—“Quality of logistics services”) quality and expertise on the operations of forwarding, trucking, and customs brokerage, (T—“Tracking and tracing”) tracking ability and trace consignments, and (TM—“Timeliness”) the frequency of on-time deliveries from shipments to their consignees (scheduled and expected due time comparison). Recently, authors in [29] proposed the I(improved)LPI, an extended version of the previous KPI with weighted subindex levels and values. The goal is to ground the metric in objective statistical data, where the weights were determined using qualitative data through the Best-Worst multi-criteria decision-making method and quantitative data from a survey made to academia and logistics experts.
On the other hand, on a “smaller” scale (addressing more local or national research projects) the value and importance of applying DEA techniques for logistics research has been well asserted in the literature [19]. In fact, multi-criteria decision-making methods have been widely used for logistics performance assessment, and DEA-based techniques and variations combined with other methods have been employed by several authors [30].

2.3. From Multimodal to Synchromodal Logistics

Considering the supply chain distribution process, Multimodality refers to utilizing various transportation modes (such as rail, truck, ship, barge, and aircraft) for a single shipment. The entire shipment is handled through a single bill of lading or a comparable contract. Thus, a single transportation company manages the entire shipping process and assumes complete responsibility for its execution.
On the other side, Intermodality involves integrating and coordinating different modes within a door-to-door supply chain, where each mode is operated by a separate carrier under separate contracts, allowing cost savings. Clients indicate the origin and destination, but the paths and transportation modes are flexible as long as the demand is met [31]. In practice, intermodality exists; however, there is still a notable absence of seamless coordination between various air and surface transport modes and their respective systems on a broader scale [32]. To thrive in the highly competitive transportation industry, intermodal transport must meet the increasing demands of its clients and adapt to the evolving business landscape. This entails enhancing flexibility and providing more personalized services. To achieve this, novel concepts arose, focusing on innovative operation modes and combinations/arrangements that enhance service quality and generate significant cost savings in hinterland transport. A particularly promising area in this context is known as Synchromodal Freight Transport [33].
Synchromodality emerges as a progressive advancement of intermodal transport concepts, where the decisions concerning modal choice and routing are not predetermined in the long run but made based on real-time information [34]. It includes the active collaboration of transport chain stakeholde [30] rs (horizontal cooperation [33]) within a highly cooperative network, placing a strong emphasis on the adaptable management of corridors to cater to the broader interests of the entire supply chain. Practically speaking, the primary objective is to enable flexible planning of transport processes and facilitate real-time mode switching based on the availability of resources [35,36]. In fact, when addressing synchromodal transportation, the concept of sustainability comes intertwined. Its practical objectives are aimed to reduce carbon emissions, energy consumption, and congestion, as well as enhance resource utilization and improve logistics efficiency, so synchromodal systems can potentially mitigate the environmental impacts in the transportation sector [37].
In terms of practical applications, in a systematic review made by [37], the authors examine several quantitative studies on synchromodal transportation from 2010 to 2022 and identify three main categories related to the topic/scope of research:
(C1)
Research focusing on shipment matching and the associated operational decision-making processes under diverse and varying scenario conditions;
(C2)
Research related to the mapping of transport networks, considering the influence of synchromodality features. Some of the addressed problems are strategic terminal planning, transport service pricing, transport mode schedule planning, and decentralized cooperation mechanisms;
(C3)
Research focused on the adaptation of synchromodality within a supply chain context. The included studies aim to develop digital tools that can be applied to synchromodal transportation.
Another interesting finding in [37] that matches the area of the case study later explored in this paper, is that 75% of the proposed models in the articles analyzed refer to port hinterland transportation, highlighting the importance of hinterland logistics.
Regarding future research, looking from a more applicational standpoint on the topic, the authors recognize (1) legal barriers, liability, and insurance issues related to horizontal collaboration and data sharing in synchromodal transportation; (2) a lack of attention to physical interoperability problems, interconnections of infrastructure in synchromodality, utilization of Blockchain and IoT to data security and connectivity of loading units; (3) need for the incorporation of real-life data from synchromodal projects (also considering occurrences such as truck driver shortages, alternative fuels and engines, and short-duration disruptions). The comprehensive work of [37] is strongly recommended for the most interested reader on synchromodality.

3. NEXUS Agenda Requirements, Research Challenges and Proposed Solutions

NEXUS (see https://nexuslab.pt, accessed on 30 July 2023) is a Portuguese innovation agenda for the digital and green transition coordinated by the Port of Sines Association and comprises 35 partners, involving port authorities, maritime operators, terminal operators, railway operators, carriers, dry ports, technology suppliers, importers, exporters, and logistics operators. The ambition is to develop innovative solutions related to transportation, logistics, and mobility, aiming to generate 28 new products. The study described in this work and corresponding modules (see Figure 1) were developed in the scope of the ongoing (until 2025) NEXUS work package 2.1 regarding AI-based applications for incorporation into a Multimodal Control Tower.
To meet the project requirements, three major research challenges were pre-identified and their proposed solutions are as follows:
(R1)
Collection and integration of logistics data—Security, trustworthiness, and robustness challenges: In a generic sense, several IoT-based devices for data collection are available in the commercial market. Yet, these lack the advantages of the inherent higher trust given to an in-house device, with a high degree of control over hardware and software. Moreover, custom firmware further enables the application of more refined data monitoring algorithms and more robust management of data throughput. To meet this, the authors propose a so-called Predictive Maintenance Smart Probe (PMSP) device, which aims to be incorporated into a digital component (Module 1) responsible for data collection and integration with publicly available data. A detailed explanation is provided in Section 4.1.
(R2)
Performance assessment of multimodal transportation routes—A benchmarking-based tool for LSPs and logistics clients: As the previous literature showed, multi-criteria decision-making methods have been widely used for logistics performance assessment (see [30], a review on the topic considering more than 120 research articles published from 2010 to 2019). However, several of those methods depend on parametric choices, such as weights, that are sensible to variability and/or internally project a high-dimension to a one-dimension space, combining completely different variables units, and scales. Furthermore, several of them compute a (quasi-)optimal solution but do not allow to benchmark all the decision-making units (DMUs) involved. Although not a common method in logistics studies, DEA-based techniques and variations, blended or not with other methods, solve some of the mentioned issues and it is known as one of the most viable approaches for nonparametric benchmarking. Nevertheless, the classic DEA approach still lacks some key features relevant to meeting the aforementioned project requirements. Thus, the authors propose an optimization tool based on MEA, a further refinement of classic DEA that (1) considers all possible improvement directions for each DMU, (2) does not rely on just one specific improvement direction for ranking and (3) provides an individual inefficiency analysis per variable/KPI. Such versatility allows for diverse combinations of input-output gains and losses, as well as providing a specific analysis of which factors directly contribute to inefficient ranking scores. Compared to traditional DEA, the number of MEA applications for performance assessment of logistics and transport services is rare. Only the study of [38] was found, so the present work seeks to contribute to the literature in the field while addressing the project needs. Further details are provided in Section 4.2.
(R3)
Real-time scheduling and assignment towards synchromodal operations—A dynamic tool that accommodates varying system dynamics and resource availability while minimizing makespan and transportation costs: Traditionally, optimization of logistics networks has been solved using global optimization techniques. More prominently than in the intermodality field, nowadays synchromodality is a trend and need since logistics is constantly evolving with the recent adoption of I4.0 technologies, where businesses are striving more than ever to find new ways to enhance efficiency and reduce costs, pushing an urgent demand for approaches that can optimize in real-time. Optimization methods for decision-making or planning are offline by nature. Hence, one of the Module 3 requirements is to push the boundaries of optimization methods from a data batch scheme to a streaming scheme. Considering its complexity, this module is presented in this work just for completeness reasons. It requires a more detailed explanation in a future publication, not only due to the streaming concept but also because it merges two widely known NP-hard problems: a variation of the job scheduling problem and a variation of the generalized assignment problem. Although Module 2 is the core of this work, in what follows, we briefly explain some details of Module 3 and its integration into the 3-module architecture.

4. Our 3-Module Architecture

The complete algorithmic solution of the Multimodal Control Tower is extensive and complex. Hence, for brevity, this paper provides a macroscopic explanation of the structure of three integrated modules that are proposed for incorporation. Nevertheless, to showcase its practical relevance, a case study application is advanced for the solution in Module 2, for which a greater level of mathematical detail is further provided in Section 4.2.

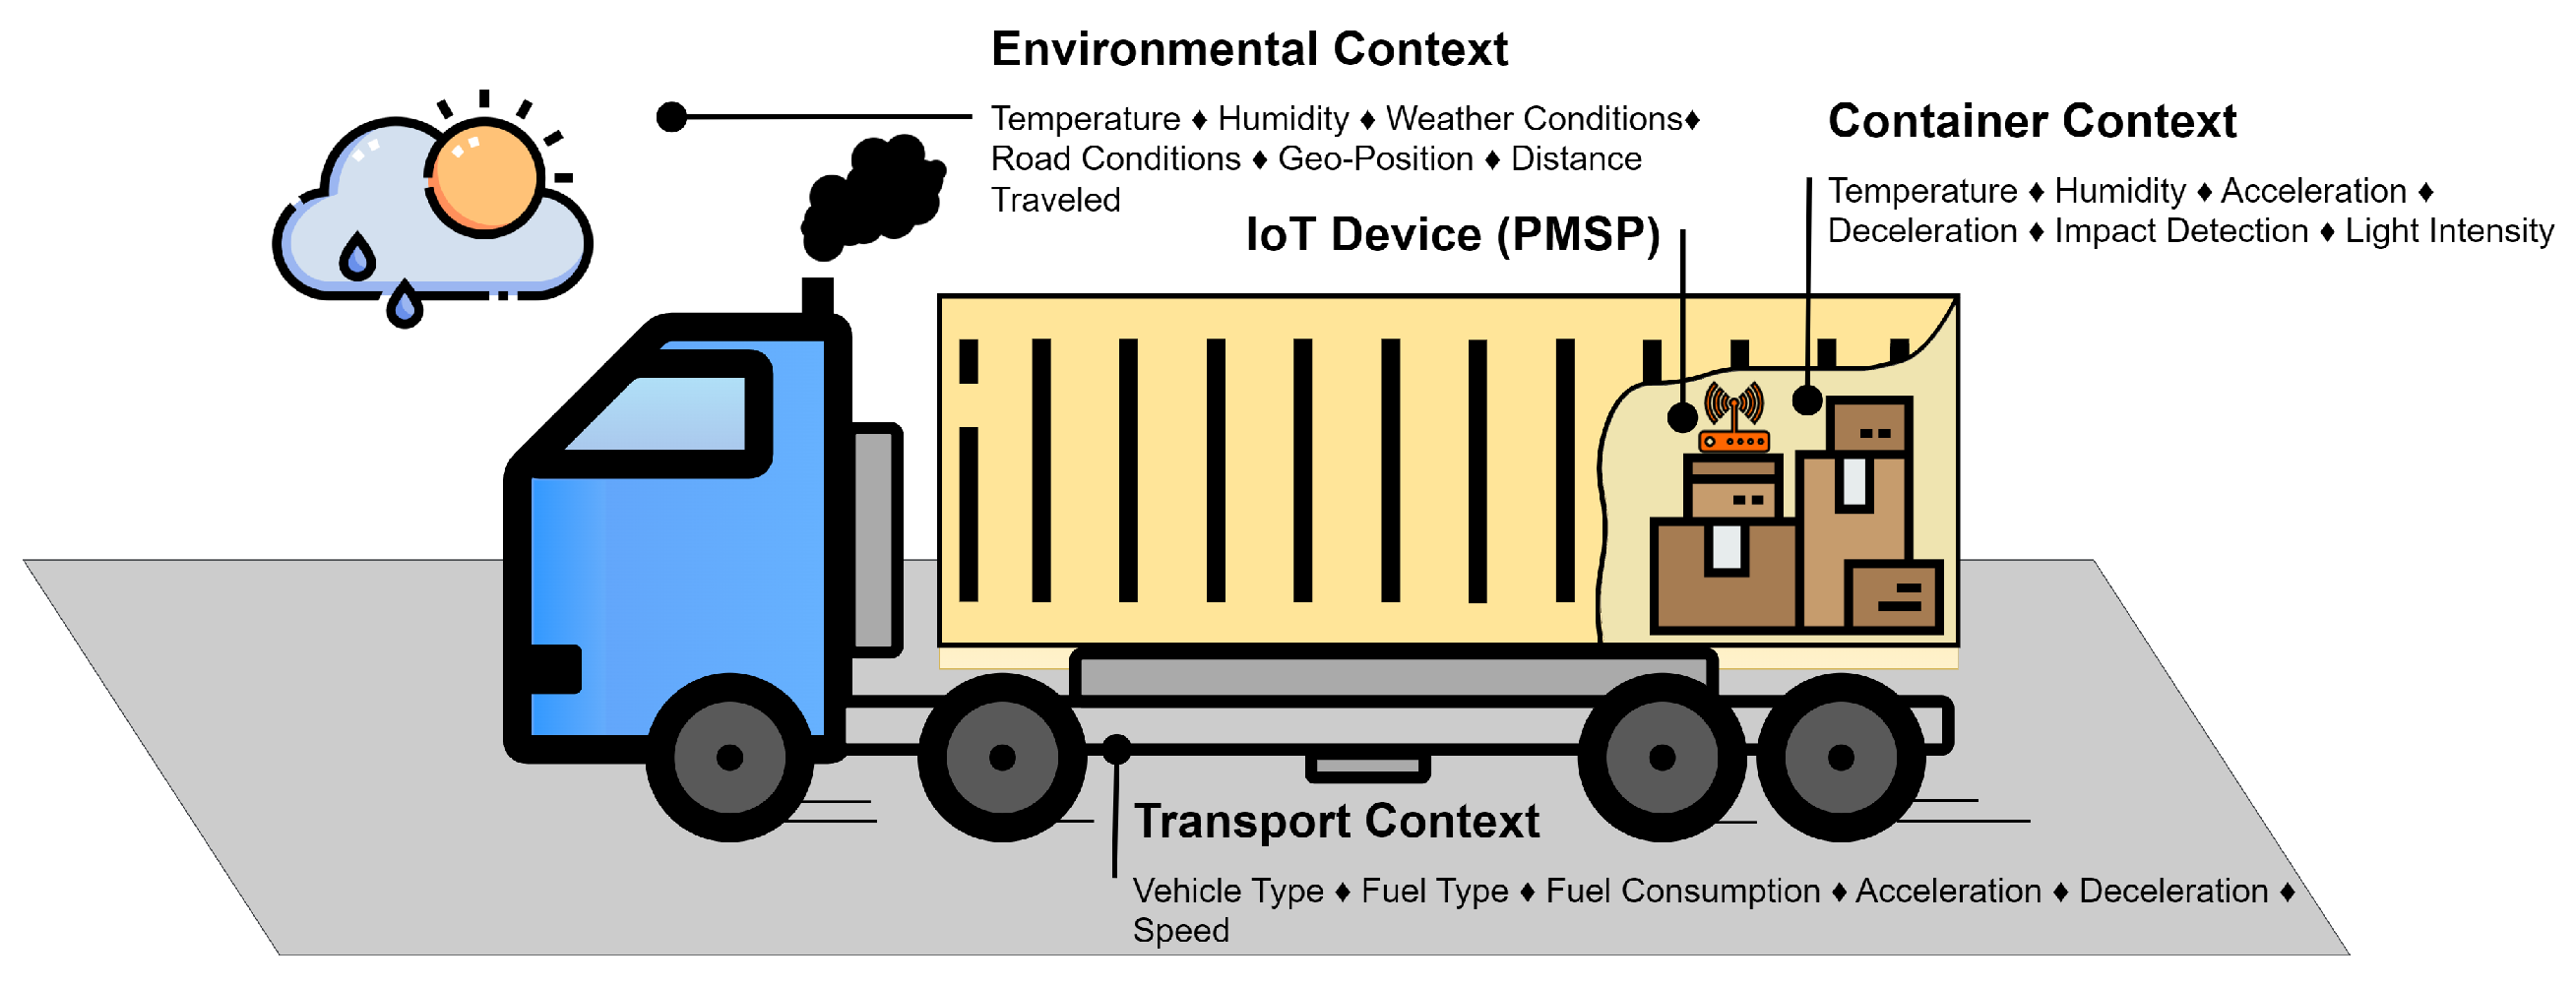
4.1. Module 1—Collection and Integration of Logistics Data

The first module integrates multisource data from Portugal’s national logistics digital platform (JUL) (see https://tinyurl.com/2w4mvm5n or https://www.projeto-jul.pt/pt for more information, accessed on 30 July 2023), and custom-made embedded monitoring devices placed within intermodal containers. These embedded monitoring devices should be capable of sensing the most relevant KPIs for logistics. We can identify the main areas of impacAlthougt for potential stakeholders, and roughly group them into three contexts: environmental, transport, and container contexts. The environmental context pertains to conditions exterior to the intermodal container or transportation means, such as atmospheric or geographical conditions; the transport context focuses solely on vehicle metrics; and, lastly, the container context pertains to both environmental and quality metrics inside the intermodal container. Each one of these factors is impacted by differing parameters, which in turn will have to be monitored. The following variables can be selected as being of high importance for monitoring:
  • Environmental—temperature, humidity, weather conditions, road conditions, geo-position, and distance traveled.
  • Transport—vehicle type, fuel type, fuel consumption, acceleration, deceleration, speed, current gear, RPM, and GHG emissions.
  • Container—temperature, humidity, acceleration, deceleration, impact detection, and light intensity.
To simultaneously monitor, aggregate, and process data from such diverging sources a robust WSN must be deployed. As such, for the basis of this WSN, the novel PMSP IoT suite is employed. The PMSP is an IoT solution that was first developed for use within industrial applications in predictive maintenance; however, due to its generalist nature, the applicability to the logistics problem is also assured. The base module is based on an Arm® Cortex®-M7 STM32H7 MCU microcontroller and is enabled with wireless communication capabilities including WiFi, Bluetooth Low Energy (BLE), and Global Positioning System (GPS). The capabilities of this solution are further augmented by a custom firmware which allows for high control of peripheral interaction and enables the application of common high-level scientific packages, based on the Python programming language.
The integration of the PMSP device in the context of the logistics problem is demonstrated in Figure 2. Metrics relevant to monitoring the environmental surroundings of the container can be directly measured by PMSP (e.g., temperature and humidity) or enriched by correlating geo-location with data available from public application programming interfaces, commonly known as APIs (e.g., weather or road conditions). Driving and transportation profiles can be constructed locally by the IoT device through the integration of sensor readings, namely the built-in accelerometer and gyroscope modules, and vehicle telemetry accessed through the On-Board Diagnostics (OBD) protocol and BLE connectivity [13]. These profiles can later be adapted into dynamic models for GHG emission assessment. All container and cargo-related variables are determined in-loco by sensing modules enabled within the PMSP base package. However, due to the extended interfacing capabilities of the IoT device, additional information derived from specialized equipment can also be added, such as, in the case of fragile goods, impact detection obtained through piezoelectric or piezoresistive sensors [39].

4.2. Module 2—Multimodal Transportation Routes Assessment: Performance Index Determination and Inefficiencies Analysis

Using relevant KPIs validated by logistics experts, in this module, the goal was to develop a benchmarking tool to rank several multimodal transportation routes of containers executed by LSPs. The tool employs MEA, an enhanced variation of the DEA method, well-established in Operational Research. MEA provides two key outputs: a TEI for each multimodal transportation route and a corresponding set of improvement measures based on an inefficiency analysis. The first output benefits logistics services clients by pinpointing the most efficient routes per LSP. The second output is valuable for LSPs, identifying variables contributing to a lower attributed TEI. Further details are given in the sections that follow.

4.2.1. Why MEA over DEA?

MEA is based on the potential improvements theory proposed by [40], and it was first implemented by [41] to evaluate the efficiency of Danish dairy farms. Mathematically speaking, MEA as well as DEA are both optimization algorithms capable of evaluating the technical efficiency of DMUs that characterize a certain process or problem of interest, by treating it as a “black box” endeavor. In this work, DMUs represent multimodal transportation routes of containers, which “consume” and “produce” a series of input and output variables/KPIs. The biggest advantage of MEA is that it considers all the possible improvement directions for each DMU and does not rely on just one specific improvement direction for ranking. It selects either input reduction or output expansion, according to improvements potential, related to each separated input and output of the model’s DMUs [42]. Thus, it is possible to attain multiple efficiency estimations of input-output (meaning diverse combinations of earns and losses towards superior performance [43]), providing an analysis of the relative contribution of the inputs for efficiency maximization or inefficiency minimization ([44,45]). In this sense, MEA computes the efficiency/slack for each input and output variable separately, assuming that all inputs remain unchanged.
In contrast, the classical proportional improvements approach (DEA), introduced by [46] and modeled by [47], is restricted to the radial/proportional contraction of inputs (or output expansion [48]). Such restriction highlights several practical concerns regarding the homogeneity of the DMUs, the selected input/output set, respective variable measurements, and weights attributed to them [49]. In what follows, the description of the MEA algorithm of the case study is given, and its fixed notation.

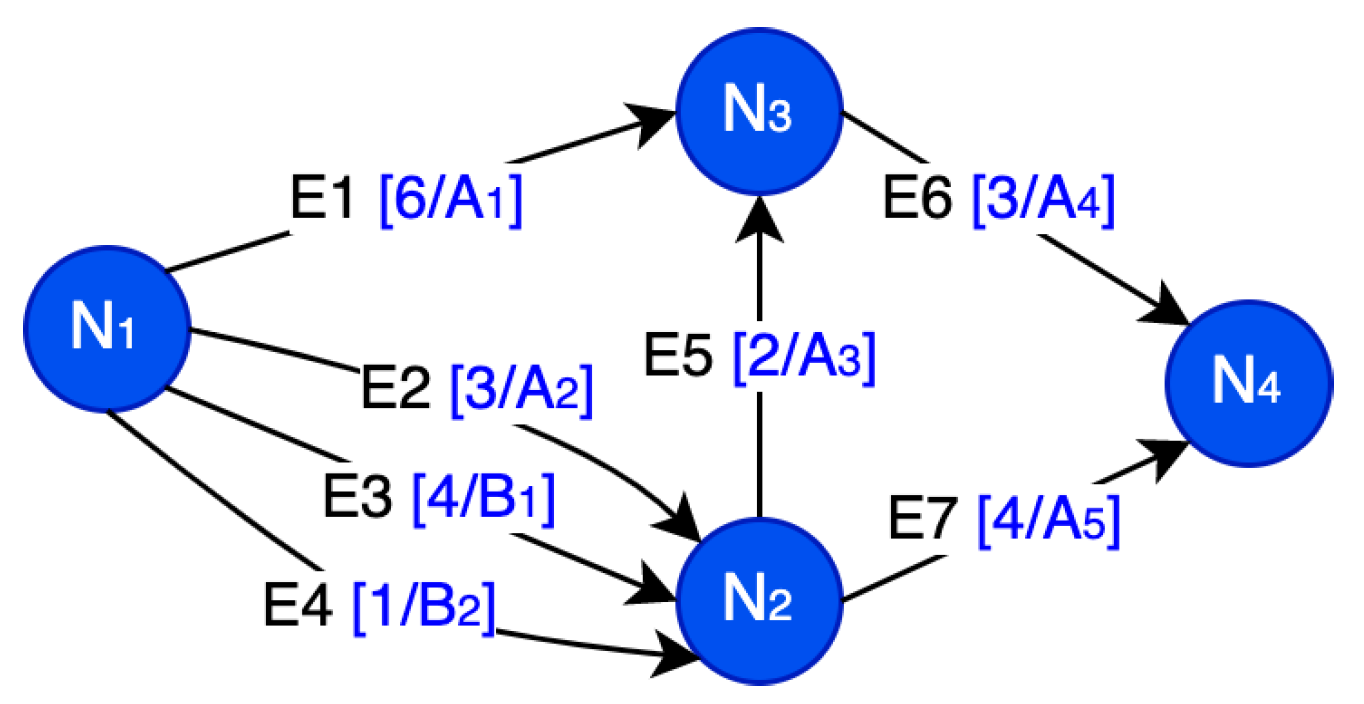
4.2.2. Mathematical Model

A set of transportation classes  TC = { A , B , }  is given, together with a set of transports  T = { A 1 , , A a i , B 1 , , B b i , }  (in  TC ) with  a i , b i N { 0 } , and a set of logistic service providers  L = { L S P 1 , , L S P m } , with  m N , where each transport  t T  is uniquely associated with a logistic service provider  L S P i t .
Let  M = ( N , E , L )  be a directed labeled multigraph representing a container transportation network, where nodes  N i  are multimodal locations, edges  E j  are directed arcs between nodes, i.e., elements of  N × N , denoting allowed connections between nodes with some characteristics codified in information labels. Hence, each edge  E j  has an associated information label  L j s ( E j )  gives the source node of  E j d ( E j )  gives the destination node of  E j , and corresponding information labels include (at least) a value  v ( E j ) R 0 +  and a transport  T ( E j ) T . For a node  N i N , we define
i n ( N i ) = { e E : d ( e ) = N i } and o u t ( N i ) = { e E : s ( e ) = N i } .
The number of nodes and edges is denoted by  | N |  and  | E | , respectively. Different from a graph, the multigraph  M  allows multiple (or none) edges between any pair of nodes, see an example in Figure 3.
A route R between two nodes  N i 1  and  N i 2  is a sequence of consecutive edges  ( E j R )  that connects (without loops)  N i 1  to  N i 2 . The set of all routes in  M  is denoted by  R , and the set  C = { c 1 , , c K }  denotes a set of  K N  containers that transverse  M , meaning that (after transverse) we can associate a unique route  R n R  to each container  c n C . Thus, several containers may use the same route, so  c o n ( R ) 2 C  gives the set of containers that have associated the same route R. We denote  N ( c n )  as the first node on the route corresponding route and  N ( c n )  as the last node. For further notation simplicity,  [ m ]  denotes the set  { 1 , , m }  for any given  m N .
For  I , J N , we assume that any container  c n C  produces (i.e., can be linked via performance indicators obtained from the uniquely associated route) J outputs  y j ( n ) , with  j [ J ] , using I inputs  x i ( n ) , with  i [ I ] , where the first  1 < D I  inputs are the so-called discretionary inputs (variables that participate in the optimization process). The non-discretionary inputs are the variables that cannot be changed. Thus,  x ( n ) R I  is the inputs vector and  y ( n ) R J  the outputs vector for a given container  c n .
We now use MEA to benchmark the containers’ transportation process. Considering the variable returns to scale (VRS) model for the efficiency measurement of DMUs (see [50]), we define the set
Λ = λ R K : n [ K ] λ n = 1 .
For n running in  [ K ] , d running in  [ D ] , j running in  [ J ] , and a fixed  n ¯ [ K ] , the MEA score of a certain observation  z ( n ¯ ) = ( x ( n ¯ ) , y ( n ¯ ) )  is determined by solving the following linear optimization programs:
Problem P d α ( z , n ¯ ) ̲ : min α d ( n ¯ ) s u c h t h a t Problem P j β ( z , n ¯ ) ̲ : max β j ( n ¯ ) s u c h t h a t n λ n x d ( n ) α d ( n ¯ ) , n λ n x i ( n ) x i ( n ¯ ) , i [ I ] , n λ n x i ( n ) x i ( n ¯ ) , i [ I ] , i d , n λ n y s ( n ) β j ( n ¯ ) , s [ J ] , n λ n y l ( n ) y l ( n ¯ ) , l [ J ] , n λ n y l ( n ) y l ( n ¯ ) , l [ J ] , l j ,
Problem P γ ( α , β , z , n ¯ ) ̲ : max γ ( n ¯ ) s u c h t h a t n λ n x i ( n ) x i ( n ¯ ) γ ( n ¯ ) ( x i ( n ¯ ) α i ( n ¯ ) ) , i [ D ] , n λ n x i ( n ) x i ( n ¯ ) , i [ I ] { d } , n λ n y l ( n ) y l ( n ¯ ) + γ ( n ¯ ) ( β l ( n ¯ ) y l ( n ¯ ) ) , l [ J ] ,
where  λ Λ α d ( n ¯ )  and  β j ( n ¯ )  are the optimal problem solutions of  P d α ( z , n ¯ )  and  P j β ( z , n ¯ ) , respectively. The ideal point of  ( x ( n ¯ ) , y ( n ¯ ) )  is given by the MEA output vector
ζ ( n ) ( α 1 ( n ) , , α D ( n ) , x D + 1 ( n ) , , x I ( n ) , β 1 ( n ) , , β J ( n ) ) R I + J .
In this setting, the methodology for a specific observation  z ( n ¯ ) = ( x ( n ¯ ) , y ( n ¯ ) )  consists of solving  ( | D | + | J | + 1 ) × K  linear programs.
For a given dataset  z = { z ( n ) } n N  the MEA score of each  n N  is given by
M E A z ( n ) = 1 γ ( n ) 1 D i [ D ] x i ( n ) α i ( n ) x i ( n ) 1 γ ( n ) + 1 J j [ J ] β j ( n ) y j ( n ) y j ( n ) ,
where  α i ( n ) β j ( n )  and  γ ( n )  represent the corresponding optimal solutions to the linear optimization problems  P i α ( z , n ) P j β ( z , n )  and  P γ ( z , n , α , β ) . With the directional contribution of each input and output, the MEA score is then obtained. In fact, for the input  i [ I ]  the contribution in the unit  z ( n ¯ )  is given by
mEff i ( n ) = x i ( n ) γ ( n ) ( x i ( n ) α i ( n ) ) x i ( n ) χ [ D ] ( i ) ,
where  χ [ D ]  is the characteristics function of the set  [ D ] . That means  χ [ D ] ( i ) = 1 , if  i [ D ]  and  χ [ D ] ( i ) = 0  if  i [ D ] . For the outputs  j [ J ]  the contribution is given by
mEff j ( n ) = y j ( n ) y j ( n ) + γ ( n ) ( β j ( n ) y j ( n ) ) .
A particular feature of MEA, which is also one of the main reasons for choosing and utilizing this approach, is that the inefficiency of each input can be analyzed individually. Using the ideas in [50], we compute the inefficiency index that follows.
Definition 1.
For a given dataset  z = { z ( n ) } n [ K ] , the inefficiency index for each input index  i [ I ]  and  n [ K ]  is given by
m I n e f f i ( n ) = n = 1 N γ ( n ) ( x i ( n ) α i ( n ) ) n = 1 N x i ( n ) .
The inefficiency index is referred to determine the number of times each input was used inefficiently. Such information will be relevant to identify improvement actions for logistics players, namely which variables should be improved in each logistics service.
The outputs of Module 2 are the following:
  • The so-called technical efficiency index  τ ( c n ) { 1 , 2 , 3 }  of a container  c n , as a class partition of the MEA score  M E A z ( n ) , see (3),
    τ ( c ) = 1 , if 0.0 M E A z ( n ) < 0.3 , 2 , if 0.3 M E A z ( n ) < 0.7 , 3 , if 0.7 M E A z ( n ) 1.0 ;
  • The technical efficiency index  τ ( R ) [ 1 , 3 ]  of a route  R R , given by
    τ ( R ) = 1 | c o n n ( R ) | c c o n n ( R ) τ ( c ) ;
  • The technical efficiency index  τ ( t ) [ 1 , 3 ]  of a transport  t T , given by
    τ ( t ) = 1 | Ω t | c Ω t τ ( c ) with Ω t = { c C : c c o n n ( R ) , E s e q ( R ) , T ( E ) = t } ,
    where  s e q ( R )  is the set of edges of a route R;
  • A new directed labeled multigraph  M = ( N , E , L ) , obtained from  M = ( N , E , L )  by storing the technical efficiency index of transports in each information label value, i.e., making  v ( E j ) = τ ( T ( E j ) )  for all  j | E | .
The application of Module 2 is over a logistics network  M L N  (see Section 5.1), starting from Port of Sines, Portugal. A small illustrative subset of  M L N  is used in Section 5.3 for clarification purposes.

4.3. Module 3—Multiobjective Optimization of Routes’ Technical Efficiencies, Global Network Makespan, and Transportation Costs

This module intends to optimize in real-time a container transportation network, by minimizing the usage/costs of resources and maximizing the technical efficiency indices (measured in Module 2), approaching the problem from a global and independent point of view of the logistic providers. This work does not fully detail this module, as it is left for future publications since the main focus is Module 2. Module 3 is presented here to show the importance of the technical efficiency indices and integration of Module 2 on our complete solution.
The module is intended to be incorporated in a Multimodal Control Tower for the NEXUS network, represented as a logistics network  M L N , supported by a digital twin, that receives real-time (event) data from Module 1, integrating multisource data from Portugal’s national logistics digital platform (JUL) and custom-made embedded monitoring devices, and the outputs of Module 2. The core of the module is a composed optimization algorithm, based on the variation of two classical mathematical problems: (a) the job-shop problem, and (b) the assignment problem.
The job-shop (scheduling) problem (JSSP) is an NP-hard combinatorial problem, i.e., its complexity class for non-deterministic polynomial time is at least as hard as the hardest of the problems in the NP class. It is not clear its origins but studies of the problem seem to stem back to the early 1950s. In its classical form, each job consists of a sequence of tasks, which must be performed in a given order, and each task must be processed on a specific machine. The objective of JSSP is to minimize the makespan, i.e., the length of time from the earliest start time of the jobs to the latest end time. Depending on the type of JSSP variation, there are constraints for jobs, tasks, and machines. Recently, flexible and dynamic variations of the JSSP relevant to our problem were introduced, allowing us to adapt to real-time changes in the configuration data, see [51,52]. In our model, lags between tasks are also considered which come from the availability of resources.
The assignment problem (AP) is one of the most well-known combinatorial optimization problems, where a set of workers needs to perform a set of tasks, and for each worker and task, there is a cost for assigning the worker to the task. The problem is to assign each worker to at most one task (and a possible upper limit), with no two workers performing the same task while minimizing the total cost. We consider a variant of the assignment of teams of workers that have additional constraints on the workers or tasks and solve it with a C-SAT approach, e.g., see [53,54].

4.3.1. Predicting When a Route Is Available

For applying the algorithm, at precise instants in time, it is necessary to predict if a route  R R  is available for a container  c C  departing from a node  N i N . Such means that for every node  N j N  of the route, there is at least one transport  t j T  with available capacity and located at the node  N j  or arriving in a “short” period of time, for the accumulated time  T j > 0  obtained from summing the (estimated) container transportation times between intermediate nodes. Such is a difficult task that it is accomplished by a mixed approach, combining data from pre-determined information (e.g., timetables), measures over the statistical distributions of travel times of historical data, and the outputs of a processing-time estimator of the task duration, applying techniques of machine learning, see [55,56,57,58].
To present this work and without going into further details, we assume that there is a mechanism to forecast the availability (in the next T seconds) of a multimodal transportation route for a container traveling between two nodes of  M , with a known upper-limit bound for the error.

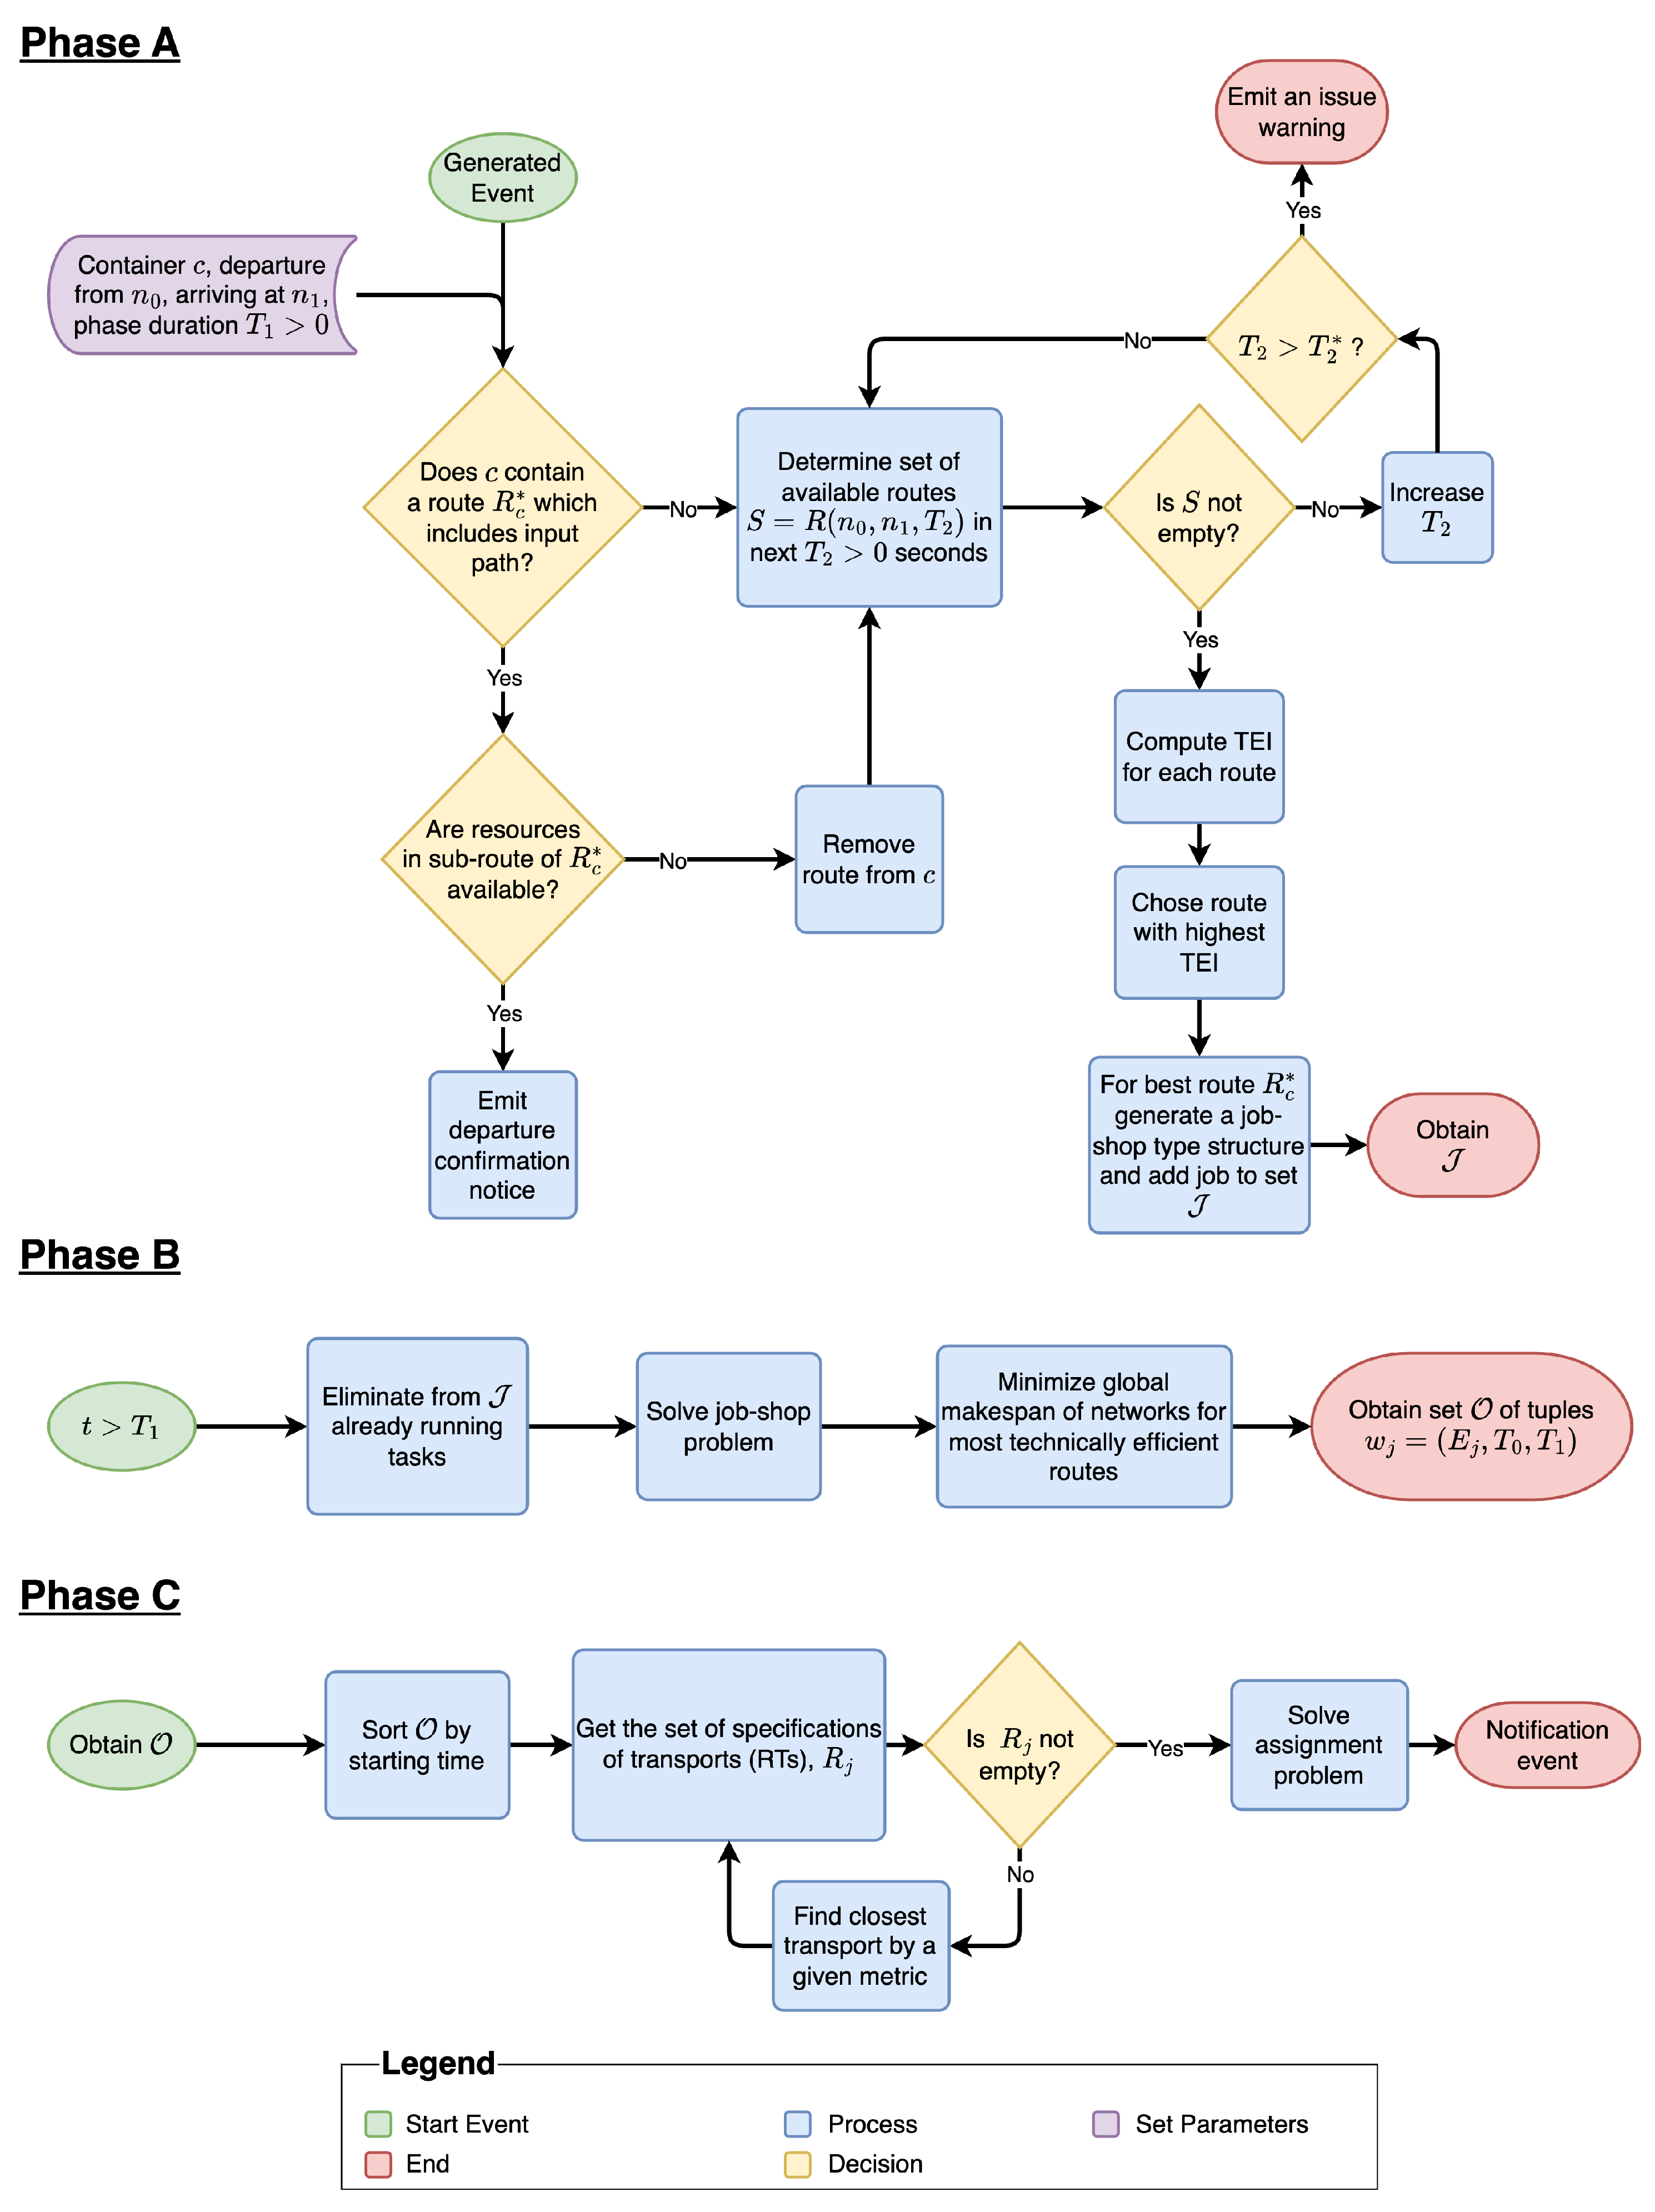
4.3.2. The Algorithm Scheme

The main algorithm running in the Control Tower has three (infinitely recurrent) phases. These phases are schematically shown in Figure 4, and can be detailed as follows:
A.
The first phase runs for a  T 1 > 0  duration. If an event was generated for a container c to departure a node  n 0  and be transported to a final destination  n 1 , check if the container c have already an associated route  R c  that includes this path:
  A . 1 .
If YES, then
  A . 1.1 .
Check the availability of the assigned resources involved in the sub-route of  R c , composed of the path between  n 0  and  n 1 . If the next assigned resource is available, emit a departure confirmation notice. Otherwise, remove the associated route from the container and go to  A . 2.1 , as a heuristic to implement some type of resilience to unknown disruptive events related to transports;
  A . 2 .
If NO, then
  A . 2.1 .
Determine the set of all available routes  S = R ( n 0 , n 1 , T 2 ) , in the next  T 2 > 0  seconds. If the set  S  is empty, recalculate  S  by increasing the value  T 2  and repeating this process until there is at least one route in the set. If  T 2  is bigger than a fixed  T 2  then stop processing the container and notify the issue;
  A . 2.2 .
For the non-empty set  S  obtained in A.2.1, compute the TEI for each route and choose the route  R c  with the highest TEI value;
  A . 2.3 .
Suppose the best route  R c  has the edges  ( E i ) i , then generate a job-shop type structure with these edges, where jobs correspond to container transportation paths, tasks are transportation between corresponding nodes with estimated travel-times, and machines are the involved transports  T ( E j ) . Add this job to the set  J .
B.
The second phase is after finishing the duration of the first phase. Eliminate from  J  the tasks that are already running, i.e., container-transport pairs that are currently moving between nodes, and solve the job-shop problem defined by this new configuration, so minimizing the global makespan of the network for routes chosen to be the most technically efficient.
C.
The third phase minimizes the costs of transport assignment to routes. Notice that, since each route edge was validated for availability, the set of potential transports is not empty. The output of phase B denoted by  O  is a set of tuples  w j = ( E j , T 0 , T 1 ) , with an edge  E j , transportation starting time  T 0 , and an ending transportation time  T 1 > T 0 . Sort  O  by starting time and then by  v ( E j ) , if some tasks start at the same time. For each task  w j  do:
  C . 1 .
Determine the specifications of the transports (RTs) that are available at the transportation service provider and associated with the transport  t ^ = T ( E j ) , by querying the logistic service provider API and retrieving their identification, characteristics, and costs. Denote the set of obtained RTs by  R j . If the set is empty (for some unknown reason), start a process of finding the closest transport  t T  to  t ^  concerning a determined metric, set  T ( E j ) = t , and repeat the step;
  C . 2 .
Construct and solve the assignment problem defined by non-empty  R | . Fix the assigned (best) resource to the task  w j , and generate a notification event with the obtained information.
Although the structure of Module 3 is not detailed, nor the mathematical formulations of the optimization problems are described here, it is clear that the outputs of Module 2 are crucial for the implementation of the above algorithm.

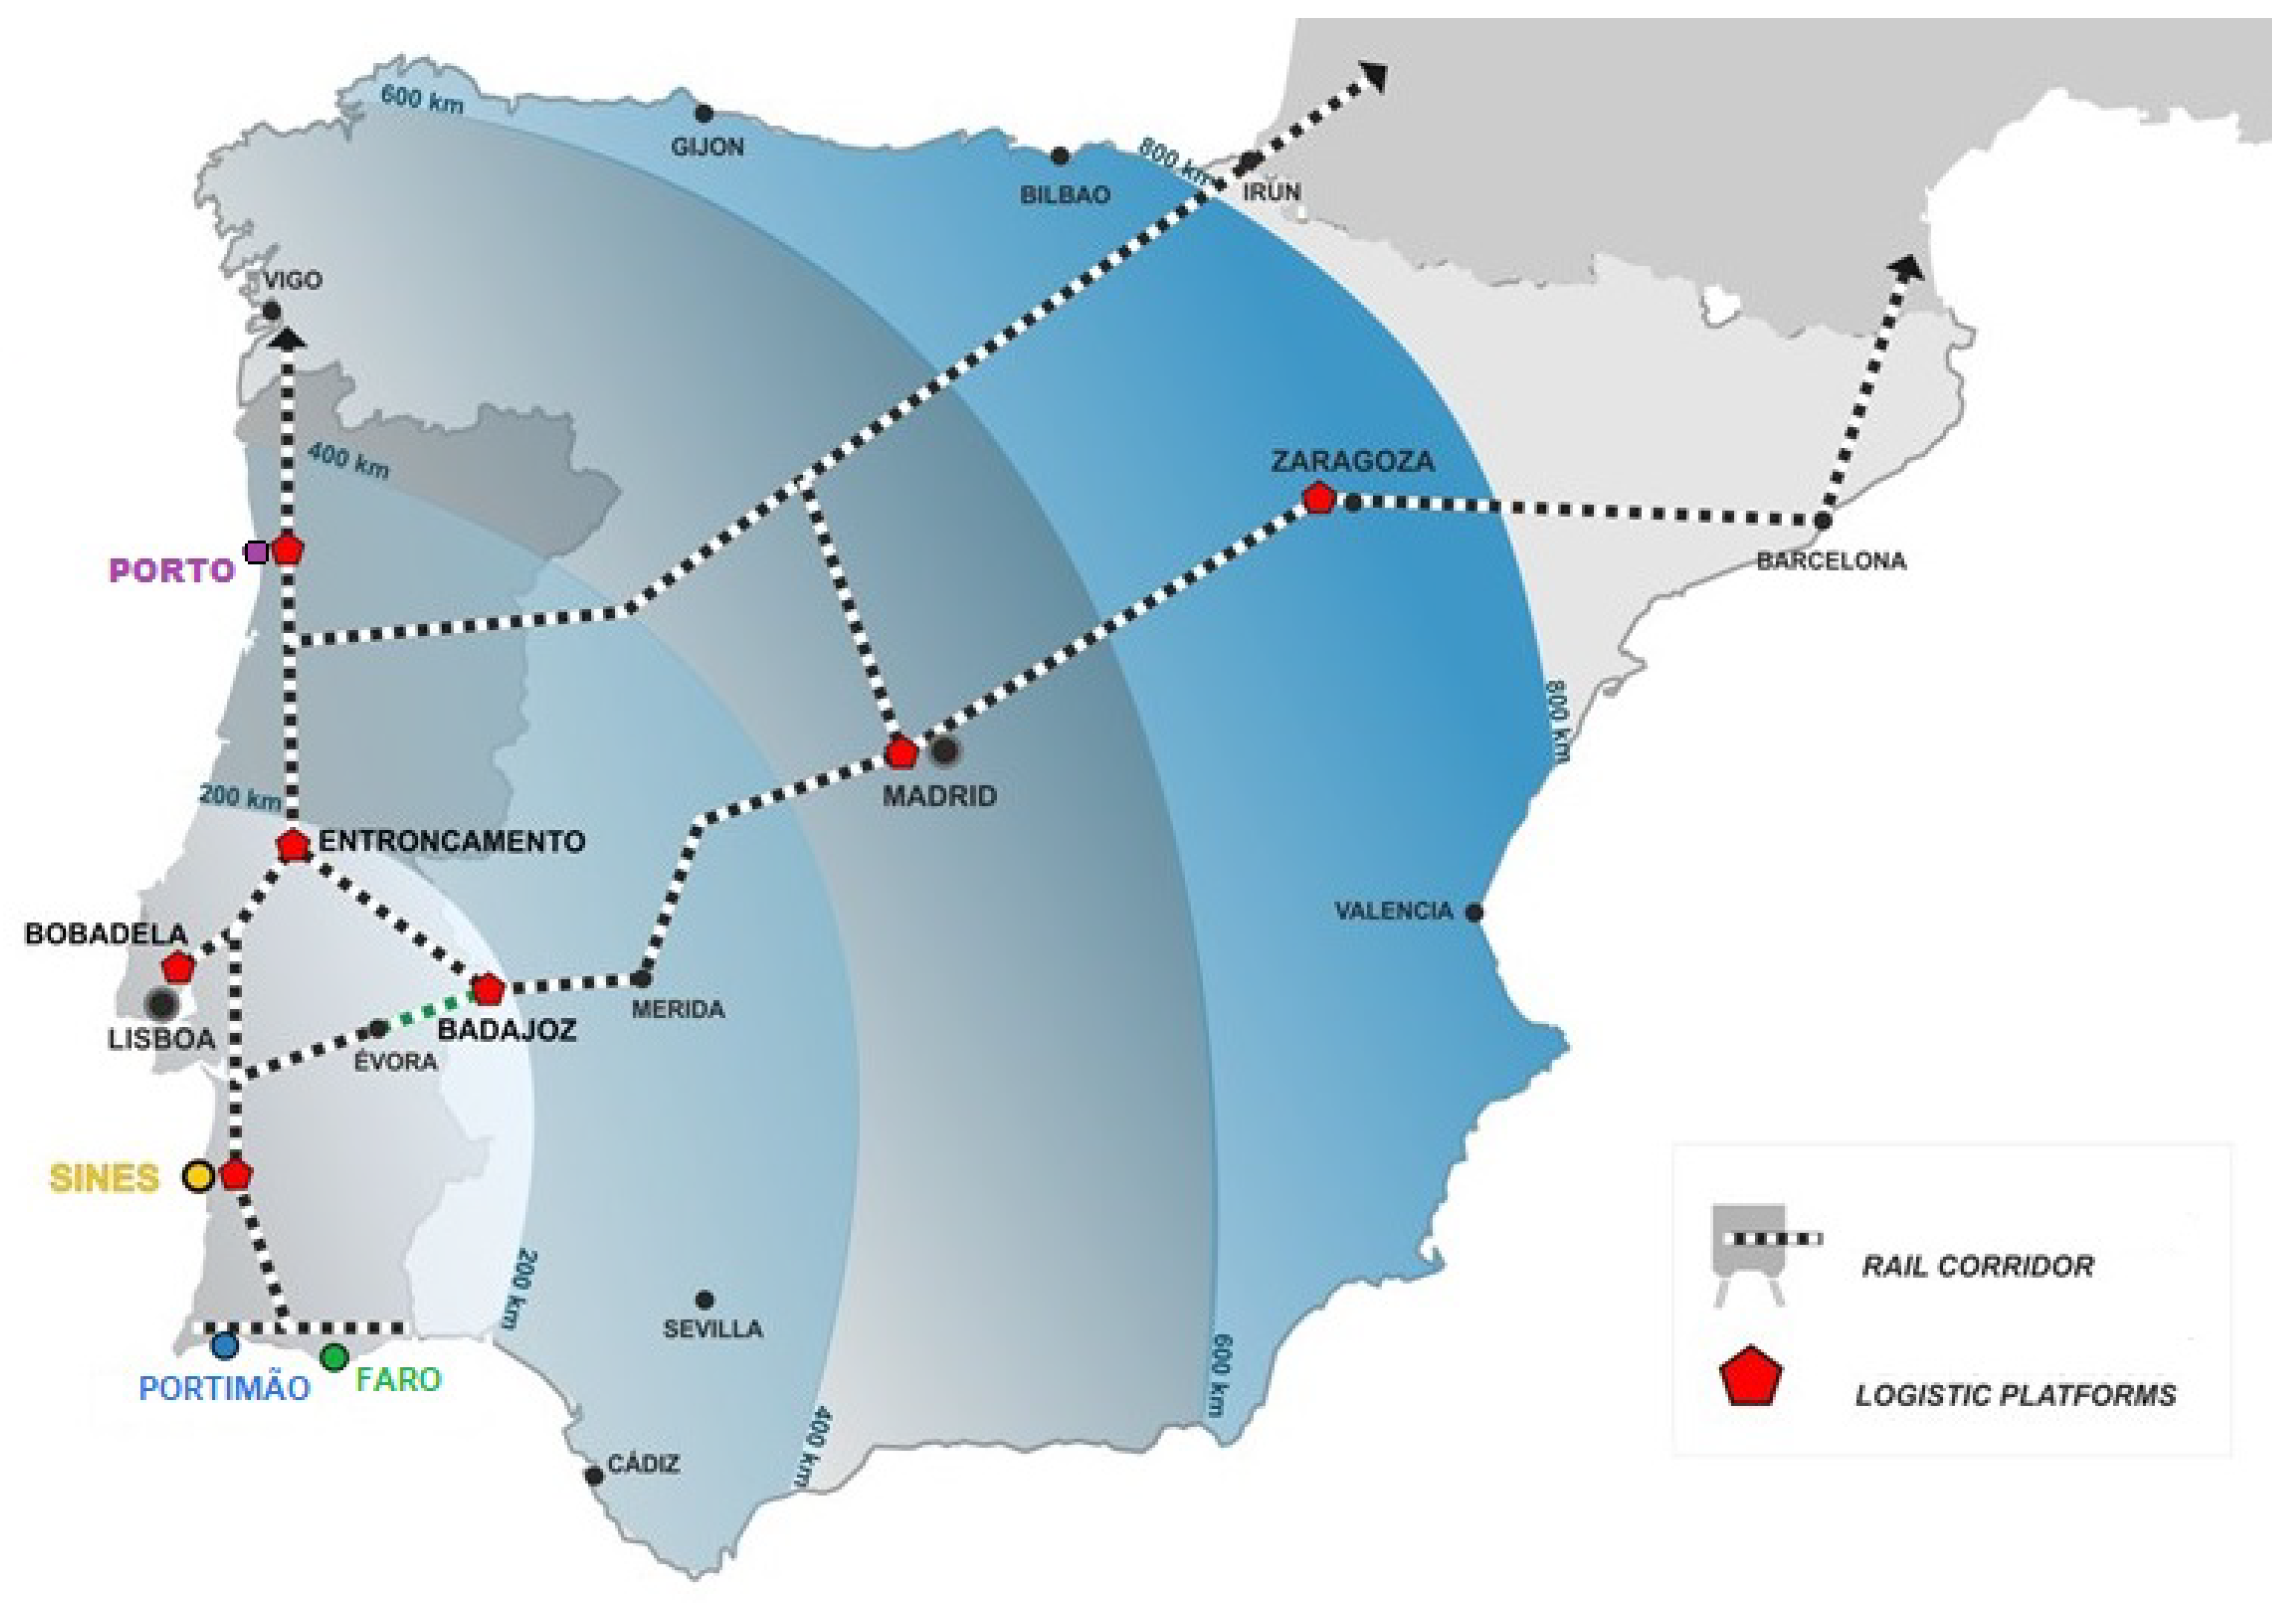
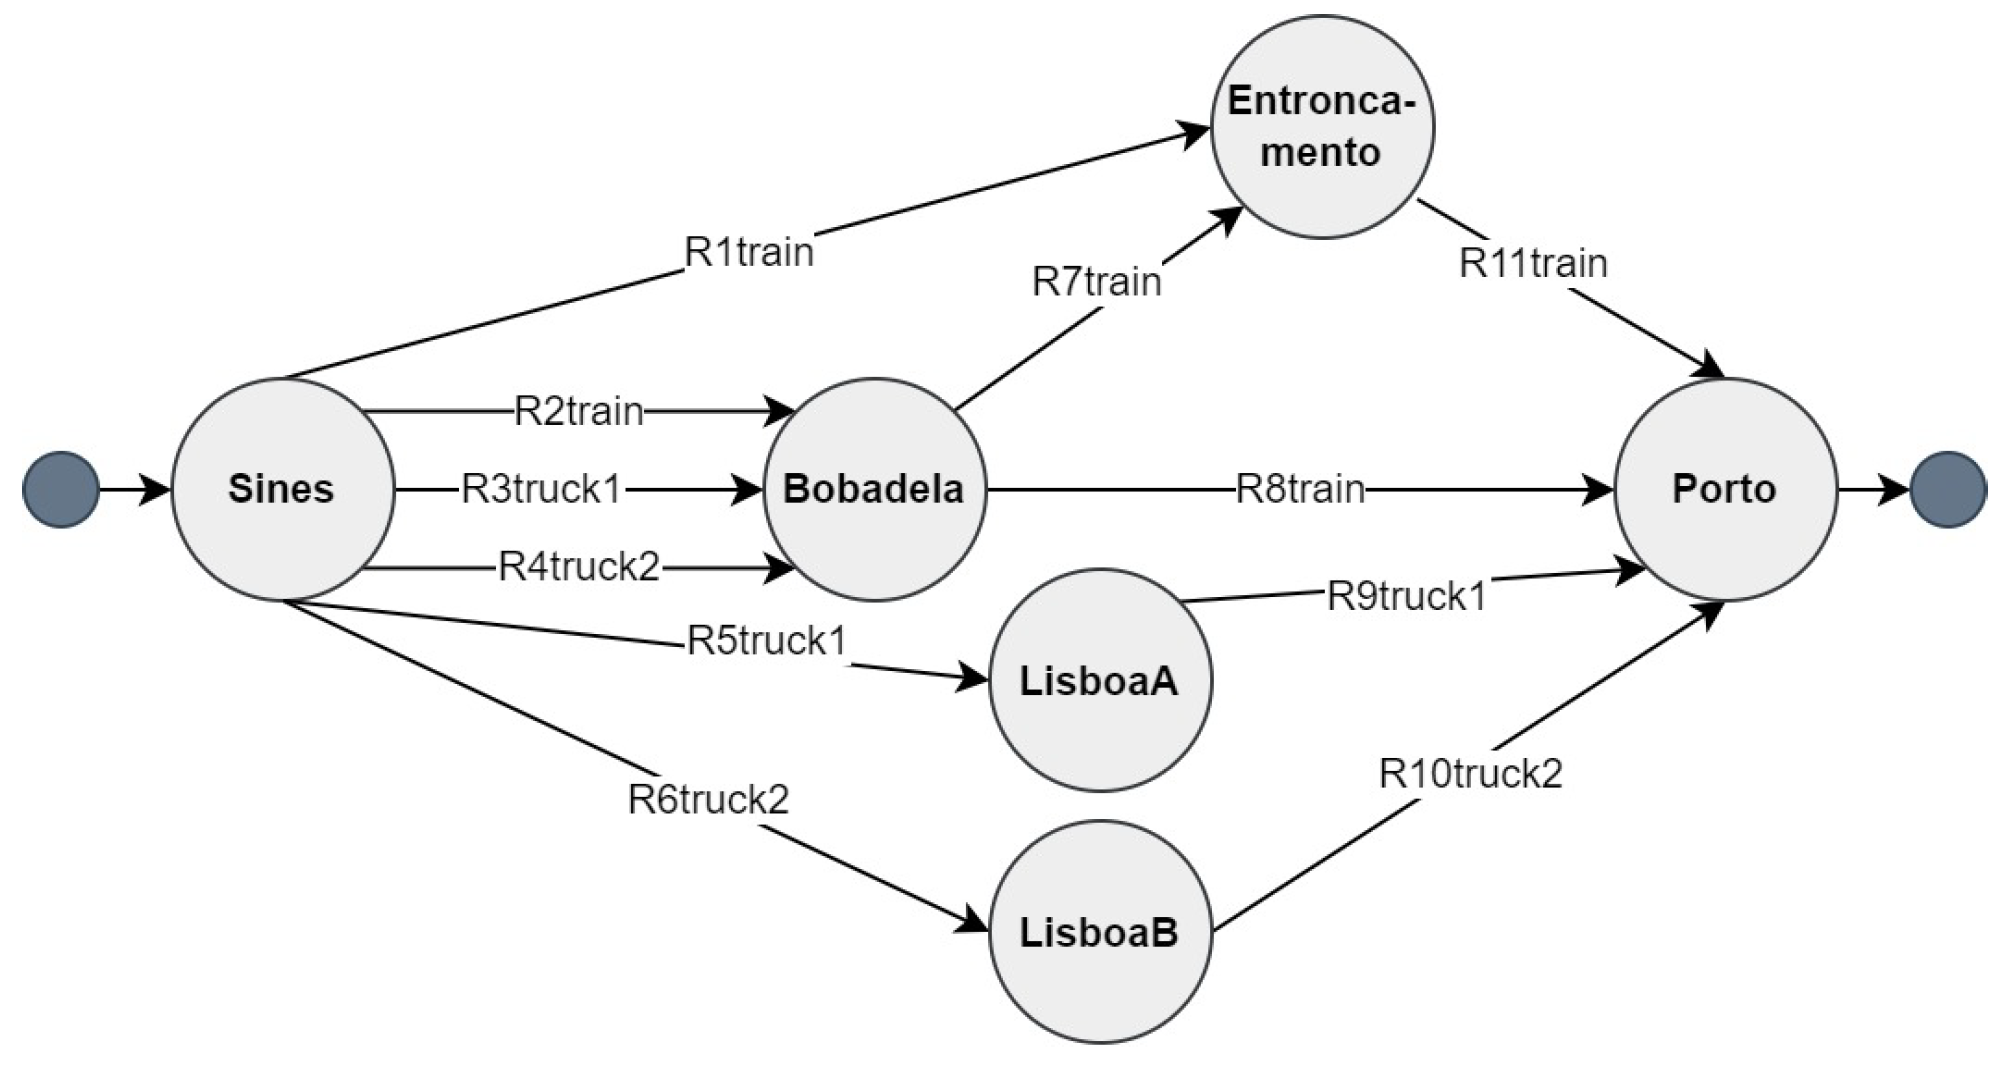
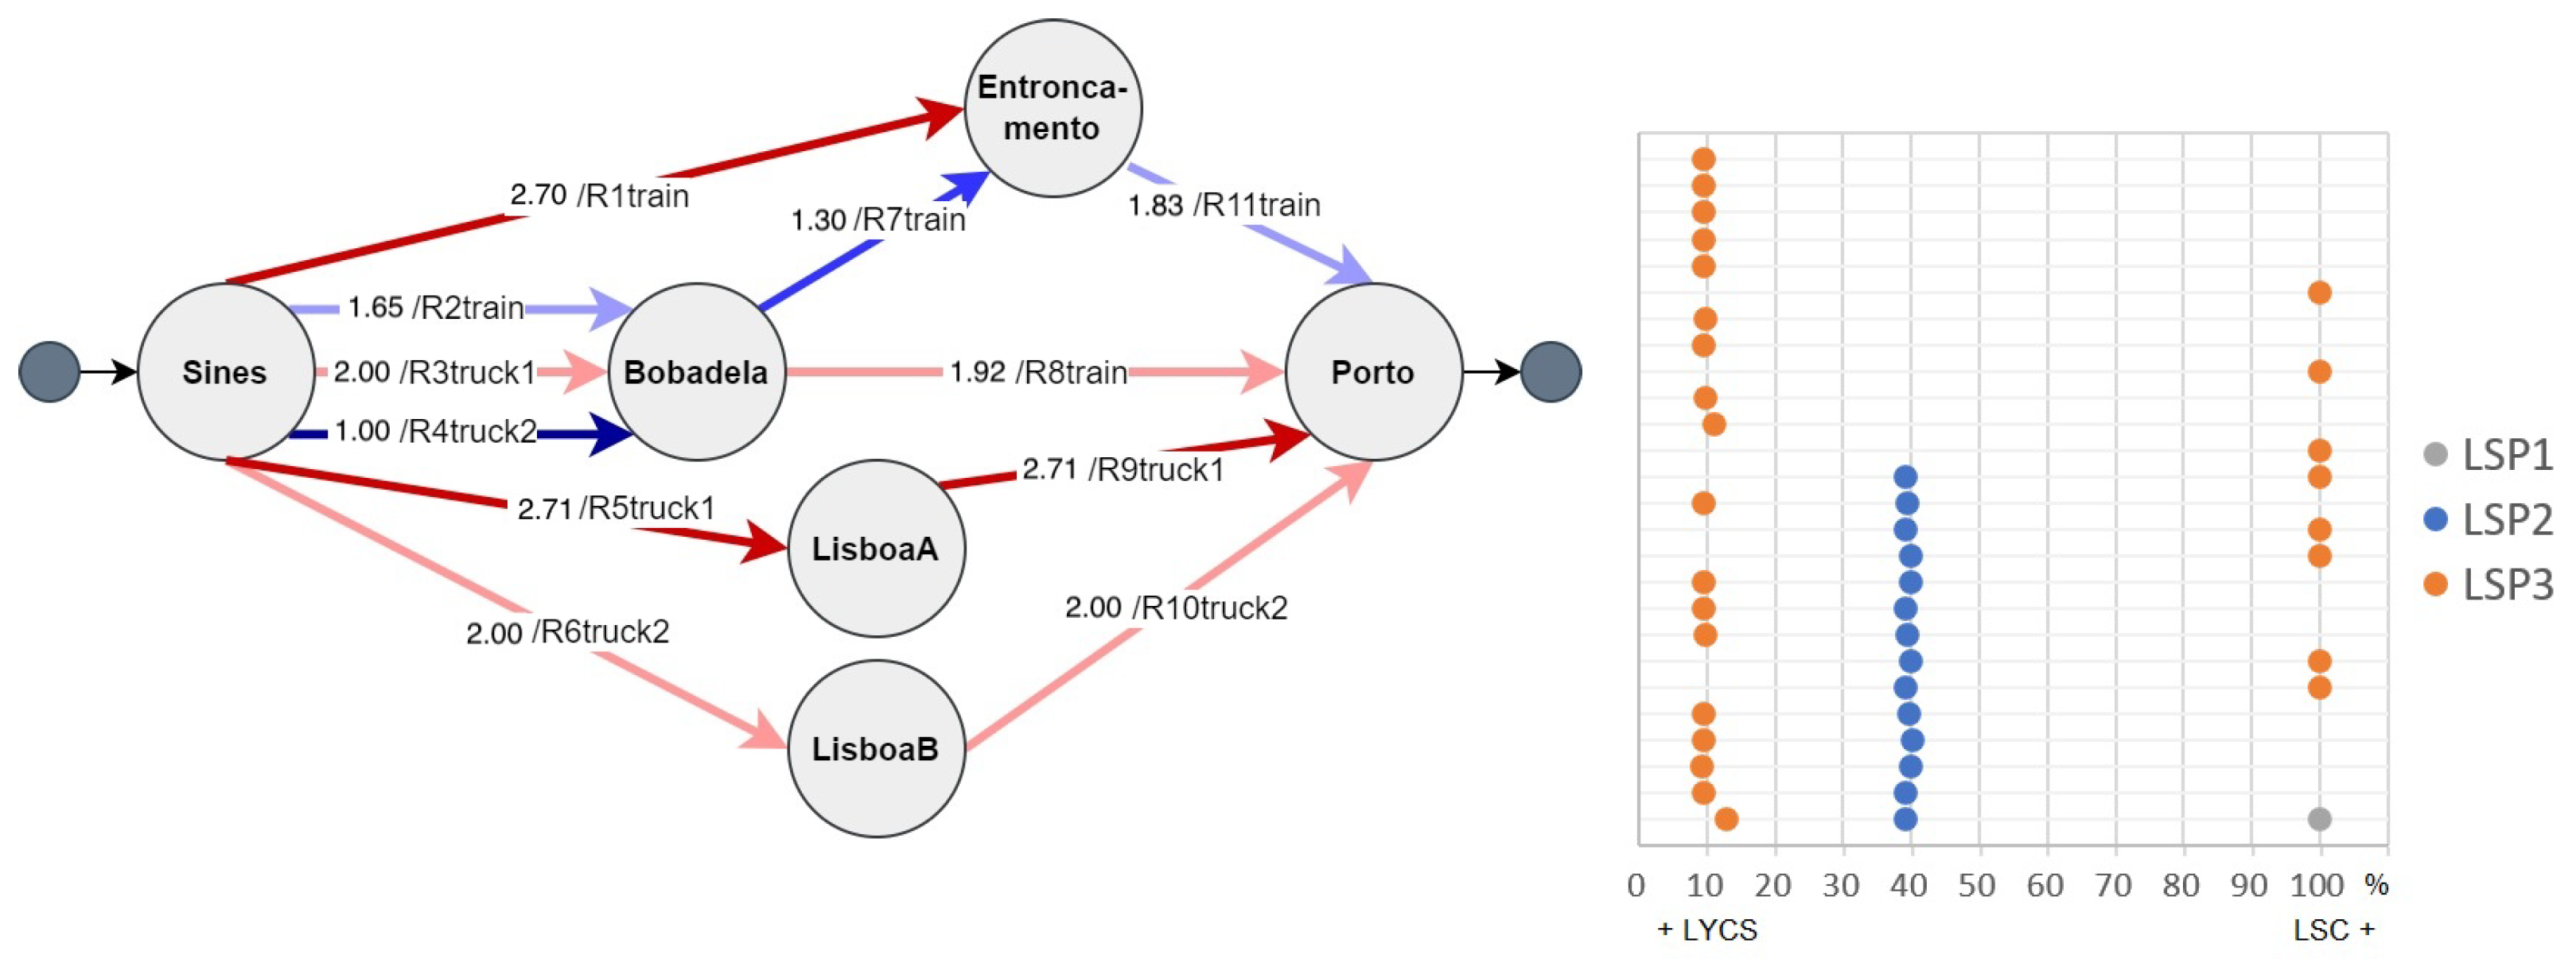
5. Case Study: Technical Efficiency Assessment of Logistics Services (Module 2 Simplified Application)

5.1. Case Study Characterization

The Port of Sines is located in southern Portugal (see Figure 5), and it has the strategic advantage of being close to the crossing point of international shipping lanes, playing an essential role in the Iberian-Atlantic trades. It is currently the national leader in energy supply (crude, refined products, and natural gas) and handled cargo volumes. The container business has also played a vital role in recent years [59].
In Europe, Sines has an optimal location to establish a transfer hub for logistics activities. The Port’s terminal is well-connected to the industrial and logistics zones of Sines and the transportation network by rail and road [60], handling about thousands of container trains per week to and from the Spanish and Portuguese logistics platforms. Over 90% of all containers are transported by train within the hinterland area.
The case study aims to evaluate the performance of a set of hinterland multimodal transportation routes of containers from the dry Port of Sines to the dry Port of Porto, on the north side of Portugal. For concept clarification, hinterland logistics transport incorporates the transportation system and related logistics activities between maritime ports [61].
Looking at Figure 6, it is clear that the studied paths are a simplified subset version of a network  M L N . Nevertheless, the nodes used are locations (intermodal hubs), and the edges represent the connections between such nodes.

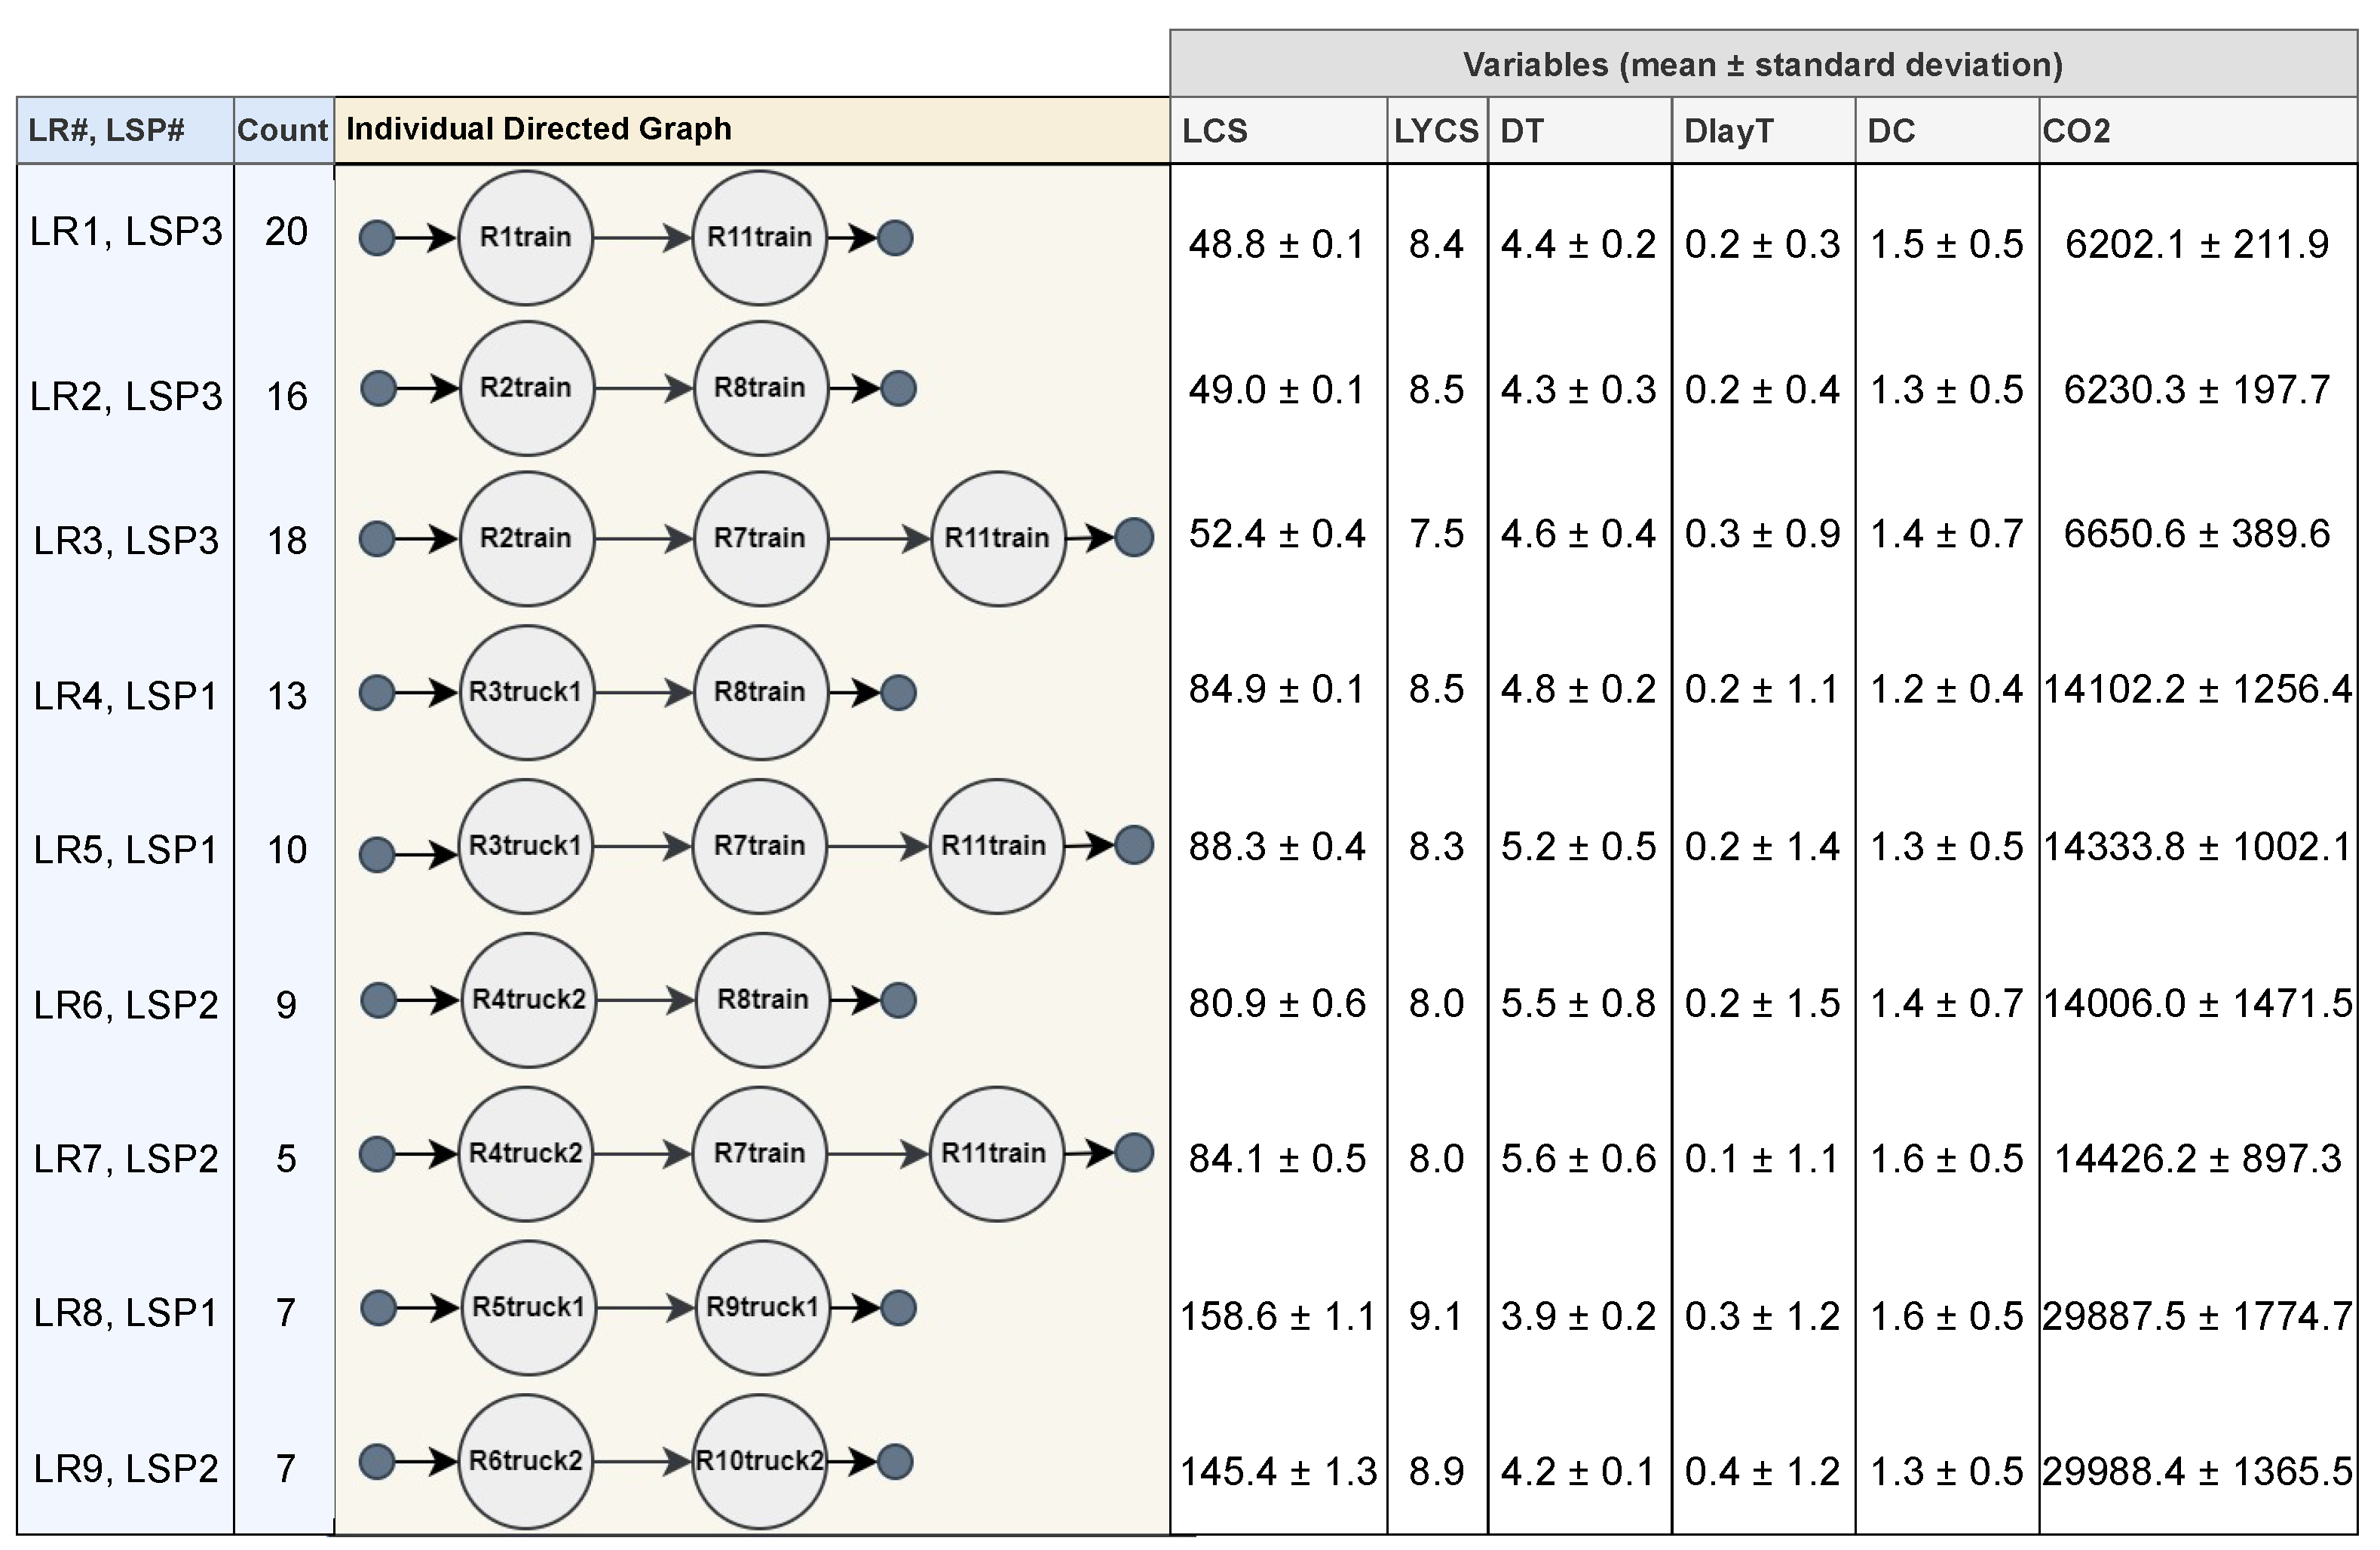
5.2. Case Study Data

A complete dataset with real data having information about logistics operations from the Port of Sines to its hinterland in Portugal, spanning 1 January 2022, to 1 June 2023, was considered. During this timeframe, 179,474 containers were transported, predominantly by train (65.3%) followed by truck (34.7%). The prevalent container types were ISO 4510 (37.5%) and ISO 2210 (36.5%), exhibiting notable variability in weight. The most frequent gross weights were 2200 kg (25.4%) and 3930 kg (18.0%), with a global average of approximately 11,736 kg and a standard deviation of 10,483 kg. Notably, around 50.4% of the containers were not fully loaded.
Considering the complexity of the complete dataset and for presentation clarity, the dataset used for this publication is a dataset with a small number of rows and some simulated data that not only mimics the previous on a smaller scale but also keeps data confidentiality. Namely, it solely contains 105 containers and 6 nodes (representing Portuguese logistics platforms involved in NEXUS, see Figure 5 and Figure 6).
To evaluate the performance of multimodal transportation routes of containers, logistics experts were consulted to better identify the most appropriate set of KPIs that could be computed with the variables available in the simulated dataset. These KPIs represent the inputs and outputs of the MEA model. They are Logistics Service Cost (LSC), Customer Satisfaction from Last Year (LYCS), Delivery Time (DT), Delay Time (DlayT), Delivery Conformity (DC), and CO2 Emissions (CO2) (see Figure 7).

5.3. MEA Application

In this case study, performance assessment is perceived through the client’s lens (the entity that purchases the logistics service). For each DMU, i.e., a container going from Sines to Porto (so  N ( c ) = N ( c )  for  c C ), it seems clear that MEA is capable of providing an assessment evaluation where it can minimize inputs (consumption) or maximize outputs. The model’s inputs are the variables (information) that the client knows at the beginning of the route, and the outputs are precisely the outcome variables, as depicted in Figure 7.
In practical implementation, the generation of input/output variables for benchmarking requires an adapted abstract representation of the initial problem, modeled as a directed labeled multigraph (as shown in Figure 6). In this adapted abstract representation presented in Figure 8, the nodes correspond to the tuple (type of transport, departure point of the container, arrival point of the container). From now on, it will be possible to calculate the variables from Figure 7, except the historical KPI, LYCS. Figure 8 presents each multimodal transportation route individually, accompanied by an ID with the logistics route (LR#) and the corresponding logistics service provider (LSP#) responsible for its execution.
The MEA model was applied in this case study under the assumption of input minimization, and the goal was to determine which DMU was able to produce more outputs with fewer inputs. The complementary value of a variable V is defined by  m a x n V n V . So, if V is minimized then the complementary value will be maximized, and the other way around.
In the context of Figure 7 and since the approach assumes that inputs must be minimized and outputs maximized, the complementary values of all output variables are considered the MEA output variables, and the complementary value of the input variable LYCS together with the variable LSC as MEA input variables.

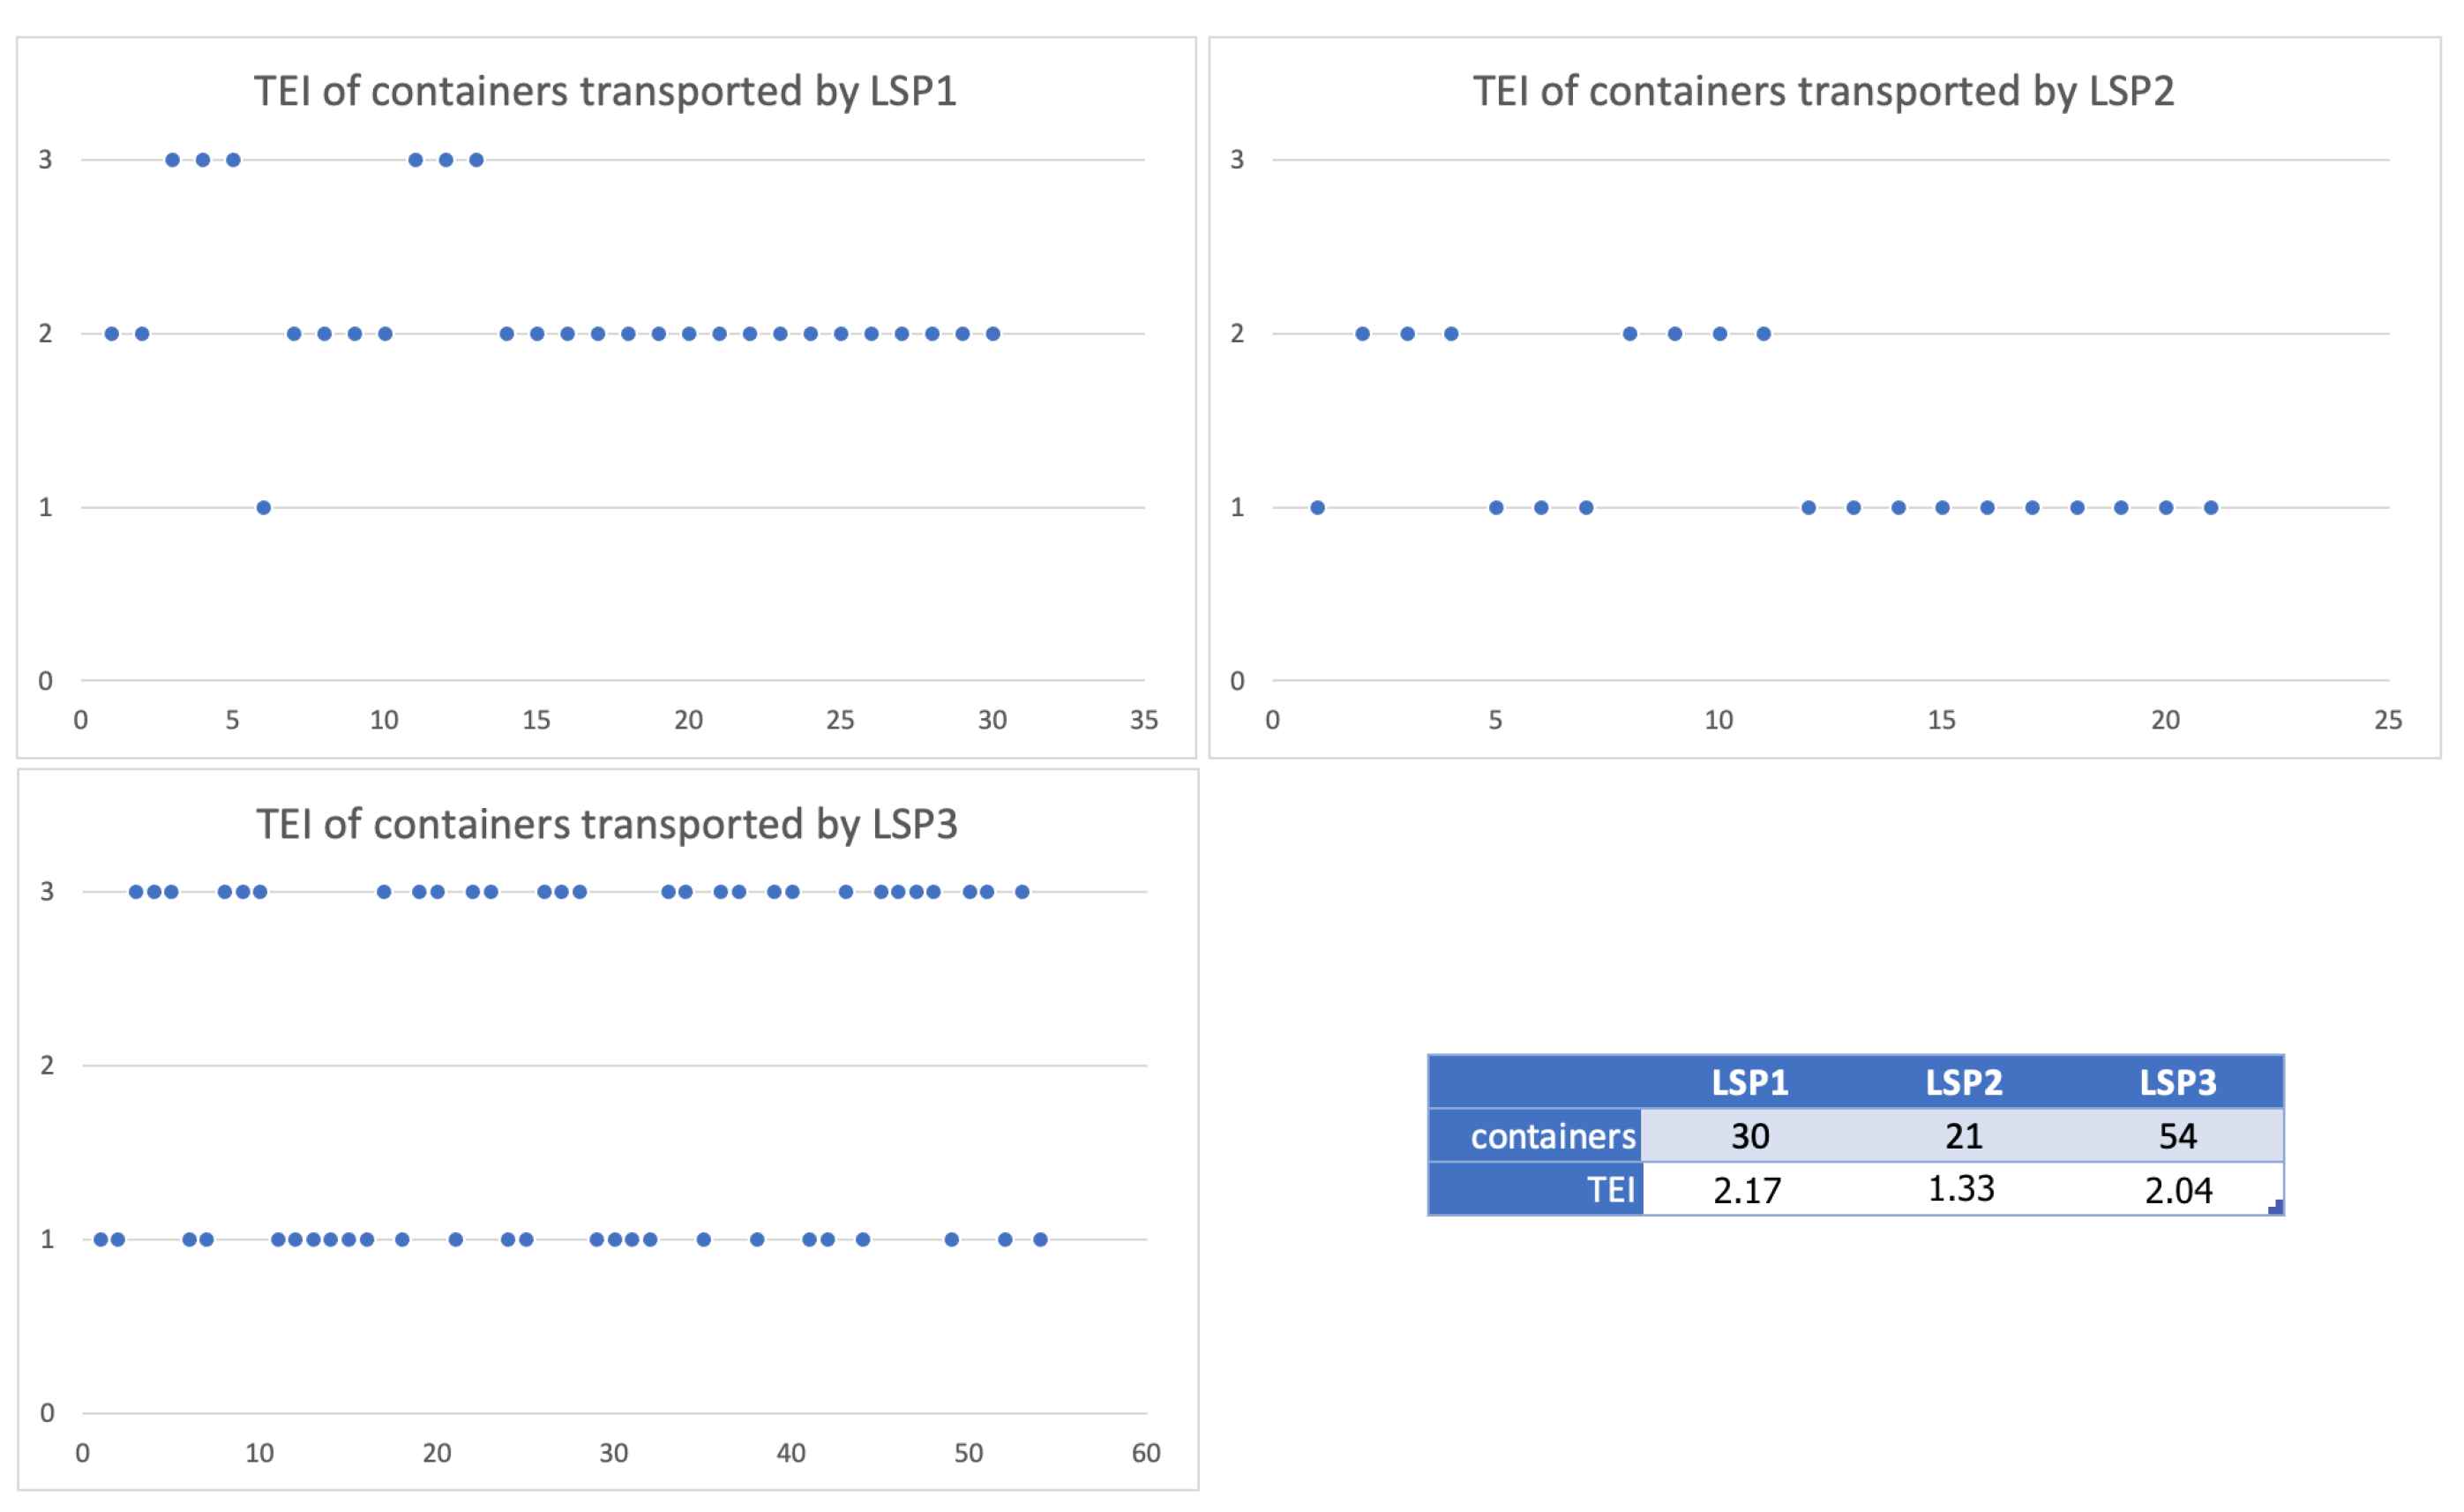
5.4. Results and Discussion

As an evaluation tool, the objective is to ensure that the obtained results are relevant for both entities involved in the logistics service, namely the LSP and the logistics client.
In this context, Figure 9 presents two significant outputs for LSPs. On the left side of the figure, a heatmap is displayed over the multigraph of the case study. The heatmap utilizes a color spectrum to indicate the respective TEI assigned to each route. This visual representation aims to provide LSPs with insights into which routes exhibit the best and worst performance, thereby motivating improvement initiatives for the less efficient ones. Hence, it can be observed that the routes identified as LR7, LSP2 and LR3, LSP3 along the Sines-Bobadela-Entroncamento-Porto route, depicted in dark and light blue, demonstrate the poorest performance (please recall the routes and respective IDs displayed in Figure 8).
Furthermore, on the adjacent graph (to the right), the dataset entries with the lowest TEI value (TEI  = 1 ) are analyzed to discern the underlying explanations or reasons behind such low-performance values (or inefficiencies). Consistent with the previous result, from a total of 41 inefficient multimodal transportation route entries, 26 correspond to LSP3, 14 belong to LSP2, and only one entry corresponds to LSP1. This finding reveals that for LSP3, nearly 70% of the 26 inefficiently performed routes can be attributed to inadequate production of outputs (DT, DlayT, DC, and CO2) given a high input value of LYCS, observed on the left side of the scatter plot (for the sake of clarification, the +LYCS on the left, and +LSC on the right side of the x-axis mean that the further towards such direction the greater the contribution of the variable to inefficiency). For such a level of customer satisfaction from the previous year, better delivery and delay time, conformity percentage, and CO2 emissions were expected. The remaining 30% of inefficiency can be attributed to significant expenditure (high LSC), meaning that the resulting output did not meet the expected level considering the amount paid for the service. This explanation also applies to the sole inefficient route entry in the dataset executed by LSP1.
In the case of LSP2, the contribution of both LYCS and LSC variables to the level of inefficiency is more balanced, with a slightly stronger tendency towards LYCS.
This initial result holds significant implications for LSPs, as it enables the identification of key areas for improvement, such as specific routes with the lowest performance scores, and provides insights into the underlying factors through model variables. This knowledge will facilitate enhanced resource management and allocation strategies.
Finally, Figure 10 presents the relevant output for the logistics client, the paying party for the service. The scatter plots depict the individual performance of each LSP throughout a certain period of time of container transport, and the table presents the aggregate performance of each LSP. At first glance, the table suggests that LSP1 exhibits the best TEI. However, an essential aspect of its performance is the minimal variability observed between consecutive occurrences over time. This factor holds paramount importance for the client since, apart from evaluating overall performance, they can also assess the consistency of this performance. It enables the client to determine whether the LSP consistently operates at a high level of performance or exhibits significant inconsistency. On the other hand, LSP3 emerges as the second-best performer based on TEI in the table. However, the variability in its performance is striking, with several consecutive routes attaining the lowest level of performance while others achieve the highest level. Consequently, LSP3 exhibits a high degree of volatility in its performance.
The performance analysis outlined in this study holds critical significance for the logistics client, particularly in negotiating with LSPs. It enables him to adjust contract prices based on the identified performance levels and make informed decisions when considering potential new business partners. By evaluating the set of inputs and outputs presented in this paper, the client gains insights into the capabilities and efficiency of different LSPs, allowing them to explore more favorable contract conditions with existing or prospective partners. This analysis serves as a valuable tool for contract optimization and facilitating mutually beneficial agreements between the logistics client and LSPs.

6. Conclusions

This paper introduced an integrated data-driven architecture composed of three modules for logistics data collection and integration, logistics performance evaluation through the lens of the logistics client and LSPs, and real-time scheduling and assignment towards a synchromodal system.
Firstly, the initial module is responsible for gathering and integrating multi-source logistics data, derived from both centralized digital platforms (as is the case of JUL) and from connected IoT-based devices. At this stage, the validation of incoming data can be optionally performed by technical experts, after which the computation of relevant logistics KPIs takes place. The resulting output from this stage is then relayed over to the second module where the assessment of LSP routes is performed.
The second module employs the MEA benchmarking technique to compute the technical efficiency of multimodal transportation routes of containers managed by LSPs, as well as to perform an individualized inefficiency analysis.
A third and last module responsible for real-time multiobjective optimization of logistics networks was also introduced. The goal of this module is to develop a synchromodal tool capable of incorporating varying system dynamics and resource availability while minimizing the total transportation makespan and operational costs associated with logistics operations. The sketched solution relies on the outputs of Module 2, showing its importance.
Regarding the case study application of Module 2 and the resulting benchmarking analysis, two significant practical contributions must be highlighted. First, the identification of key areas of improvement for LSPs, such as specific multimodal transportation routes with the lowest performance scores, and insights into the underlying factors through model variables (such knowledge will facilitate enhanced resource management and allocation strategies). Secondly, the performance analysis outlined is relevant for negotiating between logistics clients and LSPs. It enables the client to adjust contract prices based on the identified performance levels and make informed decisions when considering potential new business partners. Practical validation from logistics experts involved in the NEXUS project has shown that this analysis serves as a valuable tool for contract optimization, facilitating mutually beneficial agreements between logistics clients and LSPs.

7. Future Work

Despite the advantages discussed in this paper regarding the introduced logistics tool, and its practical value to both logistics clients and LSPs, there remain, however, future research directions that can still be addressed. For instance, the IoT-based component of the proposed architecture, Module 1, still requires a large-scale validation, thus assessing its viability in the contextual monitoring of the detailed metrics.
Furthermore, the study on the feasibility of delegating a higher degree of computational capacity closer to the logistics operations using IoT devices is reserved for future work. Nonetheless, this is a clear area of interest as it could enable a real-time assessment of relevant metrics and KPIs, opening the possibility towards a more dynamic architecture. Similarly, Module 3 will be the subject of detailed mathematical scrutiny in an upcoming publication, and a case study application will also be presented to validate its practical relevance.
Lastly, as the NEXUS agenda is ongoing until 2025, there remains a possibility for the further advancement and refinement of the architecture’s functionalities into an encompassing Multimodal Control Tower.

Author Contributions

Conceptualization, Â.F.B., E.M.R. and D.C.; methodology, Â.F.B., E.M.R. and D.C.; software, E.M.R.; validation, Â.F.B., E.M.R. and D.C.; formal analysis, Â.F.B., E.M.R. and D.C.; investigation, Â.F.B., E.M.R. and D.C.; resources, Â.F.B., E.M.R. and D.C.; data curation, Â.F.B., E.M.R. and D.C.; writing—original draft preparation, Â.F.B.; writing—review and editing, Â.F.B., E.M.R. and D.C.; supervision, E.M.R. All authors have read and agreed to the published version of the manuscript.

Funding

This research received no external funding.

Data Availability Statement

The results presented in the paper were generated with simulated data, so do not represent real data from logistics service providers (to ensure confidentiality).

Acknowledgments

The present study was developed within the scope of the Agenda “NEXUS—Pacto de Inovação—Transição Verde e Digital para Transportes, Logística e Mobilidade”, financed by the Portuguese Recovery and Resilience Plan (PRR), with no. C645112083-00000059 (investment project no. 53). The first author holds a PhD grant in the scope of the Agenda NEXUS. The second author was partially supported by the Center for Research and Development in Mathematics and Applications (CIDMA), through the Portuguese Foundation for Science and Technology (UIDB/04106/2020). The authors also want to thank C. Vodrazka and M. Gonçalves from MARLO, and H. Fonseca from MAEIL for helping with problem specifications and clarifications.

Conflicts of Interest

The authors declare no conflict of interest.

Abbreviations

The following abbreviations are used in this manuscript:
AIArtificial Intelligence
APAssignment problem
BLEBluetooth low energy
DEAData envelopment analysis
DMUDecision-making unit
ESPsEnvironmentally sensitive products
GHGGreen house gases
GPSGlobal positioning system
IDIdentifier
IoTInternet-of-things
JSSPJob-shop (scheduling) problem
JULPortugal’s national logistics platform
KPIKey performance indicator
LPILogistics performance index
LSPLogistics service provider
MEAMulti-directional efficiency analysis
OBDOn-board diagnostics
PCAPrincipal component analysis
PIPhysical internet
PMSPPredictive maintenance smart probe
RFIDRadio frequency identification
TEITechnical efficiency index
WSNWireless sensor network

References

  1. Dutch Institute for Advanced Logistics. The Logistics Data Sharing Infraestructure; Technical Report for TKI Dinalog: Breda, The Netherlands, 2020. [Google Scholar]
  2. Ambra, T.; Caris, A.; Macharis, C. Should I Stay or Should I Go? Assessing Intermodal and Synchromodal Resilience from a Decentralized Perspective. Sustainability 2019, 11, 1765. [Google Scholar] [CrossRef]
  3. Sustainable Mobility at ICLEI. The Future of Urban Freight Transport: Enabling Data Sharing to Support Decision-Making. Available online: https://sustainablemobility.iclei.org/the-future-of-urban-freight-transport-enabling-data-sharing-to-support-decision-making/ (accessed on 30 July 2023).
  4. Moschovou, T.; Vlahogianni, E.; Rentziou, A. Challenges for data sharing in freight transport. Adv. Transp. Stud. 2019, 48, 141–152. [Google Scholar]
  5. European Comission Interim Report. Data Sharing in Supply and Logistics as Commodity—The Digital Transport and Logistics Forum Second Mandate (DTLF II) Subgroup 2: Corridor Information Systems; Technical Report for European Comission: Brussels, Belgium, 2022. [Google Scholar]
  6. Swamy, S.N.; Kota, S.R. An empirical study on system level aspects of Internet of Things (IoT). IEEE Access 2020, 8, 188082–188134. [Google Scholar] [CrossRef]
  7. Tran-Dang, H.; Krommenacker, N.; Charpentier, P.; Kim, D.S. Toward the internet of things for physical internet: Perspectives and challenges. IEEE Internet Things J. 2020, 7, 4711–4736. [Google Scholar] [CrossRef]
  8. Rejeb, A.; Simske, S.; Rejeb, K.; Treiblmaier, H.; Zailani, S. Internet of Things research in supply chain management and logistics: A bibliometric analysis. Internet Things 2020, 12, 100318. [Google Scholar] [CrossRef]
  9. Montreuil, B. Toward a Physical Internet: Meeting the global logistics sustainability grand challenge. Logist. Res. 2011, 3, 71–87. [Google Scholar] [CrossRef]
  10. Shafique, M.N.; Rashid, A.; Bajwa, I.S.; Kazmi, R.; Khurshid, M.M.; Tahir, W.A. Effect of IoT capabilities and energy consumption behavior on green supply chain integration. Appl. Sci. 2018, 8, 2481. [Google Scholar] [CrossRef]
  11. Hopkins, J.; Hawking, P. Big Data Analytics and IoT in logistics: A case study. Int. J. Logist. Manag. 2018, 29, 575–591. [Google Scholar] [CrossRef]
  12. European Commission; Centre, J.R.; Tsiakmakis, S.; Zacharof, N.; Fontaras, G.; Ciuffo, B.; Marotta, A.; Anagnostopoulos, K.; Pavlovic, J. Review of in Use Factors Affecting the Fuel Consumption and CO2 Emissions of Passenger Cars; Publications Office: Luxembourg, 2016. [CrossRef]
  13. Yavari, A.; Bagha, H.; Korala, H.; Mirza, I.; Dia, H.; Scifleet, P.; Sargent, J.; Shafiei, M. ParcEMon: IoT Platform for Real-Time Parcel Level Last-Mile Delivery Greenhouse Gas Emissions Reporting and Management. Sensors 2022, 22, 7380. [Google Scholar] [CrossRef]
  14. Cao, J.; Zhang, J.; Liu, M.; Yin, S.; An, Y. Green Logistics of Vehicle Dispatch under Smart IoT. Sens. Mater. 2022, 34, 3317–3338. [Google Scholar] [CrossRef]
  15. Huang, Y.; Ding, Z.; Lee, W.J. Charging Cost Aware Fleet Management for Shared on-Demand Green Logistic System. IEEE Internet Things J. 2022, 10, 7505–7516. [Google Scholar] [CrossRef]
  16. Mejjaouli, S. Internet of Things based Decision Support System for Green Logistics. Sustainability 2022, 14, 4756. [Google Scholar] [CrossRef]
  17. Bogataj, D.; Bogataj, M.; Hudoklin, D. Mitigating risks of perishable products in the cyber-physical systems based on the extended MRP model. Int. J. Prod. Econ. 2017, 193, 51–62. [Google Scholar] [CrossRef]
  18. Tsang, Y.P.; Choy, K.L.; Wu, C.H.; Ho, G.T.; Lam, H.Y.; Koo, P.S. An IoT-based cargo monitoring system for enhancing operational effectiveness under a cold chain environment. Int. J. Eng. Bus. Manag. 2017, 9, 1847979017749063. [Google Scholar] [CrossRef]
  19. Chow, G.; Heaver, T.D.; Henriks son, L.E. Logistics Performance: Definition and Measurement. Int. J. Phys. Distrib. Logist. Manag. 1994, 24, 17–28. [Google Scholar] [CrossRef]
  20. Tsolaki, K.; Vafeiadis, T.; Nizamis, A.; Ioannidis, D.; Tzovaras, D. Utilizing machine learning on freight transportation and logistics applications: A review. ICT Express 2022, in press. [Google Scholar] [CrossRef]
  21. Gong, Z.; Liu, N. Mitigative and adaptive investments for natural disasters and labor strikes in a seaport–dry port inland logistics network. Marit. Policy Manag. 2020, 47, 92–108. [Google Scholar] [CrossRef]
  22. Gaudenzi, B.; Confente, I.; Russo, I. Logistics service quality and customer satisfaction in B2B relationships: A qualitative comparative analysis approach. TQM J. 2021, 33, 125–140. [Google Scholar] [CrossRef]
  23. Lai, P.L.; Jang, H.; Fang, M.; Peng, K. Determinants of customer satisfaction with parcel locker services in last-mile logistics. Asian J. Shipp. Logist. 2022, 38, 25–30. [Google Scholar] [CrossRef]
  24. Soysal, M.; Bloemhof-Ruwaard, J.M. Toward Sustainable Logistics. In Springer Optimization and Its Applications; Springer: Cham, Switzerland, 2017; Volume 129, pp. 1–17. [Google Scholar]
  25. Li, H.; Hao, Y.; Xie, C.; Han, Y.; Wang, Z.R. Emerging technologies and policies for carbon–neutral transportation. Int. J. Transp. Sci. Technol. 2023, 12, 329–334. [Google Scholar] [CrossRef]
  26. Abdulahi, E.W.; Fan, L. Exploring and Validating Container Operational Risk Scale in Container Shipping: The Case of Ethiopian Shipping and Logistics Service Enterprise. Sustainability 2021, 13, 9248. [Google Scholar] [CrossRef]
  27. Uvet, H. Importance of Logistics Service Quality in Customer Satisfaction: An Empirical Study. Oper. Supply Chain Manag. Int. J. 2020, 13, 1–10. [Google Scholar] [CrossRef]
  28. The World Bank. Logistics Performance Index (LPI)—About. 2023. Available online: https://lpi.worldbank.org/about (accessed on 30 July 2023).
  29. Beysenbaev, R.; Dus, Y. Proposals for improving the Logistics Performance Index. Asian J. Shipp. Logist. 2020, 36, 34–42. [Google Scholar] [CrossRef]
  30. Chejarla, K.C.; Vaidya, O.S.; Kumar, S. MCDM applications in logistics performance evaluation: A literature review. J. Multi-Criteria Decis. Anal. 2022, 29, 274–297. [Google Scholar] [CrossRef]
  31. Giusti, R.; Manerba, D.; Bruno, G.; Tadei, R. Synchromodal logistics: An overview of critical success factors, enabling technologies, and open research issues. Transp. Res. Part E Logist. Transp. Rev. 2019, 129, 92–110. [Google Scholar] [CrossRef]
  32. Babić, D.; Kalić, M.; Janić, M.; Dožić, S.; Kukić, K. Integrated Door-to-Door Transport Services for Air Passengers: From Intermodality to Multimodality. Sustainability 2022, 14, 6503. [Google Scholar] [CrossRef]
  33. Tavasszy, L.; Behdani, B.; Konings, R. Intermodality and Synchromodality. In Ports and Networks—Strategies, Operations and Perspectives, 1st ed.; Routledge: London, UK, 2017; Chapter 15; pp. 251–266. [Google Scholar] [CrossRef]
  34. Delbart, T.; Molenbruch, Y.; Braekers, K.; Caris, A. Uncertainty in Intermodal and Synchromodal Transport: Review and Future Research Directions. Sustainability 2021, 13, 3980. [Google Scholar] [CrossRef]
  35. Steadieseifi, M.; Dellaert, N.P.; Nuijten, W.; Van Woensel, T.; Raoufi, R. Multimodal freight transportation planning: A literature review. Eur. J. Oper. Res. 2014, 233, 1–15. [Google Scholar] [CrossRef]
  36. Pfoser, S.; Treiblmaier, H.; Schauer, O. Critical Success Factors of Synchromodality: Results from a Case Study and Literature Review. Transp. Res. Procedia 2016, 14, 1463–1471. [Google Scholar] [CrossRef]
  37. Canale, A.; Carboni, A.; Borghetti, F.; Rentschler, J.; Elbert, R.; Weber, F. Promoting Sustainability through Synchromodal Transportation: A Systematic Literature Review and Future Fields of Research. Sustainability 2022, 14, 13269. [Google Scholar] [CrossRef]
  38. Lei, X.; Zhang, X.; Dai, Q.; Li, L. Dynamic evaluation on the energy and environmental performance of China’s transportation sector: A ZSG-MEA window analysis. Environ. Sci. Pollut. Res. 2020, 28, 11454–11468. [Google Scholar] [CrossRef] [PubMed]
  39. Chang, W.J.; Chen, L.B.; Su, J.P. Design and Implementation of Intelligent Tape for Monitoring High-Price and Fragile Cargo Shipments During Transport Procedures. IEEE Sensors J. 2020, 20, 14521–14533. [Google Scholar] [CrossRef]
  40. Bogetoft, P.; Hougaard, J.L. Efficiency Evaluations Based on Potential (Non-Proportional) Improvements. J. Product. Anal. 1999, 12, 233–247. [Google Scholar] [CrossRef]
  41. Asmild, M.; Hougaard, J.L.; Kronborg, D.; Kvist, H.K. Measuring Inefficiency via Potential Improvements. J. Product. Anal. 2003, 19, 59–76. [Google Scholar] [CrossRef]
  42. Bogetoft, P.; Hougaard, J.L. Super efficiency evaluations based on potential slack. Eur. J. Oper. Res. 2004, 152, 14–21. [Google Scholar] [CrossRef]
  43. Hahn, G.; Brandenburg, M.; Becker, J. Valuing Supply Chain Performance Within and Across Manufacturing Industries: A DEA-based Approach. Int. J. Prod. Econ. 2021, 240, 108203. [Google Scholar] [CrossRef]
  44. Asmild, M.; Baležentis, T.; Hougaard, J.L. Multi-directional program efficiency: The case of Lithuanian family farms. J. Product. Anal. 2016, 45, 23–33. [Google Scholar] [CrossRef]
  45. Manevska-Tasevska, G.; Hansson, H.; Asmild, M.; Surry, Y. Exploring the regional efficiency of the Swedish agricultural sector during the CAP reforms—Multi-directional efficiency analysis approach. Land Use Policy 2021, 100, 104897. [Google Scholar] [CrossRef]
  46. Farrell, M.J. The Measurement of Productive Efficiency. J. R. Stat. Society. Ser. A 1957, 120, 253. [Google Scholar] [CrossRef]
  47. Charnes, A.; Cooper, W.W.; Rhodes, E. Measuring the efficiency of decision making units. Eur. J. Oper. Res. 1978, 2, 429–444. [Google Scholar] [CrossRef]
  48. Asmild, M.; Matthews, K. Multi-directional efficiency analysis of efficiency patterns in Chinese banks 1997–2008. Eur. J. Oper. Res. 2012, 219, 434–441. [Google Scholar] [CrossRef]
  49. Dyson, R.G.; Allen, R.; Camanho, A.S.; Podinovski, V.V.; Sarrico, C.S.; Shale, E.A. Pitfalls and protocols in DEA. Eur. J. Oper. Res. 2001, 132, 245–259. [Google Scholar] [CrossRef]
  50. Bogetoft, P.; Otto, L. Benchmarking with DEA, SFA, and R; International Series in Operations Research & Management Science; Springer: New York, NY, USA, 2011; Volume 157. [Google Scholar] [CrossRef]
  51. Mohan, J.; Lanka, K.; Rao, A.N. A Review of Dynamic Job Shop Scheduling Techniques. Procedia Manuf. 2019, 30, 34–39. [Google Scholar] [CrossRef]
  52. Li, X.; Gao, L. Review for Flexible Job Shop Scheduling. In Effective Methods for Integrated Process Planning and Scheduling. Engineering Applications of Computational Methods; Springer: Berlin/Heidelberg, Germany, 2020; Volume 2, pp. 17–45. [Google Scholar]
  53. Schrijver, A. On the History of Combinatorial Optimization (Till 1960). In Handbooks in Operations Research and Management Science; Aardal, K., Nemhauser, G., Weismantel, R., Eds.; Elsevier: Amsterdam, The Netherlands, 2005; Volume 12, pp. 1–68. [Google Scholar] [CrossRef]
  54. Koehl, P.; Orland, H. Fast computation of exact solutions of generic and degenerate assignment problems. Phys. Rev. E 2021, 103, 042101. [Google Scholar] [CrossRef]
  55. Wang, H. Time series modeling and predicting for Highway Transport Freight. In Proceedings of the 2011 International Conference on Remote Sensing, Environment and Transportation Engineering, Nanjing, China, 24–26 June 2011; pp. 5603–5605. [Google Scholar] [CrossRef]
  56. Tang, J.; Liu, F.; Zou, Y.; Zhang, W.; Wang, Y. An Improved Fuzzy Neural Network for Traffic Speed Prediction Considering Periodic Characteristic. IEEE Trans. Intell. Transp. Syst. 2017, 18, 2340–2350. [Google Scholar] [CrossRef]
  57. Deb, B.; Khan, S.R.; Tanvir Hasan, K.; Khan, A.H.; Alam, M.A. Travel Time Prediction using Machine Learning and Weather Impact on Traffic Conditions. In Proceedings of the 2019 IEEE 5th International Conference for Convergence in Technology (I2CT), Bombay, India, 29–31 March 2019; pp. 1–8. [Google Scholar] [CrossRef]
  58. Nadi, A.; Sharma, S.; Snelder, M.; Bakri, T.; van Lint, H.; Tavasszy, L. Short-term prediction of outbound truck traffic from the exchange of information in logistics hubs: A case study for the port of Rotterdam. Transp. Res. Part C Emerg. Technol. 2021, 127, 103111. [Google Scholar] [CrossRef]
  59. APS. Port of Sines. Available online: https://www.apsinesalgarve.pt/en/ports/port-of-sines/ (accessed on 25 May 2023).
  60. Slideshare - aicep Global Parques. Sines Port Hub for Logistics. Available online: https://pt.slideshare.net/aicepGlobalParques/sines-port-hub-for-logistics-243980750 (accessed on 30 July 2023).
  61. Bergqvist, R. Hinterland Logistics and Global Supply Chains; Kogan Page Publishers: London, UK, 2012; pp. 211–230. [Google Scholar]
Figure 1. General scheme of the internal operation of the Multimodal Control Tower. In blue, are the modules specifically developed for this study and their integration with the remaining of the proposed solution. Source: own elaboration.
Sustainability 16 00742 g001
Figure 2. Contextual integration of the PMSP IoT device in the logistics problem. Source: own elaboration.
Sustainability 16 00742 g002
Figure 3. Example of a container transportation network represented by a directed labeled multigraph  M = ( N , E , L )  with nodes  N = { N 1 , N 2 , N 3 , N 4 } , edges  E = { E 1 , , E 7 } , and information labels  L = { 6 / A 1 , , 4 / A 5 } . Source: own elaboration.
Sustainability 16 00742 g003
Figure 4. Flowcharts of the inner operations of the algorithms that comprise Module 3. Source: own elaboration.
Sustainability 16 00742 g004
Figure 5. Port of Sines—Hinterland domain (Portugal and Spain). Source: adapted from [59].
Sustainability 16 00742 g005
Figure 6. Multigraph representation of the case study. Source: own elaboration.
Sustainability 16 00742 g006
Figure 7. Inputs and outputs considered for the MEA model referring to container transport logistics services. Units: LSC in euros, DT and DlayT in hours, and CO2 in grams. LYCS is a score in [0-completely unsatisfied, 10-completely satisfied] and DC is a score in [0-non conform, 2-all conform]. Source: own elaboration.
Sustainability 16 00742 g007
Figure 8. Case study dataset overall information: Frequency of containers per multimodal transportation route (Freq), individual directed graphs, and mean ± standard deviation of input and output variables. Source: own elaboration.
Sustainability 16 00742 g008
Figure 9. Output useful for LSPs: TEI heatmap of the routes, where dark blue is the worst TEI and dark red is the best TEI [left]; Inefficiencies percentage ratio of the input variables for the set of container transportations with TEI equal to 1 (worst qualification) [right]. Source: own elaboration.
Sustainability 16 00742 g009
Figure 10. Output useful for the Logistics Client: TEI for each container transportation grouped by logistic service provider. Please note that the x-axis in the scatter plots represents the number of routes carried by the respective LSP, sorted chronologically—from left to right—according to their occurrence. Source: own elaboration.
Sustainability 16 00742 g010
Disclaimer/Publisher’s Note: The statements, opinions and data contained in all publications are solely those of the individual author(s) and contributor(s) and not of MDPI and/or the editor(s). MDPI and/or the editor(s) disclaim responsibility for any injury to people or property resulting from any ideas, methods, instructions or products referred to in the content.

