


Optimal Energy Configuration of Integrated Energy Community Considering Carbon Emission

Abstract
1. Introduction
2. Integrated Energy Community Energy System Modeling
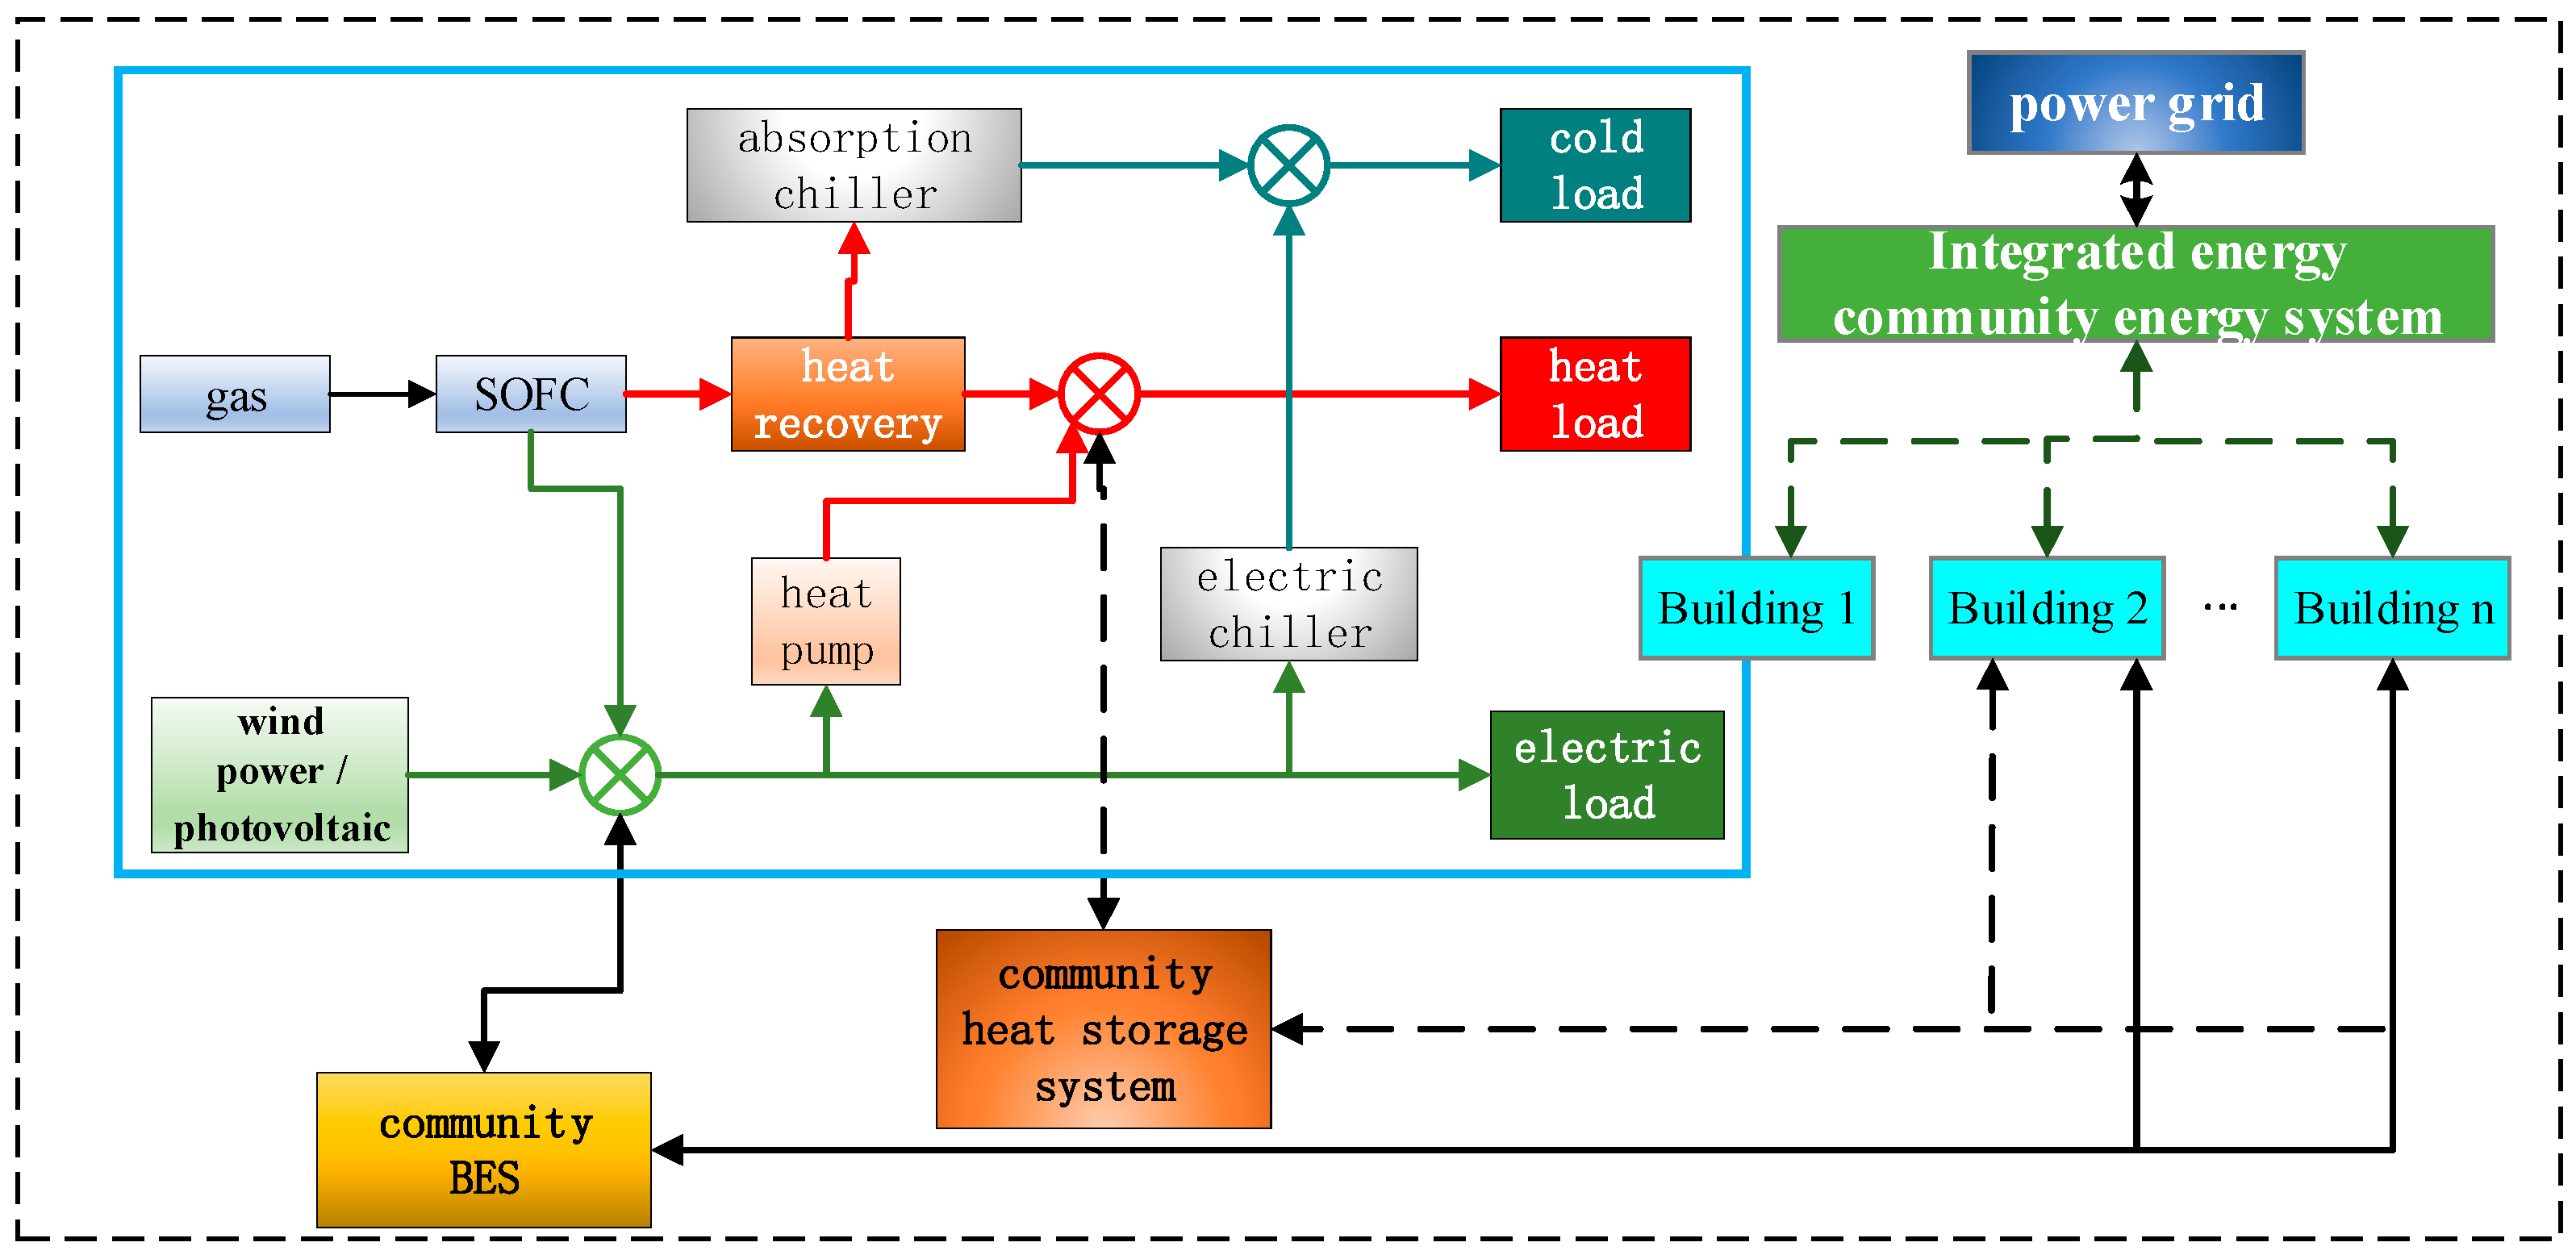
2.1. Integrated Energy Community’s Energy System Structure
2.2. Mathematical Model
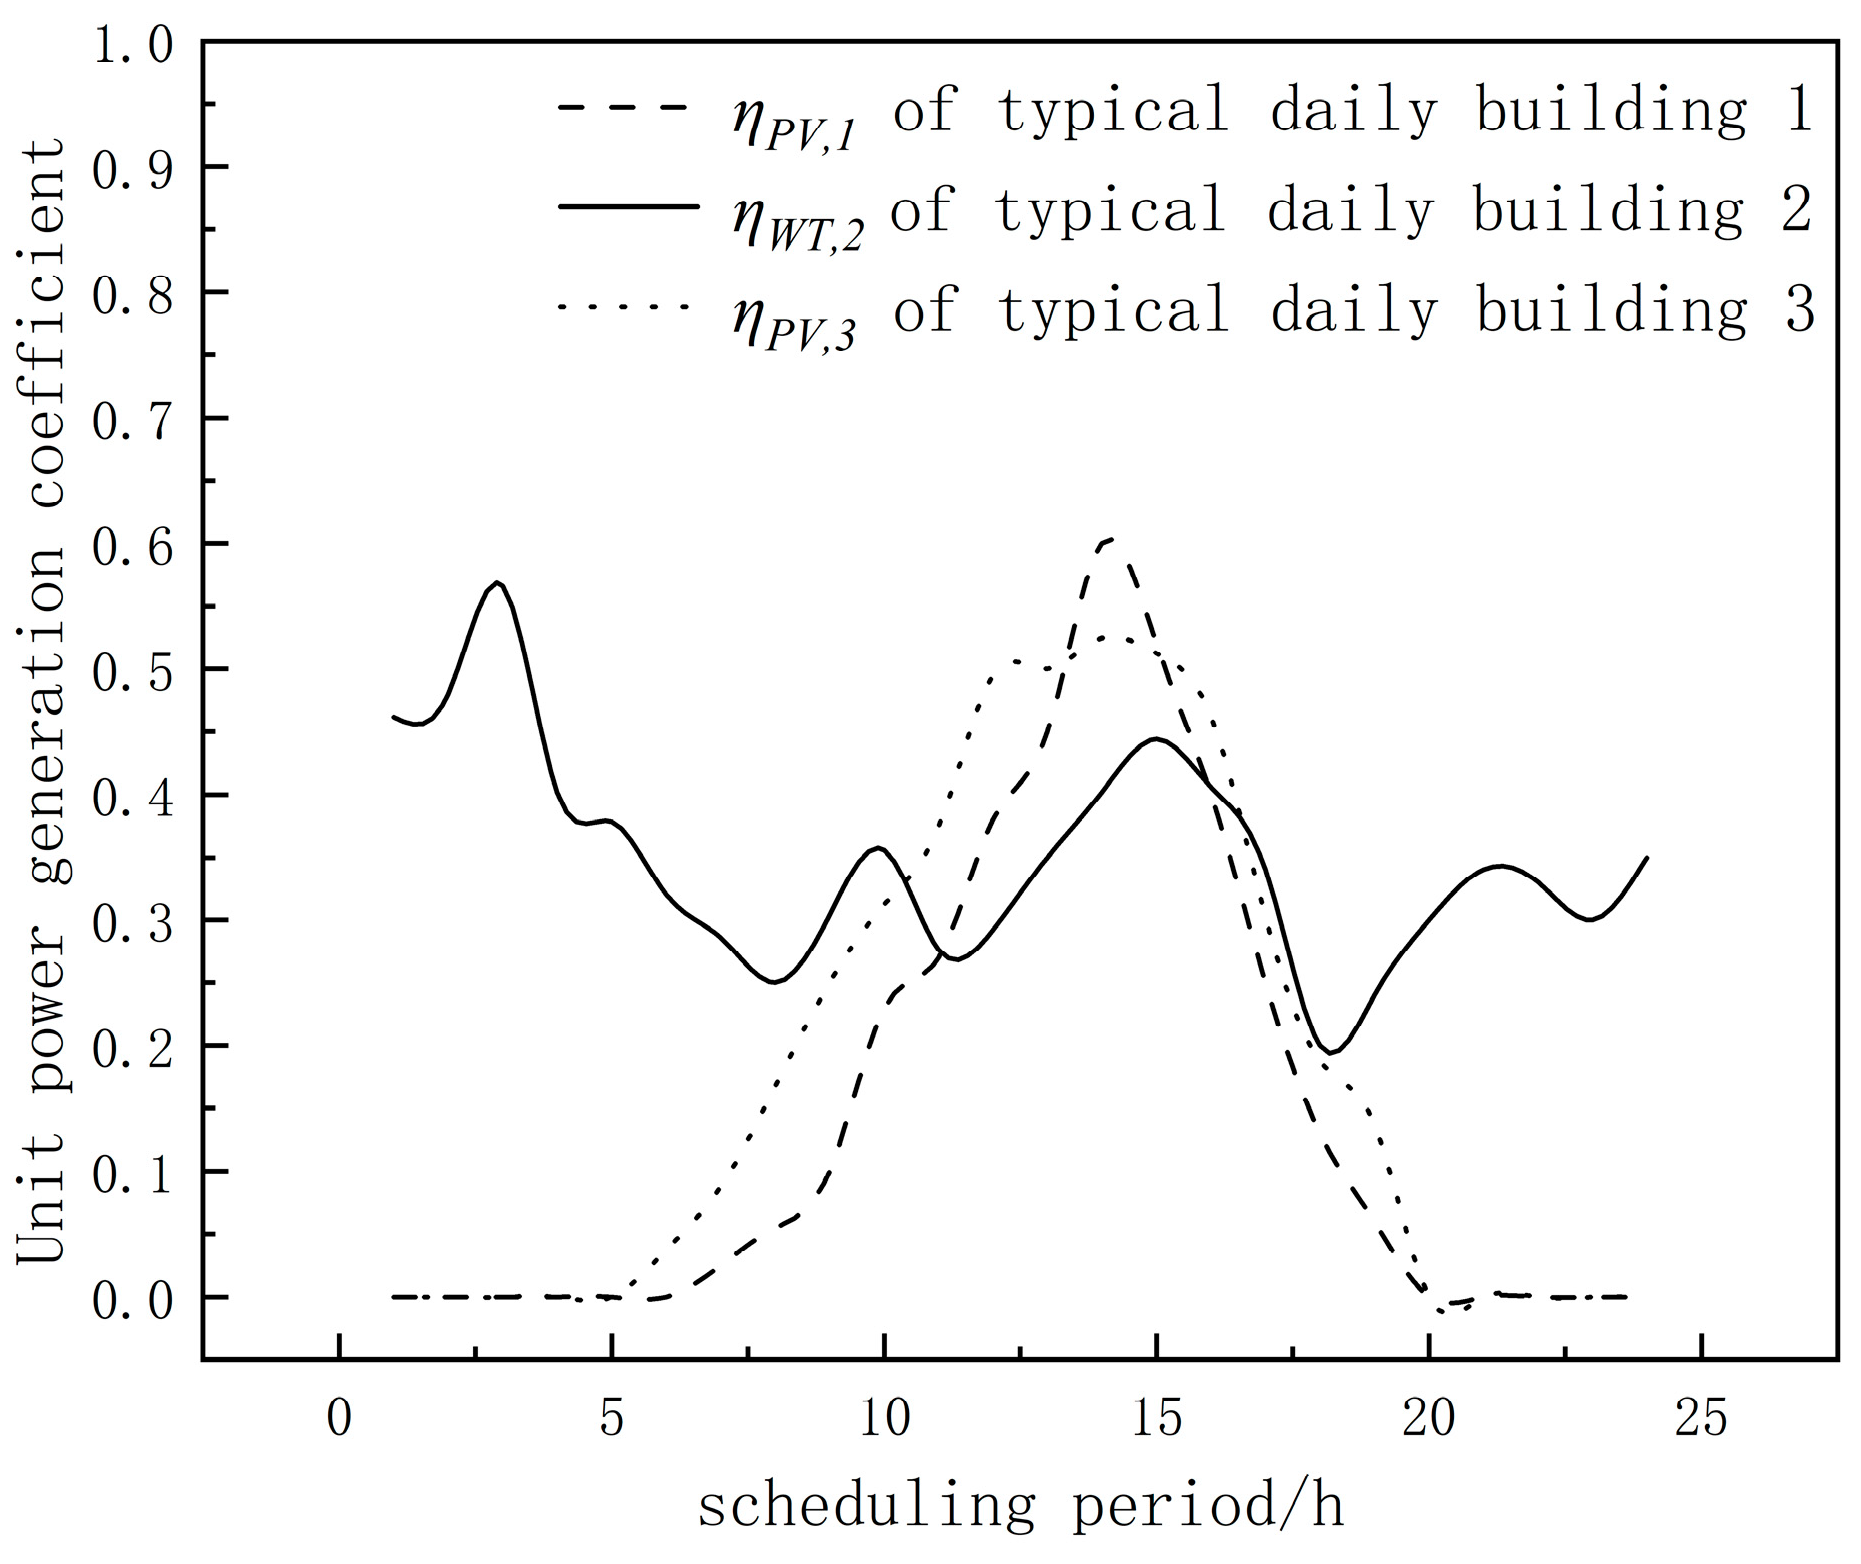
2.2.1. Distributed Renewable Energy Model
2.2.2. SOFC Model
2.2.3. Power Storage System Model
2.2.4. Heat Storage System Model
2.2.5. Electric Heat Pump Model
2.2.6. Electric Refrigerator Model
2.2.7. Absorption Refrigerator Model
3. Dual-Objective Optimal Configuration Model of Integrated Energy Community
3.1. Objective Function
3.1.1. Total Annual Operating Costs
- The investment cost of the power storage system:
- 2.
- The investment cost of the heat storage system;
- 3.
- The investment cost of the photovoltaic system;
- 4.
- The investment cost of the wind power system;
- 5.
- The SOFC system’s investment costs;
- 6.
- The investment cost of the heat pump:
- 7.
- The investment cost of the electric refrigerator:
- 8.
- The investment cost of the absorption chillers:
- 9.
- The cost of purchasing electricity from the grid:
- 10.
- Revenue from electricity sales to the grid:
- 11.
- The cost of purchasing natural gas:
3.1.2. Total Annual Carbon Emissions
3.2. Constraint Condition
- The equipment’s state constraints:
- 2.
- The cold and hot energy balance constraints:
- 3.
- The state constraints of the buildings’ electric power:
- 4.
- The community’s electrical power state constraints:
- 5.
- The electricity purchase and sale’s constraints in the community:
- 6.
- The continuity constraint of the state of charge of the storage system:
- 7.
- The state constraints of the heat storage system:
4. The Method of Solving the Model
4.1. ε-Constraint Method
4.2. Model Linearization
5. Example Analysis
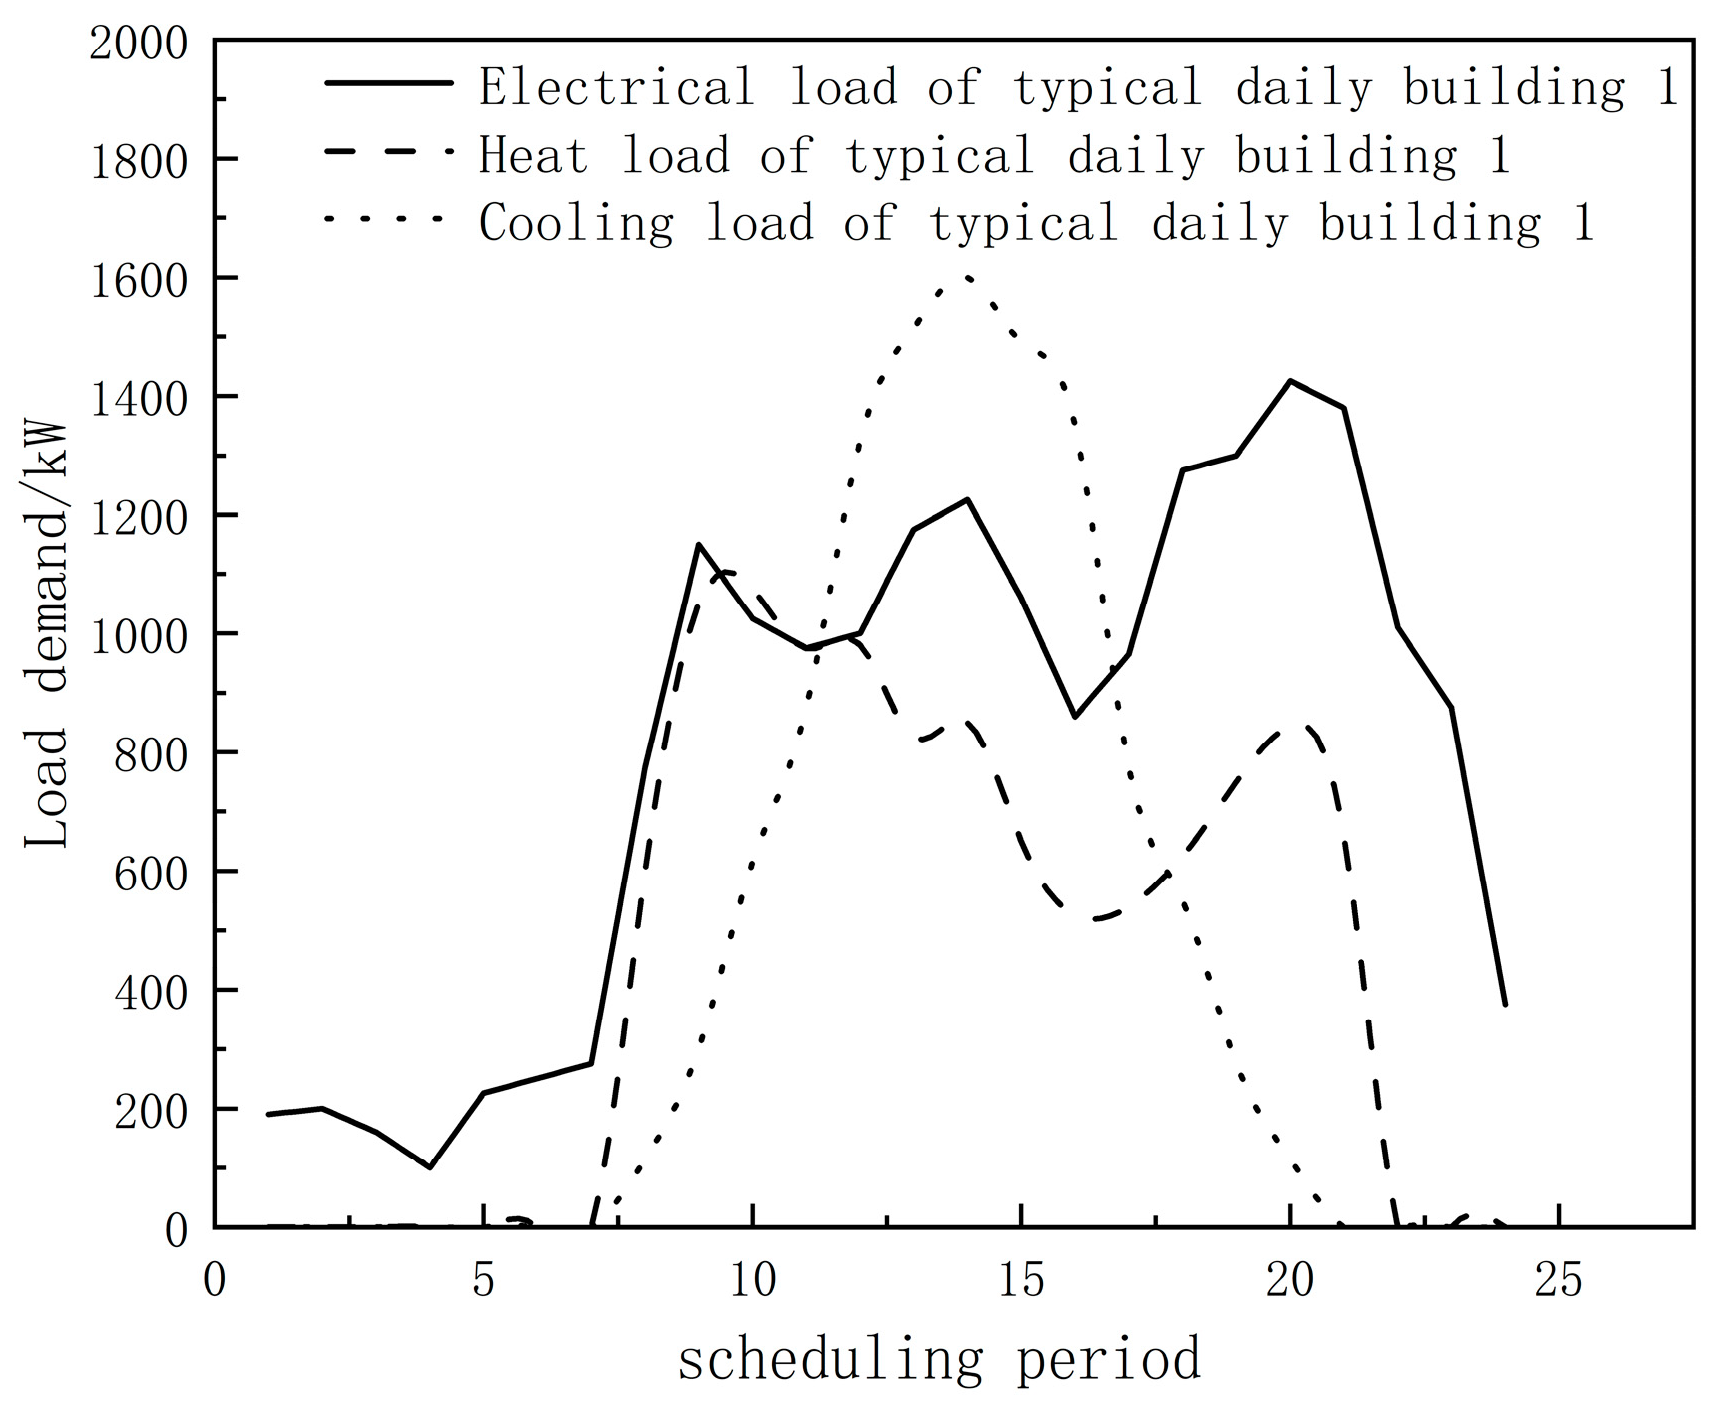
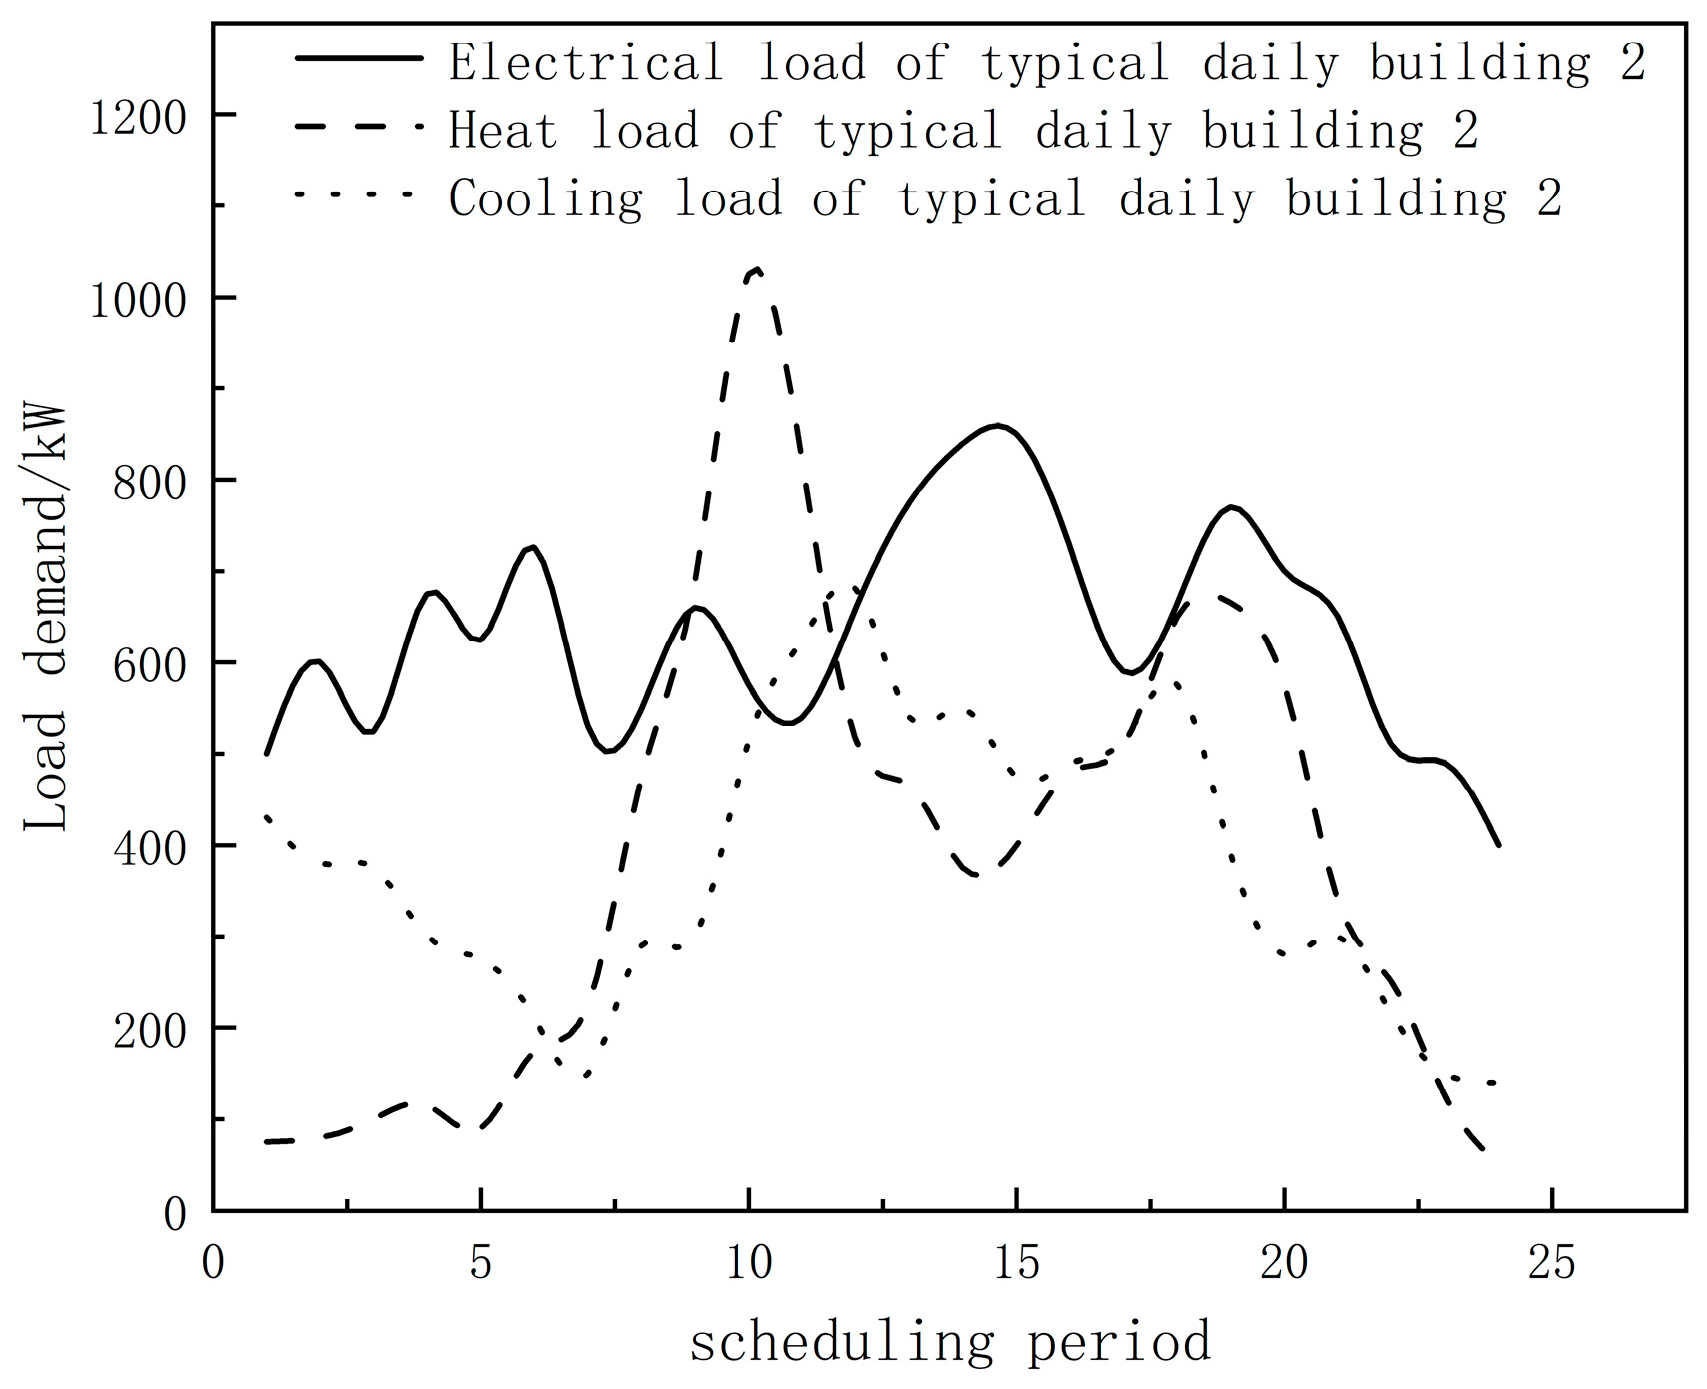
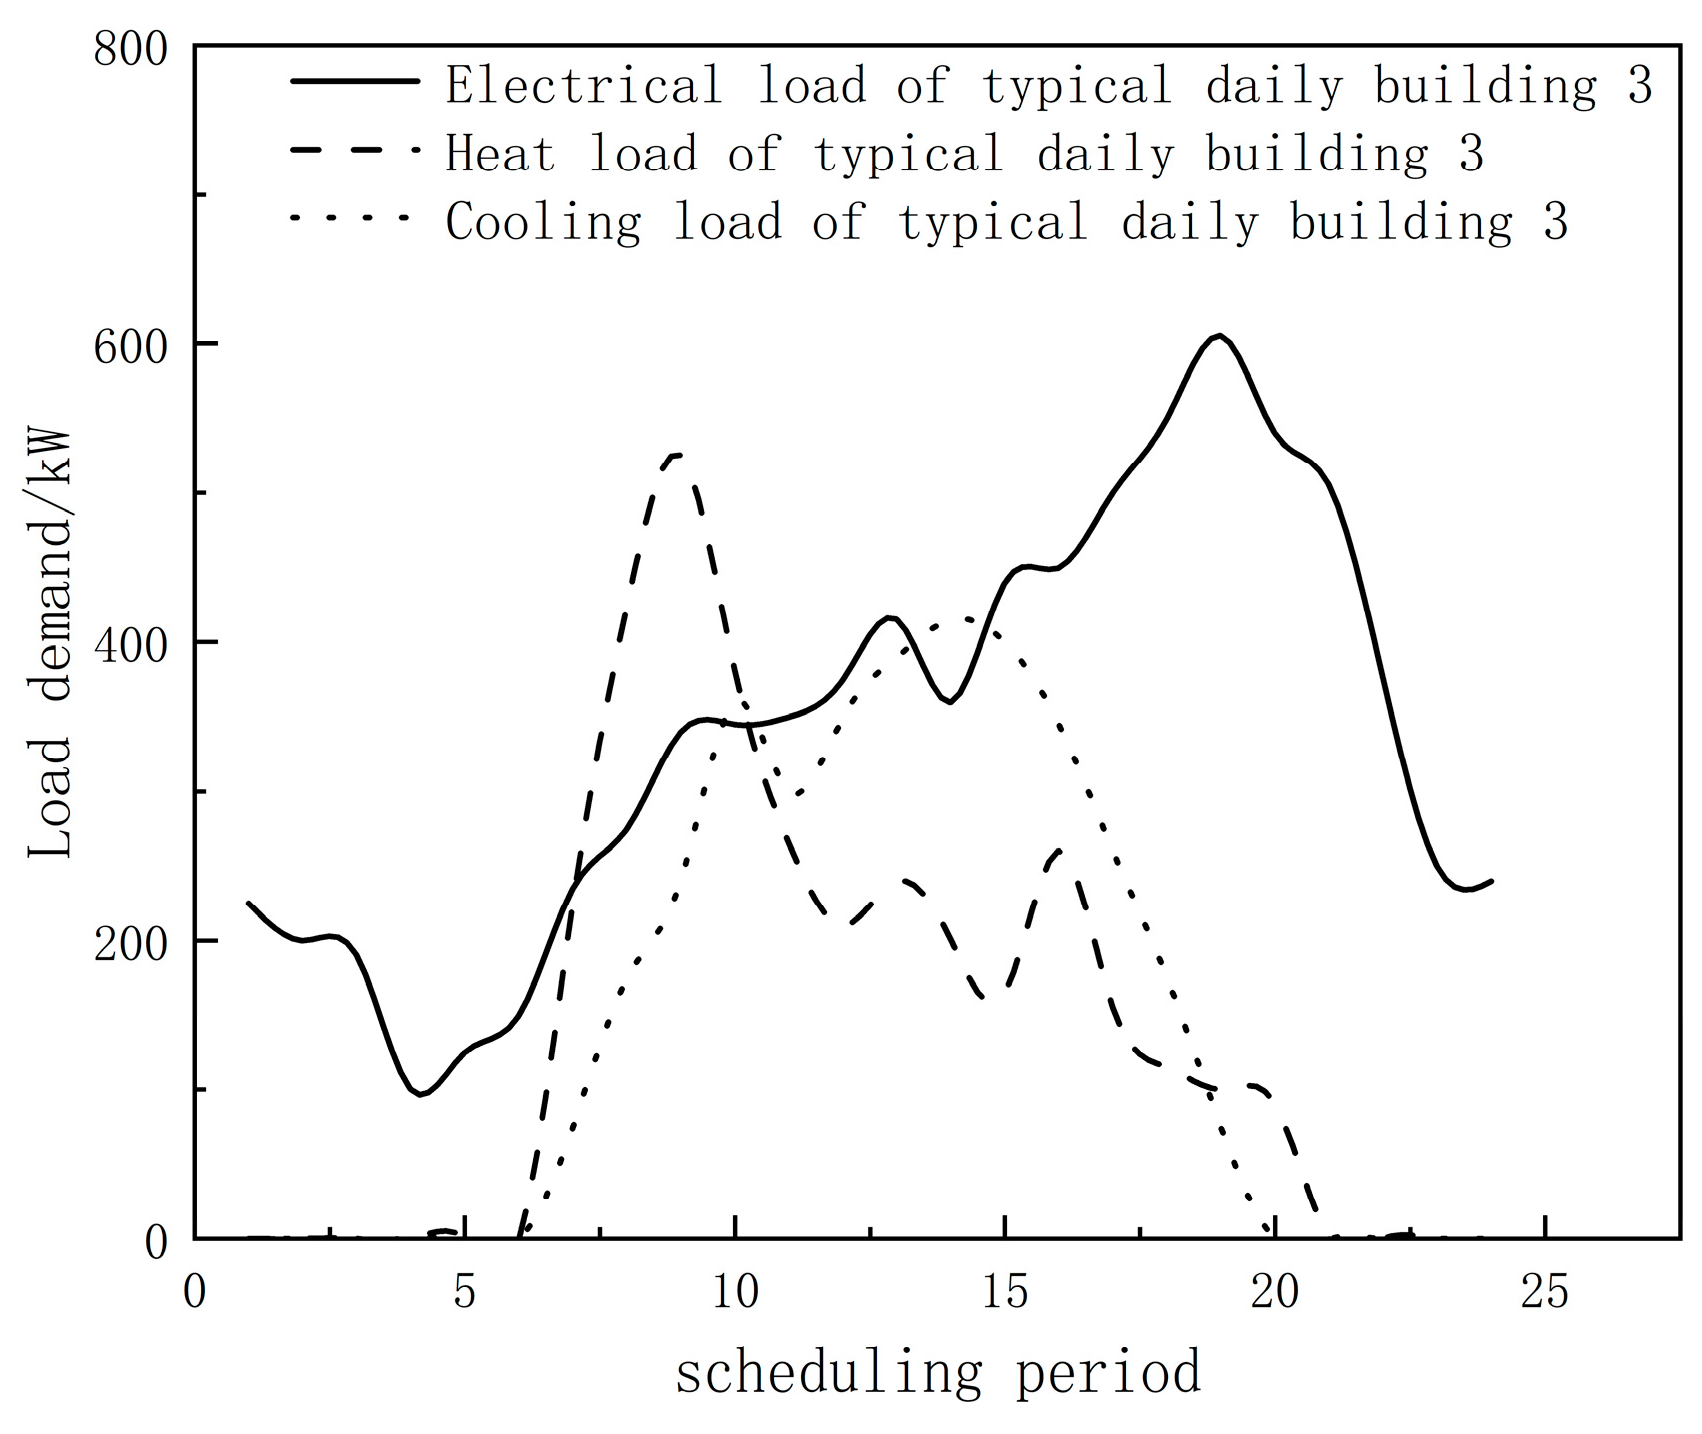
5.1. Scene Setting
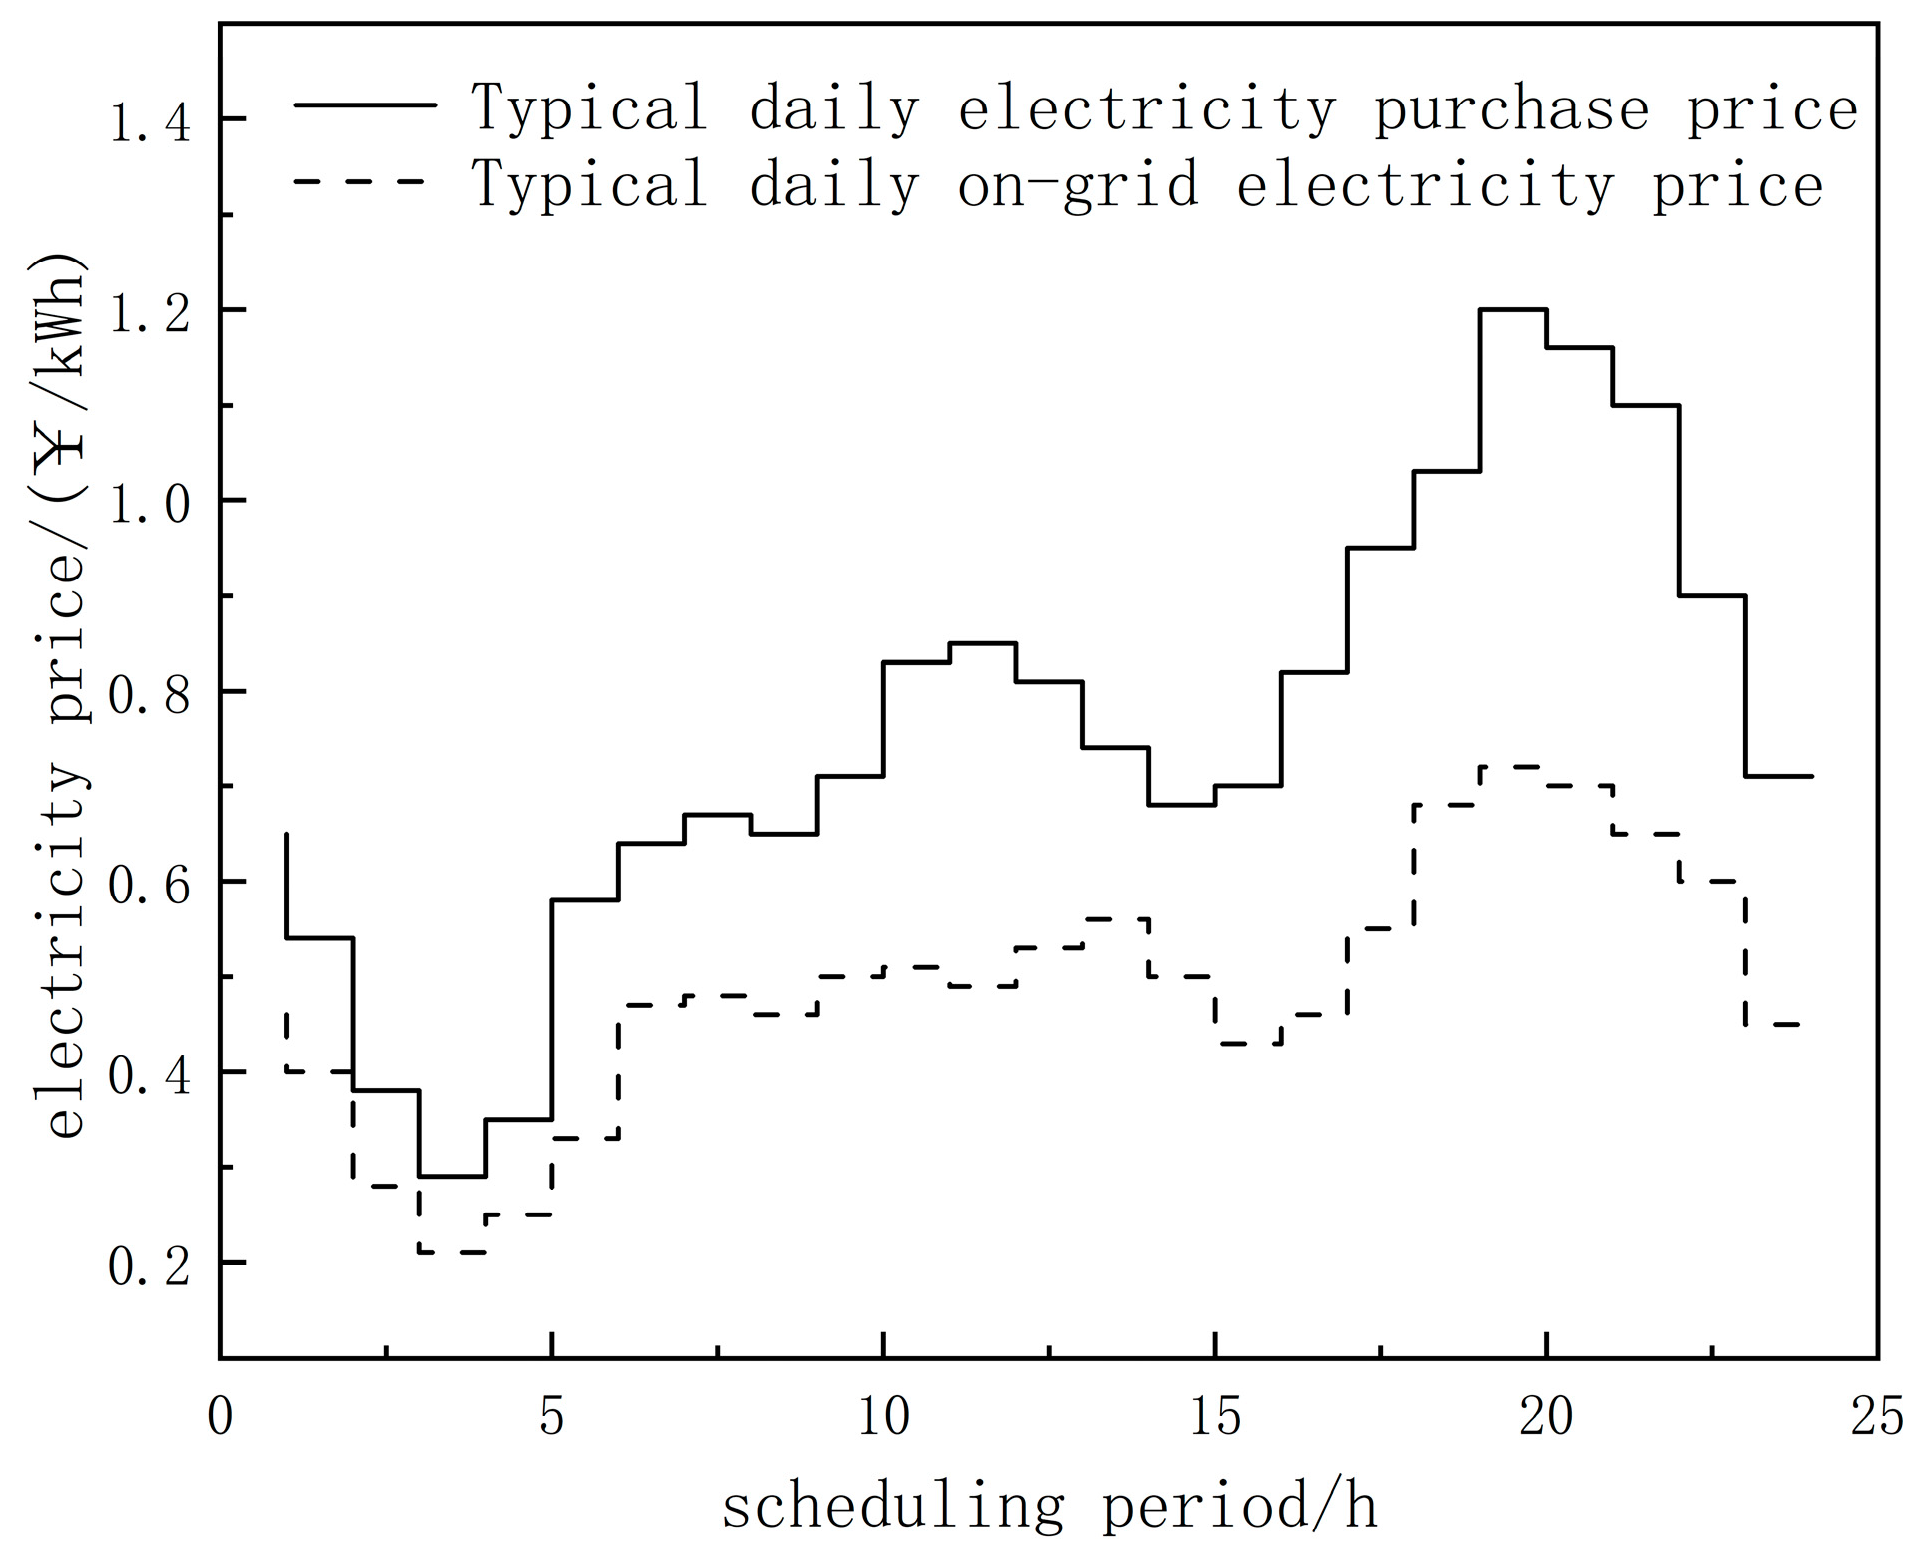
5.2. Basic Parameters and Data
5.3. Result and Discussion
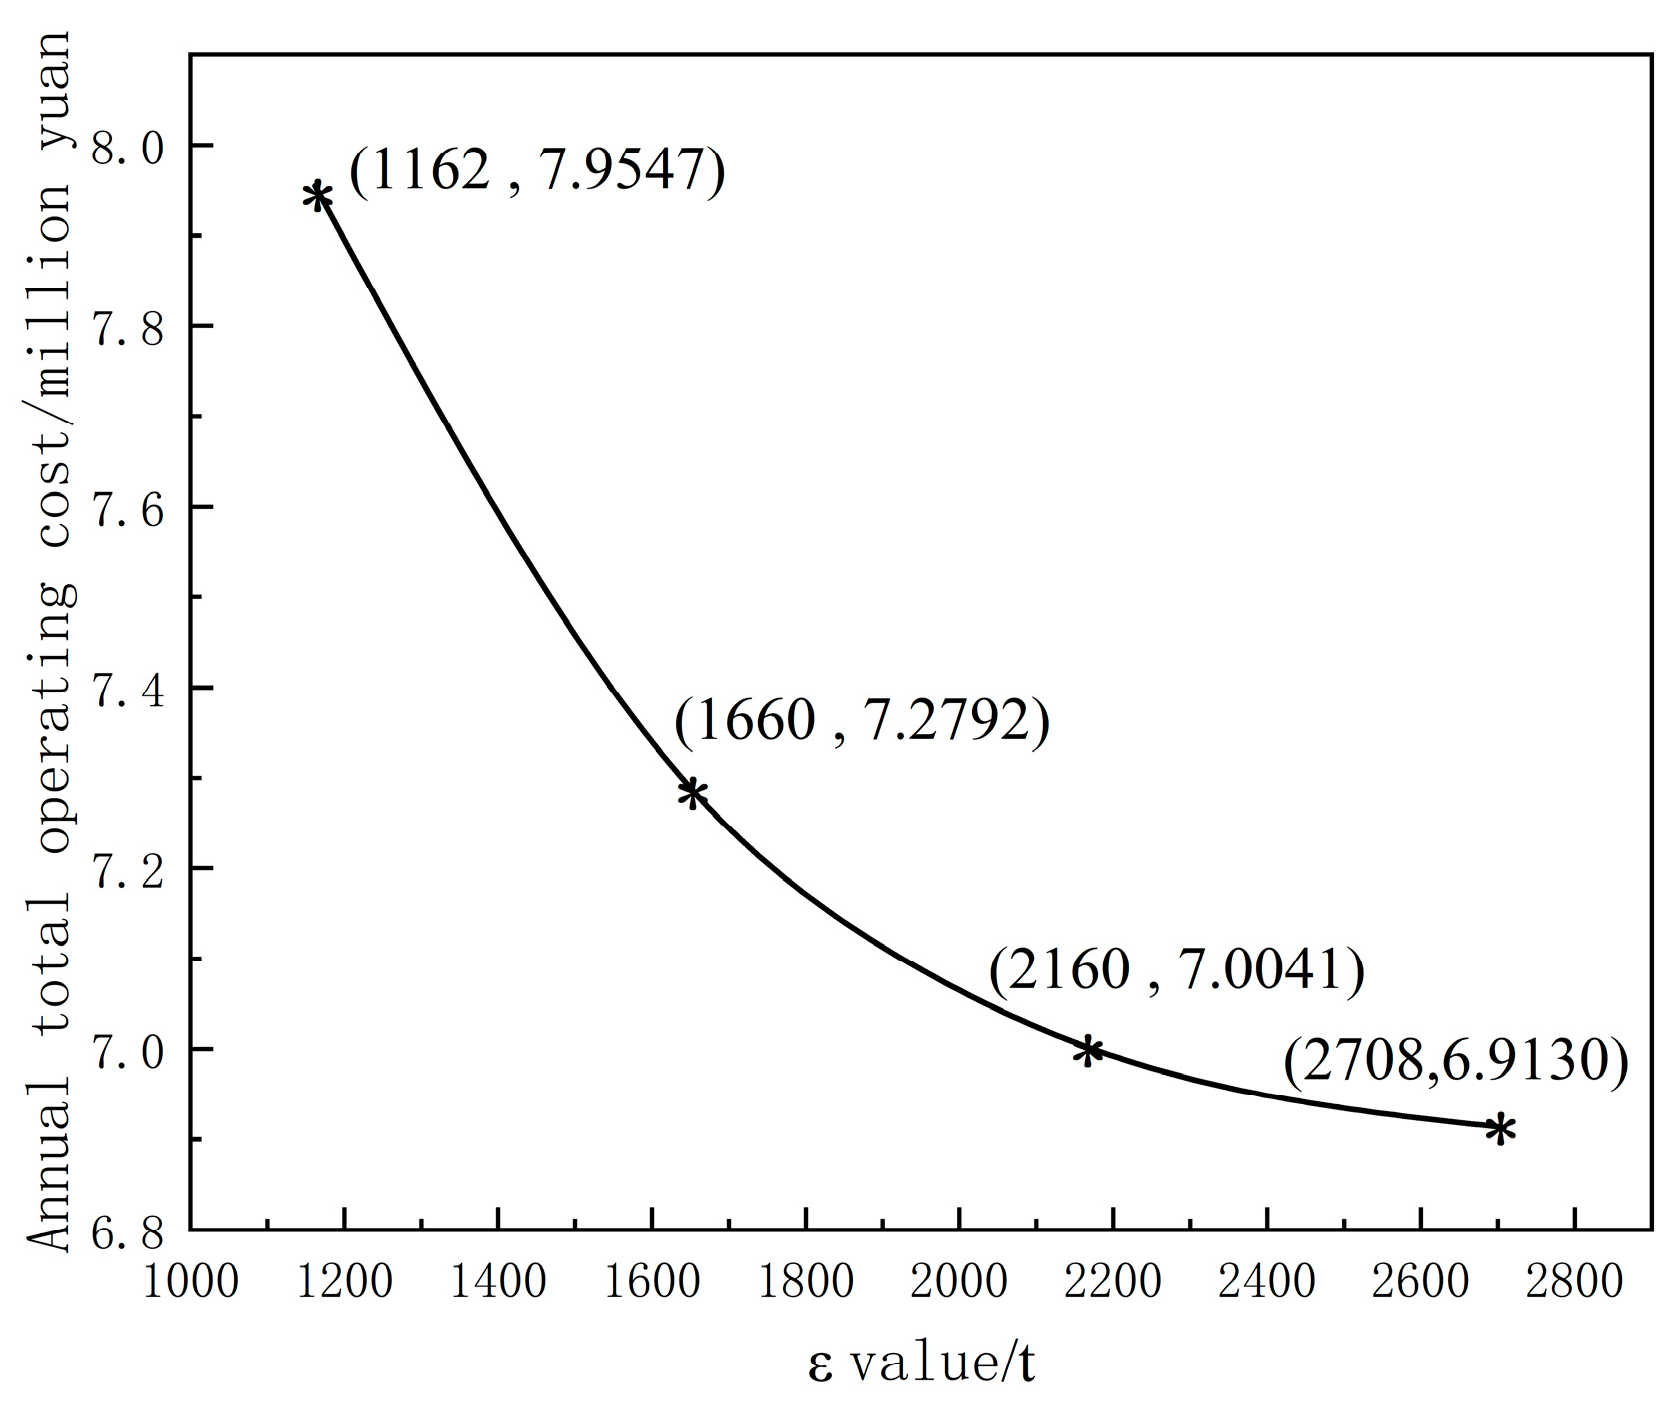
5.3.1. Analysis of Configuration Results under Different Restriction Domains, ε
5.3.2. Analysis of Energy Configuration Results in Different Scenarios
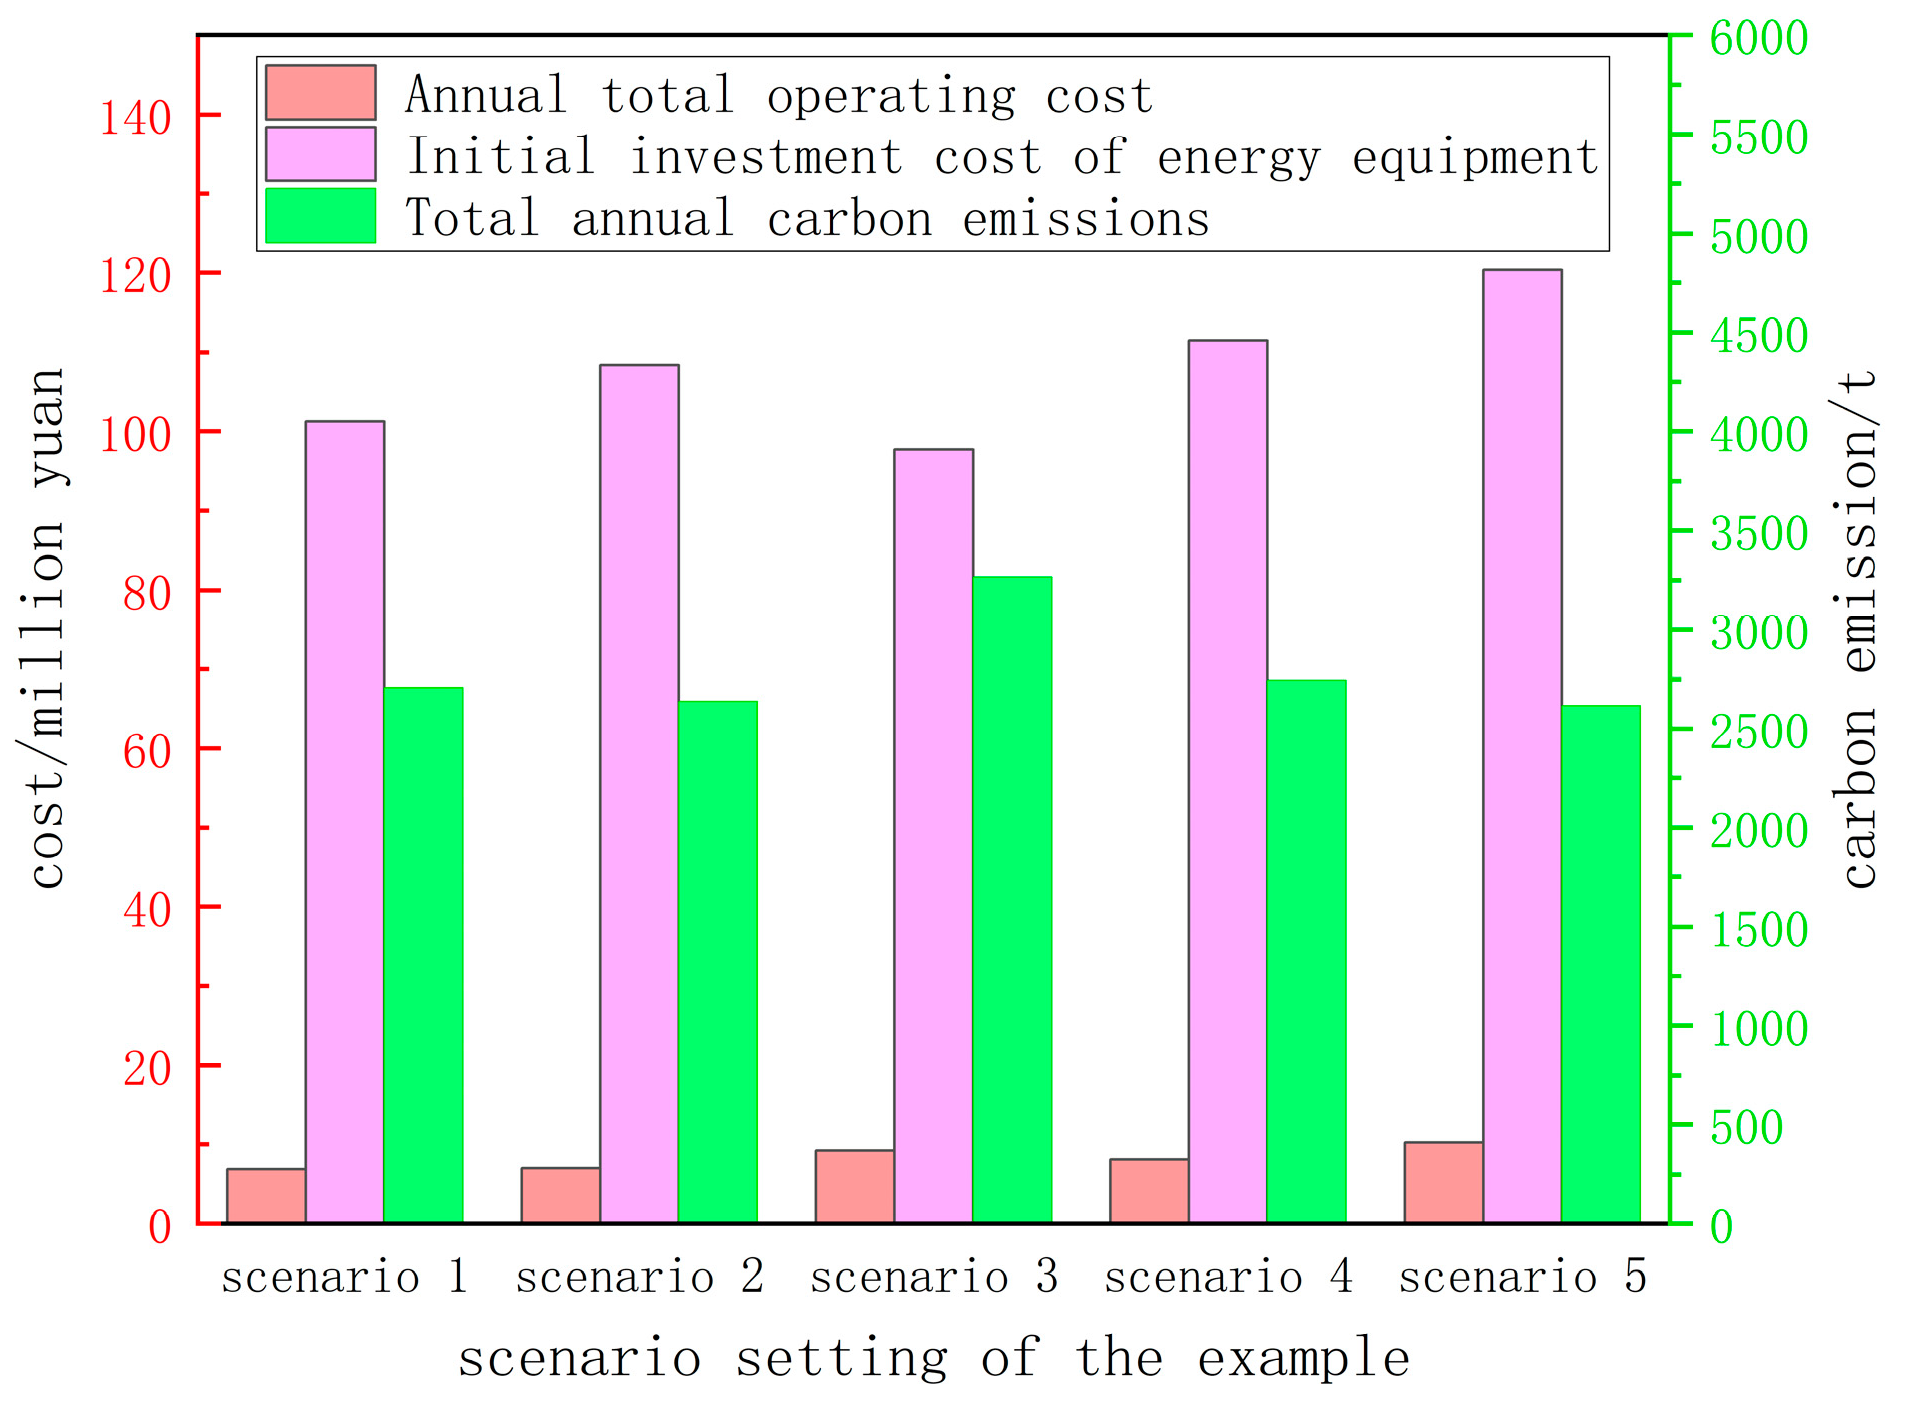
5.3.3. Analysis of Economic and Environmental Benefits of Different Scenarios’ Configurations
6. Conclusions
- (1)
- A dual-objective optimal energy allocation model considering economic and environmental factors is established. In order to facilitate a rapid solution, the ε-constraint method is used to simplify the multi-objective problem into a single-objective problem, and the nonlinear constraints are linearized through the Big-M method and the McCormick relaxation method.
- (2)
- The analysis results of the examples under the different scenarios show that as the value of ε decreases, the maximum estimate of the annual total carbon emissions of the integrated energy community by decision makers decreases. Along with this, the annual total operating cost of the integrated energy community gradually decreases. Therefore, in this process, decision makers need to incur higher economic costs in exchange for environmental benefits. This reveals that decision makers can achieve a balance between carbon emission reduction and operating costs by adjusting the ε value and adjusting different energy configurations.
- (3)
- The sharing of thermal storage systems and power storage systems can effectively reduce the configuration capacity and planning costs of comprehensive energy communities and improve energy utilization and energy equipment utilization. At the same time, the cost of thermal storage systems is lower than that of power storage systems, but the configuration is over-configured. Multiple heat storage systems are not conducive to the reduction carbon emissions from comprehensive energy sources. Therefore, in terms of energy allocation, it is necessary to comprehensively consider economic costs, energy conservation, and emission reduction to coordinate and optimize the configuration of power storage systems and heat storage systems.
Author Contributions
Funding
Institutional Review Board Statement
Informed Consent Statement
Data Availability Statement
Conflicts of Interest
Appendix A

| Parameter | Numerical Value | Unit | |
|---|---|---|---|
| discount rate | 5% | ||
| plant life cycle | 20 | year | |
| the primary investment cost of power storage system | 1500 | CNY/kWh | |
| primary investment cost of heat storage system | 400 | CNY/kWh | |
| economic parameters | primary investment cost of photovoltaic system | 3500 | CNY/kWp |
| primary investment cost of wind power system | 7500 | CNY/kW | |
| the first investment cost of SOFC system | 19,000 | CNY/kW | |
| primary investment cost of heat pump | 1275 | CNY/kW | |
| the first investment cost of electric refrigerator | 970 | CNY/kW | |
| the first investment cost of absorption refrigerator | 1200 | CNY/kW | |
| charging efficiency of power storage system | 88% | ||
| discharge efficiency of power storage system | 88% | ||
| the maximum state of charge of the storage system | 0.9 | ||
| the minimum state of charge of the storage system | 0.1 | ||
| charging efficiency of heat storage system | 88% | ||
| heat release efficiency of heat storage system | 88% | ||
| the maximum heat storage state of the heat storage system | 0.9 | ||
| the minimum heat storage state of the heat storage system | 0.1 | ||
| technical parameters | the upper limit of photovoltaic system planning in Building 1 the upper limit of photovoltaic system planning in Building 1 | 7500 | kWp |
| the upper limit of wind power system planning in Building 2 | 3750 | kW | |
| the upper limit of photovoltaic system planning in Building 3 | 1000 | kWp | |
| the upper limit of SOFC system planning in buildings | 450 | kW | |
| the electrical efficiency of SOFC | 45% | ||
| the output thermoelectric ratio of SOFC | 80% | ||
| heat efficiency of heat pump | 2 | ||
| cooling efficiency of an electric refrigerator | 3 | ||
| refrigeration efficiency of absorption refrigerators | 1 | ||
| environmental parameters | unit carbon emission coefficient of power grid | 0.673 | kg/kWh |
| the unit carbon emission coefficient of natural gas | 0.180 | kg/kWh |
References
- El Bassam, N. Current distributed renewable energy in rural and urban communities. In Distributed Renewable Energies for Off-Grid Communities; Elsevier Inc.: Amsterdam, The Netherlands, 2021; pp. 297–326. [Google Scholar]
- Liu, C.; Wang, H.; Wang, Z.; Liu, Z.; Tang, Y.; Yang, S. Research on life cycle low carbon optimization method of multi-energy complementary distributed energy system: A review. J. Clean. Prod. 2022, 336, 130380. [Google Scholar] [CrossRef]
- Bucking, S.; Dermardiros, V. Distributed evolutionary algorithm for co-optimization of building and district systems for early community energy masterplanning. Appl. Soft Comput. 2018, 63, 14–22. [Google Scholar] [CrossRef]
- Wang, Y.; Li, R.; Dong, H.; Ma, Y.; Yang, J.; Zhang, F.; Zhu, J.; Li, S. Capacity planning and optimization of business park-level integrated energy system based on investment constraints. Energy 2019, 189, 116345. [Google Scholar] [CrossRef]
- Lin, Y.J.; Miao, S.H.; Yin, X.B. Optimal planning for economy and reliability of integrated energy system based on improved co-evolution algorithm. Electr. Power Autom. Equip. 2021, 41, 173–181. [Google Scholar]
- Gao, J.; Gao, F.; Ma, Z.; Huang, N.; Yang, Y. Multi-objective optimization of smart community integrated energy considering the utility of decision makers based on the Lévy flight improved chicken swarm algorithm. Sustain. Cities Soc. 2021, 72, 103075. [Google Scholar] [CrossRef]
- Liu, Z.; Guo, J.; Wu, D.; Fan, G.; Zhang, S.; Yang, X.; Ge, H. Two-phase collaborative optimization and operation strategy for a new distributed energy system that combines multi-energy storage for a nearly zero energy community. Energy Convers. Manag. 2021, 230, 113800. [Google Scholar] [CrossRef]
- Chao, Q.; Xiaofeng, D.; Tong, J. Optimization planning of integrated electricity-gas community energy system based on coupled CCHP. Power System Technol. 2018, 42, 2456–2466. [Google Scholar]
- Cui, Q.; Bai, X.; Dong, W.; Huang, B. Joint optimization of planning and operation in user-side multi-energy systems. Proc. CSEE 2019, 39, 4967–4981+5279. [Google Scholar]
- Zhang, Y.; Campana, P.E.; Lundblad, A.; Zheng, W.; Yan, J. Planning and operation of an integrated energy system in a Swedish building. Energy Convers. Manag. 2019, 199, 111920. [Google Scholar] [CrossRef]
- Li, C.; Yang, H.; Shahidehpour, M.; Xu, Z.; Zhou, B.; Cao, Y.; Zeng, L. Optimal planning of islanded integrated energy system with solar-biogas energy supply. IEEE Trans. Sustain. Energy 2019, 11, 2437–2448. [Google Scholar] [CrossRef]
- Ko, W.; Kim, J. Generation expansion planning model for integrated energy system considering feasible operation region and generation efficiency of combined heat and power. Energies 2019, 12, 226. [Google Scholar] [CrossRef]
- Liu, J.; Liu, S. Optimal distributed generation allocation in distribution network based on second order conic relaxation and big-m method. Power Syst Technol. 2018, 42, 2604–2611. [Google Scholar]
- Zhang, C.; Kai, K.A.; Sheng, L.U.; Xinyu, Q.I.; Huang, Y.; Zhengtian, L.I. Economic scheduling of renewable energy storage plants with integrated thermal management of energy storage systems and battery life. Energy Storage Sci. Technol. 2021, 10, 1353. [Google Scholar]
- Jiang, Z.; Liu, T.; Jiang, X.; Sheng, G. Reconfiguration of active distribution network considering DG and load uncertainty. Electr. Meas. Instrum. 2019, 56, 76–84. [Google Scholar]
- Sun, J.; Hu, J.; Wei, F. Optimal power configuration of distributed generation operator considering cooperation of stakeholders. Electr. Power Constr. 2021, 42, 127–134. [Google Scholar]
- Jing, R.; Wang, M.; Liang, H.; Wang, X.; Li, N.; Shah, N.; Zhao, Y. Multi-objective optimization of a neighborhood-level urban energy network: Considering Game-theory inspired multi-benefit allocation constraints. Appl. Energy 2018, 231, 534–548. [Google Scholar] [CrossRef]
- Sun, W.; Chen, Z.; Zhang, Y.; Su, Z.; Sun, L. Economic day-ahead scheduling of sofc-based integrated tri-generation energy system using dynamic programming. Proc. CSEE 2022, 42, 7775–7784. [Google Scholar]
- Rao, Y.; Cui, X.; Zou, X.; Ying, L.; Tong, P.; Li, J. Research on Distributed Energy Storage Planning-Scheduling Strategy of Regional Power Grid Considering Demand Response. Sustainability 2023, 15, 14540. [Google Scholar] [CrossRef]
- CPLEX. IBM ILOG CPLEX Optimization Studio V12.10; IBM: New York, NY, USA, 2023. [Google Scholar]
- AlSkaif, T.; Luna, A.C.; Zapata, M.G.; Guerrero, J.M.; Bellalta, B. Reputation-based joint scheduling of households appliances and storage in a microgrid with a shared battery. Energy Build. 2017, 138, 228–239. [Google Scholar] [CrossRef]
- Van Der Stelt, S.; AlSkaif, T.; Van Sark, W. Techno-economic analysis of household and community energy storage for residential prosumers with smart appliances. Appl. Energy 2018, 209, 266–276. [Google Scholar] [CrossRef]
- Mehrtash, M.; Capitanescu, F.; Heiselberg, P.K.; Gibon, T.; Bertrand, A. An enhanced optimal PV and battery sizing model for zero energy buildings considering environmental impacts. IEEE Trans. Ind. Appl. 2020, 56, 6846–6856. [Google Scholar] [CrossRef]
- Zhao, N.; Gu, W. Low-carbon planning and optimization of the integrated energy system considering lifetime carbon emissions. J. Build. Engg. 2024, 82, 108178. [Google Scholar] [CrossRef]
- Zhu, X.L.; Ding, S.; Zhu, W.L. An energy optimization model of iron and steel supply chain using ε-constraint method and interval linear programming approach. J. Ind. Eng. Eng. Manag. 2016, 30, 243–250. [Google Scholar]
- GUROBI. Gurobi Optimizer Reference Manual (Version 9.5); Gurobi Optimization, LLC: Beaverton, OR, USA, 2023. [Google Scholar]

| Whether to Consider Power Storage | Whether the Power Storage Is Shared | Whether to Consider Heat Storage | Whether the Heat Storage Is Shared | |
|---|---|---|---|---|
| Scenario 1 | √ | √ | √ | √ |
| Scenario 2 | √ | √ | √ | × |
| Scenario 3 | √ | × | √ | × |
| Scenario 4 | √ | √ | × | × |
| Scenario 5 | √ | × | × | × |
| Building | 1 | 2 | 3 |
|---|---|---|---|
| power storage/kWh | 1270 | ||
| heat storage/kWh | 2500 | ||
| clean energy/kW | 5397 | 3100 | 0 |
| SOFC/kW | 375 | 0 | 450 |
| heat pump/kW | 0 | 844 | 30 |
| electric refrigerator/kW | 533 | 227 | 138 |
| absorption refrigerator/kW | 275 | 0 | 22 |
| Building | 1 | 2 | 3 |
|---|---|---|---|
| power storage/kWh | 2500 | ||
| heat storage/kWh | 909 | ||
| clean energy/kW | 6166 | 3750 | 0 |
| SOFC/kW | 450 | 0 | 0 |
| heat pump/kW | 853 | 1103 | 882 |
| electric refrigerator/kW | 534 | 227 | 139 |
| absorption refrigerator/kW | 361 | 0 | 0 |
| Building | 1 | 2 | 3 |
|---|---|---|---|
| power storage/kWh | 1270 | ||
| heat storage/kWh | 2500 | ||
| clean energy/kW | 5397 | 3100 | 0 |
| SOFC/kW | 375 | 0 | 450 |
| heat pump/kW | 0 | 357 | 516 |
| electric refrigerator/kW | 533 | 227 | 138 |
| absorption refrigerator/kW | 275 | 0 | 22 |
| Building | 1 | 2 | 3 |
|---|---|---|---|
| power storage/kWh | 2500 | ||
| heat storage/kWh | 1051 | ||
| clean energy/kW | 6179 | 3750 | 0 |
| SOFC/kW | 428 | 0 | 0 |
| heat pump/kW | 853 | 804 | 89 |
| electric refrigerator/kW | 533 | 227 | 138 |
| absorption refrigerator/kW | 343 | 0 | 0 |
| Scenario 2 | Scenario 3 | Scenario 4 | Scenario 5 | |||||||||
|---|---|---|---|---|---|---|---|---|---|---|---|---|
| Building | 1 | 2 | 3 | 1 | 2 | 3 | 1 | 2 | 3 | 1 | 2 | 3 |
| power storage/kWh | 660 | 0 | 1018 | 0 | 2302 | 5000 | 1948 | 0 | ||||
| heat storage/kWh | 2500 | 2500 | 1885 | 2500 | 2500 | 1886 | / | / | ||||
| clean energy/kW | 4553 | 3750 | 509 | 5008 | 2747 | 1000 | 5431 | 3731 | 0 | 6103 | 3262 | 1000 |
| SOFC/kW | 375 | 0 | 450 | 425 | 0 | 240 | 434 | 0 | 450 | 438 | 0 | 245 |
| heat pump/kW | 338 | 410 | 0 | 374 | 345 | 37 | 405 | 513 | 83 | 362 | 513 | 165 |
| electric refrigerator/kW | 518 | 227 | 102 | 533 | 227 | 100 | 533 | 227 | 133 | 533 | 227 | 138 |
| absorption refrigerator/kW | 80 | 0 | 350 | 275 | 0 | 192 | 0 | 0 | 75 | 0 | 0 | 75 |
Disclaimer/Publisher’s Note: The statements, opinions and data contained in all publications are solely those of the individual author(s) and contributor(s) and not of MDPI and/or the editor(s). MDPI and/or the editor(s) disclaim responsibility for any injury to people or property resulting from any ideas, methods, instructions or products referred to in the content. |
© 2024 by the authors. Licensee MDPI, Basel, Switzerland. This article is an open access article distributed under the terms and conditions of the Creative Commons Attribution (CC BY) license (https://creativecommons.org/licenses/by/4.0/).
Share and Cite
Liu, J.; Nie, J.; Cui, X.; Liu, P.; Tong, P.; Liu, X. Optimal Energy Configuration of Integrated Energy Community Considering Carbon Emission. Sustainability 2024, 16, 728. https://doi.org/10.3390/su16020728
Liu J, Nie J, Cui X, Liu P, Tong P, Liu X. Optimal Energy Configuration of Integrated Energy Community Considering Carbon Emission. Sustainability. 2024; 16(2):728. https://doi.org/10.3390/su16020728
Chicago/Turabian StyleLiu, Jiangping, Jianghong Nie, Xue Cui, Peng Liu, Pingzheng Tong, and Xue Liu. 2024. "Optimal Energy Configuration of Integrated Energy Community Considering Carbon Emission" Sustainability 16, no. 2: 728. https://doi.org/10.3390/su16020728
APA StyleLiu, J., Nie, J., Cui, X., Liu, P., Tong, P., & Liu, X. (2024). Optimal Energy Configuration of Integrated Energy Community Considering Carbon Emission. Sustainability, 16(2), 728. https://doi.org/10.3390/su16020728