
A Review of the Energy Policies of the BRICS Countries: The Possibility of Adopting a Just Energy Transition for South Africa


Abstract
1. Introduction
2. India
2.1. Individual Indicators of India’s Macroeconomics
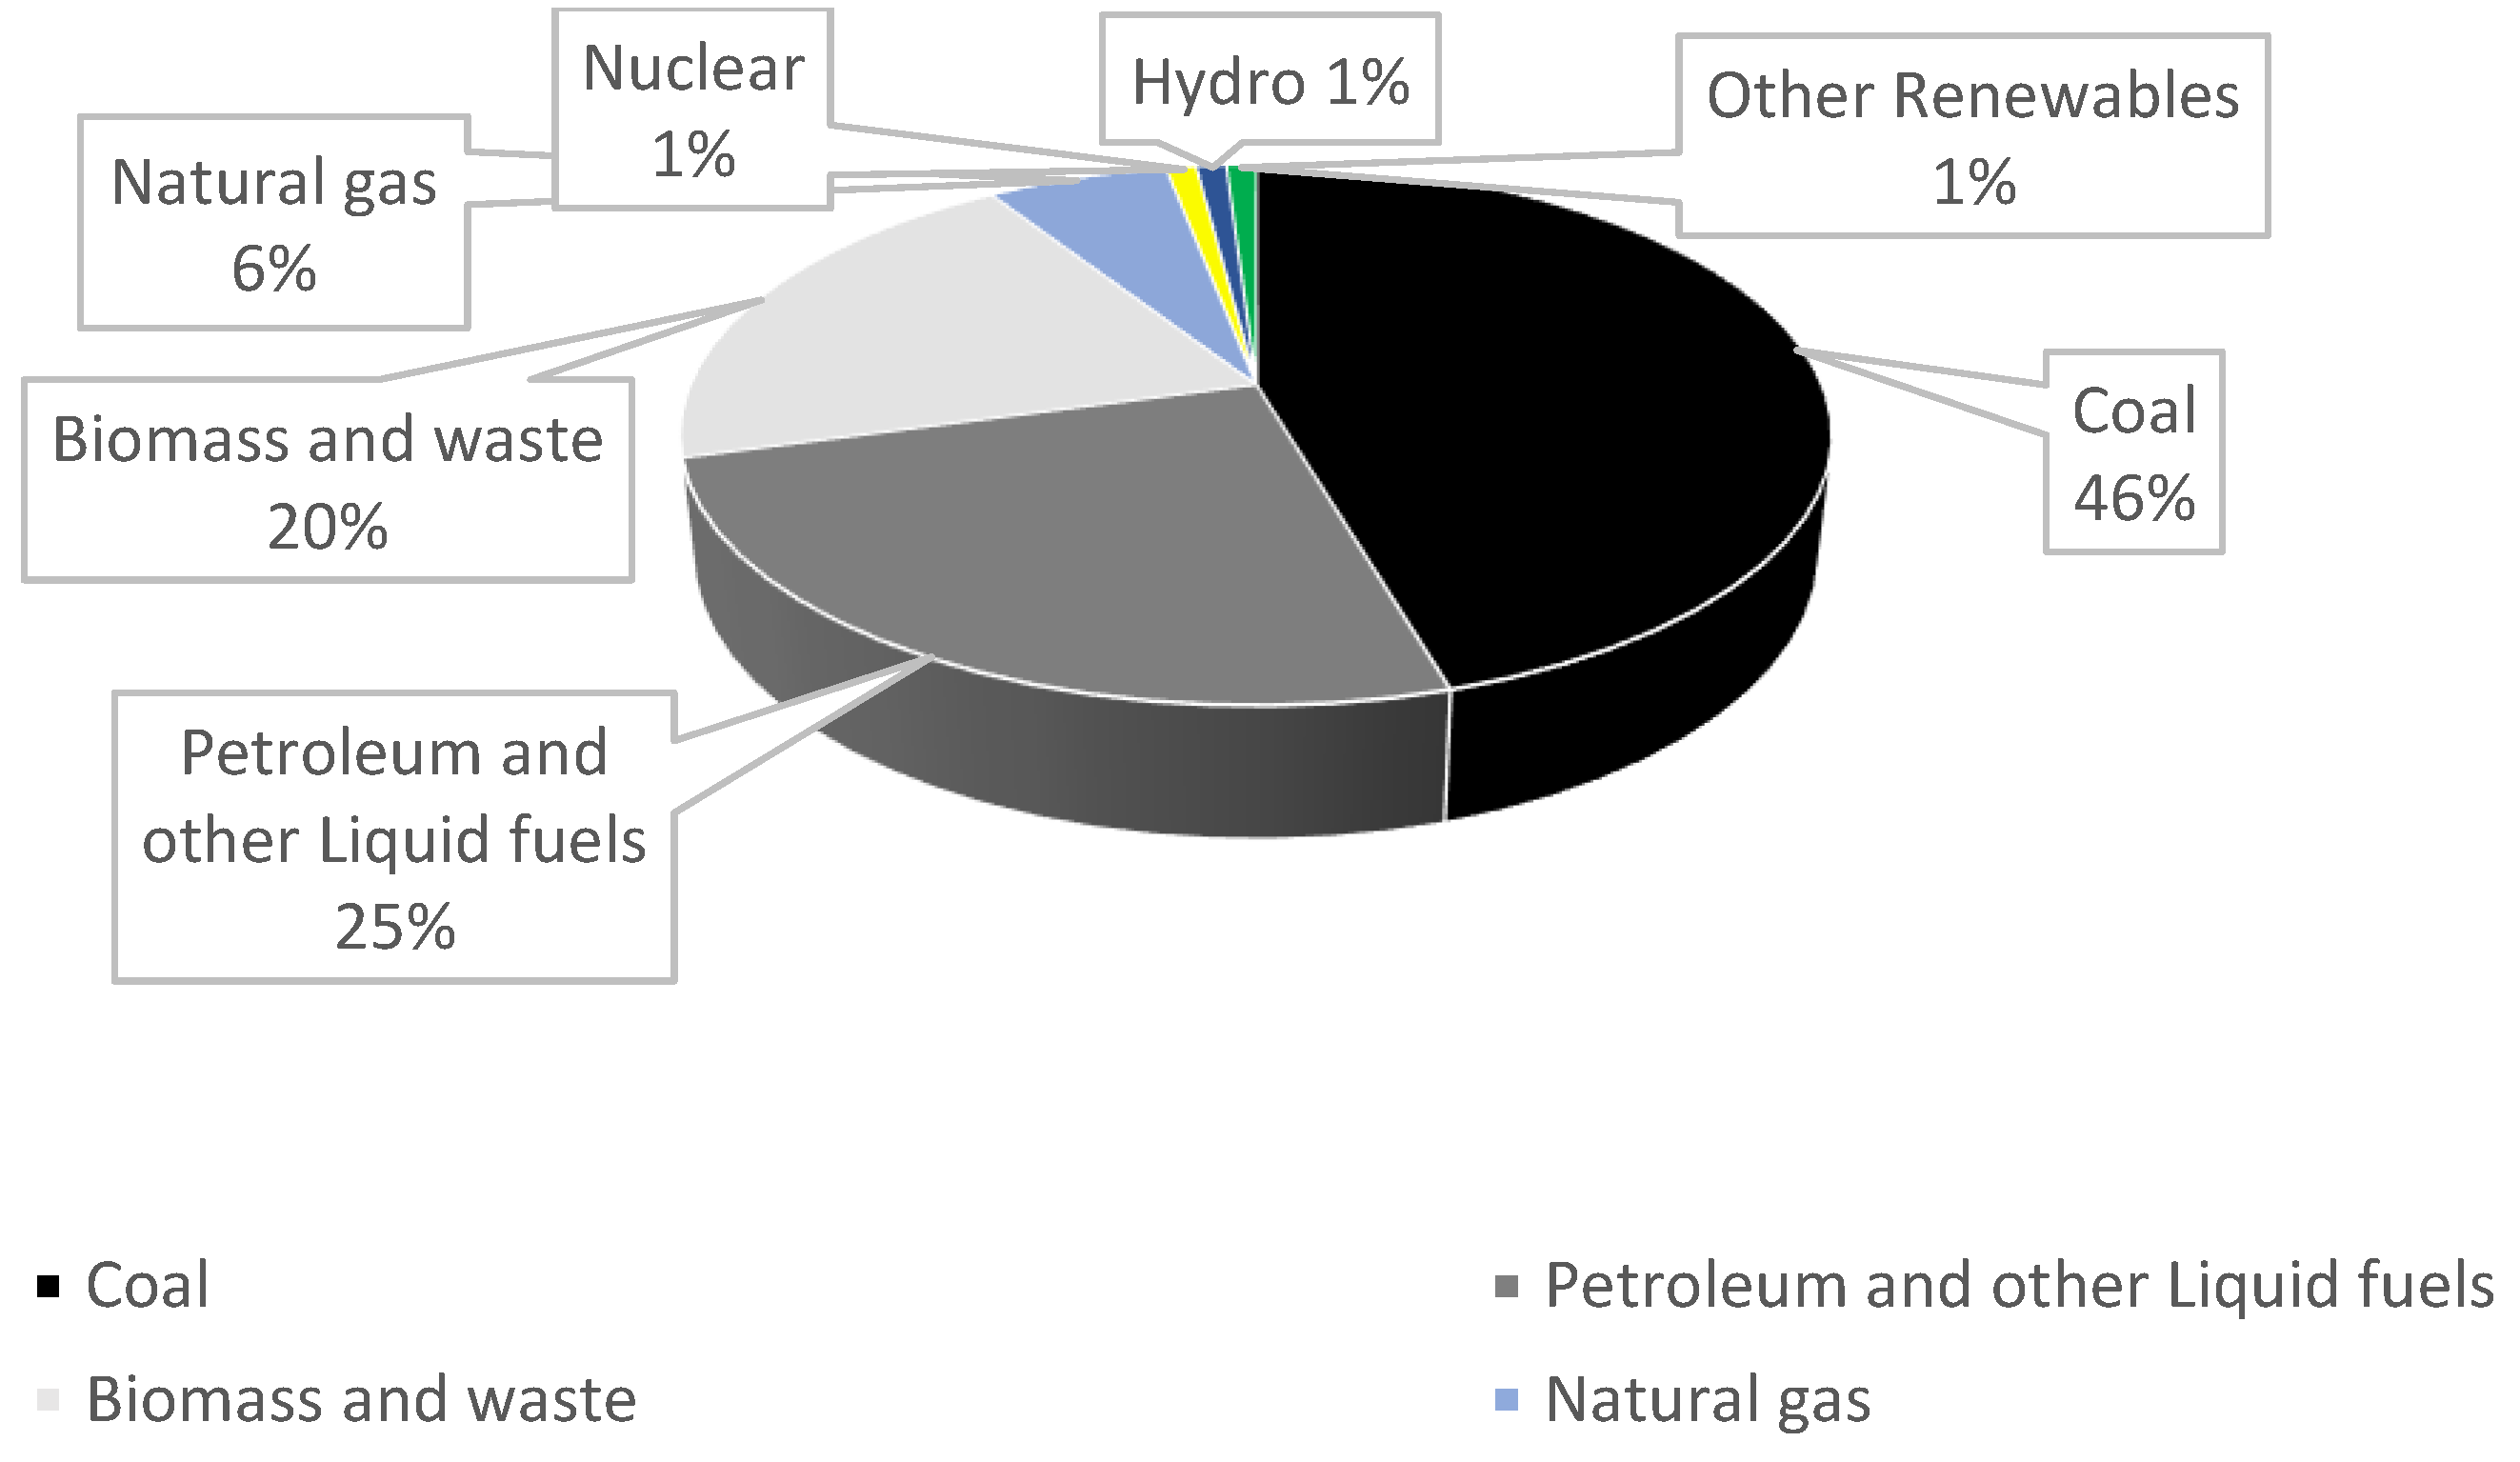
2.2. India’s Energy Policy
- A target of 500 GW non-fossil electricity capacity by 2030;
- A renewable energy contribution of 50% of electricity demands by 2030;
- A forecasted decrease in CO2 emissions by one billion tonnes from present to 2030;
- A decline by 45% of the CO2 intensity of the economy by 2030, referenced with 2005 emissions;
- A zero-carbonisation goal by 2070.
3. China
3.1. Individual Indicators of China’s Macroeconomics
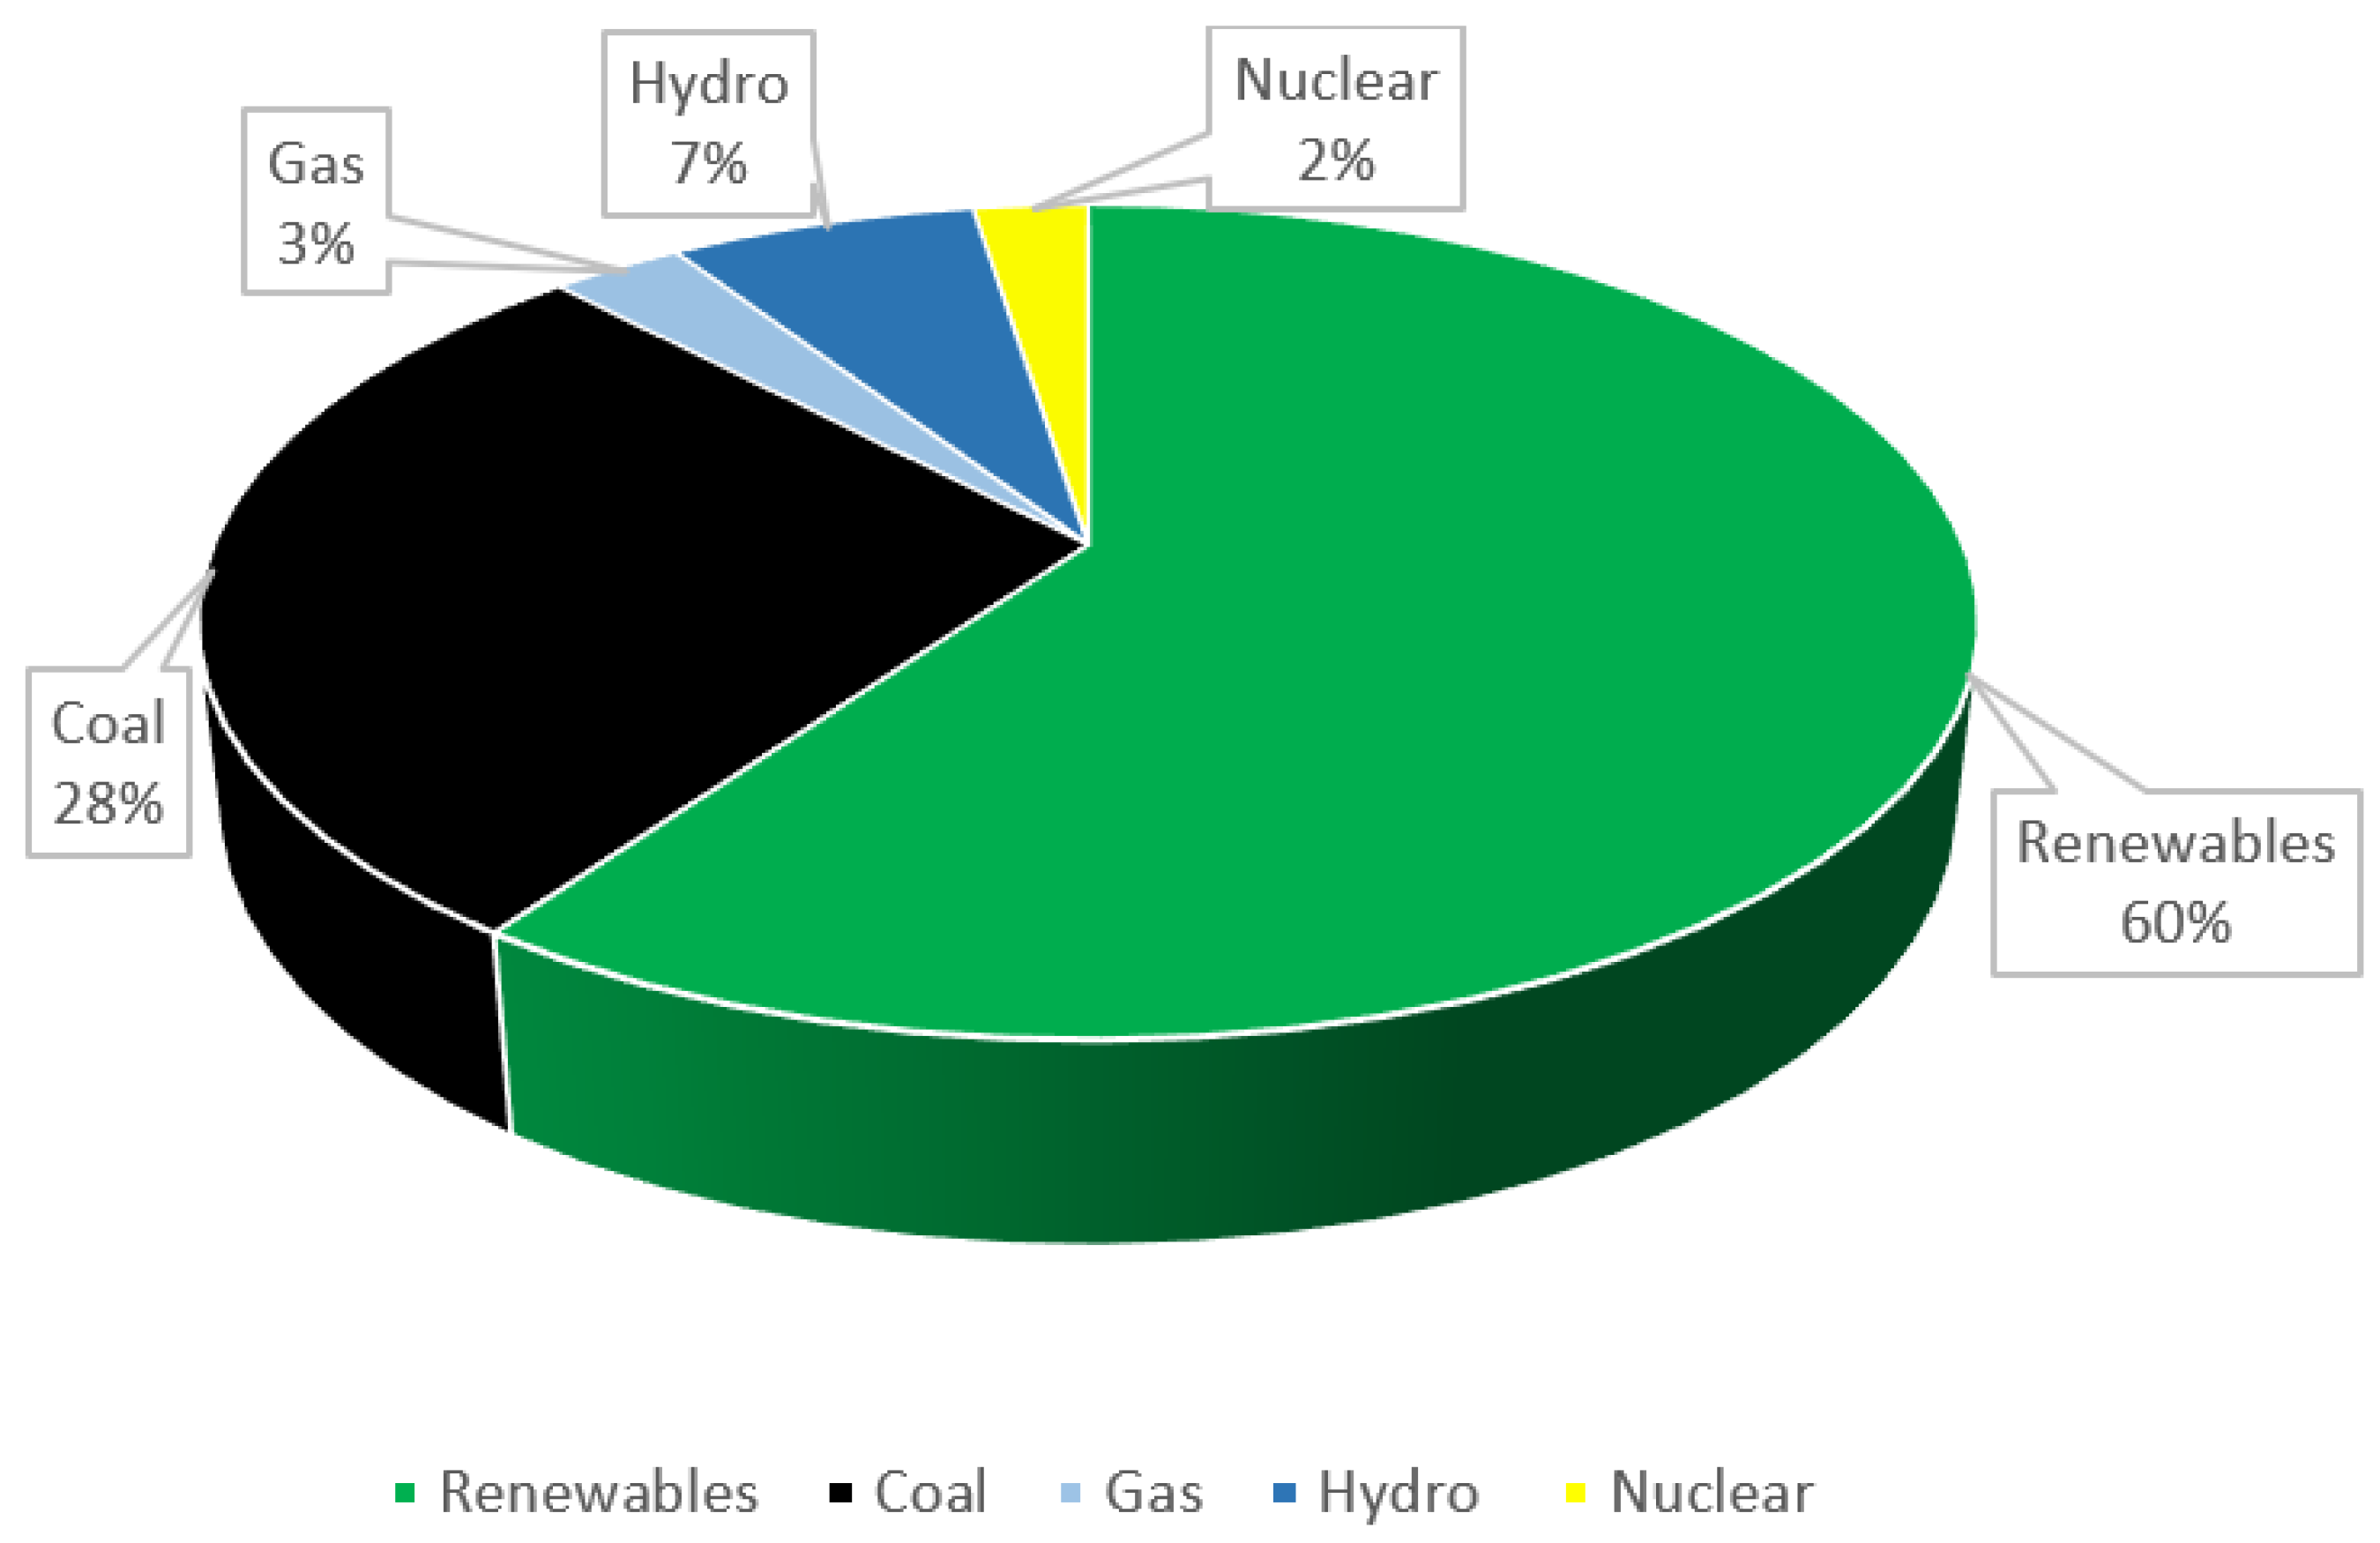
3.2. China’s Energy Policy
4. Russia
4.1. Individual Indicators of Russia’s Macroeconomics
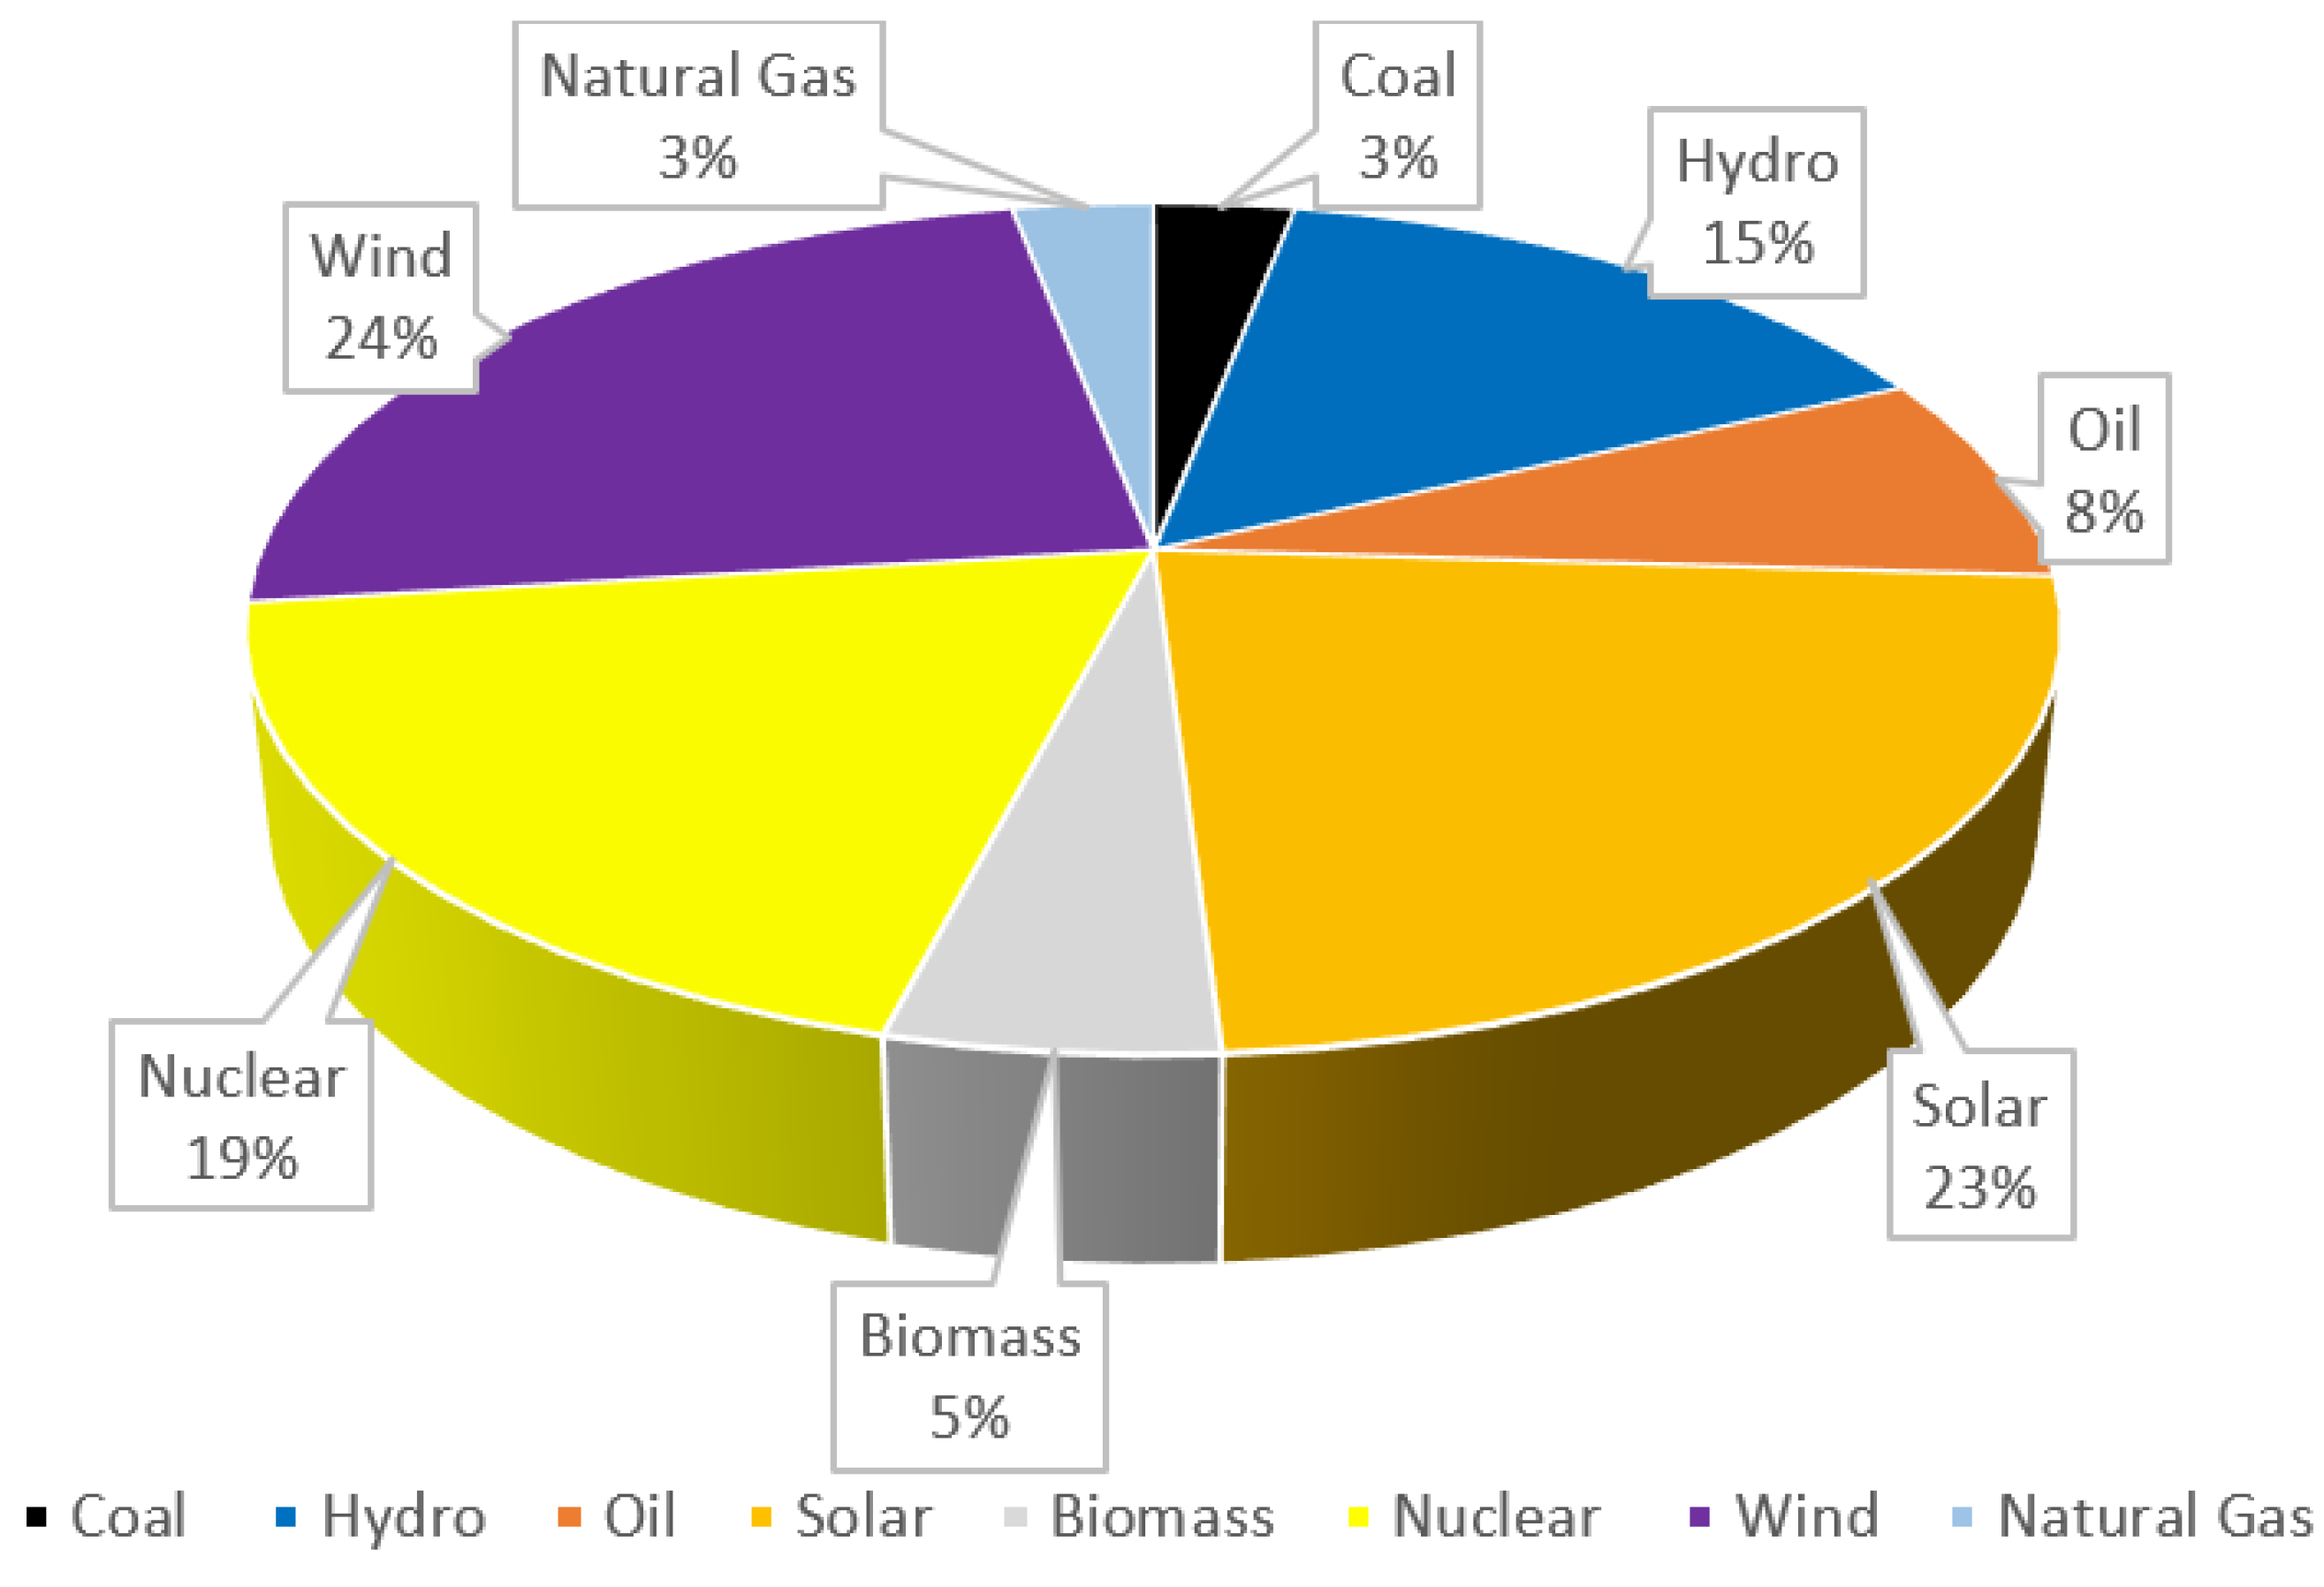
4.2. Russia’s Energy Policy
5. Brazil
5.1. Individual Indicators of Brazil’s Macroeconomics
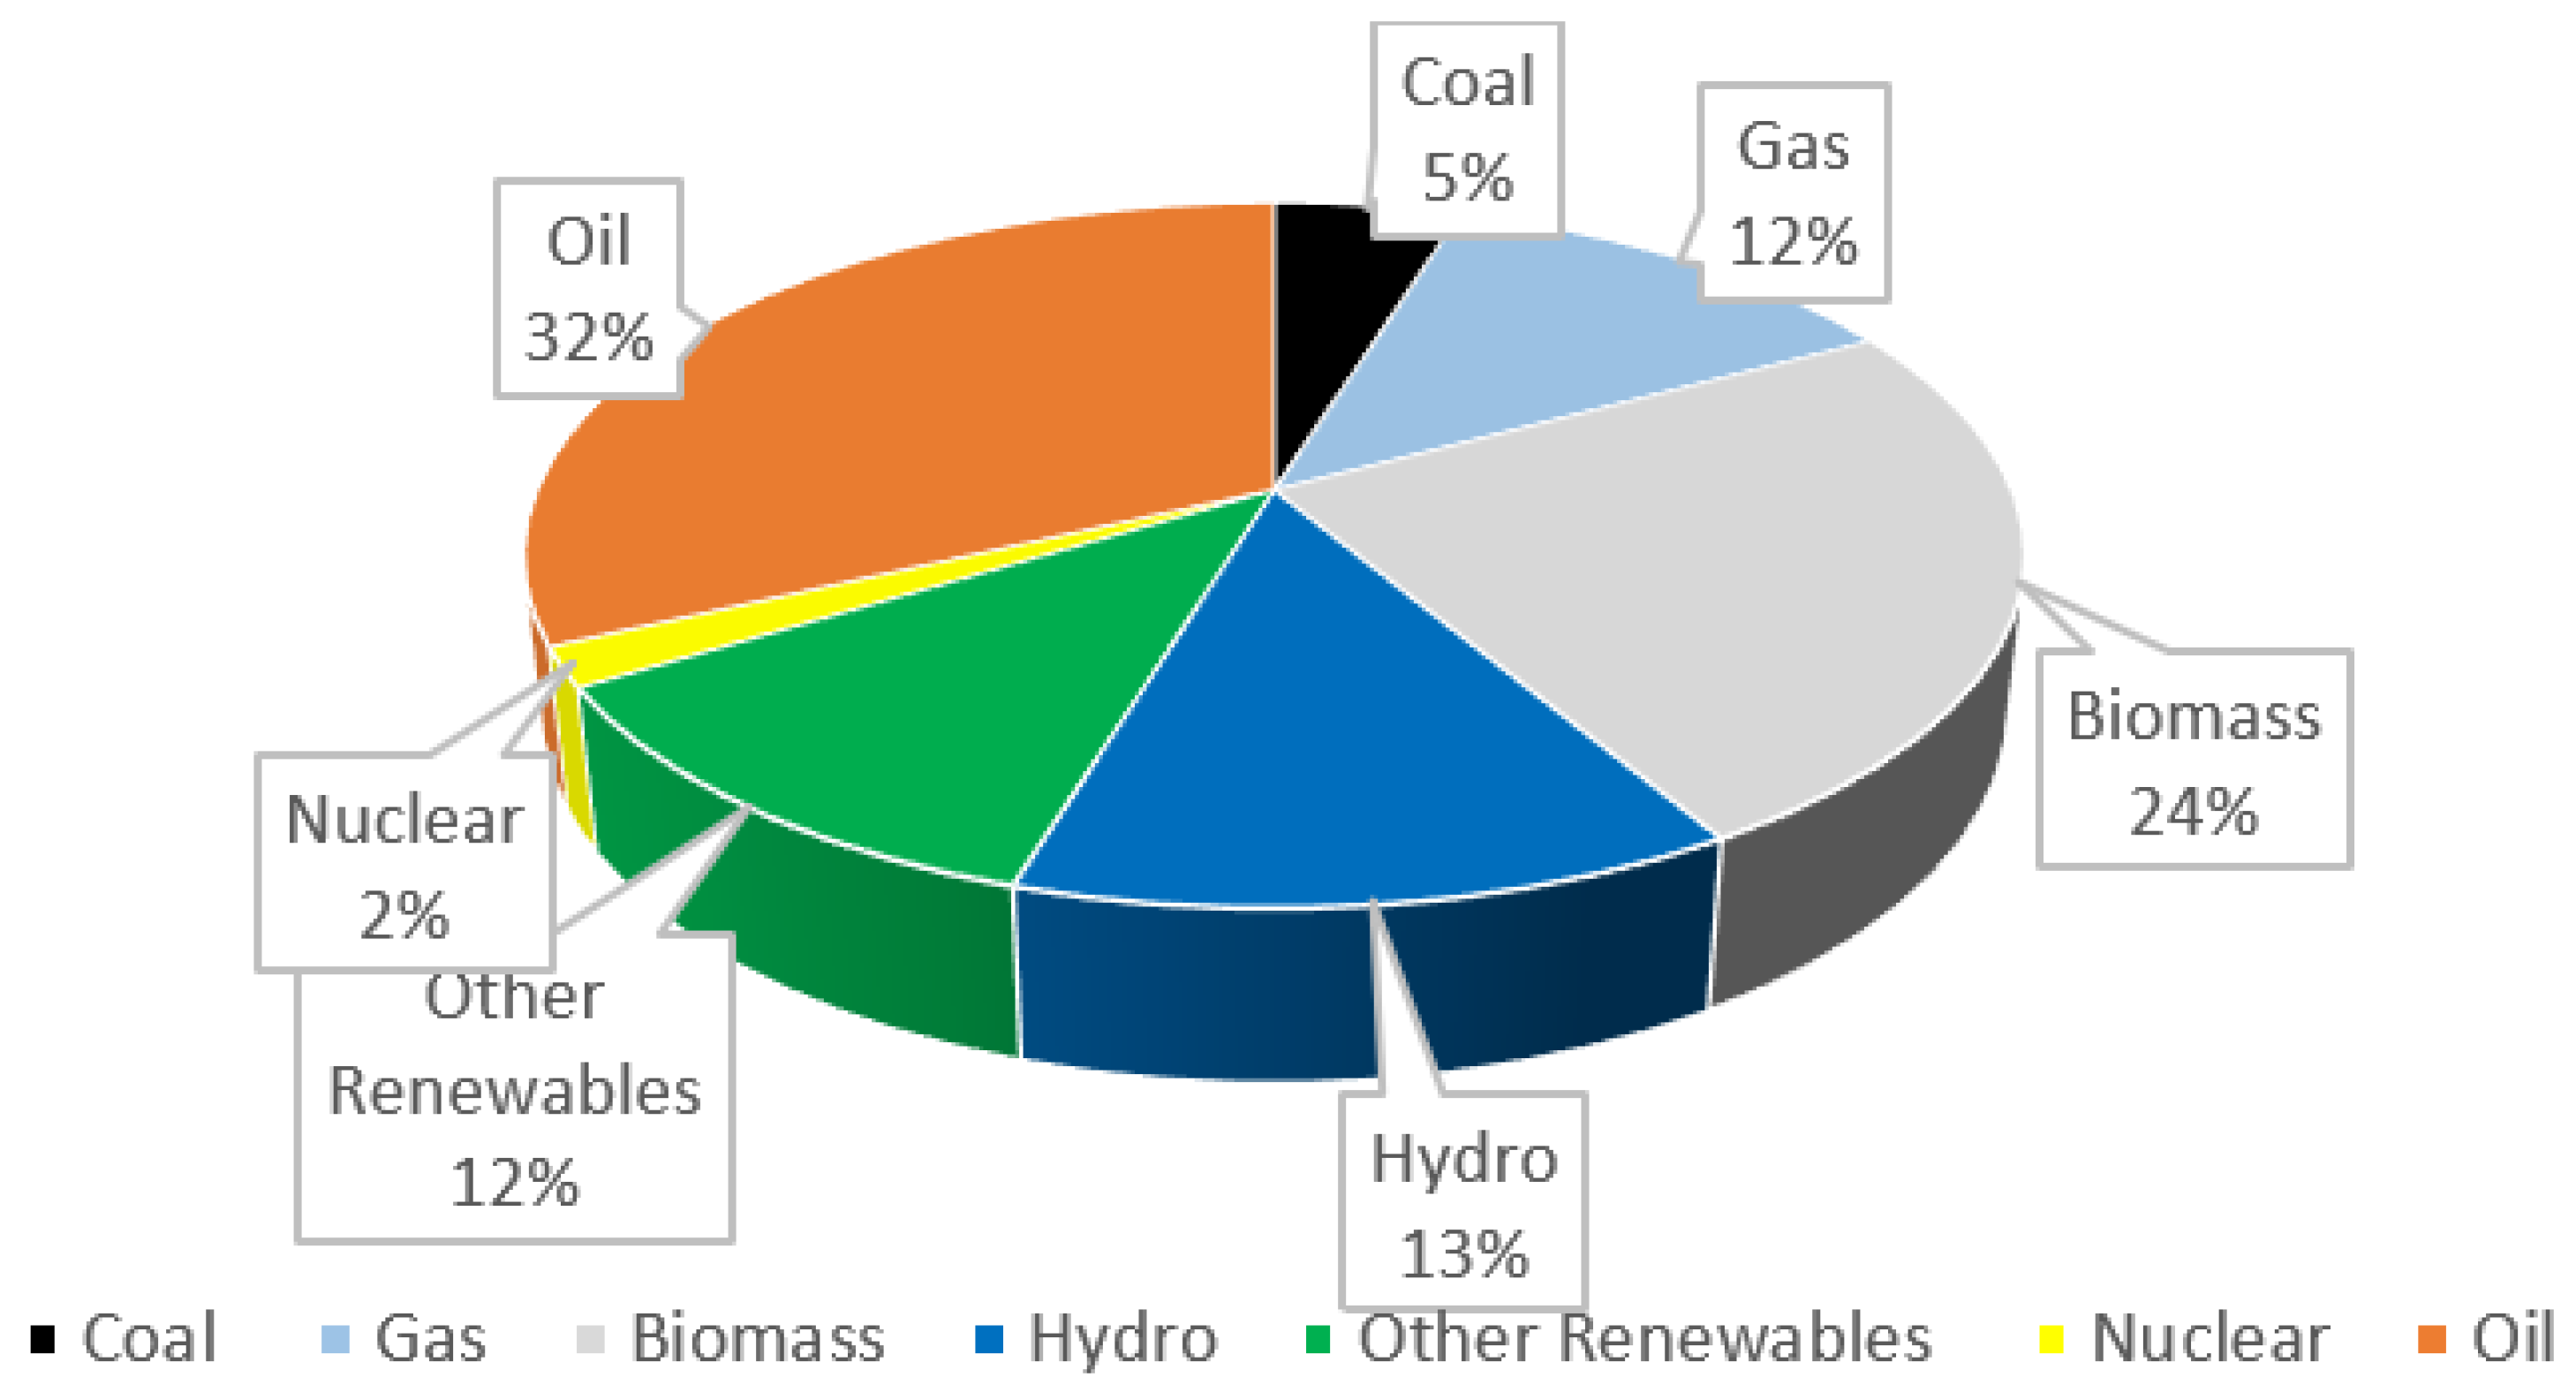
5.2. Brazil’s Energy Policy
6. History of Energy Policy in SA
6.1. South Africa’s Social and Economic Context in Comparison with the Rest of the BRICS Partners
6.2. Individual Indicators of South Africa’s Macroeconomics
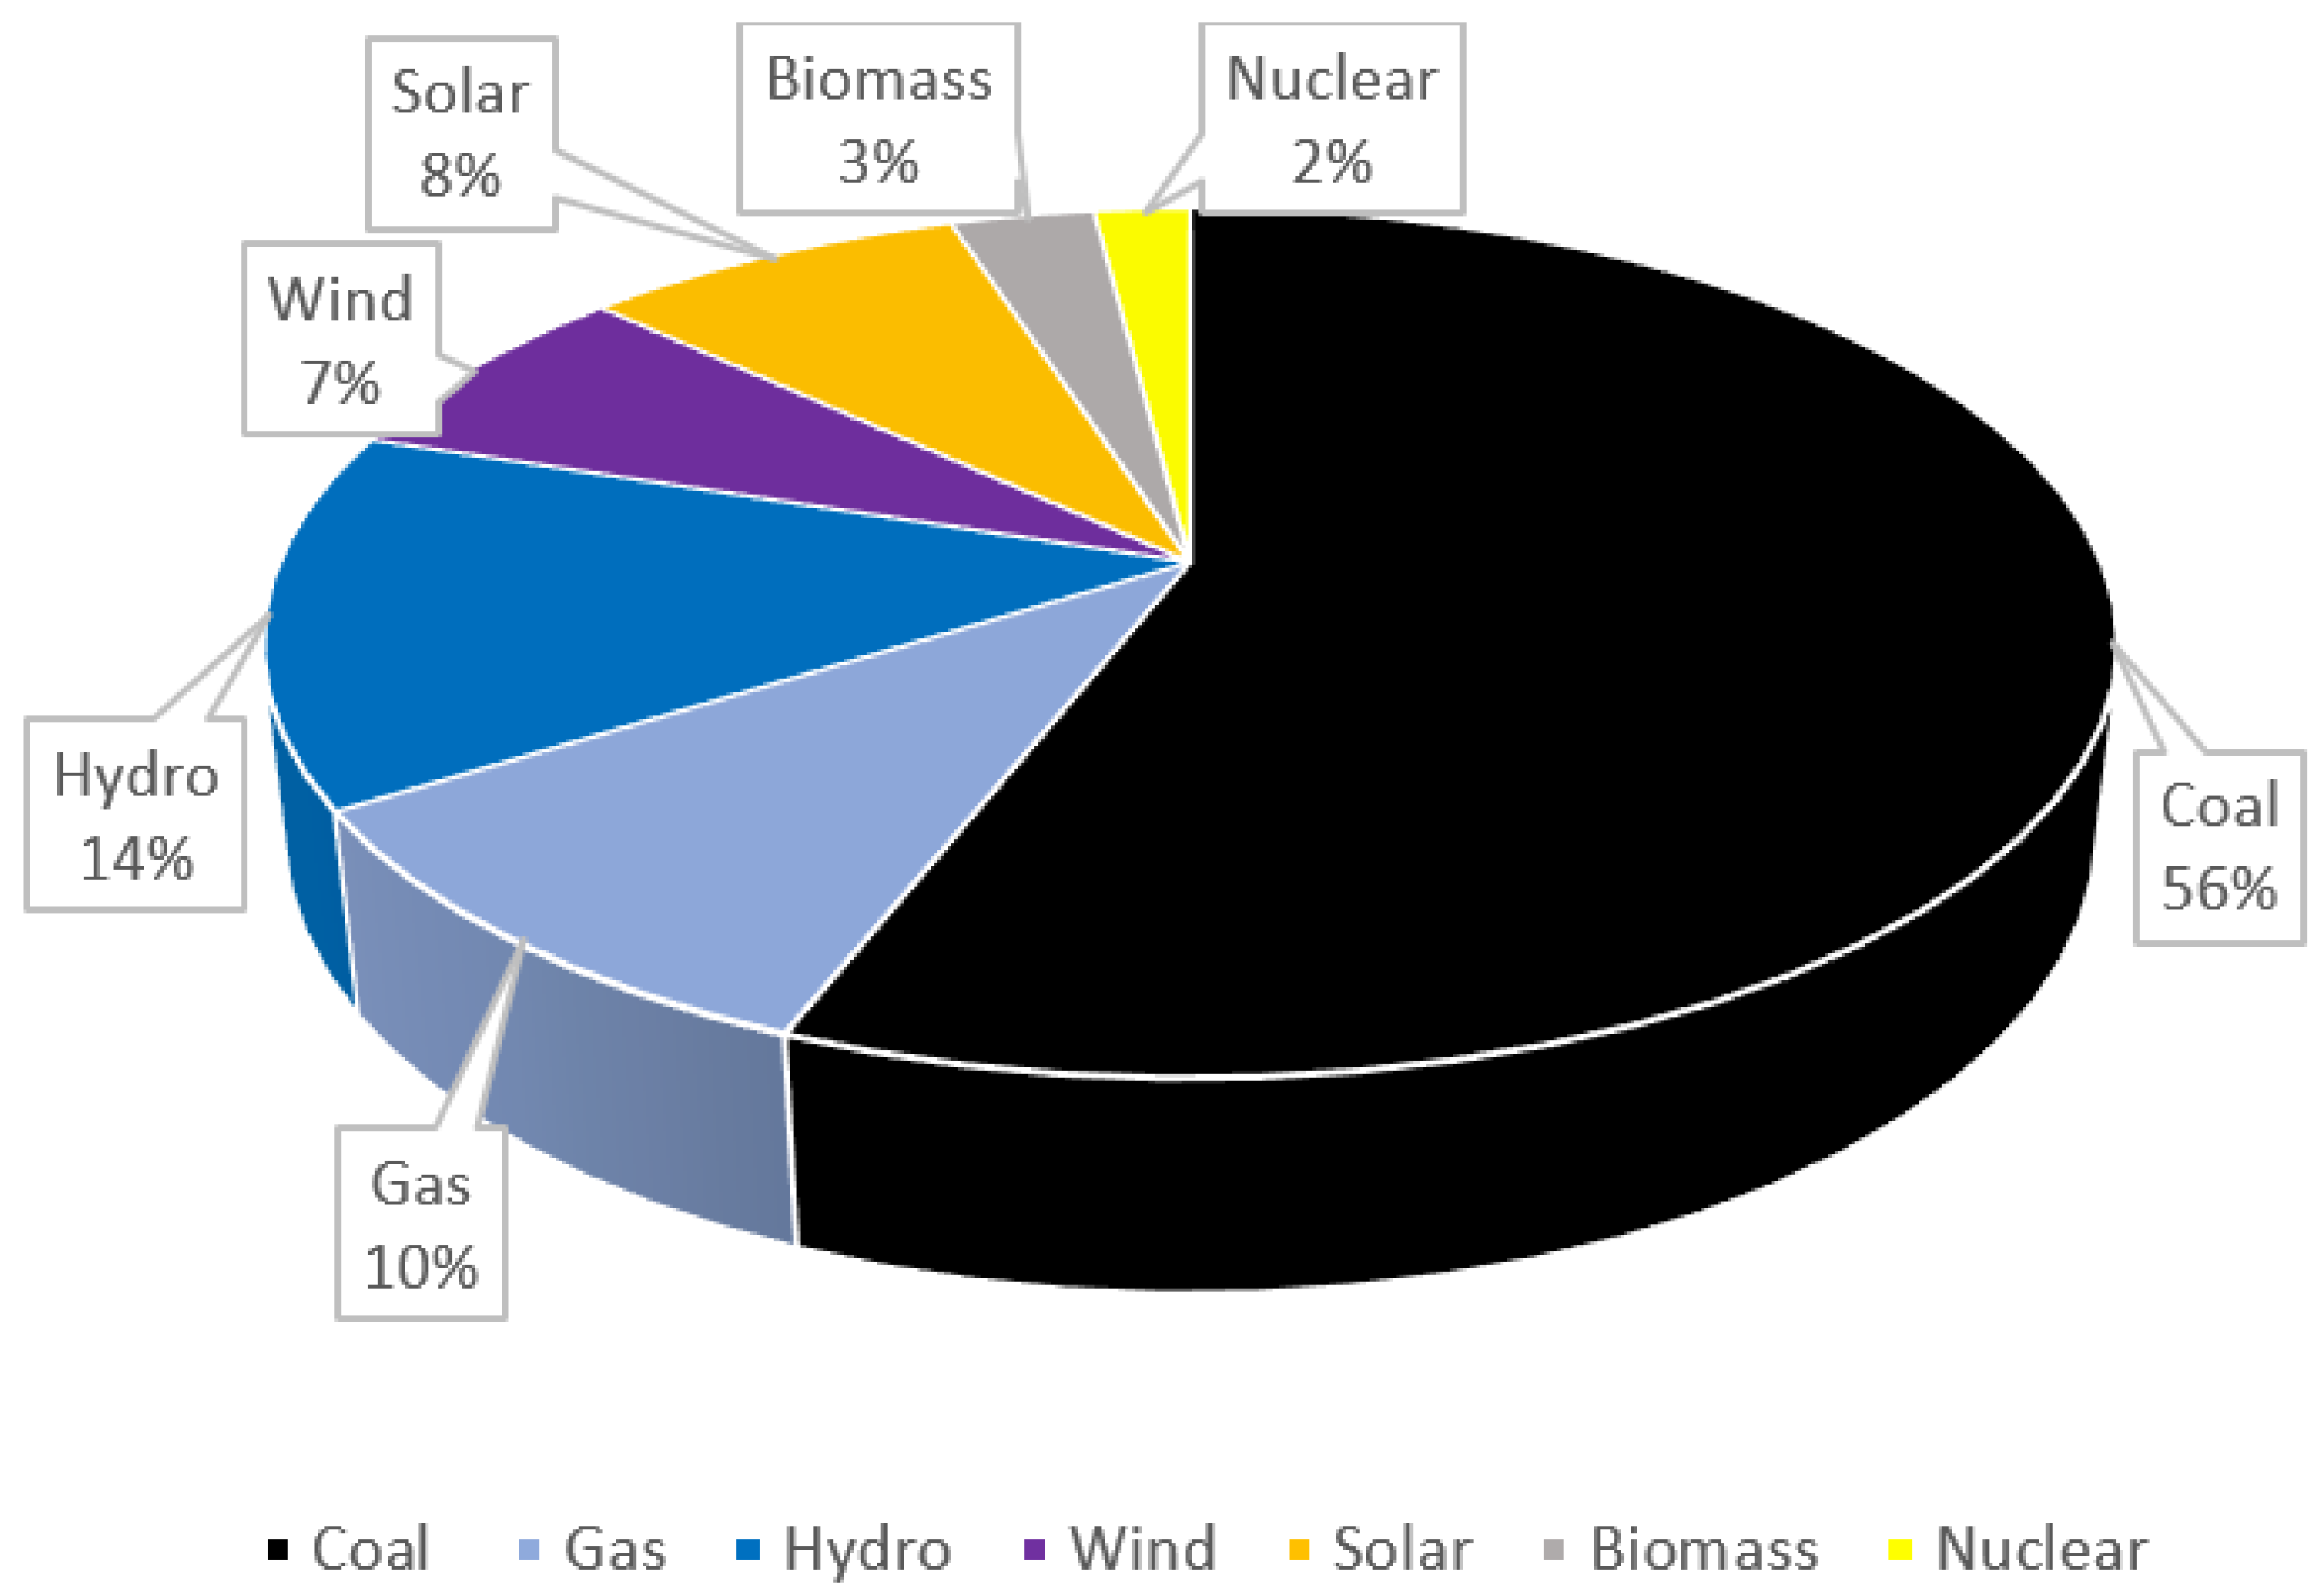
6.3. Current Energy Mix in South Africa
6.4. Insights into the Just Energy Transition in South Africa
- “In South Africa, a just transition is core to shifting our development pathway to increased sustainability, fostering climate resilient and low GHG emissions development, while providing a better life for all.”
- “A just transition means leaving no-one behind. It requires procedural equity to lead to equitable outcomes. A just transition is at the core of implementing climate action in South Africa, as detailed in both the mitigation and adaptation goals presented below. As South Africa indicated at the UN Secretary General’s Climate Action Summit in 2019, as part of ensuring a just transition we will need to put measures in place that plan for workforce reskilling and job absorption, social protection and livelihood creation, incentivising new green sectors of our economy, diversifying coal dependent regional economies, and developing labour and social plans as and when ageing coal-fired power plants and associated coal production infrastructure are decommissioned. Similar measures will be necessary to adapt to the impacts of climate change.”
- “The just transition will also need international cooperation and requires solidary and concrete support. Ensuring that no one is left behind as we move from a high GHG emission, low employment energy development pathway to a low emission, climate-resilient and job-rich pathway, is central to our national work on development and climate change.”
Just Energy Transition Partnership (JETP)
7. Conclusions and Prospects for Further Research
Prospects for Future Research
Author Contributions
Funding
Institutional Review Board Statement
Informed Consent Statement
Conflicts of Interest
References
- Morazan, P.; Knoke, I.; Knoblauch, D.; Schafer, T. The Role of BRICS in the Developing World. 2012. Available online: https://www.europarl.europa.eu/thinktank/en/document.html?reference=EXPO-DEVE_ET(2012)433779 (accessed on 16 January 2023).
- JSP. BRICS. 2018. Available online: https://www.statssa.gov.za/wp-content/uploads/2018/11/BRICS-JSP-2018.pdf (accessed on 18 January 2023).
- IMF. 2011a:8. New Growth Drivers for Low-Income Countries: The Role of BRICS. Available online: https://www.imf.org/external/np/pp/eng/2011/011211.pdf (accessed on 30 January 2023).
- World Economic Forum (WEF). 2021. Available online: https://www.weforum.org/reports/annual-report-2021-2022/ (accessed on 14 February 2023).
- Macroeconomic Outlook Report: India. 2023. Available online: https://www.globaldata.com/store/report/india-pestle-macroeconomic-analysis-2/ (accessed on 10 June 2023).
- IEA. India Energy Outlook. 2021. Available online: https://www.iea.org/reports/india-energy-outlook-2021 (accessed on 30 January 2023).
- COP26. The Glasgow Climate Pact, UN Climate Change Conference, United Kingdom. 2021. Available online: https://www.efaidnbmnnnibpcajpcglclefindmkaj/https://ukcop26.org/wp-content/uploads/2021/11/COP26-Presidency-Outcomes-The-Climate-Pact.pdf (accessed on 30 January 2023).
- NEP-India. National Electricity Plan of India. 2022. Available online: https://powermin.gov.in/en/content/national-electricity-plan-0 (accessed on 12 March 2023).
- Kaur, R.; Pandey, P. Air Pollution, Climate Change, and Human Health in Indian Cities. 2021. Available online: https://www.frontiersin.org/articles/10.3389/frsc.2021.705131/full (accessed on 14 April 2023).
- Agarwal, S.; Mani, S.; Aggarwal, D.; Hareesh, C.; Ganesan, K.; Jain, A. Awareness and Adoption of Energy Efficiency in Indian Homes. New Delhi: Council on Energy, Environment and Water. 2020. Available online: https://www.ceew.in (accessed on 14 April 2023).
- Mani, S.; Agarwal, S.; Ganesan, K.; Jain, A. State of Electricity Access in India: Insights from the India Residential Energy Survey (IRES) 2020. New Delhi: Council on Energy, Environment and Water. 2020. Available online: https://www.ceew.in/publications/state-electricity-access-india (accessed on 23 April 2023).
- Aklin, M.; Harish, S.P.; Urpelainen, J. 2015. Available online: Quantifying Slum Electrification in India and Explaining Local Variation. Available online: http://eprints.gla.ac.uk/115751/ (accessed on 7 March 2023).
- Chandran, R. Forced to Walk Miles, India Water Crisis Hits Rural Women Hardest. 2018. Available online: https://www.reuters.com/article/us-india-water-women-idUSKBN1K318B (accessed on 29 April 2023).
- Macroeconomic Outlook Report: China. 2023. Available online: https://www.globaldata.com/data-insights/macroeconomic/china-macroeconomic-country-outlook/ (accessed on 6 May 2023).
- IEA. An Energy Sector Roadmap to Carbon Neutrality in China. 2021. Available online: https://www.iea.org/reports/an-energy-sector-roadmap-to-carbon-neutrality-in-china (accessed on 23 January 2023).
- Chang, S.; Zhuo, J.; Meng, S.; Qin, S. Clean Coal Technologies in China: Current Status and Future Perspectives. 2016. Available online: https://www.sciencedirect.com/science/article/pii/S2095809917300814?via%3Dihub (accessed on 25 January 2023).
- Chen, Y. Comparing North-South Technology Transfer and South-South Technology Transfer: The Technology Transfer Impact of Ethiopian Wind Farms. Energy Policy 2018, 116, 1–9. [Google Scholar] [CrossRef]
- Hasanbeigi, A.; Becqué, R.; Springer, C. Curbing Carbon from Consumption: The Role of Green Public Procurement, Global Efficiency Intelligence. 2019. Available online: https://www.climateworks.org/wp-content/uploads/2019/09/Green-Public-Procurement-Final-28Aug2019.pdf (accessed on 6 July 2023).
- Korsunskaya, D.; Marrow, A. Russia Raises 2023 GDP Growth Forecast, Longer-Term Outlook Worsens. 2023. Available online: https://www.reuters.com/markets/europe/russian-economy-ministry-improves-2023-gdp-growth-forecast-2023-04-14/ (accessed on 4 May 2023).
- Henderson, J.; Mitrova, T. Natural Gas Pricing in Russia Between Regulation and Markets. SKOLKOVO Centre, Russia. 2017. Available online: https://energy.skolkovo.ru/downloads/documents/SEneC/research02.pdf (accessed on 30 January 2023).
- ERI RAS. Global and Russian Energy Outlook up to 2040. 2019. Available online: https://www.eriras.ru/files/forecast_2016.pdf (accessed on 18 February 2023).
- Mitrova, T. Energy Transition in Russia, Moscow, Russia. Energy Transit. 2019, 3, 73–80. [Google Scholar] [CrossRef]
- Macroeconomic Outlook Report: Brazil. 2023. Available online: https://www.globaldata.com/data-insights/macroeconomic/brazil-macroeconomic-country-outlook/ (accessed on 30 June 2023).
- IEA. Coal Analysis and Forecasts. 2018. Available online: https://www.iea.org/coal2018 (accessed on 6 January 2023).
- Staffell, I.; Jansen, M.; Chase, A.; Cotton, E.; Lewis, C. Energy Revolution: Global Outlook. Selby, Drax. 2018. Available online: https://scholar.google.com/scholar?q=related:4ocQEJoNd7AJ (accessed on 15 February 2023).
- Grushevenko, E.; Mitrova, T.; Malov, A. The Future of Russian Oil Production: Life under Sanctions SKOLKOVO Energy Centre. 2018. Available online: https://energy.skolkovo.ru/downloads/documents/SEneC/research04-en.pdf (accessed on 26 February 2023).
- Ratner, S.; Berezin, A.; Gomonov, K.; Serletis, A.; Sergi, B.S. What is Stopping Energy Efficiency in Russia? Exploring the Confluence of Knowledge, Negligence, and Other Social Barriers in the Krasnodar Region. Energy Res. Soc. Sci. 2022, 85, 102412. [Google Scholar] [CrossRef]
- Wills, W.; Westin, F.F. Energy Transition in Brazil. 2019. Available online: https://www.climate-transparency.org/wp-content/uploads/2019/04/Brazilian-Policy-Paper-En.pdf (accessed on 6 April 2023).
- Karpavicius, L.M. Brazil Sources 45% of Its Energy from Renewables, Brazil. 2021. Available online: https://www.climatescorecard.org/2021/01/brazil-sources-45-of-its-energy-from-renewables (accessed on 8 April 2023).
- Sewalk, S. Brazil’s Energy Policy and Regulations, Brazil. 2015. Available online: https://www.jstor.org/stable/26195861 (accessed on 8 April 2023).
- Ambiente Energia. MME Authorizes the Installation of 25 Clean Energy Plants to Generate 883 MW, Brazil. 2018. Available online: https://www.ambienteenergia.com.br/index.php/2018/09/governo-autoriza-instalacao-de-25-usinas-geradoras-de-energia-limpa/34721#.W5r1BOhKiUk (accessed on 28 November 2022).
- ABDI. Mapping of the Production Chain of the Wind Industry in Brazil. 2014. Available online: https://www.investimentos.mdic.gov.br/public/arquivo/arq1410360044.pdf (accessed on 27 May 2023).
- ILO. 2015. Available online: https://www.ilo.org/wcmsp5/groups/public/---ed_dialogue/---actrav/documents/publication/wcms_826060.pdf (accessed on 12 January 2023).
- Agência Brazil. Increase Percentage of Biodiesel Takes Effect, Brazil. 2018. Available online: https://agenciabrasil.ebc.com.br/economia/noticia/2018-03/aumento-para-10-do-percentual-de-biodiesel-no-diesel-entra-em-vigor (accessed on 4 May 2023).
- Macroeconomic Outlook Report: South Africa. 2023. Available online: https://www.globaldata.com/data-insights/macroeconomic/south+africa-macroeconomic-country-outlook/ (accessed on 7 July 2023).
- ABEEólica. Wind Energy is Expected to Generate Jobs in Brazil by 2026. Brazil. 2018. Available online: https://abeeolica.org.br/noticias/estudo-abdi-ventos-que-trazem-empregos (accessed on 19 June 2023).
- Lawrence, A. South Africa’s Energy Transition; Wits School of Governance, University of the Witwatersrand: Johannesburg, South Africa, 2020. [Google Scholar]
- Malumbazo, N. A New Normal. In Proceedings of the Coal, SANEA Energy Webinar, Virtual Meeting, 6 August 2020. [Google Scholar]
- Central Electricity Authority (CEA). 2022. Available online: https://cercind.gov.in/2022/draft_reg/Sharing-Regulations_Amend-2022/CEA%20COMMENTS.pdf (accessed on 9 January 2023).
- Juodaityte, J. Microalgal Biotechnology for Carbon Capture and Bioenergy Production. In Eskom, Research and Innovation Report; Eskom Documentation Centre: Johannesburg, South Africa, 2011. [Google Scholar]
- Ritchie, H.; Roser, M. CO₂ and Greenhouse Gas Emissions. 2017. Available online: https://ourworldindata.org/co2-and-other-greenhouse-gas-emissions#future-emissions (accessed on 19 February 2023).
- Hirsch, T.; Matthess, M.; Funfgelt, J. Guiding Principles and Lessons Learnt for a Just Energy Transition in the Global South; Friedrich Ebert Stiftung: Berlin, Germany, 2017. [Google Scholar]
- Naidoo, C. Transcending the Interregnum: Exploring How Financial Systems Relate to Sustainability Transition Processes; University of Sussex, Business School: Falmer, UK, 2019; Available online: https://sussex.figshare.com/articles/thesis/Transcending_the_interregnum_exploring_how_financial_systems_relate_to_sustainability_transition_processes/23477003 (accessed on 1 October 2022).
- PCC. Laying the Foundation for a Just Transition Framework for South Africa. 2021. Available online: https://www.climatecommission.org.za (accessed on 19 July 2023).
- Condor, J.; Unatrakarn, D.; Asghari, K.; Wilson, M. Current Status of CCS Initiatives in the Major Emerging Economies. 2011. Available online: https://pdf.sciencedirectassets.com/277910/1-s2.0-S1876610211X00036 (accessed on 7 June 2023).
- Melnikov, Y.; Mitrova, T. A Carbon-Free World: What Is Russia’s Response? Energy Centre, SKOLKOVO Business School: Moscow, Russia, 2019; Available online: https://www.cairn.info/revue-responsabilite-et-environnement-2019-3-page-128.htm (accessed on 22 November 2022).
- Grattan, S. Brazil’s 2021 Climate Emissions. 2022. Available online: https://www.reuters.com/world/americas/brazils-2021-climate-emissions-highest-since-2006-report-says-2022-11-01/ (accessed on 16 February 2023).
- Drummond, C. Understand How Light for All Works, Brazil. 2016. Available online: https://www.cartacapital.com.br/especiais/infraestrutura/entenda-como-funciona-o-luz-para-todos (accessed on 20 March 2023).
- Halsey, R.; Schubert, T.; Maguire, G.; Lukuko, T.; Worthington, R.; McDaid, L. Energy Sector Transformation in South Africa. Project 90 by 2030, Cape Town, South Africa. 2020. Available online: https://www.90by2030.0rg.za (accessed on 3 December 2022).
- Globaldata Country Risk Index (GCRI, 2023). Available online: https://www.globaldata.com/store/report/global-economic-risk-quarterly-analysis/ (accessed on 31 July 2023).
- ILO. Employment and Just Transition to Sustainability in the BRICS Countries. 2022. Available online: https://www.ilo.org/wcmsp5/groups/public/dgreports/dcomm/documents/presentation/wcms_845711.pdf (accessed on 3 May 2023).
- Tian, X.; Sarkis, J.; Geng, Y.; Bleischwitz, R.; Qian, Y.; Xu, L.; Wu, R. Examining the Role of BRICS Countries at the Global Economic and Environmental Resources Nexus Productivity and Yield Even Further. 2020. Available online: https://discovery.ucl.ac.uk/id/eprint/10093573/3/Bleischwitz_Final%20version-revision%20without%20editing%20model-BRICS%20country%202020%281%29.pdf (accessed on 16 November 2022).
- Climate Action Tracker. 2020. Available online: https://climateactiontracker.org/publications/state-of-climate-action-2022/ (accessed on 9 January 2023).
- Das, S.K. A Brief Scanning on Performance of Mahatma Gandhi National Rural Employment Guarantee Act in Assam, India. 2013. Available online: https://www.semanticscholar.org/paper/A-Brief-Scanning-on-Performance-of-Mahatma-Gandhi-Das/aa79bffe1a55018e9c9986ec1b0b62afa8341858 (accessed on 24 March 2023).
- ILO-WSP. World Social Protection Report: Universal Social Protection to Achieve the Sustainable Development Goals. 2017. Available online: https://www.ilo.org/global/publications/books/WCMS_604882/lang--en/index.htm (accessed on 30 March 2023).
- Nationally Determined Contribution of the Russian Federation (NDC-Russian Federation). 2020. Available online: https://unfccc.int/sites/default/files/NDC/2022-06/NDC_RF_eng.pdf (accessed on 15 July 2023).
- UNFCCC. Brazil First NDC (Updated Submission-Letter). 2021. Available online: https://unfccc.int/sites/default/files/NDC/2022-06/Updated%20-%20First%20NDC%20-%20%20FINAL%20-%20PDF.pdf (accessed on 15 July 2023).
- Institute for Spatial Research (INPE). According to PRODES. 2023. Available online: http://terrabrasilis.dpi.inpe.br/app/dashboard/deforestation/biomes/legal_amazon/rates (accessed on 18 September 2023).
- Argo. Brazil. 2021. Available online: https://g1.globo.com/economia/agronegocios/noticia/2021/03/03/agropecuaria-foi-o-unico-setor-que-cresceu-no-pib-de-2020-entenda.ghtml (accessed on 30 December 2023).
- ILO. The Employment Impact of Climate Change Adaptation. 2018. Available online: https://www.ilo.org/wcmsp5/groups/public/ed_emp/documents/publication/wcms_645572.pdf (accessed on 21 January 2023).
- Oelz, M.; Dhir, R.K.; Harsdorff, M. Indigenous Peoples and Climate Change: From Victims to Change Agents through Decent Work. 2017. Available online: https://www.ilo.org/global/topics/indigenous-tribal/WCMS_551189/lang--en/index.htm (accessed on 12 July 2023).
- Nationally Determined Contribution (NDC-Brazil). Paris Agreement Brazil’s. 2020. Available online: https://www.wwf.org.br/?77508/New-Brazilian-NDC-reduces-the-country-s-climate-ambition-against-the-spirit-of-the-Paris-Agreement (accessed on 15 July 2023).
- NDC-SA. Partnership. 2021. Available online: https://ndcpartnership.org/news/south-africa-takes-high-ambition-path (accessed on 17 July 2023).
- National Planning Commission (NPC). Social Partner Dialogue for a Just Transition: 2050 Vision and Pathways for a Just Transition to a Low Carbon, Climate Resilient Economy and Society. 2019. Available online: https://www.nationalplanningcommission.org.za/assets/Documents/Vision%20and%20Pathways%20for%20a%20Just%20Transition%20to%20a%20low%20carbon%20climate.pdf (accessed on 4 April 2023).
- Naidoo, C.P.; Lehmann-Grube, P.; Sheehama, A.; Beaumont, J.; Watson, C.; Pettinotti, L. Exploring the Intersection between Equity and Article 2.1c of the Paris Agreement; Rabia Transitions Initiative and Overseas Development Institute: Johannesburg, South Africa, 2023; Available online: https://www.rabiatransitions.org/insights/exploring-the-intersection-of-equity-and-article-21c-towards-an-improved-global-stocktake/ (accessed on 8 September 2023).
- The Presidency South Africa. South Africa’s Just Energy Transition Investment Plan (JET IP) for the Initial Period 2023–2027. 2022. Available online: https://www.thepresidency.gov.za/content/south-africa%27s-just-energy-transition-investment-plan-jet-ip-2023-2027 (accessed on 6 February 2022).
- The Presidency South Africa. Presidency on International Partnership to Support a Just Transition to a Low Carbon Economy and a Climate Resilient Society. 2021. Available online: https://www.gov.za/speeches/presidency-international-partnership-support-just-transition-2-nov-2021-0000 (accessed on 10 April 2022).
- The South African Economic Reconstruction and Recovery Plan (SAERRP). 2023. Available online: https://www.gov.za/sites/default/files/gcis_document/202010/south-african-economic-reconstruction-and-recovery-plan.pdf (accessed on 23 May 2023).
- Sooklal, A. Fostering Partnerships with BRICS Energy Investors. 2023. Available online: https://www.iol.co.za/news/politics/opinion/fostering-partnerships-with-brics-energy-investors-a321d9bc-e686-4afe-b1fa-546b0758aad0 (accessed on 14 June 2023).


| Country | Country Area (1000 sq.km) | Population (Million Persons) | Life Expectancy (Years) | GDP Growth Rate % |
|---|---|---|---|---|
| Brazil | 8516 | 208 | 76 | 1.2% |
| Russia | 17,125 | 147 | 71.9 | 2.1% |
| India | 3287 | 1269 | 68.7 | 6.7% |
| China | 9600 | 1386 | 76.3 | 4.5% |
| South Africa | 1221 | 59 | 64 | 2.1% |
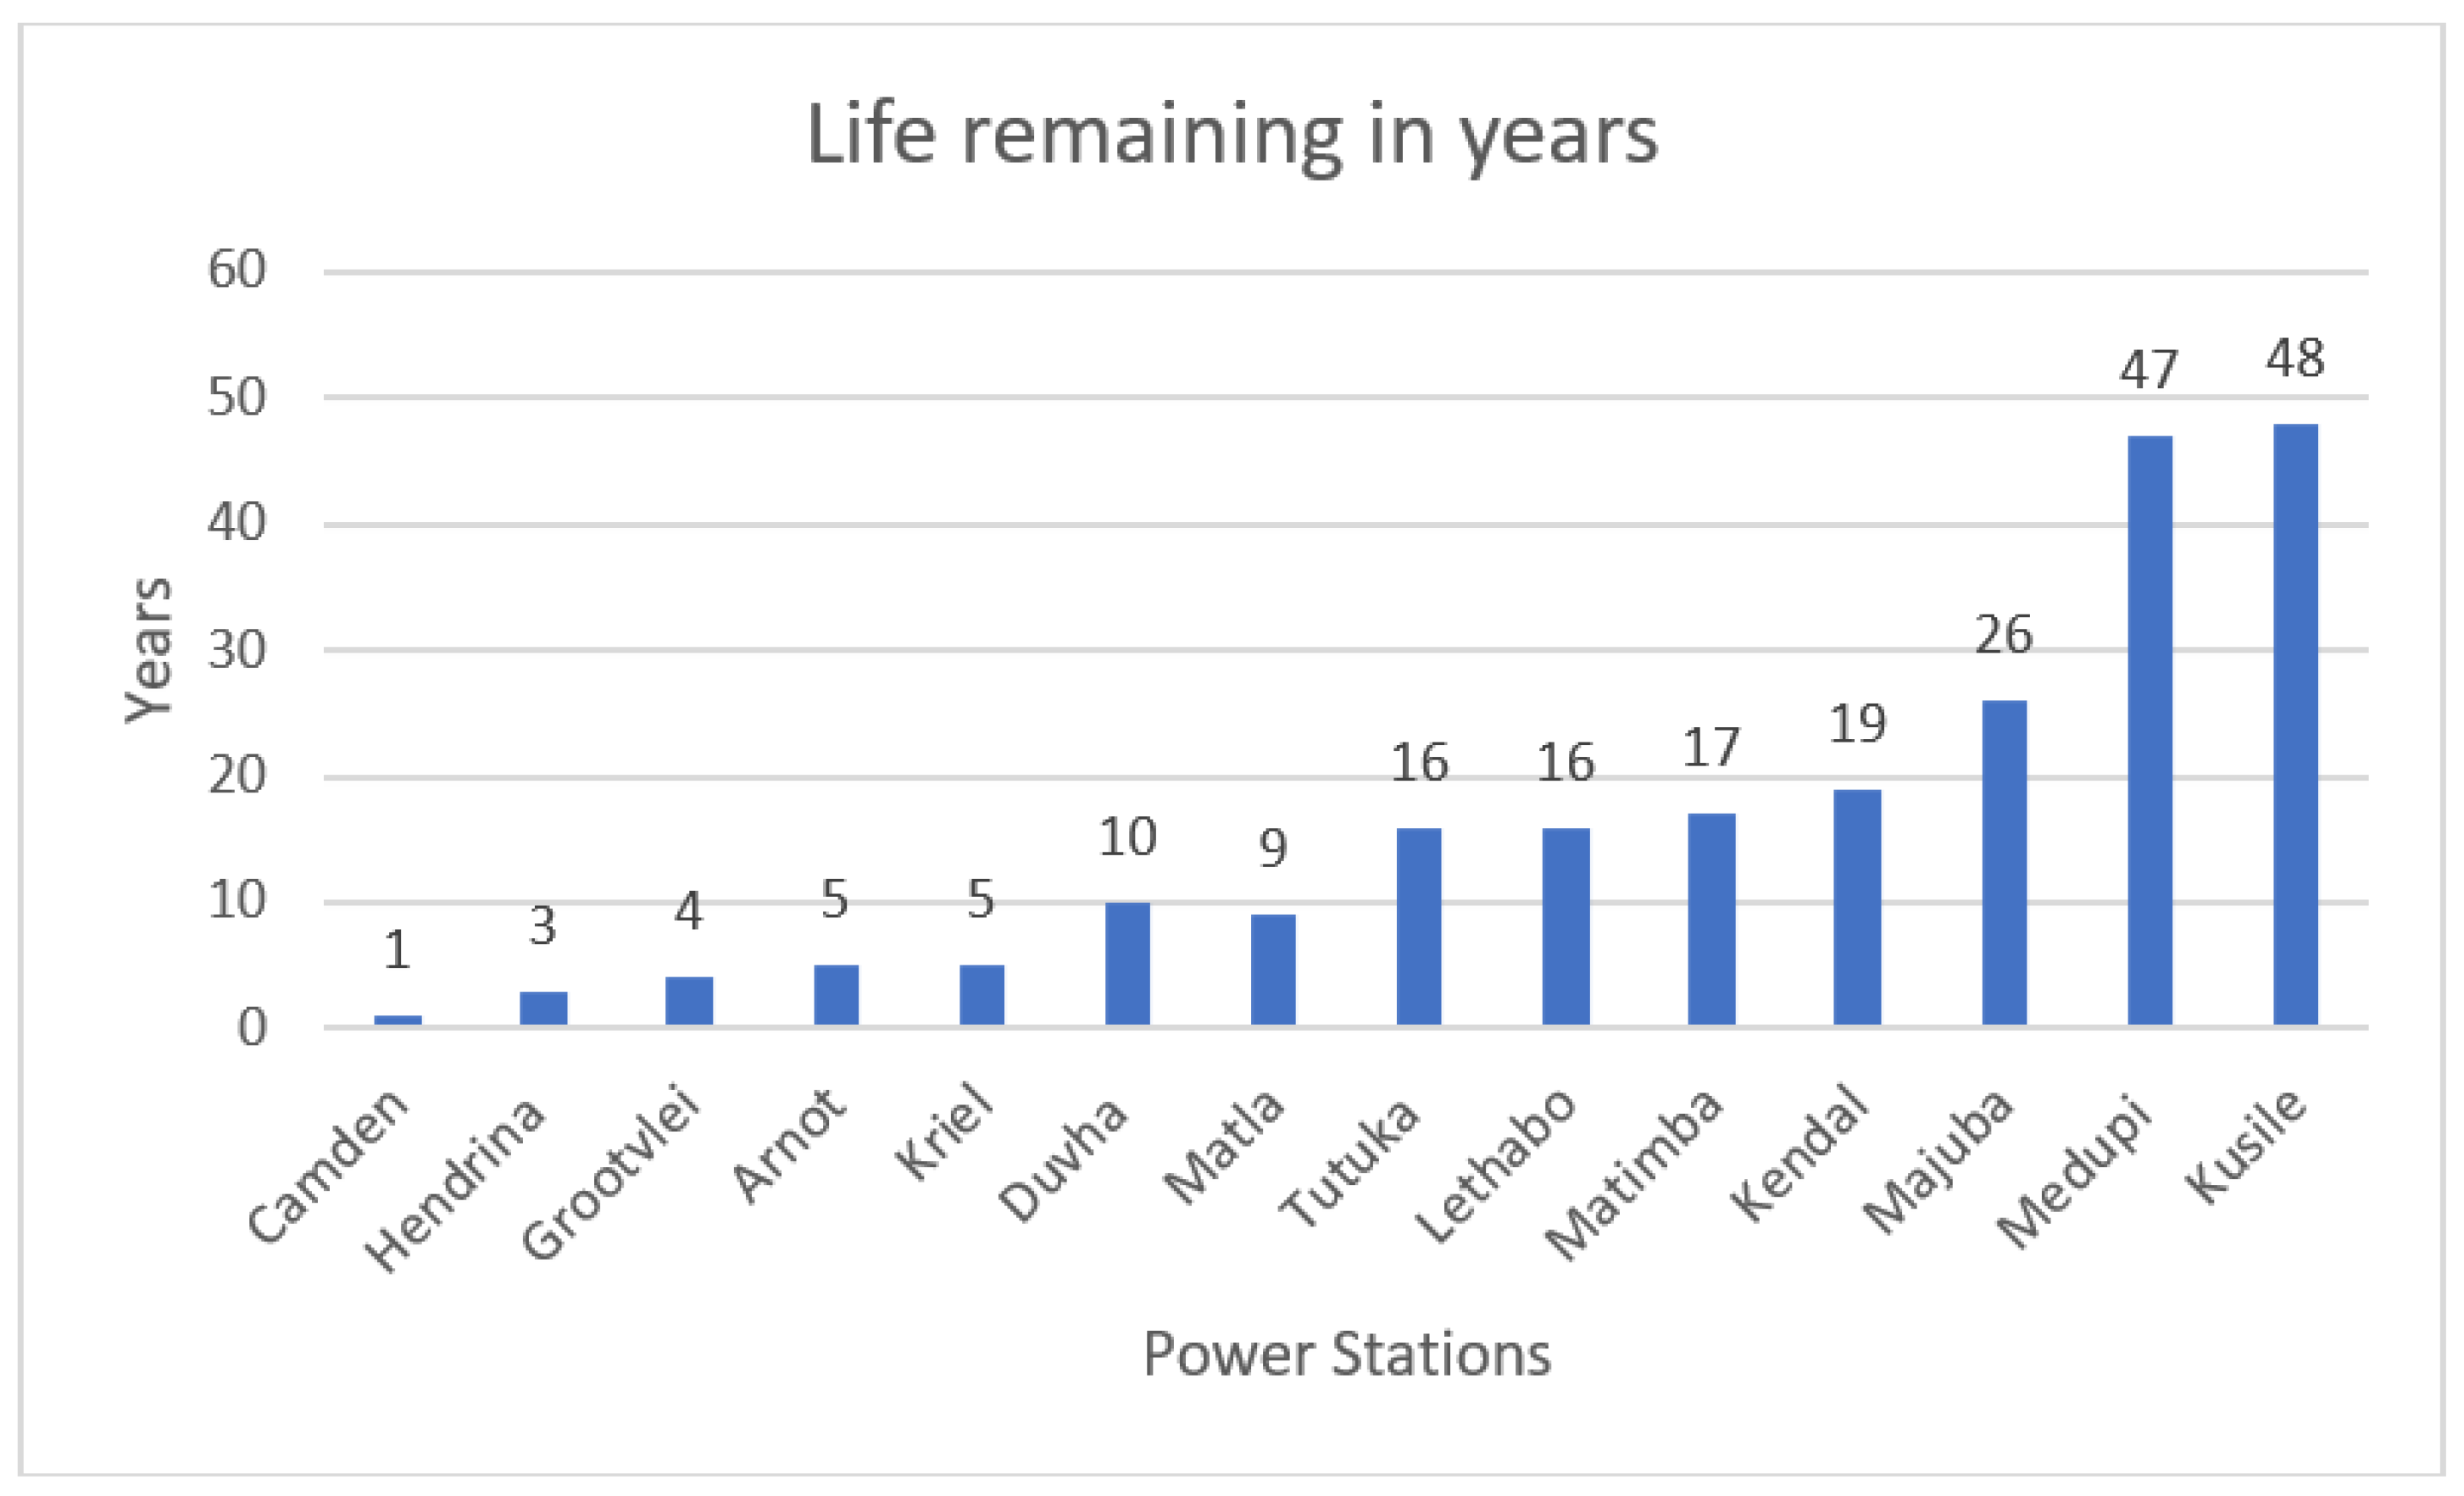
| Power Station | Decommissioning Date | Capacity (MW) |
|---|---|---|
| Arnot | 2021–2029 | 2232 |
| Camden | 2021–2024 | 1481 |
| Duvha | 2030–2034 | 2875 |
| Hendrina | 2021–2027 | 1638 |
| Kendal | 2038–2043 | 3840 |
| Kriel | 2026–2029 | 2850 |
| Lethabo | 2035–2040 | 3558 |
| Majuba | 2046–2050 | 3843 |
| Matimba | 2037–2041 | 3690 |
| Matla | 2029–2033 | 3450 |
| Tutuka | 2035–2040 | 3510 |
| Total | 2021–2050 | 32,967 |
Disclaimer/Publisher’s Note: The statements, opinions and data contained in all publications are solely those of the individual author(s) and contributor(s) and not of MDPI and/or the editor(s). MDPI and/or the editor(s) disclaim responsibility for any injury to people or property resulting from any ideas, methods, instructions or products referred to in the content. |
© 2024 by the authors. Licensee MDPI, Basel, Switzerland. This article is an open access article distributed under the terms and conditions of the Creative Commons Attribution (CC BY) license (https://creativecommons.org/licenses/by/4.0/).
Share and Cite
Ramluckun, R.; Malumbazo, N.; Ngubevana, L. A Review of the Energy Policies of the BRICS Countries: The Possibility of Adopting a Just Energy Transition for South Africa. Sustainability 2024, 16, 703. https://doi.org/10.3390/su16020703
Ramluckun R, Malumbazo N, Ngubevana L. A Review of the Energy Policies of the BRICS Countries: The Possibility of Adopting a Just Energy Transition for South Africa. Sustainability. 2024; 16(2):703. https://doi.org/10.3390/su16020703
Chicago/Turabian StyleRamluckun, Rajesh, Nandi Malumbazo, and Lwazi Ngubevana. 2024. "A Review of the Energy Policies of the BRICS Countries: The Possibility of Adopting a Just Energy Transition for South Africa" Sustainability 16, no. 2: 703. https://doi.org/10.3390/su16020703
APA StyleRamluckun, R., Malumbazo, N., & Ngubevana, L. (2024). A Review of the Energy Policies of the BRICS Countries: The Possibility of Adopting a Just Energy Transition for South Africa. Sustainability, 16(2), 703. https://doi.org/10.3390/su16020703