Article

South Africa’s Energy Landscape Amidst the Crisis: Unpacking Energy Sources and Drivers with 2022 South African Census Data

by
Koech Cheruiyot
1,*,
Ezekiel Lengaram
1 and
Mncedisi Siteleki
2
1
School of Construction Economics and Management, University of the Witwatersrand, Johannesburg 2050, South Africa
2
School of Architecture and Planning, University of the Witwatersrand, Johannesburg 2050, South Africa
*
Author to whom correspondence should be addressed.
Sustainability 2024, 16(2), 682; https://doi.org/10.3390/su16020682
Submission received: 17 November 2023 / Revised: 8 January 2024 / Accepted: 9 January 2024 / Published: 12 January 2024
(This article belongs to the Section Energy Sustainability)

Abstract

:
This paper examines patterns and drivers of energy choices for cooking and lighting in South Africa using the Statistics South Africa Census data at the district municipality (districts) level. Employing spatial and ordinary least squares (OLS) regression analysis, the findings show that electricity is the main source of energy for cooking across South Africa. However, there is a large swathe of the country covering districts such as Vhembe and Mopani in Limpopo, eastern Mpumalanga, KwaZulu-Natal, and northern Eastern Cape provinces where wood is the predominantly used energy type for cooking. There is almost uniform use of gas for cooking across the country. Electricity is the main energy source for lighting in South Africa. It is followed by candles, likely explained by loadshedding, and, surprisingly, solar energy a distant third. In terms of drivers, dwelling types play a statistically significant role in what energy type to use for cooking and lighting, albeit differently. In terms of lighting, formal dwelling is positively related to the choice of electricity and informal dwelling is related to the choice of electricity (negatively) and candles (positively) for lighting. The level of higher education, household size, and the dependency ratio have varied statistically significant roles in the choice of either energy type for cooking or lighting by formal, informal, and traditional dwellers. Relevant policy prescriptions that are needed to engender the country towards sustainable energy use, diversification of energy types from electricity produced from fossil fuels to other renewable energy sources such as solar, and reduction in over-dependency on the biomass energy sources such as paraffin and wood, especially in rural and poor districts, are proposed.

1. Introduction

South Africa, as one of the most developed nations in the African continent, is the largest consumer of energy in Africa. Forms of energy sources or energy generation technology include fossil fuel, nuclear, renewables, hydro, wind, geothermal, solar, battery, and others [1]. The advent of population growth, urbanization, and technological advancement resulted in the adoption of oil, gas, solar, wind, and coal as sources of energy [2]. The increase in population corresponds to an increase in the demand for power. When the generated power is insufficient to meet the demanded power, the grid will encounter a drop in frequency [1]. With about 80% of its electricity energy generated from coal, South Africa ranks as the seventh largest global coal producer [3,4]. Despite South Africa’s vast potential for biomass, wind, and solar energy, the country relies on coal for its fuel source due to its cost-effectiveness. This overreliance on coal is also straining existing coal power stations, and presents environmental challenges, making the development of renewable energy sources crucial for the country [5]. To move towards successful renewable energy development in the country, several challenges, including technical, financial, policy, and environmental issues, must be addressed [6].
Oyuke, Penar, and Howard [7] succinctly put forward the case for access to electricity. They argue that access to electricity is fundamental to opportunities in today’s world. Quoting former United States President Obama [7], “It is the light that children study by; the energy that allows an idea to be transformed into reality. It is the lifeline for families to meet their vital needs” [8]. Moreover, Sustainable Development Goal number seven (SDG 7) emphasizes the need for access to modern, reliable, affordable, and sustainable energy sources as vital for economic development, poverty eradication, and reducing inequalities, through improvement in health and wellbeing, food production, water supply, education, and climate change mitigation [9,10,11,12,13].
Given the importance of the residential sector in terms of energy consumption, an extensive understanding of households’ energy consumption patterns and choices is vital [14]. While literature on energy consumption in South Africa is vast (e.g., works by [14,15,16,17,18,19,20,21], and others, incorporating the industrial and residential sector), Bohlmann et al. [14] decry the insufficient literature on the patterns, evolution, and characteristics of energy use in South Africa focusing on the residential sector. As such, the main goal of this paper is to unpack energy type sources, choices, and their drivers in South African households using StatsSA’s [22] Census data. Several authors acknowledge that household energy consumption is driven by household characteristics, such as income levels, energy prices, energy access, weather, household size and appliances and their energy efficiency, thus making the importance of understanding such relationships paramount (see [14]). Similarly, amidst the ongoing energy crisis in the country, the paper is timely, as it will provide a deeper understanding of the energy characteristics across the country, which is essential in determining appropriate policies and steps required to be undertaken for future energy access across different regions in South Africa.
The remainder of the paper is structured as follows: Section 2 reviews related literature, including theories of energy choices, an overview of energy sources in South Africa, the significance of energy to economic growth and households, government policy towards the renewable energy mix in South Africa, and socio-economic factors affecting residential energy choices. Section 3 describes the data and methods employed in the paper. Section 4 dwells on the results and related discussions, while the last section concludes the paper.

2. Literature Review

2.1. Theoretical Background

Numerous studies have investigated the patterns and drivers of energy fuel use in both emerging and developing countries, such as China, India, and Bhutan [23,24,25,26,27], and Sub-Saharan Africa [26,28,29,30,31]. They agree that the effect of socio-economic factors, including income, on the choice of energy to be used by households remains an unsettled question.
The literature on household choices for lighting and cooking energy sources is divided into two channels: the energy ladder and fuel stacking hypotheses. The energy ladder hypothesis ascribes the differences in energy use patterns between households to variations in income status [32]. This explains the transition in cooking energy source from traditional biomass to modern sources along an imaginary ladder with improvement in the welfare (income) of households [33]. Hosier and Dowd [34] suggest that households face a vector of energy choices ranked in a schematic way in order of increasing technological innovation. The hypothesis views energy demand in three stages. The initial stage emphasizes universal dependence on biomass. The second stage entails fuel switching whereby households switch from biomass to transition fuels, such as kerosine, coal, and charcoal, in response to the growth of income and other socio-economic factors and changes, such as deforestation and urbanization. The final stage of the ladder marks the switching to the use of modern energy, such as liquified petroleum gas and electricity, for cooking [35]. Other studies, such as [34,36,37,38,39], provide evidence in support of these hypotheses. Nevertheless, criticism is often posed against the energy ladder hypothesis, in that it is too simple, and tends to assume away the existence of inter-fuel substations among households [35,40].
The fuel stacking hypothesis, on the other hand, posits that energy transition among households does not necessarily imply a stepwise movement from one fuel to another. Instead, households utilize various fuel sources [32,35,36,41]. Therefore, households rather have a portfolio of high- and low-cost energy types constrained by dwelling types, income, household size, and other preferences. According to StatsSA [22] there are three dwelling types in South Africa. Formal dwelling are structures built according to an approved plan, i.e., house, flat, apartment, townhouse, flat let, duplex, second dwelling, etc. Informal dwellings are makeshift structures built, but not approved by a local authority, and not intended as a permanent dwelling. Traditional dwellings are structures made of clay, mud, thatch, or other traditional materials. Energy choice depends mainly on the above-mentioned factors and unreliable availability of modern energy sources.

2.2. Overview of Energy Sources in South Africa

South Africa is the largest consumer of energy in Africa [3,4]. In 2022, according to the Council for Scientific and Industrial Research [5], South Africa produced 233 Terawatt-hours (TWh) from varied utility-scale generation technologies. These technologies include coal, nuclear, hydro, solar photovoltaics (PV), onshore wind, concentrated solar power (CSP), pumped storage, and diesel-fueled open-cycle gas turbines. However, the country’s energy production has been declining in the last decade—for instance, in 2010, energy production was 249 TWh. In terms of energy mix, coal remains the dominant energy source in South Africa, contributing 80% of the country’s electricity generation [5,42]. Despite recent investments toward renewable energy technologies, the contribution of renewable energy technologies, that is, wind, solar PV, and CSP, is a paltry 13.7% of the total energy mix (without hydro, its contribution is 7.3%). Nuclear and diesel energy contributed 4.6% and 1.6%, respectively [5].
Unfortunately, this heavy reliance on coal has positioned South Africa among the top 10 greenhouse gas emitters globally [43]. Initially, the rapid surge in electricity generation in South Africa in the period between the 1890s and the early 1900s was primarily a response to the increasing demand from power mining machinery and to provide municipal lighting. The widespread use of coal for power generation in South Africa has led to high carbon dioxide (CO2) emissions, making it the largest CO2 emitter in Africa, contributing to over 34% of the continent’s total emissions. Additionally, South Africa is the largest greenhouse gas emitter in Africa and the 14th largest globally [42,43,44].
While energy is undeniably an important ingredient for economic growth, South Africa finds itself gripped by a prolonged energy crisis. Chronic underinvestment in the electricity sector has led to escalating power prices and a shortage of capacity during peak demand periods, resulting in demand rationing and blackouts, which have had severe economic implications [45]. The rising energy demand has started to overwhelm the existing power generating plants in South Africa and likely to affect the welfare of many South Africans [20]. In 2022, South Africa witnessed the worst loadshedding compared with the previous year’s, amounting to an outage duration of 3773 h or 11,529 GWh energy shed [5]. The major energy shortages, from unplanned outages, energy shortages, blackouts, and high energy tariffs, follow mainly from many years of underinvestment in power infrastructure and energy poverty in low-income households [45]. The poor performance and high maintenance of costs of Eskom’s coal fleet (Eskom presently stands as South Africa’s largest power entity, responsible for about 96% of the country’s electricity generation, operating 14 coal-fired power stations primarily clustered in the Mpumalanga province), and a lack of progress in adding new generation capacity to the national grid will most likely ensure the continuation of the country’s energy crises in the foreseeable future [46].
In South Africa, the percentage of households with access to electricity has increased to 86.15%, but a large share of households is still without electricity or cannot afford to use sufficient energy to meet their needs [47]. According to the StatsSA [22] Census data, 64.9% and 25.7% of African households use electricity and gas (mostly standard LPG—Liquefied Petroleum Gas) for cooking, respectively. The rest use paraffin (2.7%) and wood (6.1%) for cooking. In the case of energy for lighting, approximately 94.7% of households use electricity, whereas 0.3% and 0.9% use gas and paraffin, respectively. Approximately 3.2% and 0.7% use candles and solar, respectively [22].
According to [48] General Household Survey (GHS), in 2021, about 11% of South African households did not have access to electricity, and some of this 11% with no electricity were accessing electricity through informal or illegal connections [49]. Almost three-quarters (73.1%) of the 3.6% without formal access to electricity were connected through informal sources, such as sharing a connection with neighboring households whom they pay, while 11.7% accessed electricity through illegal connections [48]. Eberhard et al. [50] approximate South Africa’s electricity demand to grow by 5.4% annually. Sarkodie and Adams [51] suggest that of the 634 million people without electricity in Sub-Saharan Africa (SSA), eight million are in South Africa.
In South Africa, the literature on energy consumption is vast. Decrying the limited research focusing on residential consumption in South Africa, [14] analyzed the South African residential sectors’ energy characteristics, such as energy use profile, geographical distribution, and demographic characteristics. They highlight how the residential sector is one of the largest with regards to electricity consumption in South Africa, with their 2014 estimates showing that the sector consumes 23% of total energy consumption in the country. They conclude that, despite the provision of 50 kWh of free electricity per month to poorer households connected to the national grid aimed at alleviating energy poverty, many lower-income households still make use of other energy sources (up to 70%), such as wood and paraffin, to meet their basic energy requirements.

2.3. The Significance of Energy to Economic Growth and Households

Numerous studies have explored the impact of energy and electricity provision on economic growth [52,53,54]. Access to electricity is essential for achieving sustained economic growth, advancement of employment opportunities, health, educational outcomes, the overall quality of public services, improved living standards, and an enhanced quality of life [11,12,55]. Consensus among scholars and analysts is that access to electricity is fundamental in meeting societal needs, promoting economic growth, and facilitating human development. Energy is strongly linked with all SDGs, encompassing health, food security, poverty alleviation, and climate change [13,55]. Savacool [56] asserts that deprivation of energy access often leads to morbidity, political instability, and even environmental degradation. Dinkelman [57] and Bensch et al. [58] studied the effect of rural electrification on employment in South Africa and concluded that electricity access increased hours of work for both males and females, reduced female wages, and raised male earnings. The authors argue that, despite having more productive time when lighting is accessible, women still engage in non-wage activities more than men.
The electrification of underserved communities has yielded various additional benefits, including evening adult education in schools and the enhancement of educational facilities using equipment like photocopiers and computers. Increased rural electrification is closely tied to higher literacy rates among the youth due to improvements in both school- and home-based learning environments [13,59]. Access to electricity promotes education and gender equality, while reducing production and transaction costs through better access to transportation networks. Additionally, the presence of electric street lighting has been correlated with reduced crime rates [6]. Furthermore, the advantages of electricity access are closely associated with increased productivity and opportunities, which, in turn, reduce transaction costs, ultimately fostering economic development [60,61,62].
In rural communities, access to electricity can lead to additional income-generating activities, both in agriculture and other sectors. A study conducted by [63] revealed that 25% of households with access to electricity ran home-based businesses, as opposed to 15% of households without electricity. However, it is crucial to acknowledge that when examining the relationship between electricity access and income inequality, the context and the level of development must be considered. This is imperative because access to energy does not guarantee automatic growth and development. The overall context and environment must be conducive to growth and development [64,65].
Sardokie and Adams [6] explored the interplay between electricity access, the control of corruption, and income inequality in South Africa. The study identified a positive correlation between rising income levels and increased access to electricity. Furthermore, the study demonstrated that income inequality positively affects access to electricity, suggesting that income distribution disparities do not hinder electricity access in South Africa. Conversely, there was a negative relationship between access to electricity and corruption, signaling a deficiency in good governance and institutional quality. While economic growth is crucial for realizing universal electricity access, the study underscores the critical importance of good governance and institutional quality in ensuring the availability, accessibility, and affordability of energy security.
Conversely, the lack of adequate levels of energy availability can be detrimental to national economic development, for example, through increased running costs, as well as reduced productivity and profitability. Insufficient energy availability can also lead to political instability, disruption in the quality of life, damage to the environment, and declining livelihoods [46]. The lack of access to reliable power generation sources has been identified by the South African government as one of the key barriers to economic growth [45]. Andresen et al. [66] estimated the total effect of power outages on economic growth in SSA over the period 1995–2007. They conclude that the lack of reliable energy infrastructure contributes to an approximately two-percentage-point loss of Gross Domestic Product (GDP). In the continuing energy outages in South Africa, the South African Property Owners Association (SAPOA) [67] has noted that firms are compelled to invest in either diesel generators, solar, or both, making such firms incur huge operational costs and unable to operate optimally.

2.4. Government Policy towards Renewable Energy Mix in South Africa

Among Africa’s largest economies, namely Nigeria, South Africa, and Egypt, South Africa has developed the most comprehensive renewable energy plan [42]. To transition towards renewable energy sources, South Africa introduced a white paper in 2003, outlining a plan to generate 10 TWh of electricity from sources such as biomass, wind, solar, and small-scale hydro. Subsequently, in May 2011, an integrated resource plan was enacted, setting a new goal of adding 17,800 MW of renewable energy to the energy mix by 2030 [42]. The establishment of the Renewable Energy Independent Power Producer’s Programme (REIPPP) in 2011 marked an ambitious initiative for promoting renewable energy generation in South Africa, focusing on three core objectives, namely, reducing CO2 emissions, enhancing generating capacity, and fostering economic development. The REIPPP program has successfully diversified energy generation by involving over 60 power producers, leading to a steady increase in South Africa’s renewable energy capacity. Still, the country relies more on coal (about 80%), while the renewable energy mix provides the balance [5]. South Africa is also home to Africa’s only nuclear power plant.
The development of renewable energy sources in South Africa holds the potential to significantly reduce the heavy reliance on coal, which is both finite and environmentally unfriendly. Furthermore, the growth of the renewable energy sector in the country can create new job opportunities, thereby bolstering the South African economy. Due to its geographical location and population, South Africa has the potential to adopt various renewable energy sources, including biomass, wind, and solar energy. While biomass energy constitutes a notable portion of Africa’s energy use, it is primarily employed for non-commercial purposes, such as cooking and heating through the burning of wood, tree branches, charcoal, and animal waste [68]. The South African Renewable Energy Data and Information Service documented that more than 100 GWh of energy was produced from biomass in 2016, although no data have been recorded since then (as reported in [42]). Integrating biofuels into South Africa’s energy sector offers an opportunity to diversify the fuel sources for electricity generation and reduce the nation’s reliance on imported crude oil for transportation. Corncobs (agricultural remains from corn) are a potential substitute for coal or co-firing in coal plants for power generation. While most corncobs have been utilized for cooking and heating in rural areas, industrial use of this agricultural waste for energy generation in South Africa remains underutilized. Various policies, such as the Biofuel Industrial Strategy (BIS), have been adopted in South Africa to promote the use of biofuels and create jobs in rural areas.
The delay in implementing the BIS because of government inaction and the setting up of a modest 2% target for biofuel integration into the energy mix are among the difficulties facing the development of South Africa’s biofuel industry (as cited by [42]). Moreover, the absence of committees or task forces to monitor and drive the industry towards these goals, as well as the lack of subsidies and governmental support, hinders the growth of this renewable energy resource.
Balmer [69] asserts that even though the South African energy policy is progressive and even encompasses the Millennium Development Goals (MDG’s), the government is still marginally pursuing the implementation of pro-poor energy policies, and there are insufficient resources allocated to redress energy poverty in South Africa. For example, he argues that policies designed to address access to electricity, such as subsidies, tend to be ineffective because households without electricity tend to be typically located in rural areas, and therefore remain energy poor. Thom [70] points out that the South African electrification program has been executed as a blanket program and failed to account for the fact that some traditional households are still not able to afford to purchase electricity beyond the quota allotted. Therefore, many rural and traditional households still depend on other sources of energy to meet their basic energy needs. Moreover, there is insufficient policy implementation to address energy poverty in the non-grid consumers. Bohlmann et al. [14] argue that a firm grasp of energy sector consumption patterns is vital in forecasting the challenges and opportunities on the future design and implementation of energy policy.

2.5. Socio-Economic Factors Affecting Residential Energy Choices in South Africa

South African households depend on multiple energy sources to meet their daily energy needs. Broadly, with a high access to electricity in the country, the type of energy depended upon tends to differ depending on whether the household has electricity connection or not. Available evidence shows that households with electricity connection rely on electricity for lighting, cooking, and heating; however, other sources such as candles, firewood, paraffin, and gas are also used (see [14]). In the absence of electricity connection, households rely primarily on candles, firewood, and paraffin, with a small share of households reporting the use of coal or gas [14,71]. In the choice of which energy type to use, several factors, including income, household size, location, energy prices and energy access are factors [6,14].
Income is a critical determinant of what energy type a household chooses for cooking, lighting, and heating. Sugrue [72] and Lloyd [73] approximate that, on average, a poor household in South Africa spends around 20–25% of its income on energy, compared with 2% for the most affluent households. The Sustainable Energy Agency (SEA) [74] found similar findings in Cape Town, where households spent 10–25% of their income on energy consumption, while affluent households spent 3–5%. Davis [75] examined the energy utility patterns in rural areas in South Africa, with a focus on identifying the influence of the access to electricity on fuel choices used for everyday activities such as cooking, heating, and lighting. He concluded that there is an energy ladder in South African households, where households in rural areas tend to transition away from low-quality energy source (biomass and woods) towards gas and electricity as their income rises. Thom [70], on the other hand, explored the impact that access to electricity has on the choice of electrical appliance ownership in rural households in South Africa. Additionally, Thom [70] points out that households in rural areas tend to utilize a combination of energy sources, such as candles and paraffin, to meet their basic energy needs. Madubansi and Shackleton [76] corroborate Thom’s [70] findings and assert that, despite the accepted consensus that there is sufficient electrification in South Africa, many households still depend on some energy mix for lighting, cooking, and heating. Electricity is viewed as a complement and not a substitute in the energy use matrix.
In terms of paraffin use as source of energy for cooking, Annecke [77] posits that women view paraffin as a feminine fuel since it tends to encourage trends and relationships among them in the community. Moreover, Balmer [69] asserts that the procurement and management of energy sources for cooking fell mainly to women in the past. Ross [78] argues that consumption choices of a household are closely linked with the type of energy source available. Mehlwana and Qase [79] suggest that energy choice depends on its efficacy in performing specific tasks depending on the time of the year. Additionally, Bohlmann et al. [14] point out that energy utility across South African households has increased over time due to changes in consumer preferences and growth in the accessibility of electricity. Notably, having access to electricity in rural households does not substitute for the use of traditional energy sources such as wood and paraffin, but rather adds to the energy mix. The low cost of paraffin has been the main reason why low-income households have continued to use it for cooking and heating even after electrification [14].
Westley [80] and Ayesha [81] used household size to model household consumption in Paraguay and Pakistan and found that household size had a positive and significant effect on electricity consumption. With a national average household size of 3.5 and the same ranging from 2.6 to 5.7 across districts [22], household size has a role to play in the choice of what energy type to use for cooking or lighting. When comparative costs are factored in, it is not surprising that there are evident higher levels of energy poverty and over-reliance on poor energy sources, such as wood and paraffin, among many low-income households [82,83].
In terms of geography, the domestic use of gas tends to have a greater presence on rural farms and in formal rural areas, especially among higher income electrified households. Mensah and Adu’s [84] study on household energy choice in Ghana identified factors such price, income, education, household size, and geographical attributes, such as urban and rural, to have a significant influence on household decision on energy consumption.

3. Study Area, Data, and Methods

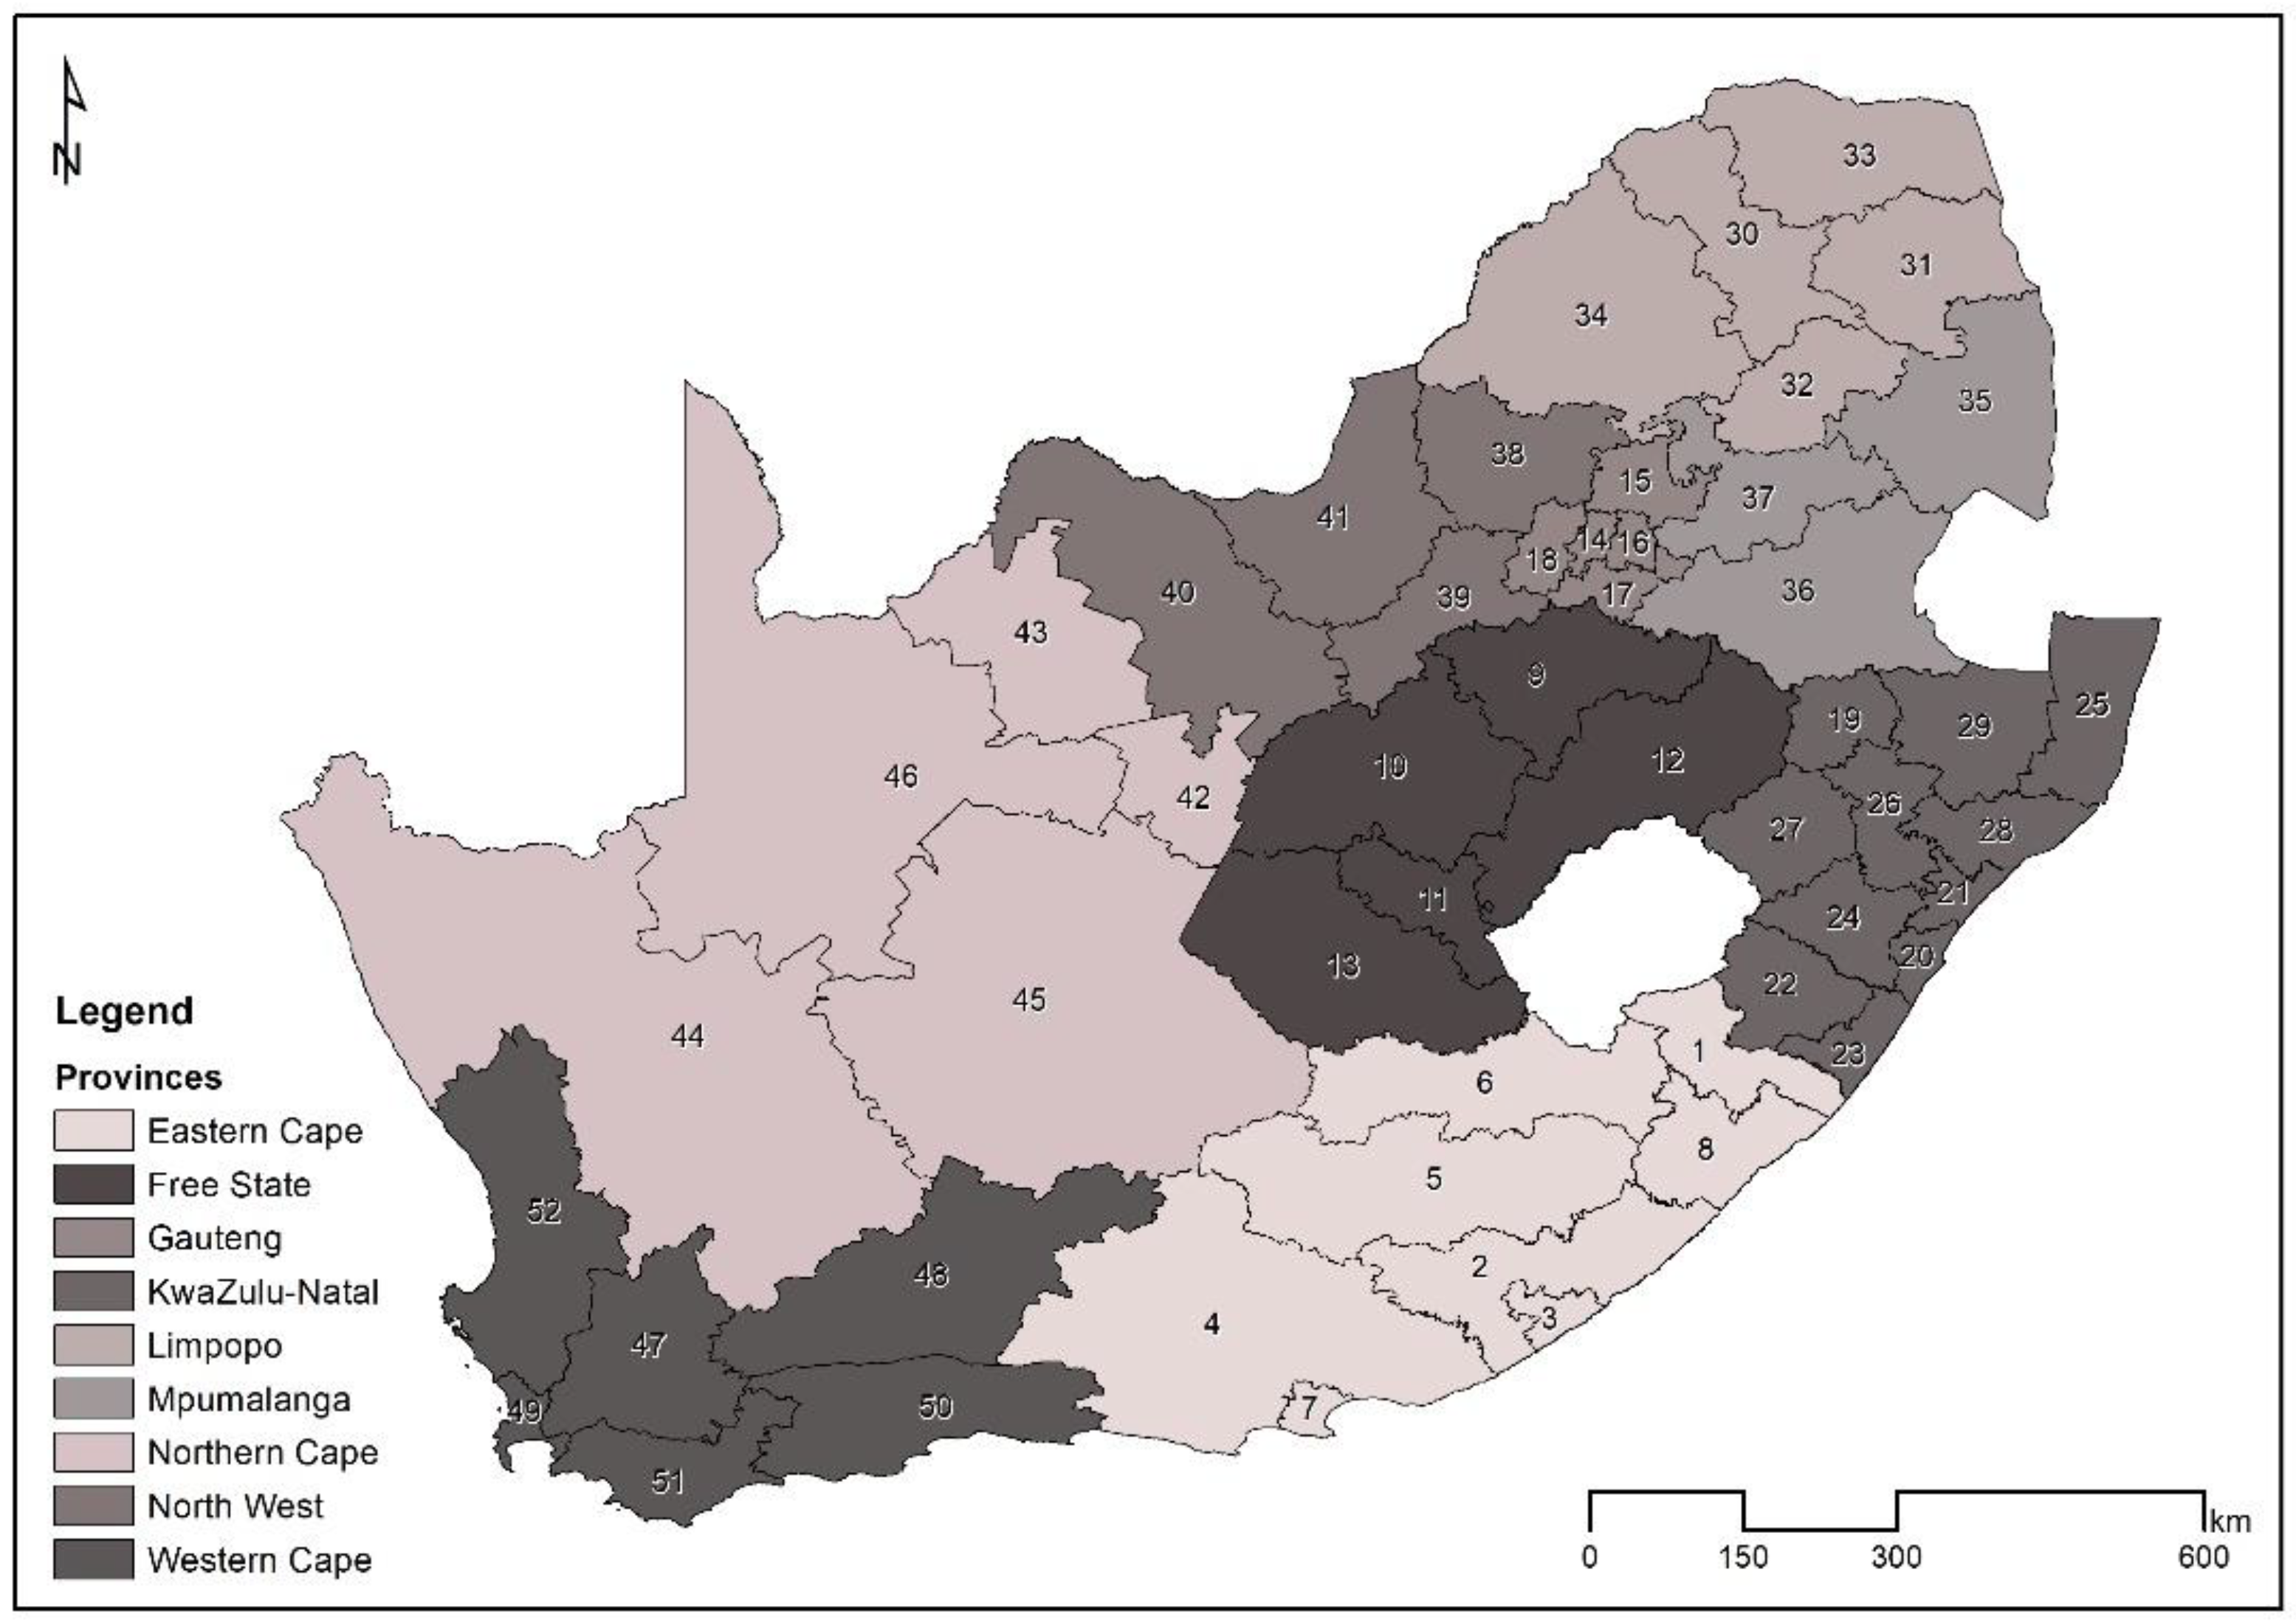
3.1. Study Area and Data

Figure 1 shows the 52 district municipalities across the nine provinces in South Africa. According to the RSA [85], district municipalities are category C in the local government structure in South Africa. The others are category A (metropolitan municipalities) and category B (local municipalities). District municipalities are made up of a given number of local municipalities that fall in one district. In case of metropolitan municipalities, they are all categorized as district municipalities. In non-metropolitan areas, district municipalities together with local municipalities serve to provide infrastructure, deliver services, and grow the local economy. In metropolitan areas, metropolitan municipalities are responsible for all local services, development, and delivery in the metropolitan area [86].
Our dependent variables were, broadly, measuring energy for cooking and energy for lighting. Dependent variables capturing energy for cooking were four—percentage of households cooking with electricity, cooking with gas, cooking with paraffin, and cooking with wood. Dependent variables capturing energy for lighting were three—percentage lighting with electricity, percentage lighting with candles, and percentage lighting with solar. Several predictor variables (drivers) were hypothesized as explaining the patterns and levels of households’ choices regarding energy type for cooking and lighting. The choice of variables was largely determined by a review of existing literature and empirical work (see Section 2 of this paper) and data availability in the StatsSA [22] Census database. While it is straightforward what the other explanatory variables measure, the dependency ratio was used as a proxy for household income that was not possible to find in the StatsSA [22] initial data release. The level of household education was used to complement the dependency ratio in proxying household income, since the level of education is highly correlated to the level of household income [13]. All empirical results in this paper were obtained using Stata 17 software [87] and ArcMap software 10.8.2 [88]. Table 1 shows the univariate statistics of the model variables used in the study.

3.2. Methods

This paper employed spatial and regression analyses using choropleth mapping and OLS regression models [89], respectively. An OLS model given by equation 1 was used to estimate the predictors of energy type choices for cooking and lighting for formal, informal, and traditional dwellers.
Energy typea = β0 + β1dwellingtypeb + β2Educationlevel + β3Householdsize + β4Dependencyratio + ε
where ε is the error term and β0–β4 are estimated regression coefficients of the various predictor variables as described in Table 1. Energy typea indicates that six models were estimated for each of the dependent variables, while dwelling typeb indicates the three different dwelling types that were used in OLS regressions in turn.

4. Findings

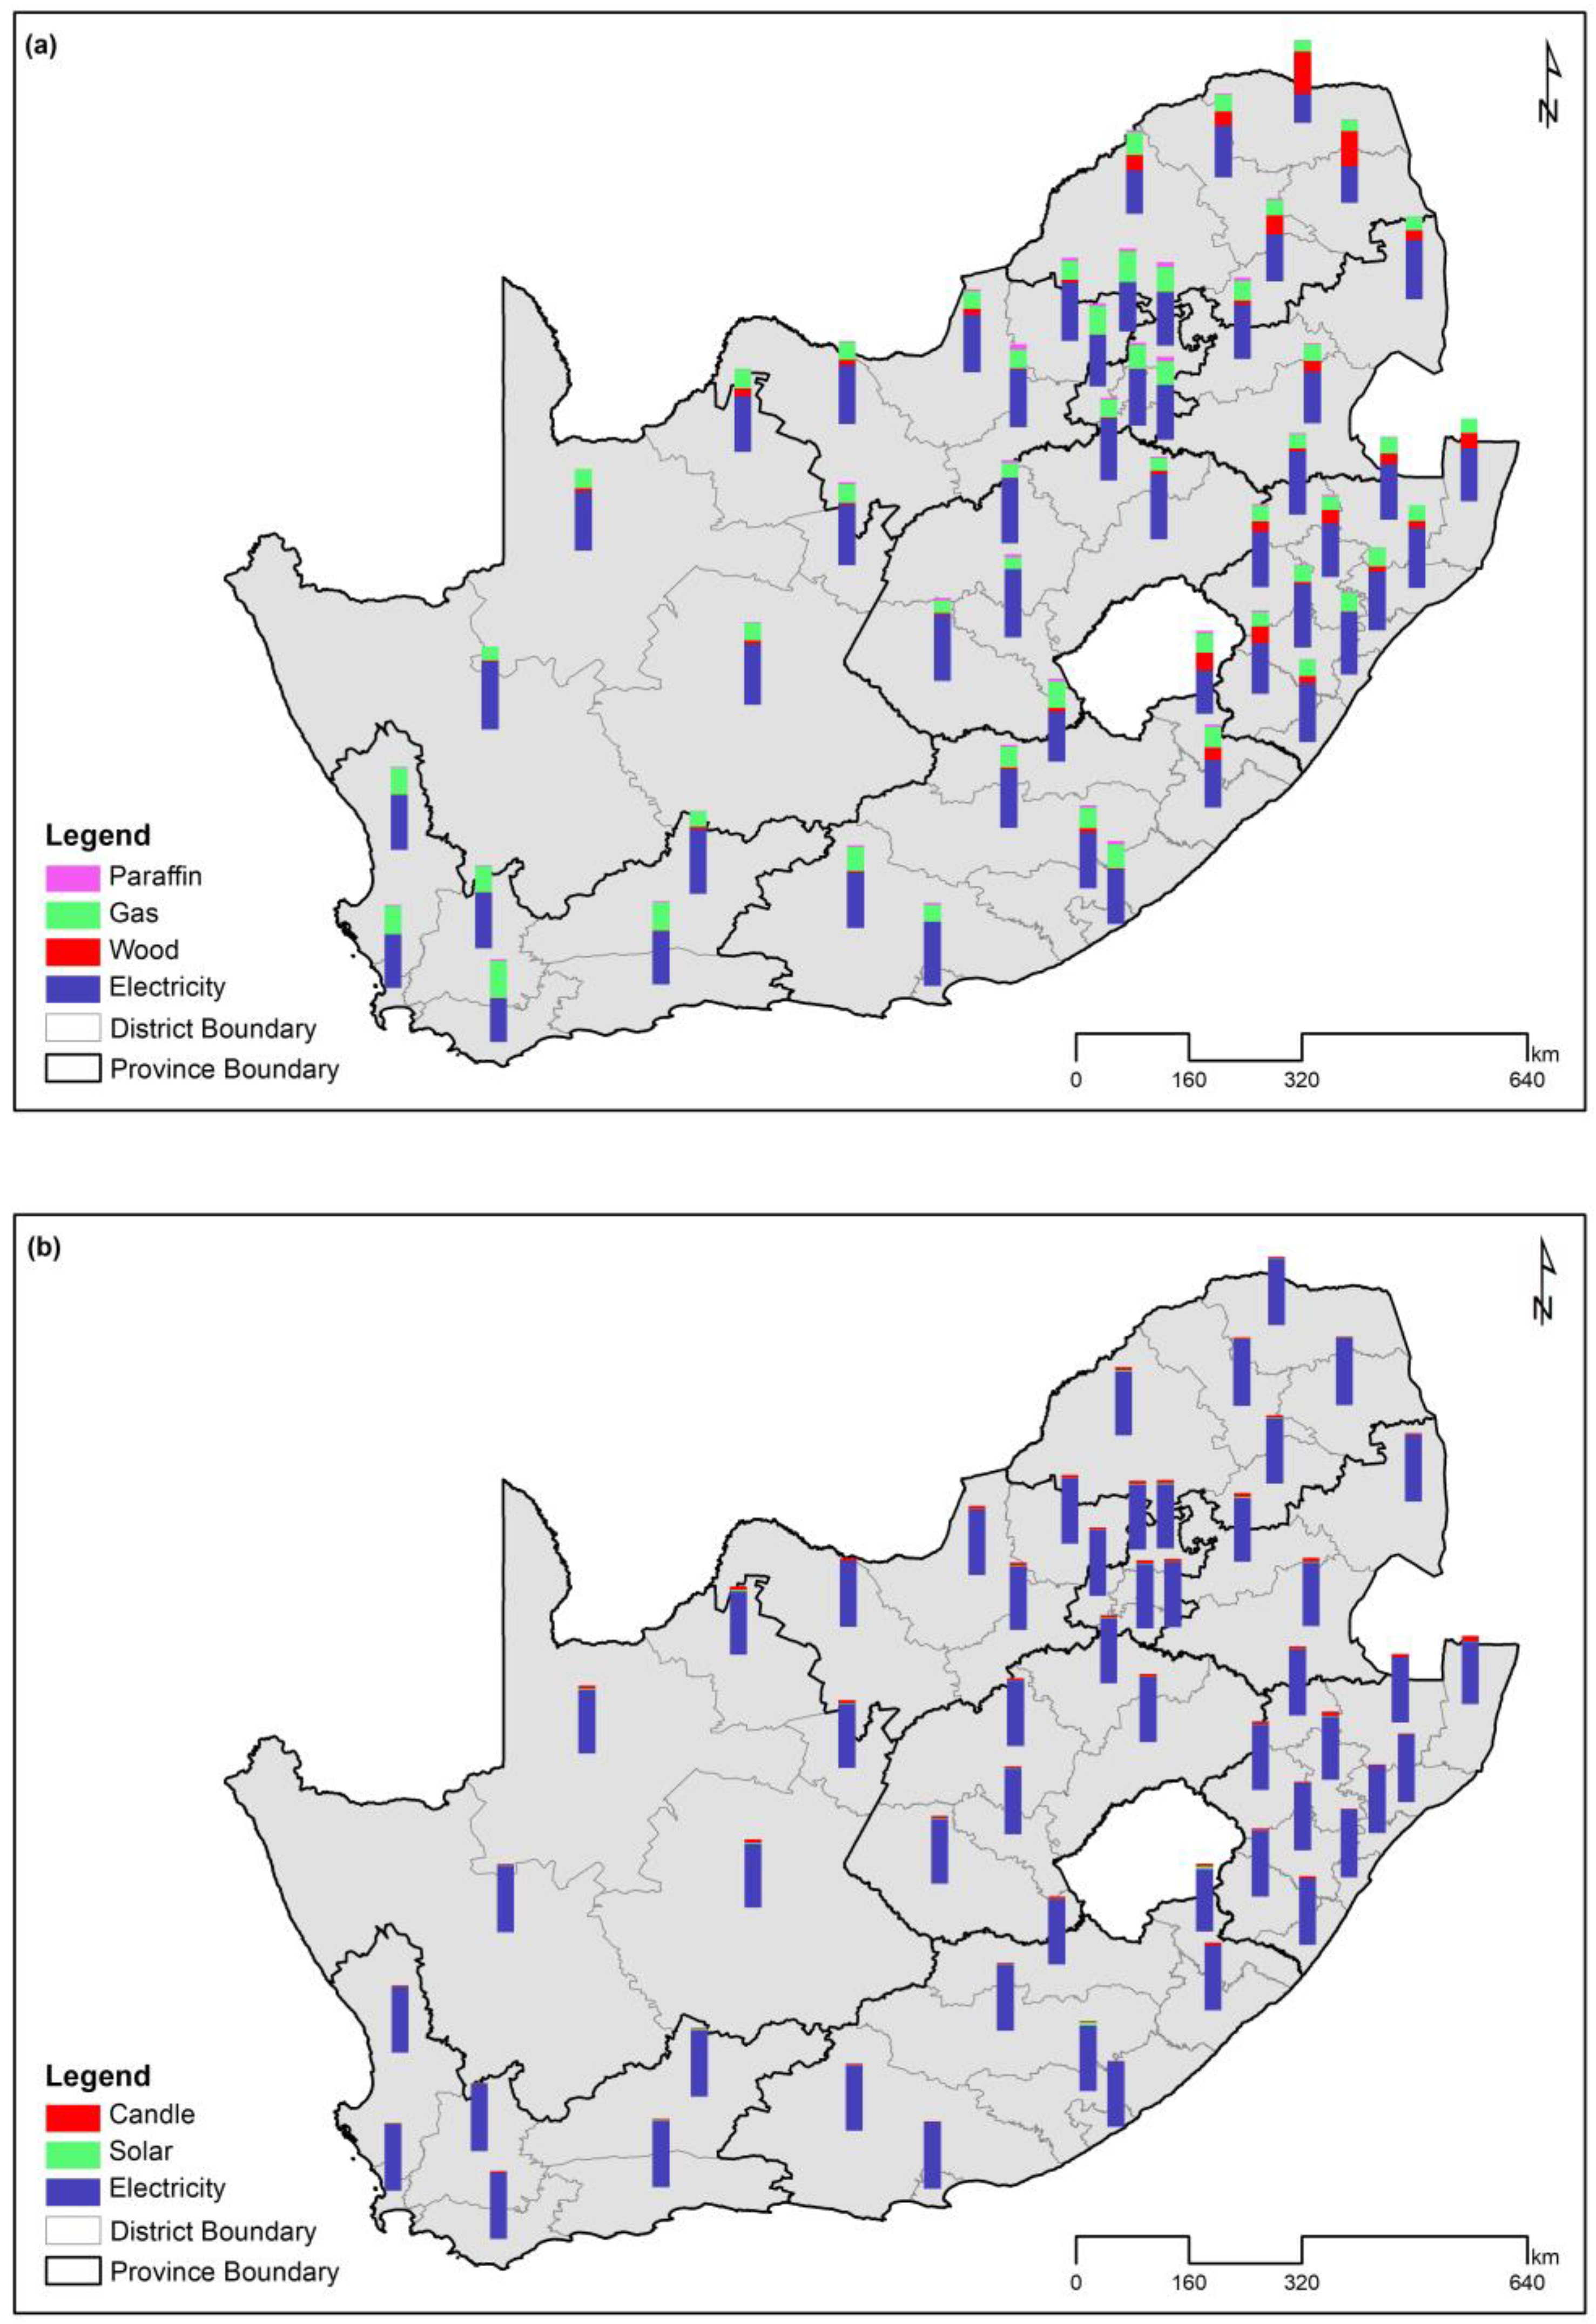
4.1. Descriptives Analysis
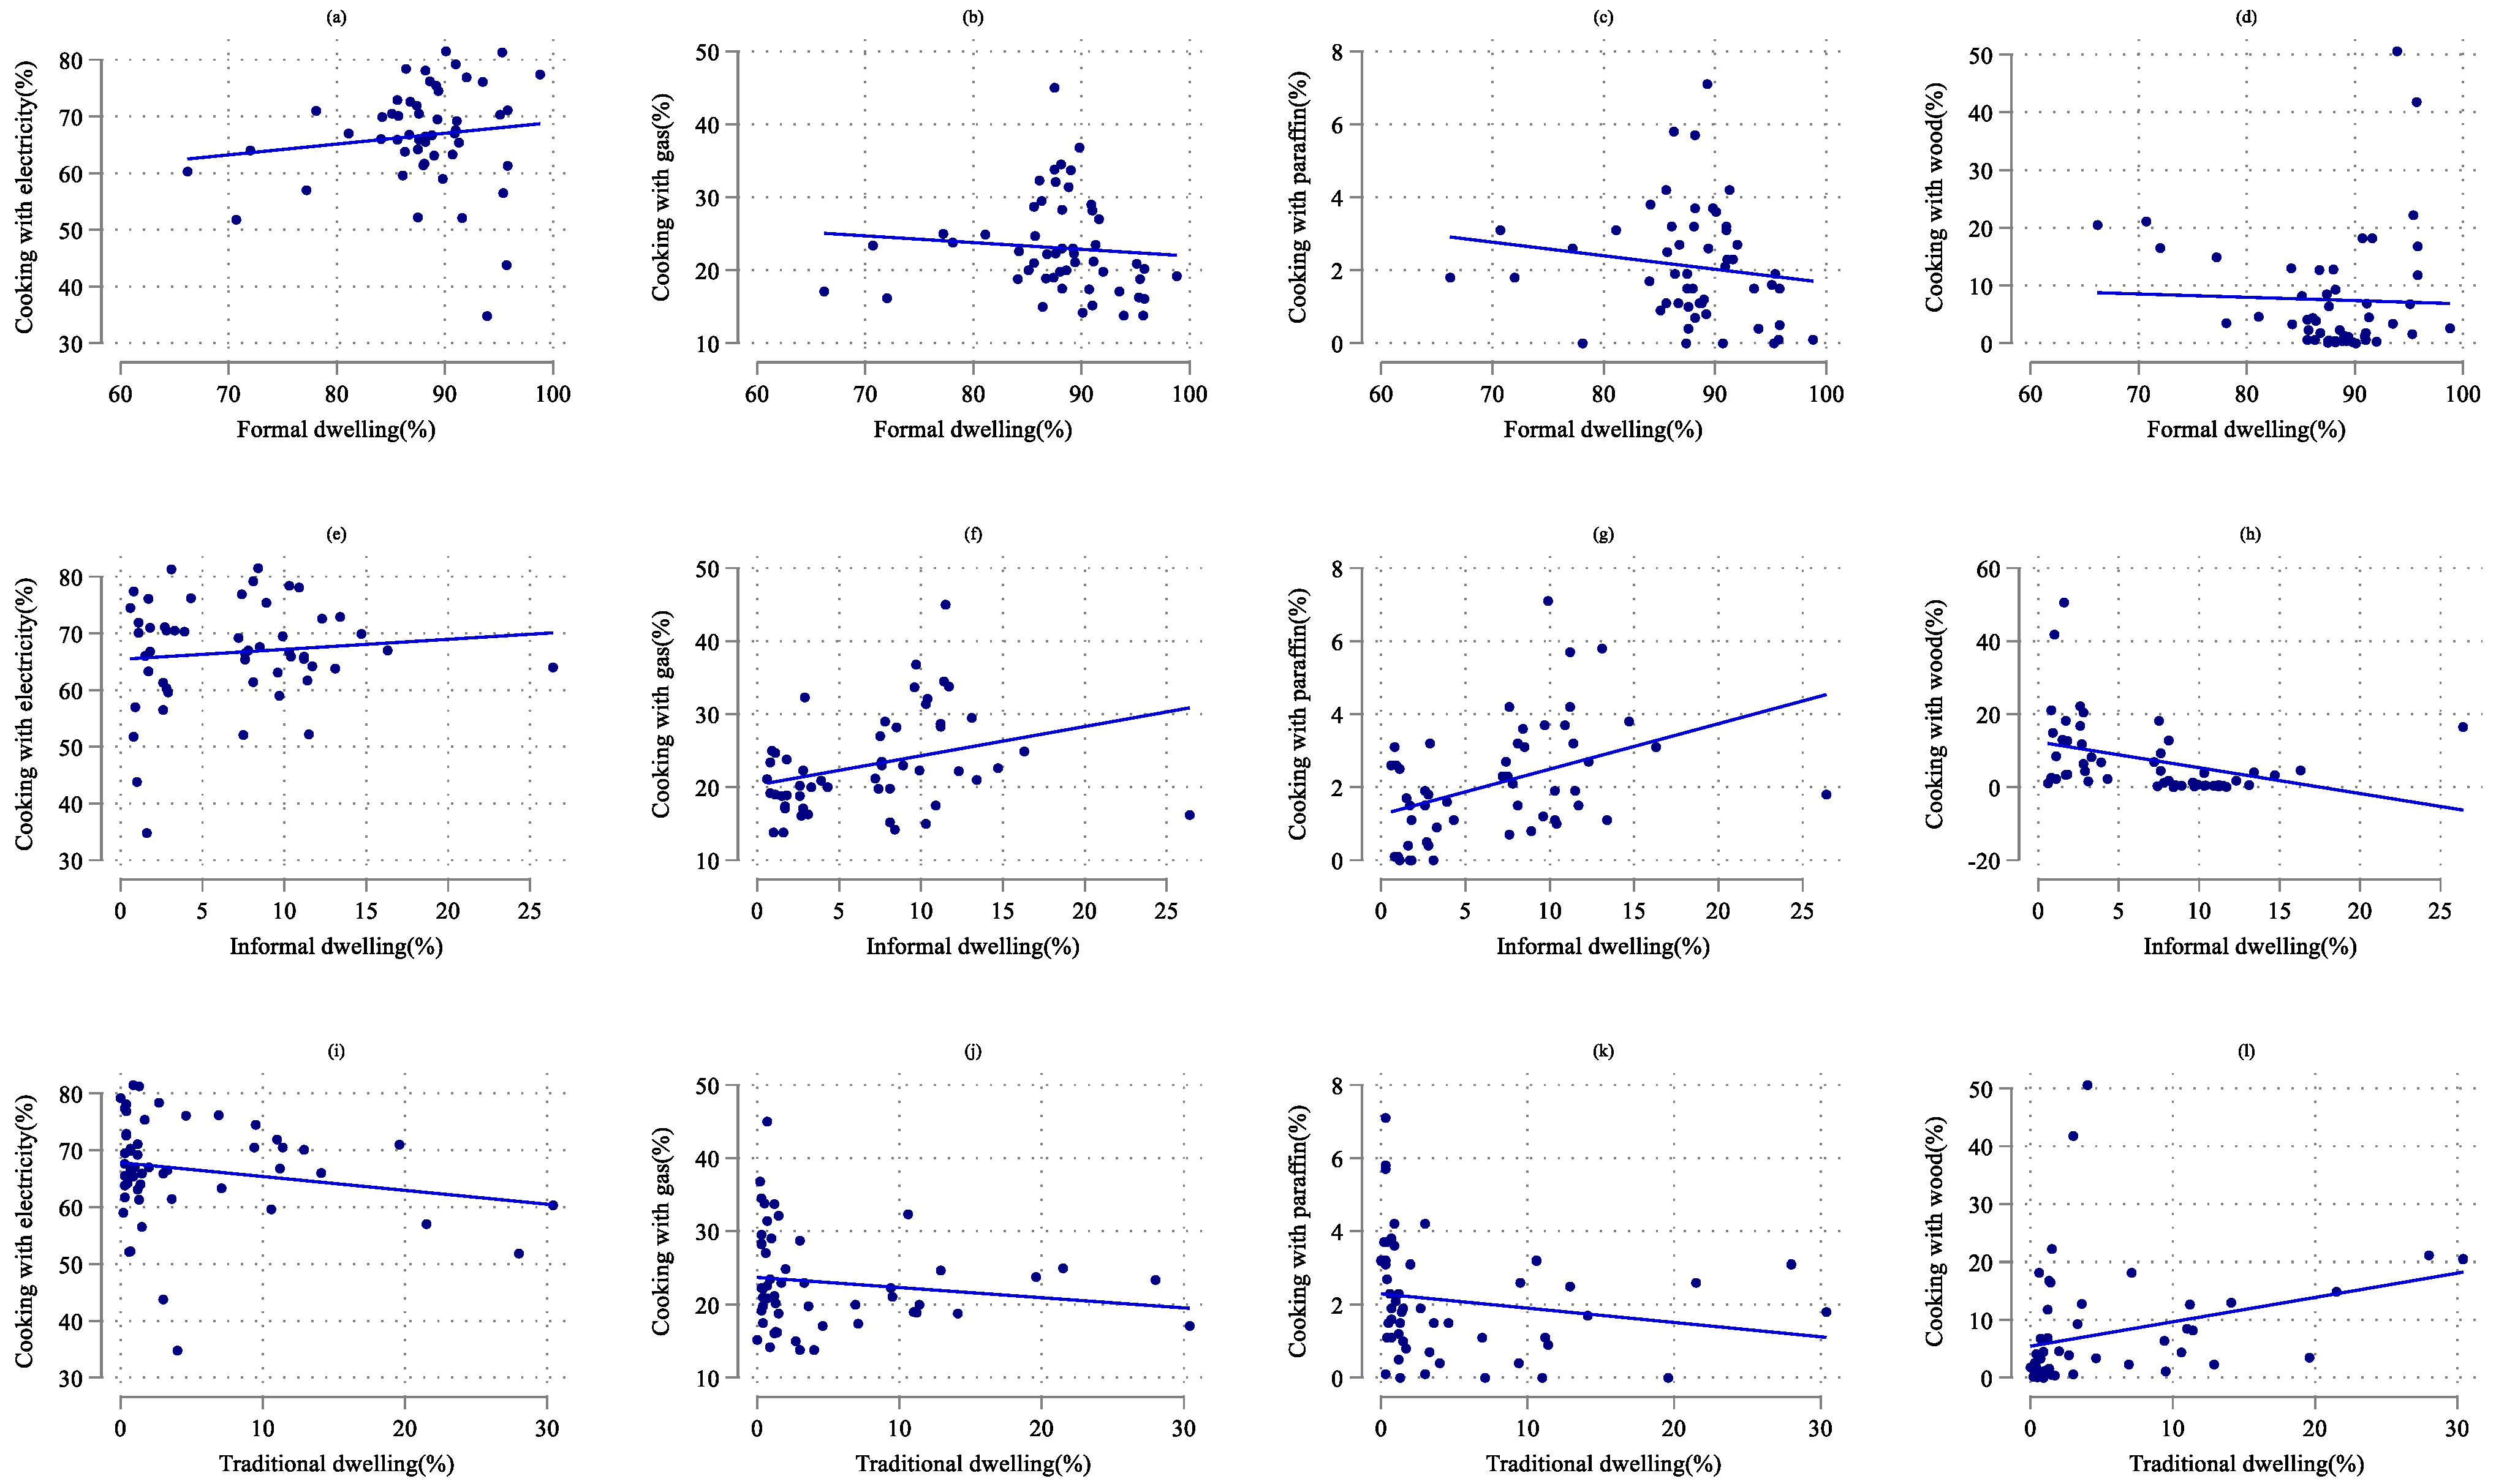
Energy for lighting and cooking are displayed in choropleth maps, which offer useful visual representation of geographic data using colors or shades. As such, they show variations in values, such as population density or income levels, thus allowing easy-to-understand geographical patterns and enhancing analyses and decision-making. Figure 2a shows the four types of energy used for cooking—paraffin, gas, wood, and electricity. Figure 2b shows the three types of energy used for lighting—candles, solar, and electricity. It is clear from Figure 2a that electricity is the main source of energy for cooking across South Africa. The exception is Limpopo, where wood is the predominantly used energy type in Vhembe district, followed by Mopani, where the use of wood is almost as high as the use of electricity. Wood is also significantly used in Mpumalanga, KwaZulu-Natal, and the northern districts of Eastern Cape. The use of wood as an energy type is extremely low in Gauteng and Western Cape. The use of paraffin is seen, although very minimally, in the Gauteng, Free State, and North West provinces. Gas is used in district municipalities in South Africa, although less than electricity. Electricity is the main energy source for lighting in South Africa (see Figure 2b). Candles are the second-most used energy source for lighting, given loadshedding. Surprisingly, solar energy is the least used for lighting.
High-level comparison between the 2011 and 2022 censuses [22] show some noticeable trends. In the use of electricity for cooking, there is a drop in the average proportion of households from 71% to 66% between 2011 and 2022, respectively. On average, only 4% of households used gas for cooking in 2011 compared to 23% of households in 2022. The drop in the use of electricity and the rise in the use of gas for cooking could be explained by the unpredictability and the increasing costs of electricity. More households used paraffin (7.7%) and wood (17%) for cooking in 2011 compared with 2022, where 2% and 7.5% of households used the two energy sources, respectively. On average, in terms of lighting, electricity remains the key energy choice, followed by candles and solar. Surprisingly, there is still a negligible proportion of households that use solar for lighting in 2022 compared to 2011.

4.2. Scatter Plots

Several scatter plots were constructed to show the linear association between variables used in the paper. Figure 3 shows the spread of the observations, the slope of the relationships in each of the scatterplots, and the extent to which this points to a significant bivariate relationship. The scatter plots in the first row of Figure 3 show the bivariate relationships between the percentage of formal dwellers and percentage who cook with electricity (Figure 3a), percentage who cook with gas (Figure 3b), percentage who cook with paraffin (Figure 3c), and percentage who cook with wood (Figure 3d), respectively. The slope in Figure 3a shows a positive relationship, while Figure 3b,c show negative relationships—with the slope of the latter steeper. The slope for Figure 3d, while negative, is close to zero (almost horizontal). None of these relationships are statistically significant (p < 0.05).
The scatter plots in the second row of Figure 3 show the bivariate relationships between the percentage of informal dwellers and percentage who cook with electricity (Figure 3e), percentage who cook with gas (Figure 3f), percentage who cook with paraffin (Figure 3g), and percentage who cook with wood (Figure 3h), respectively. The slopes in Figure 3e–g show positive relationships, while Figure 3h shows negative relationships. The relationships in Figure 3f–h are statistically significant (p < 0.05).
The set of scatterplots in the last row in Figure 3 show the bivariate relationships between the percentage of traditional dwellers and percentage who cook with electricity (Figure 3i), percentage who cook with gas (Figure 3j), percentage who cook with paraffin (Figure 3k), and percentage who cook with wood (Figure 3l), respectively. The slopes in Figure 3i–k show negative relationships, albeit at different magnitudes. The slope in Figure 3h shows a positive relationship. Only the relationship in Figure 3l is statistically significant (p < 0.05).

4.3. Empirical Results

4.3.1. Energy Use for Cooking

This section focuses on results where we regressed the four dependent variables—percentage who cook with electricity, percentage who cook with gas, percentage who cook with paraffin, and percentage who cook with wood—on the predictor variables in Table 1 in turn. The results are presented in Table 2, Table 3 and Table 4, respectively, for each of the dependent variables. All the results are robust since we estimate them under robust standard errors.
Table 2 shows estimation results for formal dwelling across the different energy types as shown in the respective models. For the electricity model, all the explanatory variables, except formal dwelling, are statistically significant. The coefficients for formal dwelling in the gas and the paraffin models are negative (p < 0.05 in both cases), implying that the more formal dwellings there are, the less use of gas and paraffin for cooking there is. This is an interesting finding, since, while paraffin may be considered an inferior and unsustainable energy source—thus fewer formal dwellers using it—it would be expected that the use of gas as a source of energy for cooking should increase in tandem with the increase in formal dwelling. Sarkodie and Adams [6] and Kahouli [90] suggest that poverty hinders accessibility and affordability to electricity and modern energy services.
The results for the highest level of education, which proxy for skill and experience of workforce, are mixed. The negative (p < 0.05) coefficient for the highest level of education in the electricity model is in contrast with its counterpart in the gas model, where it is positive (p < 0.05). These results imply that as the level of higher education increases, the use of electricity and gas for cooking decrease and increase, respectively. This pattern of electricity and gas use could be explained by the fact that the more educated households are, the more likely they are to have more employed members, have more income, be economically stable, and be more aware of the comparative long-term cheaper costs of gas than electricity for cooking; hence, they opt to use more gas and less electricity for cooking. Bekun et al. [43] found evidence of a positive influence of economic growth on energy consumption in South Africa. Sarkodie and Adom [91] found a positive impact of economic development on energy consumption in Kenya and Ghana. Mensah and Adu [84] also found income to have a positive and significant influence on energy choice in Ghana.
Similarly, the results for the dependency ratio are mixed. Results show that the higher the dependency ratio, the less use of electricity there is for cooking and the more use of wood there is for cooking in the electricity and wood model, respectively. These results could be explained by the fact that a higher dependency ratio may imply less disposal income, meaning that wood, as a cheaper energy source for cooking, is preferred to electricity and gas, which are relatively expensive.
The results further show that, as household size increases, there is more use of electricity, and less of gas and paraffin, for cooking. These results could be explained by the history of non-paying of electricity bills in the country, which sometimes manifests itself in terms of illegal connections, especially in the informal dwelling. This could mean that electricity is a preferred energy source for cooking for larger households compared with gas and paraffin, which, for the most part, are well-regulated, and for which households are required to pay.
Table 3 shows estimation results for informal dwellings across the different energy types as shown in the respective models. In Table 3, only the coefficient for informal dwelling is positive (p < 0.05) in the paraffin model, implying that more informal dwellers use paraffin for cooking. These results could be explained by the easy access and affordable cost of paraffin, compared with electricity and gas. While wood would be another affordable option, the dense housing patterns in informal settlements may be triggering the need for caution related to the possibility of fire outbreaks. Moreover, wood is a solid biomass-based fuel source which is discouraged in SDG 7 [13,62].
The results for the rest of the other drivers are similar to the respective results in Table 2. For the level of higher education, the results still imply that as the level of higher education increases, the use of electricity and gas for cooking decrease and increase, respectively, in informal dwellings. Similarly, to the informal dwelling results (see Table 2), the results for the dependency ratio in the informal dwelling models show that the higher the dependency ratio, the less use there is of electricity for cooking and the more use there is of wood for cooking in the electricity and wood model, respectively. The results further show that as household size increases, there is more use of electricity and less of gas and paraffin for cooking. Similar suggestions as speculated under energy type for cooking in formal dwellings could explain the results related to energy types for cooking in informal dwellings. Mensah and Adu [84] found similar results for Ghana households in terms of household size and education level for different energy types.
Except for the coefficient of traditional dwellings, the rest of the estimation results for the various drivers of energy type use in traditional dwellings (see Table 4) are similar to the results in Table 2 and Table 3 that focused on formal and informal dwelling, respectively. The traditional dwelling coefficient, on the coefficients for gas in the gas model, is positive and significant (p < 0.05), implying that more traditional dwellers use more gas, and vice versa.

4.3.2. Energy Use for Lighting

This section focuses on the results where we regressed the three dependent variables—percentage who use electricity for lighting, percentage who use candles for lighting, and percentage who use solar for lighting—on the predictor variables in Table 1 in turn. The results are presented in Table 5, Table 6 and Table 7, respectively, for each of the dependent variables. All the results are robust since we estimated them under robust standard errors.
Table 5 shows estimation results for formal dwelling across the different energy types as shown in the respective models. The estimated models are weakly fitted, with the adjusted R2 ranging from about 10% to 15%. None of the drivers are statistically significant in the candles model. For the electricity model, formal dwelling is the only statistically significant driver of energy use for lighting. Being positive implies that as the percentage of formal dwellers increases, the use of electricity for lighting also increases, and vice versa. This is expected since formal dwellers have almost universal access to electricity infrastructure in the country. In the solar model, household size is the only statistically significant driver of energy use for lighting. Being a negative coefficient, it implies that as household size increases, the use of solar for lighting decreases. Several reasons could explain this result, primarily, the high cost related to the installation of solar infrastructure that, in some ways, hinders households with more members from investing in solar infrastructure. Exploratory results from the data show that households with more members are also likely to have higher dependency ratios, lower household incomes, and, coupled with higher energy requirements, all these household characteristics work to hinder such households to invest in solar infrastructures.
Table 6 presents results focusing on informal dwellings as the key variable of interest. The three estimated models have low adjusted R2. The electricity model has informal dwelling with a negative and statistically significant coefficient, implying that as the percentage of informal dwellers increases, their use of electricity for lighting decreases. This is expected since informal dwelling settlements have low to no access to electricity. In fact, the only access to electricity, in some instances, is through illegal connections. The positive and statistically significant coefficient for informal dwelling in the candles model is expected as well. It is in informal dwellings that inhabitants face low to no access to electricity, leaving candles as an easily accessible and cheap energy source for lighting. The coefficient for the percentage of informal dwelling in the solar model is similar to the coefficient in Table 5 (where the variable of interest was formal dwelling). The same explanations provided in the previous section apply here as well.
Table 7 presents results where the variable of interest is traditional dwelling. All the models have very low adjusted R2. It is only the solar model that has household size as the only driver of solar use for lighting. Like the results in Table 5 and Table 6, the same possible explanations provided in the previous sections apply here as well.

5. Discussion

The estimated results show that household size, dwelling type, high level of education and dependency ratio have significant influence on households’ energy choices. These results are consistent with those of Mothala et al. [28], who argue that higher income levels, education, and household size are the drivers of energy fuel choice in Lesotho. Thus, policies designed to promote household job creation, effective access to electricity, and investment in education can influence the choice of clean energy use within households. However, as suggested by [28] that these policies must be tailored to account for the unique characteristics of different dwelling types, this paper concurs, given the varying significance of these drivers across formal dwellings, informal dwellings, and traditional dwelling types.
In terms of household size, the results suggest that larger households are unlikely to prefer clean energy fuel to traditional fuels. Mensah and Adu [84] reached similar conclusions. This phenomenon can be attributed to the fact that a larger household size might struggle to have sufficient income to purchase clean energy besides all the other household basic needs. Özcan et al. [92] and Uhunamure et al. [29] suggest that large households often demand more energy compared with small households and therefore prefer unclean energy sources, which are less expensive.
For the dependency ratio, which proxy for income levels, the results show that households with a larger dependency ratio tend to prefer wood as an energy source. Sehjpal et al. [23] assert that households optimize their utility subject to their income level, and the increase in income level is likely to cause households to switch to other forms of energy source, such as electricity. Couture et al. [93] suggest that poor households tend to rely on wood for energy use, mainly in traditional settings. In our case, the dependency ratio finding suggests that the larger the dependency ratio, the less likely it is for the household to use electricity as an energy source, but more likely it is for the household to use wood. These findings are in line with the energy ladder model discussed above, which links the higher income households with cleaner energy choices.
Higher education is positive and statistically significant for gas as an energy of choice for cooking, while it is negative for electricity. This is expected since an increase in education level is likely to raise awareness of the health and environmental effects of using an unclean energy type [94]. However, [28] found results which are contradictory to our findings: upon disaggregation of dwelling types, [28] found that education is not important for the choice of electricity over others, such as traditional fuel for cooking. Note that in our case, the results suggest that higher education decreases electricity use for cooking.
Dwelling type significantly influences energy choices, with electricity favored for lighting in formal dwellings. The access to electricity correlates with an improved standard of living and therefore households that are connected to the electricity grid are likely to switch to clean energy for lighting. However, its adoption for cooking varies based on cost and income levels. Informal dwellings often opt for paraffin due to its affordability, reflecting the economic constraints faced by these households. Pueyo and Maestre [95] posit that electricity access to households is likely to raise household productivity since they can engage in income-generating activities. Nevertheless, [95] warn that traditional dwellers who face insufficient choices choose other traditional fuel sources over electricity. In informal dwellings, paraffin as an energy of choice for cooking is positive and significant. The majority of informal dwellers lack income sources and are likely to consume the cheapest form of energy available. Mothala et al. [28] obtained similar results for rural dwellers in Lesotho. In terms of lighting, candles are the only energy of choice in informal dwellings. This finding is plausible, since informal dwellers are more likely to use the cheapest and most easily accessible form of energy, which candles fit well.
With around 2.7 billion people depending on biomass to meet their basic household energy needs [24], coupled with the climate change challenge of reducing the temperature by 1.5 centigrade, broader understanding of the drivers of households’ energy choices in South Africa is timely [96]. The result of this paper reinforces the need for more investment in clean energy sources in South Africa. With results offering substantial policy implications, the paper also emphasizes the importance of tailored policies to promote job creation, enhance electricity accessibility, and invest in education, as these initiatives can sway households towards adopting cleaner energy options. Tailoring policies to the specific characteristics of different dwelling types is essential. For instance, larger households tend to prefer traditional fuels due to financial constraints, despite the potential interest in clean energy. The results suggest that households with higher dependency ratios lean towards wood as an energy source, showcasing the link between income levels and energy choices. Education emerges as a catalyst for cleaner energy choices, influencing preferences for gas while dissuading the use of electricity for cooking due to heightened awareness of health and environmental impacts. However, there are discrepancies in findings regarding education’s impact on electricity use for cooking across different dwelling types.
The study underscores the broader societal and environmental significance of understanding these drivers. With a considerable global population relying on biomass for energy needs, coupled with the imperative of mitigating climate change, the findings stress the urgency for increased investment in clean energy sources in South Africa.

6. Conclusions

This study provides a comprehensive exploration of the patterns and drivers of energy consumption in South African households, and highlights the challenges faced by both rural and urban communities in accessing clean and affordable energy. Despite South Africa’s vast potential for renewable energy, the persistent reliance on coal, especially in the context of rural communities, underscores the pressing need for sustainable energy development.
The results of this study provide significant support for the energy ladder and fuel stacking hypotheses. The varied coefficients for dwelling types across all energy sources suggest that different households adopt a variety of energy strategies based on their socio-economic and living conditions. This informed understanding of energy patterns contributes to the ongoing discussion on energy transition and calls for customized interventions that consider the context and specific needs of diverse communities. For instance, in the large swathe of the country, covering districts such as Vhembe and Mopani in Limpopo, eastern Mpumalanga, KwaZulu-Natal, and northern in Eastern Cape provinces, where wood is the predominantly used energy type for cooking, there is need for policies in these specific parts of the country to focus on eliminating the burning of wood fuels. Policies tailored through subsidies (in the paper, poverty was established as a significant predictor) and creating awareness of the benefits of using gas for cooking as a clean energy source are needed. At the household levels, implementing such policies will reduce indoor pollution and adverse effects, including respiratory and eye problems, on end users.
The similarity in results for all drivers across different dwelling types highlights the pervasive nature of certain factors influencing energy choices. Education levels, household size, and dependency ratios consistently emerge as key determinants, emphasizing the need for holistic policies that address these common drivers to promote sustainable energy practices.
Importantly, this study prompts considerations for future sustainable energy development in South Africa. The findings shed light on the need for, and importance of, policies that not only prioritize renewable sources, but also address the socio-economic factors and living conditions that influence energy choices. Informed by the results, it becomes imperative for policymakers to develop strategies that bridge the gap between the potential for renewable energy and the current reliance on coal, particularly in the context of varying dwelling types.
As a potential mechanism to enhance public welfare, this study suggests that the government could play a pivotal role in reducing fuel poverty by making energy more affordable. Such a measure has the potential to minimize public expenditure on healthcare, enhance education outcomes, and contribute to poverty reduction. By aligning energy policies with broader socio-economic objectives, South Africa can make significant strides toward a more sustainable and equitable future, and ultimately, enhancing the public welfare of its citizens.

Author Contributions

Conceptualization, K.C., E.L. and M.S.; methodology, K.C., E.L. and M.S.; data curation, K.C., E.L. and M.S.; writing—original draft preparation, K.C., E.L. and M.S.; writing—review and editing, K.C., E.L. and M.S. All authors have read and agreed to the published version of the manuscript.

Funding

This research received no external funding.

Institutional Review Board Statement

Not applicable.

Informed Consent Statement

Not applicable.

Data Availability Statement

Curated data is publicly available at https://census.statssa.gov.za/#/.

Conflicts of Interest

The authors declare no conflicts of interest.

References

  1. Folorunso, O.; Olukanmi, P.O.; Shongwe, T. Progress towards sustainable energy storage: A concise review. Eng. Rep. 2023, 5, e12731. [Google Scholar] [CrossRef]
  2. Ritchie, H.; Roser, M.; Rosado, P. Energy. Our World in Data. 2022. Available online: https://ourworldindata.org/energy (accessed on 10 December 2023).
  3. International Energy Agency, Energy Atlas. Available online: http://energyatlas.iea.org/tellmap/2020991907 (accessed on 10 June 2020).
  4. Jain, S.; Jain, P. The rise of renewable energy implementation in South Africa. Energy Procedia 2017, 143, 721–726. [Google Scholar] [CrossRef]
  5. CSIR (Council for Scientific and Industrial Research). Statistics of Utility-Scale Power Generation in South Africa. 2023. Available online: https://www.csir.co.za/sites/default/files/Documents/Statistics%20of%20power%20in%20SA%202022-CSIR-%5BFINAL%5D.pdf (accessed on 16 November 2023).
  6. Sardokie, S.A.; Adams, S. Electricity access and income inequality in South Africa: Evidence from Bayesian and NARDL analyses. Energy Strategy Rev. 2020, 29, 100480. [Google Scholar]
  7. Oyuke, P.H.; Penar, B.; Howard, B. Off-grid Or ‘off-On’: Lack of Access, Unreliable Electricity Supply Still Plague Majority of Africans. Afrobarometer Round 6 2016, 75, 1–26. [Google Scholar]
  8. U.S. Agency for International Development. Remarks by President Obama, June 2013. Available online: https://www.usaid.gov/powerafrica (accessed on 16 November 2023).
  9. United Nations, Sustainable Development Goals. Available online: https://sustainabledevelopment.un.org/index.php?page=view&type=400&nr=1579&menu=1300 (accessed on 16 November 2023).
  10. Nerini, F.F.; Tomei, J.; To, L.S.; Bisaga, I.; Parikh, P.; Black, M.; Borrion, A.; Spataru, C.; Castán Broto, V.; Anandarajah, G.; et al. Mapping synergies and trade-offs between energy and the Sustainable Development Goals. Nat. Energy 2018, 3, 10–15. [Google Scholar] [CrossRef]
  11. Agénor, P.R.; Moreno-Dodson, B. Public Infrastructure and Growth: New Channels and Policy Implications; World Bank Publications: Washington, DC, USA, 2006; Volume 4064. [Google Scholar]
  12. Brenneman, A.; Kerf, M. Infrastructure & Poverty Linkages. A Literature Review; The World Bank: Washington, DC, USA, 2002. [Google Scholar]
  13. Banerjee, R.; Mishra, V.; Maruta, A.A. Energy poverty, health and education outcomes: Evidence from the developing countries. Energy Econ. 2021, 101, 105447. [Google Scholar] [CrossRef]
  14. Bohlmann, J.A.; Inglesia-Lotz, R. Analysing the South African residential sector’s energy profile. Renew. Sustain. Energy Rev. 2018, 96, 240–252. [Google Scholar] [CrossRef]
  15. Blignaut, J.N.; De Wet, T. Some recommendations towards reducing electricity consumption in the South African manufacturing sector. S. Afr. J. Econ. Manag. Sci. 2001, 4, 359–379. [Google Scholar] [CrossRef]
  16. Ziramba, E. The demand for residential electricity in South Africa. Energy Policy 2008, 36, 3460–3466. [Google Scholar] [CrossRef]
  17. Inglesi, R. Aggregate electricity demand in South Africa: Conditional forecasts to 2030. Appl Energy 2009, 87, 197–204. [Google Scholar] [CrossRef]
  18. Inglesi-Lotz, R.; Blignaut, J.N. South Africa’s electricity consumption: A sectoral decomposition analysis. Appl. Energy 2011, 88, 4779–4784. [Google Scholar] [CrossRef]
  19. Inglesi, R.; Pouris, A. Forecasting electricity demand in south Africa: A critique of Eskom’s projections. S. Afr. J. Sci. 2010, 106, 50–53. [Google Scholar] [CrossRef]
  20. Inglesi-Lotz, R. The evolution of price elasticity of electricity demand in South Africa: A Kalman filter application. Energy Policy 2011, 39, 3690–3696. [Google Scholar] [CrossRef]
  21. Makonese, T.; Masekameni, D.M.; Annegarn, H.J. Energy use scenarios in an informal urban settlement in Johannesburg, South Africa. In Proceedings of the 2016 International Conference on the Domestic Use of Energy (DUE), Cape Town, South Africa, 30–31 March 2016; pp. 1–6. [Google Scholar]
  22. StatsSA (Statistics South Africa). 2022 Census; Statistics South Africa: Pretoria, South Africa, 2022. [Google Scholar]
  23. Sehjpal, R.; Ramji, A.; Soni, A.; Kumar, A. Going beyond incomes: Dimensions of cooking energy transitions in rural India. Energy 2014, 68, 470–477. [Google Scholar] [CrossRef]
  24. Rahut, D.B.; Das, S.; De Groote, H.; Behera, B. Determinants of household energy use in Bhutan. Energy 2014, 69, 661–672. [Google Scholar] [CrossRef]
  25. Acharya, B.; Marhold, K. Determinants of household energy use and fuel switching behavior in Nepal. Energy 2019, 169, 1132–1138. [Google Scholar] [CrossRef]
  26. Malakar, Y. Studying household decision-making context and cooking fuel transition in rural India. Energy Sustain. Dev. 2018, 43, 68–74. [Google Scholar] [CrossRef]
  27. Zou, B.; Luo, B. Rural household energy consumption characteristics and determinants in China. Energy 2019, 182, 814–823. [Google Scholar] [CrossRef]
  28. Mothala, M.; Thamae, R.; Mpholo, M. Determinants of household energy fuel choice in Lesotho. J. Energy S. Afr. 2022, 33, 24–34. [Google Scholar] [CrossRef]
  29. Uhunamure, S.E.; Nethengwe, N.S.; Musyoki, A. Driving forces for fuelwood use in households in the Thulamela Municipality, South Africa. J. Energy S. Afr. 2017, 28, 25. [Google Scholar] [CrossRef]
  30. Guta, D.D. Determinants of household adoption of solar energy technology in rural Ethiopia. J. Clean. Prod. 2018, 204, 193–204. [Google Scholar] [CrossRef]
  31. Nlom, J.; Karimov, A. Modelling fuel choice among households in Northern Cameroon. Sustainability 2015, 7, 9989–9999. [Google Scholar] [CrossRef]
  32. van der Kroon, B.; Brouwer, R.; van Beukering, P.J.H. The energy ladder: Theoretical myth or empirical truth? Results from a meta-analysis. Renew. Sustain. Energy Rev. 2013, 20, 504–513. [Google Scholar] [CrossRef]
  33. Rajmohan, K.; Weerahewa, J. Household energy consumption patterns in Sri Lanka. Sri Lankan J. Agric. Econ. 2007, 9, 55–77. [Google Scholar] [CrossRef]
  34. Hosier, R.H.; Dowd, J. Household fuel choice in Zimbabwe: An empirical test of the energy ladder hypothesis. Resour. Energy 1987, 9, 347–361. [Google Scholar] [CrossRef]
  35. Heltberg, R. Fuel switching: Evidence from eight developing countries. Energy Econ. 2004, 26, 869–887. [Google Scholar] [CrossRef]
  36. Leach, G. The energy transition. Energy Policy 1992, 20, 116–123. [Google Scholar] [CrossRef]
  37. Sathaye, J.; Tyler, S. Transitions in household energy use in urban China, India, the Philippines, Thailand, and Hong Kong. Annu. Rev. Energy Environ. 1991, 16, 295–335. [Google Scholar] [CrossRef]
  38. Smith, K.R.; Apte, M.G.; Yuqing, M.; Wongsekiarttirat, W.; Kulkarni, A. Air pollution and the energy ladder in Asian cities. Energy 1994, 19, 587–600. [Google Scholar] [CrossRef]
  39. Reddy, A.K.N.; Reddy, B.S. Substitution of energy carriers for cooking in Bangalore. Energy 1994, 19, 561–571. [Google Scholar] [CrossRef]
  40. Akpalu, W.; Dasmani, I.; Aglobitse, P.B. Demand for cooking fuels in a developing country: To what extent do taste and preferences matter? Energy Policy 2011, 39, 6525–6531. [Google Scholar] [CrossRef]
  41. Masera, O.R.; Saatkamp, B.D.; Kammen, D.M. From linear fuel switching to multiple cooking strategies: A critique and alternative to the energy ladder model. World Dev. 2000, 28, 2083–2103. [Google Scholar] [CrossRef]
  42. Akinbami, O.M.; Oke, S.R.; Bodunrin, M.O. The state of renewable energy development in South Africa: An overview. Alex. Eng. J. 2021, 60, 5077–5093. [Google Scholar] [CrossRef]
  43. Bekun, F.V.; Emir, F.; Sarkodie, S.A. Another look at the relationship between energy consumption, carbon dioxide emissions, and economic growth in South Africa. Sci. Total Environ. 2019, 655, 759–765. [Google Scholar] [CrossRef] [PubMed]
  44. Cohen, G.; Jalles, J.T.; Loungani, P.; Marto, R. The long-run decoupling of emissions and output: Evidence from the largest emitters. Energy Policy 2018, 118, 58–68. [Google Scholar] [CrossRef]
  45. Pollet, G.B.; Stafell, I.; Adamson, K. Current energy landscape in the Republic of South Africa. Int. J. Hydrog. Energy 2015, 40, 16685–16701. [Google Scholar] [CrossRef]
  46. Greenpeace. How Eskom & the Government Can Put an End to Loadshedding in South Africa. 2023. Available online: https://www.greenpeace.org/africa/en/blogs/53187/how-the-government-eskom-can-put-an-end-to-load-shedding/ (accessed on 16 November 2023).
  47. Department of Energy. National Energy Policy; Department of Energy: Pretoria, South Africa, 2018. [Google Scholar]
  48. StatsSA (Statistics South Africa). General Household Survey Report (P0318). 2021. Available online: https://www.statssa.gov.za/publications/P0318/P03182021.pdf (accessed on 16 November 2023).
  49. StatsSA (Statistics South Africa). General Household Survey. 2021. Available online: https://catalog.ihsn.org/catalog/11251 (accessed on 16 November 2023).
  50. Eberhard, A.; Kolker, J.; Leigland, J. South Africa’s Renewable Energy IPP Procurement Program: Success Factors and Lessons. 2014. Available online: https://www.gsb.uct.ac.za/files/PPIAFReport.pdf (accessed on 16 November 2023).
  51. Samuel, S.A.; Adams, S. Electricity access, human development index, governance and income inequality in Sub-Saharan Africa. Energy Rep. 2020, 6, 455–466. [Google Scholar]
  52. Shahbaz, M.; Khan, S.; Tahir, M.I. The dynamic links between energy consumption, multivariate framework analysis. Energy Econ. 2013, 40, 8–21. [Google Scholar] [CrossRef]
  53. Adams, S.; Klobodu, E.K.M.; Opoku, E.E.O. Energy consumption, political regime and economic growth in sub-Saharan Africa. Energy Policy 2016, 96, 36–44. [Google Scholar] [CrossRef]
  54. Bonan, J.; Pareglio, S.; Tavoni, M. Access to modern energy: A review of barriers, drivers and impacts. Environ. Dev. Econ. 2017, 22, 491–516. [Google Scholar] [CrossRef]
  55. The World Bank. The Sustainable Development Agenda and The World Bank Group: Closing He SDGs Financing Gap; World Bank Group: Washington, DC, USA, 2017; Available online: https://thedocs.worldbank.org/en/doc/259801562965232326-0270022019/original/2030Agenda2019finalweb.pdf (accessed on 16 November 2023).
  56. Sovacool, B.K. (Ed.) Energy, Poverty and Development; Routledge: London, UK, 2014. [Google Scholar]
  57. Dinkelman, T. The effects of rural electrification on employment: New evidence from South Africa. Am. Econ. Rev. 2011, 101, 3078–3108. [Google Scholar] [CrossRef]
  58. Bensch, G.; Gotz, G.; Ankel-Peters, J. Effects of Rural Electrification on Employment: A Comment on Dinkelman (2011). 2020. Available online: https://www.econstor.eu/bitstream/10419/214184/1/1690488735.pdf (accessed on 16 November 2023).
  59. Trotter, P.A. Rural electrification, electrification inequality and democratic institutions in sub-Saharan Africa. Energy Sustain. Dev. 2016, 34, 111–129. [Google Scholar] [CrossRef]
  60. Calderon, C.A.; Servén, L. The Effects of Infrastructure Development on Growth and Income Distribution. 2004. Available online: https://elibrary.worldbank.org/doi/abs/10.1596/1813-9450-3400 (accessed on 16 November 2023).
  61. Fan, S.; Zhang, L.; Zhang, X. Growth, Inequality, and Poverty in Rural China: The Role of Public Investments; International Food Policy Research Institute: Washington, DC, USA, 2002; Volume 125. [Google Scholar]
  62. Rao, N.D.; Pachauri, S. Energy access and living standards: Some observations on recent trends. Environ. Res. Lett. 2017, 12, 025011. [Google Scholar] [CrossRef]
  63. Kooijman-van Dijk, A.L.; Clancy, J. Impacts of electricity access to rural enterprises in Bolivia, 1389 Tanzania and Vietnam. Energy Sustain. Dev. 2010, 14, 14–21. [Google Scholar] [CrossRef]
  64. Kanagawa, M.; Nakata, T. Assessment of access to electricity and the socioeconomic impacts in rural areas of developing countries. Energy Pol. 2008, 36, 2016–2029. [Google Scholar] [CrossRef]
  65. Khandker, S.R.; Barnes, D.F.; Samad, H.A. Welfare impacts of rural electrification: A panel data analysis from Vietnam. Econ. Dev. Cult. Chang. 2013, 61, 659–692. [Google Scholar] [CrossRef]
  66. Andersen, T.B.; Dalgaard, C.J. Power outages and economic growth in Africa. Energy Econ. 2013, 38, 19–23. [Google Scholar] [CrossRef]
  67. SAPOA (South African Property Owners Association). The Impact of Load Shedding on the Commercial Real Estate Industry. Available online: https://propertywheel.co.za/2023/03/sapoa-survey-the-impact-of-load-shedding-on-the-commercial-real-estate-industry/ (accessed on 27 May 2023).
  68. Maji, I.J.; Sulaiman, C.; Abdul-Rahim, A.S. Renewable energy consumption and economic growth nexus: A fresh evidence from West Africa. Energy Rep. 2019, 5, 384–392. [Google Scholar] [CrossRef]
  69. Balmer, M. Energy poverty and cooking energy requirements: The forgotten issue in South African energy policy? J. Energy S. Afr. 2007, 18, 4–9. [Google Scholar] [CrossRef]
  70. Thom, C. Use of grid electricity by rural households in South Africa. Energy Sustain. Dev. 2000, 4, 36–43. [Google Scholar] [CrossRef]
  71. Barnes, D.F.; Toman, M.A. Energy, equity and economic development. In Economic Development and Environmental Sustainability: New Policy Options; Oxford Scholarship Online: Oxford, UK, 2006; pp. 245–272. [Google Scholar] [CrossRef]
  72. Sugrue, A. Energy for Sustainable Development, Presentation to the Parliamentary Portfolio Committee for Minerals and Energy. 9 March 2005. Available online: https://pmg.org.za/docs/2005/050309summary.doc (accessed on 11 November 2023).
  73. Lloyd, P. April. The energy profile of a low-income urban community. In Twenty-Second Domestic Use of Energy; IEEE: Piscataway Township, NJ, USA, 2014; pp. 1–6. [Google Scholar]
  74. Sustainable Energy Agency. State of Energy Report for Cape Town; SEA: Cape Town, South Africa, 2003. [Google Scholar]
  75. Davis, M. Rural household energy consumption: The effects of access to electricity—Evidence from South Africa. Energy Policy 1998, 26, 207–217. [Google Scholar] [CrossRef]
  76. Madubansi, M.; Shackleton, C.M. Changing energy profiles and consumption patterns following electrification in five rural villages, South Africa. Energy Policy 2006, 34, 4081–4092. [Google Scholar] [CrossRef]
  77. Annecke, W. An In-Depth Investigation of Fuel Use by Urban Women; Final Report Number EO9117; Department of Mineral and Energy Affairs: Pretoria, South Africa, 1994. [Google Scholar]
  78. Ross, F. Assessment of the Impact of Fuel Use on Residents of an Informal Settlement; Final Report; National Energy Council: Pretoria, South Africa, 1993. [Google Scholar]
  79. Mehlwana, M.; Qase, N. The Contours of Domesticity, Energy Consumption and Poverty: The Social Determinants of Energy Use in Low-Income Urban Households; Department of Minerals and Energy: Pretoria, South Africa, 1999. [Google Scholar]
  80. Westley, G.D. Electricity demand in a developing country. Rev. Econ. Stat. 1984, 66, 459–467. [Google Scholar] [CrossRef]
  81. Ayesha, A. The Impact of Electricity Outrages on Household. Ph.D. Thesis, University of Toronto, Toronto, ON, Canada, 2016. [Google Scholar]
  82. Marquard, A. The Origins and Development of South African Energy Policy. 2006. Available online: https://open.uct.ac.za/handle/11427/4963 (accessed on 10 December 2023).
  83. Churchill, S.A.; Smyth, R. Ethnic diversity, energy poverty and the mediating role of trust: Evidence from household panel data for Australia. Energy Econ. 2020, 86, 104663. [Google Scholar] [CrossRef]
  84. Mensah, J.T.; Adu, G. An empirical analysis of household energy choice in Ghana. Renew. Sustain. Energy Rev. 2015, 51, 1402–1411. [Google Scholar] [CrossRef]
  85. RSA (Republic of South Africa). Municipal Structures Act 1998; Government Printer: Pretoria, South Africa, 1998. [Google Scholar]
  86. ETU (Education & Training Unit). Understanding Local Government. 2023. Available online: https://www.etu.org.za/toolbox/docs/localgov/webundrstdlocgov.html (accessed on 16 November 2023).
  87. Stata. 2023. Stata Statistical Software. Available online: https://www.stata.com/ (accessed on 16 November 2023).
  88. Esri. GIS Mapping Software, Location Intelligence & Spatial Analytics ArcMap Software 10.8.2 ESRI. 2023. Available online: https://www.esri.com/en-us/home (accessed on 9 October 2023).
  89. Gujarati, D.N. Basic Econometrics, 4th ed.; McGraw-Hill: New York, NY, USA, 2003. [Google Scholar]
  90. Kahouli, S. An economic approach to the study of the relationship between housing hazards and health: The case of residential fuel poverty in France. Energy Econ. 2020, 85, 104592. [Google Scholar] [CrossRef]
  91. Sarkodie, S.A.; Adom, P.K. Determinants of energy consumption in Kenya: A NIPALS approach. Energy 2018, 159, 696–705. [Google Scholar] [CrossRef]
  92. Özcan, K.M.; Gülay, E.; Üçdoğruk, Ş. Economic and demographic determinants of household energy use in Turkey. Energy Policy 2013, 60, 550–557. [Google Scholar] [CrossRef]
  93. Couture, S.; Garcia, S.; Reynaud, A. Household energy choices and fuelwood consumption: An econometric approach using French data. Energy Econ. 2012, 34, 1972–1981. [Google Scholar] [CrossRef]
  94. Behera, B.; Rahut, D.B.; Jeetendra, A.; Ali, A. Household collection and use of biomass energy sources in South Asia. Energy 2015, 85, 468–480. [Google Scholar] [CrossRef]
  95. Pueyo, A.; Maestre, M. Linking energy access, gender and poverty: A review of the literature on productive uses of energy. Energy Res. Soc. Sci. 2019, 53, 170–181. [Google Scholar] [CrossRef]
  96. Alfredsson, E.; Bengtsson, M.; Brown, H.S.; Isenhour, C.; Lorek, S.; Stevis, D.; Vergragt, P. Why achieving the Paris Agreement requires reduced overall consumption and production. Sustain. Sci. Pract. Policy 2018, 14, 1–5. [Google Scholar] [CrossRef]
Figure 1. District Municipalities across provinces in South Africa. Data Source: Municipal Demarcation Board (MDB). Notes: District Municipalities: 1. Alfred Nzo; 2. Amathole; 3. Buffalo City; 4. Chris Hani; 5. Joe Gqabi; 6. Nelson Mandela Bay; 7. O.R. Tambo; 8. Sarah Baartman; 9. Fezile Dabi; 10. Lejweleputswa; 11. Mangaung; 12. Thabo Mofutsanyane; 13. Xhariep; 14. City of Johannesburg; 15. City of Tshwane; 16. Ekurhuleni; 17. Sedibeng; 18. West Rand; 19. Amajuba; 20. eThekwini; 21. Harry Gwala; 22. iLembe; 23. King Cetshwayo; 24. Ugu; 25. uMgungundlovu; 26. uMkhanyakude; 27. uMzinyathi; 28. uThukela; 29. Zululand; 30. Capricorn; 31. Mopani; 32. Sekhukhune; 33. Vhembe; 34. Waterberg; 35. Ehlanzeni; 36. Gert Sibande; 37. Nkangala; 38. Bojanala; 39. Dr Kenneth Kaunda; 40. Dr Ruth Segomotsi Mompati; 41. Ngaka Modiri Molema; 42. Frances Baard; 43. John Taolo Gaetsewe; 44. Namakwa; 45. Pixley ka Seme; 46. Z.F. Mgcawu; 47. Cape Winelands; 48. Central Karoo; 49. City of Cape Town; 50. Garden Route; 51. Overberg; 52. West Coast.
Sustainability 16 00682 g001
Figure 2. Proportion (%) of energy for cooking (a) and energy for lighting (b). Data Source: StatsSA (2022).
Sustainability 16 00682 g002
Figure 3. Scatterplots for formal, informal, and traditional dwellers and types of energy sources for cooking. Source: StatsSA (2022): Author’s own compilation.
Sustainability 16 00682 g003
Table 1. Univariate statistics of model variables.
VariablesNMeanStd. Dev.MinMax
Dependent variables
Cooking with electricity (%)5266.6299.15634.881.5
Cooking with gas (%)5223.0656.65413.845
Cooking with paraffin (%)522.1081.57207.1
Cooking with wood (%)527.51310.218050.6
Electricity for lighting (%)5294.5622.02790.198.5
Candles for lighting (%)523.2421.5920.78.1
Solar for lighting (%)520.8330.90905
Explanatory variables
Formal dwelling (%)5287.8716.2366.298.8
Informal dwelling (%)526.95.2270.626.4
Traditional dwelling (%)524.8547.104030.4
Level of higher education (%)529.7753.7135.122.2
Household size523.8150.7032.65.7
Dependency ratio5253.499.35736.873.7
Table 2. Estimation results of energy for cooking in formal dwellings.
VariablesElectricity ModelGas ModelParaffin ModelWood Model
Formal dwelling0.119−0.342 ***−0.083 ***0.313
(0.188)(0.108)(0.025)(0.250)
Highest level of education−0.952 ***0.454 **0.0770.508
(0.330)(0.199)(0.081)(0.369)
Household size5.431 ***−4.722 ***−1.288 ***0.490
(1.992)(1.503)(0.267)(1.731)
Dependency ratio−0.787 ***−0.0720.0200.868 ***
(0.216)(0.090)(0.027)(0.273)
Constant86.885 ***70.501 ***12.528 ***−73.247 **
(27.360)(14.596)(4.063)(34.122)
Observations52525252
R2 0.3320.4930.3570.457
Adj. R20.2750.4500.3030.411
Notes: Robust standard errors in parentheses; *** p < 0.01, ** p < 0.05.
Table 3. Estimation results of energy for cooking in informal dwellings.
VariablesElectricity ModelGas ModelParaffin ModelWood Model
Informal dwelling0.1320.1100.087 ***−0.340
(0.191)(0.097)(0.031)(0.245)
Highest level of education−0.991 ***0.514 **0.0850.478
(0.327)(0.225)(0.078)(0.342)
Household size5.362 **−3.781 ***−0.967 ***−0.734
(2.003)(1.403)(0.262)(2.244)
Dependent ratio−0.791 ***−0.0090.0410.787 ***
(0.188)(0.114)(0.027)(0.242)
Constant97.259 ***32.217 ***2.160−34.096 ***
(10.359)(6.992)(2.220)(10.340)
Observations52525252
R2 0.3310.4110.3350.451
Adj. R20.2740.3610.2780.405
Notes: Robust standard errors in parentheses; *** p < 0.01, ** p < 0.05.
Table 4. Estimation results of energy for cooking in traditional dwellings.
VariablesElectricity ModelGas ModelParaffin ModelWood Model
Traditional dwelling−0.2220.279 ***0.023−0.080
(0.134)(0.102)(0.028)(0.168)
Highest level of education−0.951 ***0.492 **0.0910.453
(0.308)(0.201)(0.085)(0.349)
Household size6.011 ***−5.017 ***−1.186 ***0.087
(2.116)(1.533)(0.274)(1.879)
Dependent ratio−0.749 ***−0.0900.0270.841 ***
(0.210)(0.103)(0.032)(0.286)
Constant94.154 ***40.856 ***4.211−41.856 ***
(12.135)(7.522)(2.551)(13.799)
Observations52525252
R2 0.3450.4620.2700.428
Adj. R20.2900.4160.2080.379
Notes: Robust standard errors in parentheses; *** p < 0.01, ** p < 0.05.
Table 5. Estimation results of energy use for lighting in formal dwellings.
VariablesElectricity ModelCandles ModelSolar Model
Formal dwelling0.120 **−0.052−0.047
(0.053)(0.036)(0.029)
Highest level of education0.154−0.151−0.034
(0.114)(0.097)(0.034)
Household size0.5960.101−0.555 **
(0.675)(0.556)(0.243)
Dependency ratio−0.004−0.0120.030
(0.040)(0.030)(0.023)
Constant80.396 ***9.524 **5.767 **
(5.864)(4.299)(2.495)
Observations525252
R2 0.1880.1680.220
Adj. R20.1190.0970.154
Notes: Robust standard errors in parentheses; *** p < 0.01, ** p < 0.05.
Table 6. Estimation results of energy use for lighting in informal dwellings.
VariablesElectricity ModelCandles ModelSolar Model
Informal dwelling−0.150 ***0.103 ***0.045
(0.041)(0.032)(0.039)
Highest level of education0.145−0.151−0.029
(0.123)(0.096)(0.040)
Household size0.0950.374−0.381 **
(0.554)(0.468)(0.186)
Dependency ratio−0.0370.0060.042
(0.051)(0.035)(0.030)
Constant95.796 ***2.2640.012
(3.457)(2.473)(1.704)
Observations525252
R20.1960.2290.188
Adj. R20.1270.1630.119
Notes: Robust standard errors in parentheses; *** p < 0.01, ** p < 0.05.
Table 7. Estimation results of energy for lighting in traditional dwellings.
VariablesElectricity ModelCandles ModelSolar Model
Traditional dwelling−0.015−0.0210.015
(0.057)(0.032)(0.032)
Highest level of education0.131−0.138−0.027
(0.130)(0.104)(0.037)
Household size0.3810.298−0.508 **
(0.683)(0.551)(0.218)
Dependency ratio−0.0180.0010.034
(0.049)(0.035)(0.028)
Constant92.858 ***3.5191.156
(3.576)(2.811)(1.088)
Observations525252
R2 0.0710.1380.140
Adj. R2−0.0080.0650.067
Notes: Robust standard errors in parentheses; *** p < 0.01, ** p < 0.05.
Disclaimer/Publisher’s Note: The statements, opinions and data contained in all publications are solely those of the individual author(s) and contributor(s) and not of MDPI and/or the editor(s). MDPI and/or the editor(s) disclaim responsibility for any injury to people or property resulting from any ideas, methods, instructions or products referred to in the content.

