1. Introduction
The building sector is recognised as one of the largest contributors to energy consumption and is accountable for over one-third of greenhouse gas emissions (GHG emissions) in the European Union. Approximately 50% of the total final energy consumption in the European Union is attributed to space heating and cooling [
1]. Faced with the significant challenge of achieving decarbonisation by 2050, the retrofitting of the building stock and the implementation of renewable energies are considered to be key measures for reducing the carbon emissions linked to this sector [
2].
In recent years, the focus of building retrofitting strategies has shifted from individual building interventions towards an emphasis on building clusters on the neighbourhood, district, or city scale. One example in this line is the “Renovation Wave”, a strategy promoted by the European Commission that aims to double the annual energy renovation rates over the next 10 years [
3]. One of the pillars of this strategy is to provide new tools and mechanisms to encourage the large-scale renovation of existing buildings, as well as to promote the use of distributed renewable energy sources. Therefore, the district or neighbourhood is identified as a more effective intervention level to accelerate the reduction in energy consumption in the building sector. Even though this approach is not without its barriers and challenges, it leverages economies of scale and potential synergies amongst different buildings, accelerates the process, and facilitates the integration of renewable energy technologies [
4].
In this context, building models play a key role in planning an efficient retrofitting of the built stock, acting as tools to estimate the building energy performance and the impacts derived from different energy renovation actions, while identifying the optimal or most adequate strategies in each case. When it comes to models in general, and models aimed at assessing the thermal performance in buildings in particular, three fundamental modelling techniques can be identified: white, grey and black box models. The first, white box models, are based on an in-depth understanding of the physical phenomenon being analysed [
5]. This approach has gained widespread acceptance within the building industry and is incorporated into various software applications, including EnergyPlus and TRNSYS [
6,
7]. This software requires a substantial number of building parameters, encompassing for instance the building envelope thermal–physical characteristics, occupancy, or schedules [
8].
In contrast to white box models, the black box models have undergone a significant evolution through the incorporation of artificial intelligence and machine learning, which are used to assess the building energy demand [
6]. These models involve the use of pre-existing datasets from building databases, which are processed by algorithms to uncover hidden patterns or correlations for the prediction of a building’s energy demand. Consequently, the accuracy of the predictions relies on such factors as the selection of algorithms and the quality and quantity of the input data [
6,
7]. In the field of energy demand quantification, black box models frequently use such parameters as building geometry, envelope characteristics, building operation, and system configuration as the input variables for modelling.
Finally, grey box models represent a combination of white and black box models, integrating a simplified physical model with readily available data to simulate building energy demand. This approach combines the strengths of both white and black box methodologies [
9]. Commonly employed input variables encompass building envelope thermal–physical characteristics [
10], HVAC systems or internal gains, to mention just a few examples [
6,
11]. An interesting and comprehensive review of the different approaches of modelling techniques can be found in the work presented by Swan and Ugursal in [
12], where a critical review of the various modelling techniques used to model the energy consumption of the residential sector is provided, focusing on the strengths, shortcomings and purposes.
In this regard, data used to feed these models, irrespective of the model type, play a key role in the results they yield. Additionally, as previously mentioned, within a context where the energy transition in general, and urban energy transitions in particular, there has been a growing interest in using urban or regional scales for the quantification of the energy demand in buildings. This requires, besides building models to determine the performance of the building stock and quantify the potential impact of different interventions to prioritise actions, agile methods to systematically collect and organise relevant data of the building stock required to feed whatever model is used. To accomplish this, the geometric and thermal characteristics of the building must be defined in a streamlined yet sufficiently precise manner, as the parameters established will have a direct influence on the results obtained.
Thus, based on the need to obtain heat maps on an urban scale by providing different types of building energy models with a limited number of variables, two main research questions are raised in this study: (1) Can the required data be acquired in an automated manner so as to contribute to feeding the district-scale models? And (2) what input variables should be considered?
Thus, to address these research questions, the rest of the paper is organised as follows:
Section 2 provides a comprehensive review of the current state of the art, delving into the literature to identify key parameters that are usually required for district-scale energy demand calculation. In
Section 3, the methodology developed to define the parameters in an automated way is introduced. In
Section 4, the implementation of the methodology into a real case study is presented, describing the case study selected and the general assumptions and specificities considered in it. In
Section 5, the main results and the errors obtained in the aforementioned implementation are presented. In
Section 6, the discussion of the results is addressed and, finally, the main conclusions of the research work are presented in
Section 7.
2. Identification of Characteristic Parameters for Calculating Energy Demand: State of the Art
In order to guarantee the feasibility and effectiveness of an automated data acquisition process and its future usability as a support for the input data of district-scale energy models, a literature review was conducted. To provide a summary of the extracted data, the main objectives, geographical scopes, main applied methods, data sources, and identified variables in each research work were collected and analysed.
Within the literature, different categories of studies can be identified. Some have concentrated on acquiring and defining data for use in energy demand models, enabling the assessment of buildings’ energy performance and the planning of energy refurbishments on an urban scale [
13,
14,
15,
16,
17,
18,
19,
20,
21]. In contrast, other authors determine variable values for different objectives, such as (a) defining classifications for existing buildings to guide future research into buildings’ performance and refurbishment [
22,
23,
24,
25], (b) evaluating the performance of a specific building typology [
20], (c) presenting and quantifying recurring physical elements in different cities [
26], (d) diagnosing the obsolescence of social housing envelopes [
27], (e) assessing the evolution of national building energy codes through energy simulation, (f) studying the envelope of buildings for future energy refurbishment [
27], (g) defining building stock characteristics by analysing Energy Performance Certificates (EPCs) [
28], or (h) obtaining representative parameters of the building envelope [
29,
30].
As mentioned above, several authors have focused on methods aimed at data collection (such as geometric and thermal parameters) as a step prior to assessing the energy performance of the building stock on an urban scale. To do that, different approaches can be found in the literature. Martín-Consuegra et al. [
13] explore the use of cadastral data for energy retrofit planning on an urban scale in Madrid. Yang et al. [
14] use the Geographic Information System (GIS) to extract building data to calculate space heating energy for residential buildings in the Netherlands. Fernandez et al. focus on characterising the residential stock of Bilbao [
31] and analysing the technical and economic aspects of energy efficiency measures and homeowners’ decision making processes regarding dwelling refurbishment. Additionally, Prades-Gil et al. [
18] develop an agile model of heating and cooling energy demand in residential buildings in Valencia. Abolhassani et al. [
32] automatically extract, collect, and pre-process energy-related parameters from open data to provide input for Urban Building Energy Models (UBEM). They present a methodology for assigning building characteristics to building surfaces and thermal zones based on an automated archetype selection. Wurm et al. [
33] generate detailed input data for urban building energy modelling using Earth observation data and aerial images on the city scale. Kamel [
34] extracts, categorises, and analyses tools, file schemas, data sources, building systems, and environmental data in physics-based UBEM case studies. Hosseini Haghighi et al. [
35] engage in processing GIS data by employing a multilevel approach to spatial data integration and refinement, addressing identified inconsistencies within building databases. Wang et al. [
36] evaluate suitable approaches to acquire data for the UBEM across four data inputs, drawing insights from disciplines that include building science, geography, transportation, and computer science. Pasichnyi et al. [
37] introduce a methodology that leverages comprehensive datasets to create distinct building archetypes tailored to specific urban energy challenges. Chen et al. [
38] present the data requirements, standards, and sources necessary to formulate city building datasets for the UBEM.
Similarly, the TABULA project [
15] assigns building typologies to the building stock of 13 European countries based on such parameters as size and age, estimating their energy characteristics and potential energy savings through refurbishment. Lastly, the ENTRANZE project [
16] works on scenarios and recommendations for building characteristics to support policy formulation.
The majority of the studies evaluated were conducted in Spanish regions [
13,
17,
18,
19,
20,
22,
26,
27,
39], with four research works in European countries: the Netherlands [
14], Austria [
28], Ireland [
29], and Italy [
21]. Two other authors extended their research to various European locations [
15,
16]. Additionally, as far as the methods are concerned, 60% of the analysed studies obtained the parameter values using automated methods [
13,
14,
17,
18,
20,
21,
28,
29,
39], while the remainder used manual methods [
15,
16,
19,
22,
26,
27].
Regarding data acquisition, researchers drew from diverse sources depending on the region analysed. The update frequency of data varies depending on the sources. For instance, while the Spanish Cadastre continuously updates cadastral plot data, and the dataset download for each municipality is refreshed approximately every six months, the Bizkaia Cadastre updates municipality data on a monthly basis. Concerning the reliability of data, it is assumed that cadastral data or Lidar data are generally accurate, although some data may exhibit a range of errors or ambiguity. Nevertheless, the reliability of EPCs depends on the rigour of the technician conducting them, as well as the Quality Control system for EPCs established in the evaluated region [
40].
As far as the data sources are concerned, the most frequently used data source for building characterisation is cadastral data, with one-third of the analysed research using this source [
13,
14,
17,
18,
26]. Thermal characteristics are often determined alongside the geometric parameters derived from cadastres. Some researchers [
14,
16,
18,
19,
28] set these parameters using the TABULA database. Others used samples of characteristic buildings [
13,
15,
22,
26,
27], while Zabalza et al. defined the parameters based on Building Energy Codes [
39].
The use of EPCs to determine the energy demand of the building stock on an urban scale has also been explored. Some studies obtain energy demand data directly from EPCs [
41,
42], while others use the itemized data to define the geometric and thermal characteristics that are used later to calculate the demand [
21,
28,
29]. Nevertheless, it should also be noted that the accuracy and reliability of the information from EPCs is the subject of discussion in several studies [
37,
40,
43,
44].
Finally, some researchers take values from the literature reviews as a reference [
21,
28,
29] in order to compare them with those obtained from EPCs; while others employ LiDAR altimetric datasets [
18], the AVRA database [
20], data from the National Statistics Institute [
26], or such sources as Odysee, the Building Performance Institute Europe, Eurostat, The European Union of House Builders and Developers (UEPC), and national sources [
16].
Regarding the listing of the variables analysed by the aforementioned researchers, a variety of significant geometric and thermal variables are defined that prove valuable in calculating the energy demand of buildings. In order to focus on the most influential parameters that are not readily available from open databases, a selection of variables to be considered is presented below.
As previously explained, this study aims to define the geometric and thermal characteristics of buildings, focusing on the potential use of these data as input in building models for calculating the energy demand in buildings. The quantification of this energy demand can be calculated based on different input parameters. Given the intricate nature of building energy balances, the input data may vary between projects, showing different levels of influence on building energy demand and, as a result, demonstrating the key role that the criteria used for defining those input parameters can play. The way of determining them varies significantly: some works use machine-learning algorithms to support the assessment of the influence of different parameters; while other works rely on the fundamentals of building physics for this selection.
In the present study, the focus is on establishing values for the categories of building geometry and envelope features. The parameters to study include the window-to-wall ratio, U-values (thermal transmittance), the g-value (solar factor of the glazing area), ventilation and infiltration losses, and internal gains.
A review of the aforementioned six parameters has been conducted in the analysed literature. Amongst these parameters, the U-value is the most frequently determined, followed by the window-to-wall ratio and infiltration losses. Other parameters, such as the g-value, ventilation losses or internal gains are less frequent in the research works evaluated. A summary of the variables examined in each research work, including the fixed values for each parameter, is included in
Tables S1–S6 within the associated data repository for this study [
45]. Among the studies found in the literature, Martin-Consuegra et al. [
13] was the only one that established values for all the parameters collected in this literature review.
To determine the values for each geometric and thermal parameter, different methods to define each variable and the chosen values for each parameter are studied. It should be noted, in this regard, that the majority of the geometrical parameters can be directly obtained from cadastres, through processes that are generally not overly complex, except for the window-to-wall ratio, for which there is no information available in the majority of the cadastral registers. In contrast, thermal parameters represent features with a higher degree of uncertainty since, in many cases, they are not directly obtained, but can be fixed using the available open data only after assuming some hypothesis and simplifications that directly affect the uncertainty level of the obtained parameters. Therefore, despite presenting both categories, the emphasis is more on the study of thermal parameters. For estimating the surface area of openings on an urban scale, the studies analysed propose different methods: giving the values from the TABULA project [
14] as a reference, analysing samples [
13,
26,
27], or automating the geometry acquisition [
46]. The values for window–to-wall ratio typically range between 10% and 50%.
U-values, the g-value, ventilation and infiltration losses, and internal gains are all explored in the definition of thermal characterisation. It could be assumed that there is a link between the thermal transmittance of building elements, the U-value, and the construction year. The connection has also been explored in other previous studies (e.g., [
13]). When dealing with buildings constructed in Spain between 1940 and 1980, different U-values by region are not significant, as the construction solutions during that period were largely uniform (in terms of thermal performance) for all Spanish cities in general, regardless of the location. This standardisation was, to some extent, due to the specific regulation of social housing and the lack of industrialisation in construction, which led to standardised solutions and the massive-scale construction of peripheries under functional urbanism models [
26]. It should also be noted that neither do differences rise when social and private housing are compared [
47]. The assignment of U-values to each element of a building envelope according to its construction period is done under different criteria, including the analysis of samples from the city of application [
13,
22,
27], or adherence to building energy codes corresponding to each climatic zone [
39].
Regarding g-values, studies referring to the solar g-value of glazing [
13,
15,
19] generally set the value between 0.65 and 0.82; while regulations specify a value of 0.85 for standard single glazing and 0.75 for insulating double glazing and standard double glazed windows in the case of residential buildings [
48].
Ventilation and infiltration rates are two of the most challenging parameters, as they depend, to a great extent, on the occupant’s behaviour in the dwellings. There is no uniform classification of the ventilation rate based on the building’s construction period, use, or location [
49]. Likewise, estimating infiltration losses on a large scale is complex because it depends on the airtightness of the building envelope, which can vary depending on its state of preservation. Martín-Consuegra et al. [
13] refer to ISO 13790 [
50] standards to define total ventilation losses, which suggest a minimum standard ventilation flow rate of 0.3 air changes per hour (ACH). For dwellings without a forced ventilation system, the values depend on the number of exposed façades (one or more), wind exposure (none, moderate, high), and airtightness (low, medium, high). For moderate exposure, values range from 0.5 to 0.9 ACH. Spanish regulations, specifically the LIDER-CALENER Unified Tool (HULC) [
51], propose a default value of 0.63 ACH for residential buildings. Zabalza et al. [
39] define these values based on the year of construction and building typology. For the period from June to September, between 01:00 to 08:59, they assume that windows will be open, corresponding to four ACH. For the rest of the year, they are defined according to the year of construction and building typology, taking into account updates to the Basic Document on Health and Safety of the CTE. For periods prior to 1979, they assume the default value of 0.63 ACH, as specific regulations regarding air renewal were not yet established. Regarding infiltration losses, the studies analysed assign values based on different criteria, including: (a) determining the air change rate by infiltration according to the building classification and year of construction as defined in TABULA [
14,
18]; (b) assuming the infiltration rate value set by the Andalusian Housing and Rehabilitation Agency (AVRA) [
20]; (c) referencing the results of Blower Door tests [
17]; or (d) relying on the doctoral thesis of Rodríguez Trejo [
52] that characterises the ventilation in existing residential buildings. Values for infiltration losses typically range from 0.10 to 1.00 ACH.
As far as internal gains are concerned, only one paper has been found where they are taken into consideration [
53]. In this case, to determine internal gains, Martín-Consuegra et al. refer to the value specified in Annex K.2 [
54] for internal gains in continuously occupied buildings, which is 4 W/m
2.
In short, the studies analysed define the geometric and thermal characteristics of buildings on a neighbourhood, district or city scale, using both manual and automated methods. The principal databases employed to establish parameter values encompass cadastres, TABULA, building energy codes, and EPCs, as well as various sources such as samples (which include monitoring and measurements from original plans), LiDAR altimetry dataset, AVRA databases, data from the National Statistics Institute, and such sources as Odysee, Building Performance Institute Europe, Eurostat, and The European Union of House Builders and Developers (UEPC). Notably, the variables of interest for this research piece include the window-to-wall ratio, U-values, g-value, ventilation and infiltration losses, and internal gains. The literature review reveals that, despite encountering several studies addressing topics within the scope of the present research work, there is no established and systematic procedure for characterising, in a detailed and systematized way, the geometric and thermal characteristics of residential stocks in diverse climatic zones. Thus, this research work covers the gap of assigning features to buildings on an urban scale in a systematic and comprehensive manner. Furthermore, it not only incorporates features already discussed in previous studies but also introduces new elements, such as the south equivalent surface, which has not been considered in previous urban-scale research projects.
Thus, based on this literature review, the primary objective of this research is to systematically characterise the geometric and thermal aspects of buildings at neighbourhood, district or city scale, based on open data, with a view to subsequent use as input data for different building energy models. The secondary objectives include (a) identifying the most relevant characteristic parameters, (b) identifying suitable databases (such as cadastres or EPCs), (c) evaluating the implementation of the methodology in a specific case study, and (d) validating the obtained results.
3. Materials and Methods
Based on the literature review presented in the previous section, a procedure is proposed with the aim of characterising buildings geometrically and thermally on an urban scale in an automated manner. The methodology developed systematically characterises the geometric and thermal aspects of the building stock on an urban scale using open data and QGIS. However, it should be noted that the project necessarily involves certain simplifications and assumptions, leading to the following limitations:
The construction period of the building stock is determined considering the most recent year of construction or renovation recorded in the cadastre. This date provides the moment when the building was registered in the cadastre, but not the year when the project was officially approved, which defines the regulations and related requirements to be met and, consequently, the thermal characteristics of its components.
Buildings are not categorised by building typology for assigning characteristics; the sole category is the year of construction or refurbishment.
Unconditioned areas of the buildings are not taken into account.
The method for calculating façade surface areas is simplified, omitting projections on the horizontal plane.
A uniform percentage of openings is defined for all orientation façades and the construction period.
Ventilation losses are calculated under the assumption that ventilation remains consistent in both summer and winter and during both day and night.
Internal gains are considered continuous.
The considered parameters include: (a) the roof, façade, and façade openings’ surface areas by orientation; (b) the U-values of the construction elements; (c) the solar g-value of the glazing; (d) the air renovations by ventilation and infiltration; and (e) the internal gains. These parameters enable the calculation of the south equivalent surface (SES) and overall thermal conductance (UA).
Some parameter values are obtained from cadastres, while others are determined based on values used in previous studies or regulation. The remaining values are derived from measurements of original plans gathered from various archives. The process of obtaining values to define these parameters is summarised in
Figure 1 and further elaborated in the following subsections. The information in the figure is organised into four columns (databases, processes, obtained data, and case study). In the white boxes, the database sources used in the methodology are listed; while in the grey boxes, the processes applied to the input data and the parameters obtained from them are presented. The light grey boxes correspond to those associated with the application of the methodology, and the dark grey boxes pertain to validation. The parameters defined by the methodology are presented in blue and orange capital letters. The geometric parameters obtained to define the building stock are in blue, and the thermal parameters are in orange. The parameters obtained from EPCs and audits, which are used for validation, are in black.
3.1. Database Analysis
When characterising the geometry and thermal properties of buildings, various databases offer diverse information sources, including cadastral data, digital surface models (DSMs), Energy Performance Certificates (EPCs), Building Energy Codes, the TABULA project database, and studies developed by other researchers. To define the boundaries in the analysis of the employed database, the decision was made to shift from a global scale to focus on the level of the Spanish state.
Cadastral data are employed to define the geometry of the buildings. The choice of the specific cadastre depends on the region under analysis, each of which presents varying levels of information in different formats. Some cadastres combine graphical and alphanumeric information, while others keep them separate.
Determining building heights can be achieved by making assumptions about the height per floor or by extracting that information directly from Digital Surface Models (DSMs). DSMs are digital models of the terrain or rooftop surfaces created from elevation data, offering a more accurate means of determining buildings’ heights compared to estimating them based on the number of floors. The floor height of a building depends on its typology, so there will be differences between buildings located in different districts or construction periods. As the second option (DSMs) provides a method with a lower level of uncertainty, the main limit is related to the frequency of the updates of the data source, such as the National Geographical Institute (CNIG). In this context, the latest available data are from 2012, and buildings constructed after that date may have incomplete data, or even data unrelated to the building under study, but to the previous, already demolished, buildings. Additionally, it should be noted that, for the sake of clarity and with the aim of proposing a more generalised methodology, a source at national level (CNIG) is proposed. However, other similar sources can be found at regional level and, depending on the region, with more frequently updated data.
When establishing the values of the parameters for defining the energy demand of buildings, EPCs are analysed. Obtaining specific values for each building could provide more realistic data as compared to estimating values for different clusters of buildings. However, a limitation of EPCs is that not all the disaggregated data for individual EPCs is available in open databases. In most autonomous communities of Spain, the total energy demand value is provided, but the breakdown of the parameters determining it is not included. Furthermore, the reliability of EPCs depends on the diligence of the technician conducting them.
For assigning thermal characteristics to the building stock, databases such as TABULA can be consulted, or Building Energy Codes can also be used to determine reference values. The TABULA project is a European initiative offering the energy characteristics of building clusters and potential energy savings through the implementation of refurbishment measures for 13 countries, including Spain. The building construction periods are categorised according to the application of new construction techniques. The strength of these studies lies in the fact that they are based on real measurements; but they also have limitations in that they do not provide specific data for all the climatic zones within each country, and the values must be established using general values per country.
3.2. Variable Identification for the Calculation of Energy Demand
The studies analysed in
Section 2 focus on different building parameters. In this study, the challenge involves obtaining a few data for multiple buildings rather than a large amount of data for one single building. Therefore, the application of building physics is employed to identify which parameters are more relevant in the energy demand of buildings and to determine their values using data obtained from publicly available sources (primarily cadastres, the TABULA project, and Building Energy Codes).
Thus, the total energy demand of a given building n (EnD,
n) in a given period of time (e.g., a year) can be determined by summing the requirements for domestic hot water (DHW
needs,n), heating and/or cooling demand (Q
heat/cool,n) and electricity demand for other uses (El
,n). While DHW
needs,n and El
,n can be estimated based on the building use (they are not significantly affected by the specific building features or even weather conditions), the determination of heating and/or cooling demand is a more intricate aspect, since it is strongly dependant on the building features. To arrive at its value, various forms of heat transfer must be considered. As shown in a simplified way in Equation (2), the calculation of the building’s heating and/or cooling demand (Q
heat/cool,n) involves estimating the heat transfer through the building envelope (Q
Env), the ventilation (Q
Vent) and infiltration (Q
Inf) loads, and the effect of solar (Q
s) and internal gains (Q
i). This process requires the simplification of certain characteristics and the formulation of specific assumptions.
Once the energy demand for a given building has been estimated, the energy consumption could be obtained by considering the energy performance values of the energy systems. Considering these bases, the parameters required for calculating these thermal loads in buildings (and, in the end, energy consumption) are basically categorised into two primary groups: geometrical characteristics and thermal characteristics. The first group includes the surface areas of the different elements of the envelope (roof, windows and walls), and the orientation of the opening areas. The second group includes the U-values for the different elements of the building envelope, as well as the glazing solar g-value, the ventilation and infiltration losses, and the internal gains.
3.3. Geometric Characterisation
Regarding the geometric characterisation, this is carried out by processing open data to plots of land in shape format sourced from the cadastres. These repositories retain the geometric information regarding the building elements within each municipality. While certain characteristics are directly defined from this dataset, others, including façade heights and façade opening surface areas, need further treatment and the formulation of assumptions to establish their values. The general thermal conductance (UA) and the south equivalent surface (SES) are subsequently calculated based on building surface areas and orientations.
3.3.1. Roof and Façade Surface Areas by Orientation
Since this research work is mainly focused on residential uses (even though it can also be adapted to tertiary buildings), in order to align these values as closely as possible with reality, the different elements are defined, specifically those associated with dwellings and their communal spaces, as opposed to areas dedicated to commercial activities or internal patios. Depending on the region under analysis, cadastral data are employed. Generally, ‘’building’’ layer geometry corresponds to the building’s ground floor footprint, not the area occupied by the upper floors. To approach the most accurate values, whenever feasible, these values are derived from the combination of dwelling element geometries and the communal circulation elements above ground level, corresponding to the geometries of the upper floors.
Once the geometry of the residential buildings has been established, the roof surface areas and façade lengths are directly defined using cadastral shape file geometries. DSMs can be used to delineate façade heights by rasterizing the relative heights of the buildings in relation to ground level. However, as previously mentioned, it is important to note a limitation regarding the frequency of data source updates. The height of a plot may refer to a previous structure or lack data entirely, as the DSM predates the construction of more modern buildings. In the case of Spain, the data source is the CNIG (National Geographic Institute), and the latest data available are from 2012. Consequently, for buildings built in subsequent years, height data may not be present or, if they are, they do not correspond to the current buildings. To standardise the methodology across all buildings and work exclusively with vector files (rather than raster files), heights are defined using cadastral data, with ground floors assigned a height of four metres and upper floors a height of three. DSM data are used to validate building heights. To determine the height of a building designated for residential use, the number of floors for residential purposes is counted and multiplied by the aforementioned floor height values.
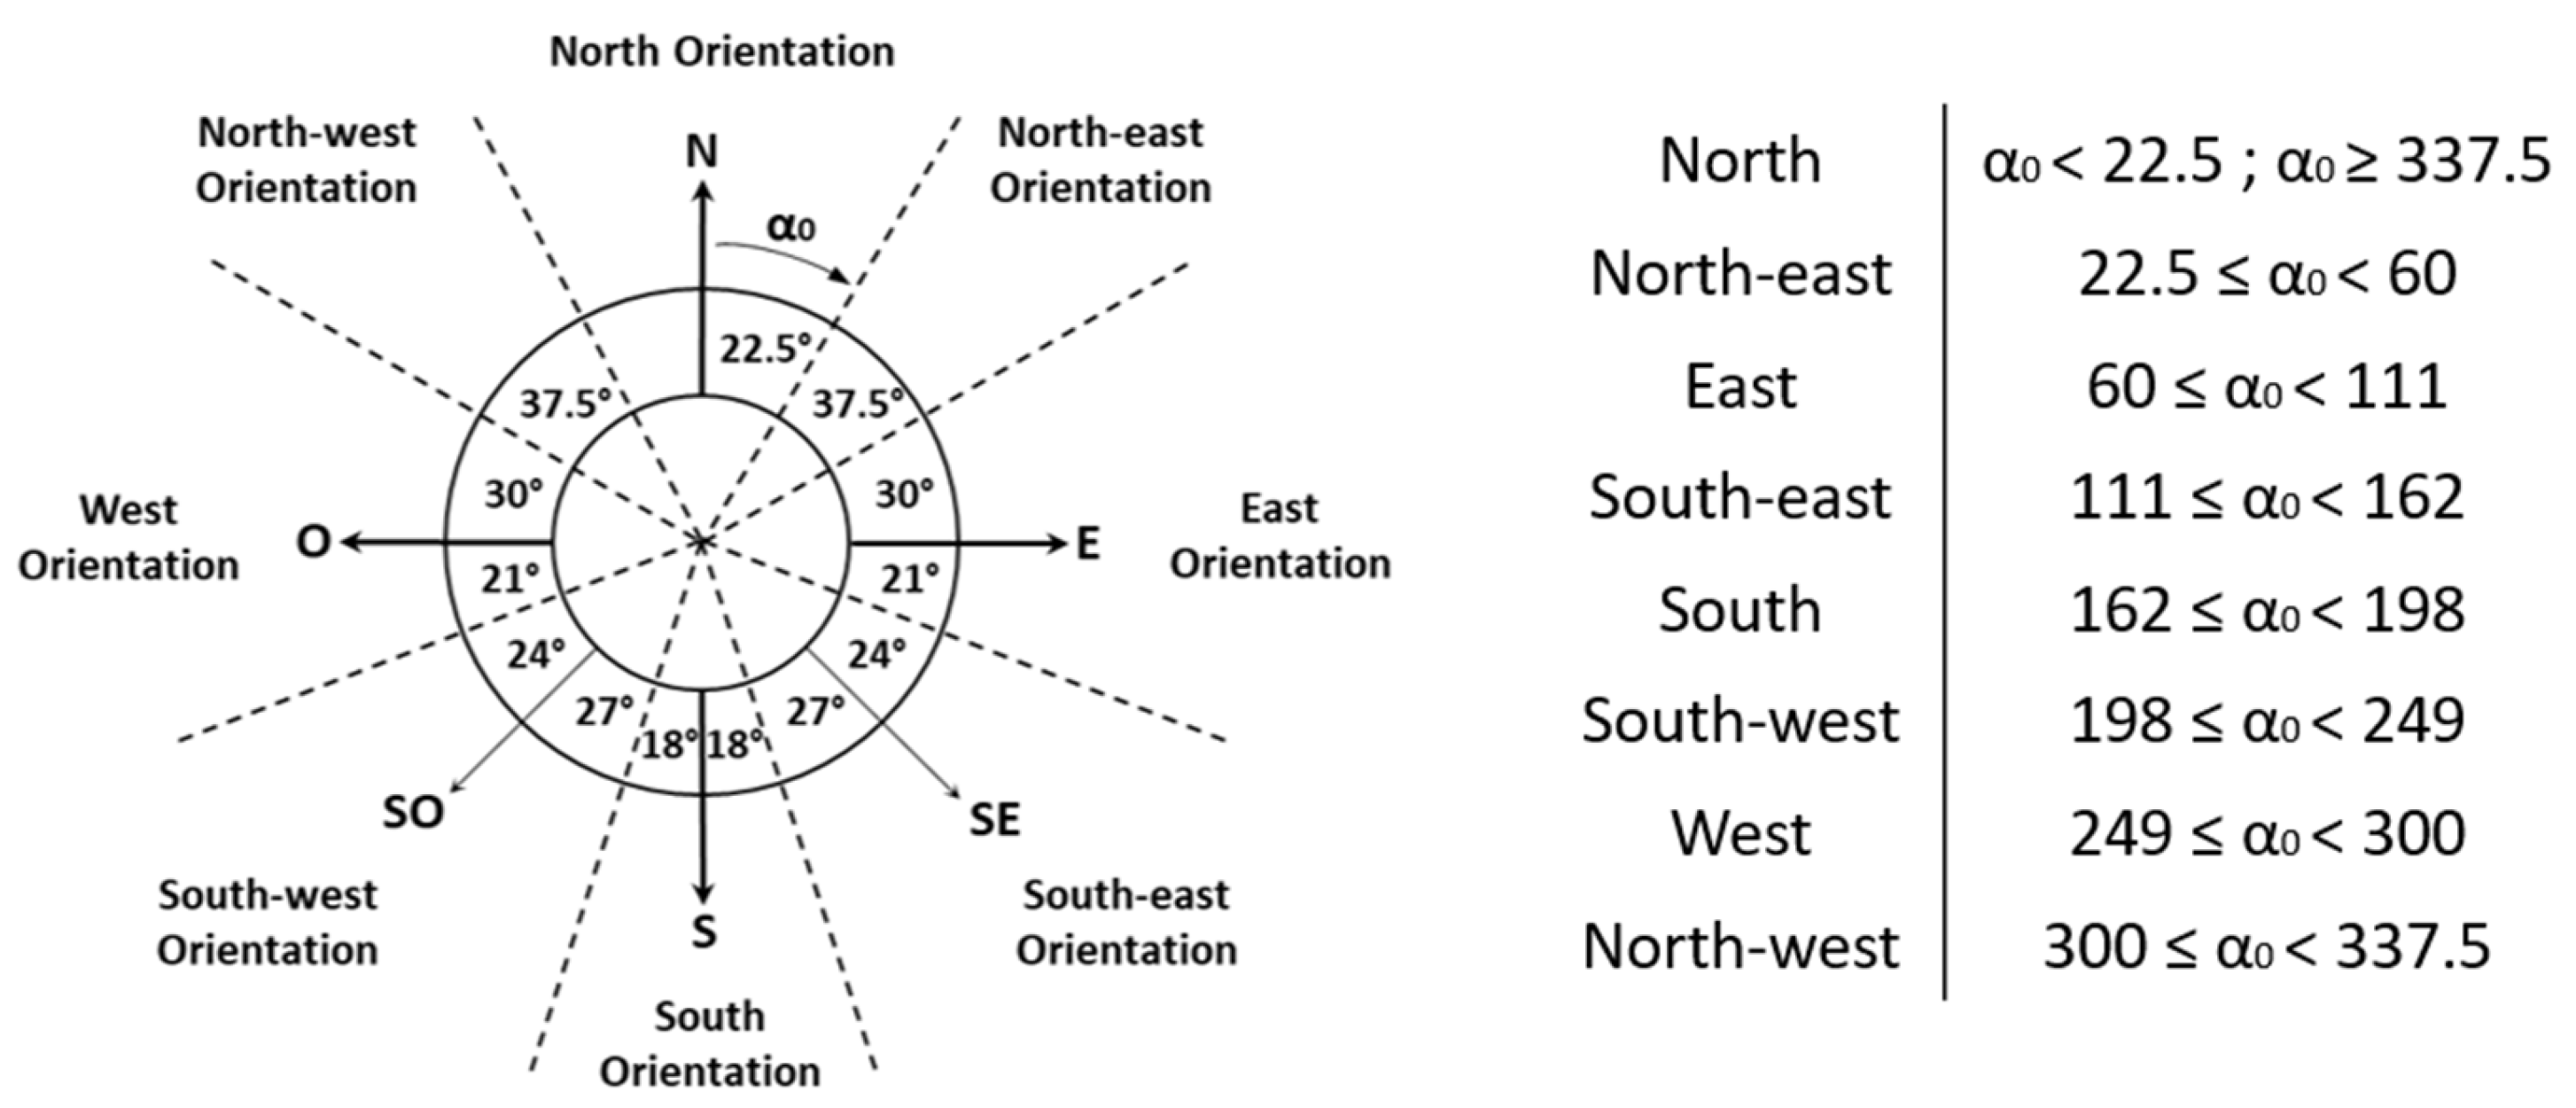
Additionally, to determine the orientation of building façades, the angles of the normal to the façades (measured from the North in clockwise direction (α
0)) are used to define them, taking as a reference the ranges proposed by the Support Document for the Basic Document DB-HE/1 Energy Saving of the CTE [
48], as shown in
Figure 2.
To establish the heights of the façades in contact with outdoor air, the difference between the two types of adjacencies involving façade lines should be considered, as explained by Yang et al. [
14]. In this way, the presence of two adjacent lines in the shapefile (adjacency 2) indicates a party wall, while a single line (adjacency 1) signifies a façade in contact with outdoor air.
In the case of adjacency 2, which represents a party wall, the determination of the height of the part of the façade in contact with outdoor air (h
ext. façade adya. 2) is carried out by calculating the maximum (h
cadastre max) and minimum (h
cadastre min) heights of the adjacent lines. The façade height (h
cadastre) is calculated by multiplying the number of floors in the building (N
floors cadastre) by three metres, and then adding an additional metre for the ground floor. The maximum height, corresponding to the tallest building, represents the external height of the façade. Conversely, the minimum height, associated with the lowest adjacent building, constitutes the internal height of the façade, pertaining to the party wall segment. By subtracting the external height from the internal height, the height of the façade of the tallest building in contact with outdoor air is obtained, providing essential data for calculating the façade surface area in contact with outdoor air:
where:
To define the height of the façades in contact with the outdoor air (adjacency 1), the following formula is used:
Once the façade length and the height of the façade in contact with outdoor air have been obtained, the surface area of the vertical envelope is directly calculated by multiplying them. Additionally, as mentioned before, this study focuses on residential use, so that only the façade surface area in contact with outdoor air linked to residential use is calculated and considered. To do so, the number of floors in each residential building (those floors that contain at least one residential element) is counted. Subsequently, the height of the entire building and the height associated with residential use are calculated, based on the total number of floors in the building and the number of floors designated for residential use:
To account for the wall surface area by orientation, it is essential to define the window-to-wall ratio in order to calculate the difference between the façade surface area and the opening surface area.
3.3.2. Window-to-Wall Ratio and Opening Surface Areas by Orientation
To determine the window surface area by orientation of the buildings on an urban scale, a window-to-wall ratio coefficient is applied, defining the percentage of openings relative to the total façade surface area. The window-to-wall ratio for a given building is related to different factors, such as the year of construction, the building typology and the regional climate, besides other specific issues related to each building (geometry, surroundings, etc.). In order to establish a reference value for the window-to-wall ratio, an analysis is carried out of the values and methods from other authors, as well as a comprehensive study of a small and representative sample of the region evaluated to compare the percentages of façade openings with real data from the region assessed.
The sample should be defined considering representative buildings from different construction periods, typology, and geographic location in the evaluated area. In the case of Spain, five different construction periods to be considered are proposed: pre-1939, 1940 to 1959, 1960 to 1980, 1981 to 2005, and 2006 to 2023. Regarding typologies, different indicators can be used. In this case, the number of floors is proposed as the indicator to define different categories. The specific categories and the range of number of floors can vary depending on the region analysed. Finally, as far as geographic location is concerned, the district is proposed as the unit. It is worth noting that it is desirable for all districts within the region under study to be represented in the sample.
3.3.3. South Equivalent Surface
As for the effect of building orientations (and, consequently, the effect of solar gains), the south equivalent surface (SES) parameter is considered, as introduced by Catalina et al. [
55]. The SES is an effective parameter to take the effect of solar gains into account by representing the glazed area and its distribution across different façade orientations in a single parameter. To define SES, the sum of the product of the glazed surface area and its orientation coefficient must be calculated. These coefficients determine the percentage of solar incidence on a vertical surface facing directions other than south, compared to what it would receive if it were oriented to the south. The SES is then calculated as presented in Equation (7):
where
A (m
2) represents the glazing area,
C is the orientation coefficient, and
i denotes the façade index.
For a given region, these coefficients could be defined based on the literature, or calculating them by means of modelling a single building with façades in different orientations through dynamic simulation software (e.g., Design Builder). This allows the solar irradiance received in each façade in a typical year to be quantified and, consequently, the coefficient for each orientation to be obtained. In the case of Spain, the angle ranges proposed by the Support Document for the Basic Document DB-HE/1 Energy Saving of the CTE [
48] are used as a reference to determine the angle range for the eight main orientations, as presented in
Figure 2.
3.4. Thermal Characterisation
Following a thorough review of the literature and the prevailing regulations applicable to each construction period (which, as mentioned before, determine the main aspects related to the energy performance of buildings), the parameters related to the thermal performance of buildings were identified.
3.4.1. Thermal Transmittance of the Envelope Elements
The thermal transmittance was assigned to each building depending on its construction period, as determined by the most recent year of construction or renovation. These periods were defined in alignment with significant milestones in the adoption of new construction techniques and changes in the applicable regulations concerning the energy performance of buildings. The U-values proposed are summarised in
Table 1 Until 1979, when regulations concerning building energy efficiency were introduced, the thermal transmittance of the building elements was established, based on the criteria outlined in the TABULA project [
15], which refer to the most commonly employed building systems in Spain for each period. An exception was made for the transmittance of windows, as owners of dwellings often modify these elements in a non-uniform manner throughout the building. Consequently, the criteria established by Oteiza et al. [
22] were adopted, considering a proportion of original windows, replacements, and double-glazed windows, with the assumption that most of the frames were made of metal. According to TABULA, the initial three periods were established as before 1939 (A), from 1940 to 1959 (B), and from 1960 to 1979 (C).
The fourth period, spanning from 1980 to 2005 (D), corresponds to the implementation of the first Spanish regulation addressing energy efficiency requirements in buildings, NBE-CT79 [
56], which introduced minimum requirements on the thermal transmittance of the envelope for the first time. Subsequent periods were aligned with the enforcement of the CTE 2006 [
57] and its amendments in 2013 [
48] and 2019 [
58] (involving changes in the minimum thermal requirements).
For the period 1980–2005 (D), the value proposed by the regulation (NBE-CT-79) was assumed as a reference and, in brackets, the average values for walls and roofs provided by Fernandez et al. [
31] were given; whereas average values considered for windows were obtained from the TABULA project [
15].
In the case of the period 2006–2012 (E), the values corresponding to a building that would meet the regulation requirements in terms of the energy demand of the building (from limit values reference values for average characteristic parameters of the CTE 2006 [
57]) were given. In brackets, the maximum thermal transmittance values per element were given (obtained from maximum thermal transmittance reference values for enclosures and internal partitions of the thermal envelope of the CTE 2006 [
57]).
Finally, for the periods 2013–2018 (F) and 2019–2023 (G), the values of the regulation in force in each period (CTE-DB-HE-2013 [
48] and 2019 [
58]) were given. In brackets, the values proposed by EFINOVATIC and CENER [
19] for the IDAE’s CE3X Manual of Technical Fundamentals of Energy Rating of Existing Buildings were defined.
3.4.2. G-Value, Solar Factor of Glazing
Concerning the criteria used to establish the thermal transmittance of the openings, an average value was defined for various types of glazing, including the original single glazing (0.85), those upgraded to insulating double-glazing (0.75), and double windows (0.75). Consequently, the solar g-value was determined to be 0.80.
3.4.3. Ventilation Losses and Internal Gains
Ventilation losses were fixed at 0.45 ACH, without differentiation between seasons and construction periods, while infiltration losses were set at 0.60 ACH for buildings constructed before 1979 and 0.40 ACH for buildings after 1979, aligning with the criteria outlined by Rodríguez Trejo [
52]. For post-1979 buildings, the value was increased from 0.30 to 0.40 ACH. These values were defined based on the results obtained in different buildings through Blower Door tests conducted by the University of the Basque Country (UPV-EHU) and presented by Fernandez et al. [
31]. Finally, internal gains were established at 4 W/m
2, in accordance with ISO 13790:2011 [
50].
3.5. Implementation in a Case Study
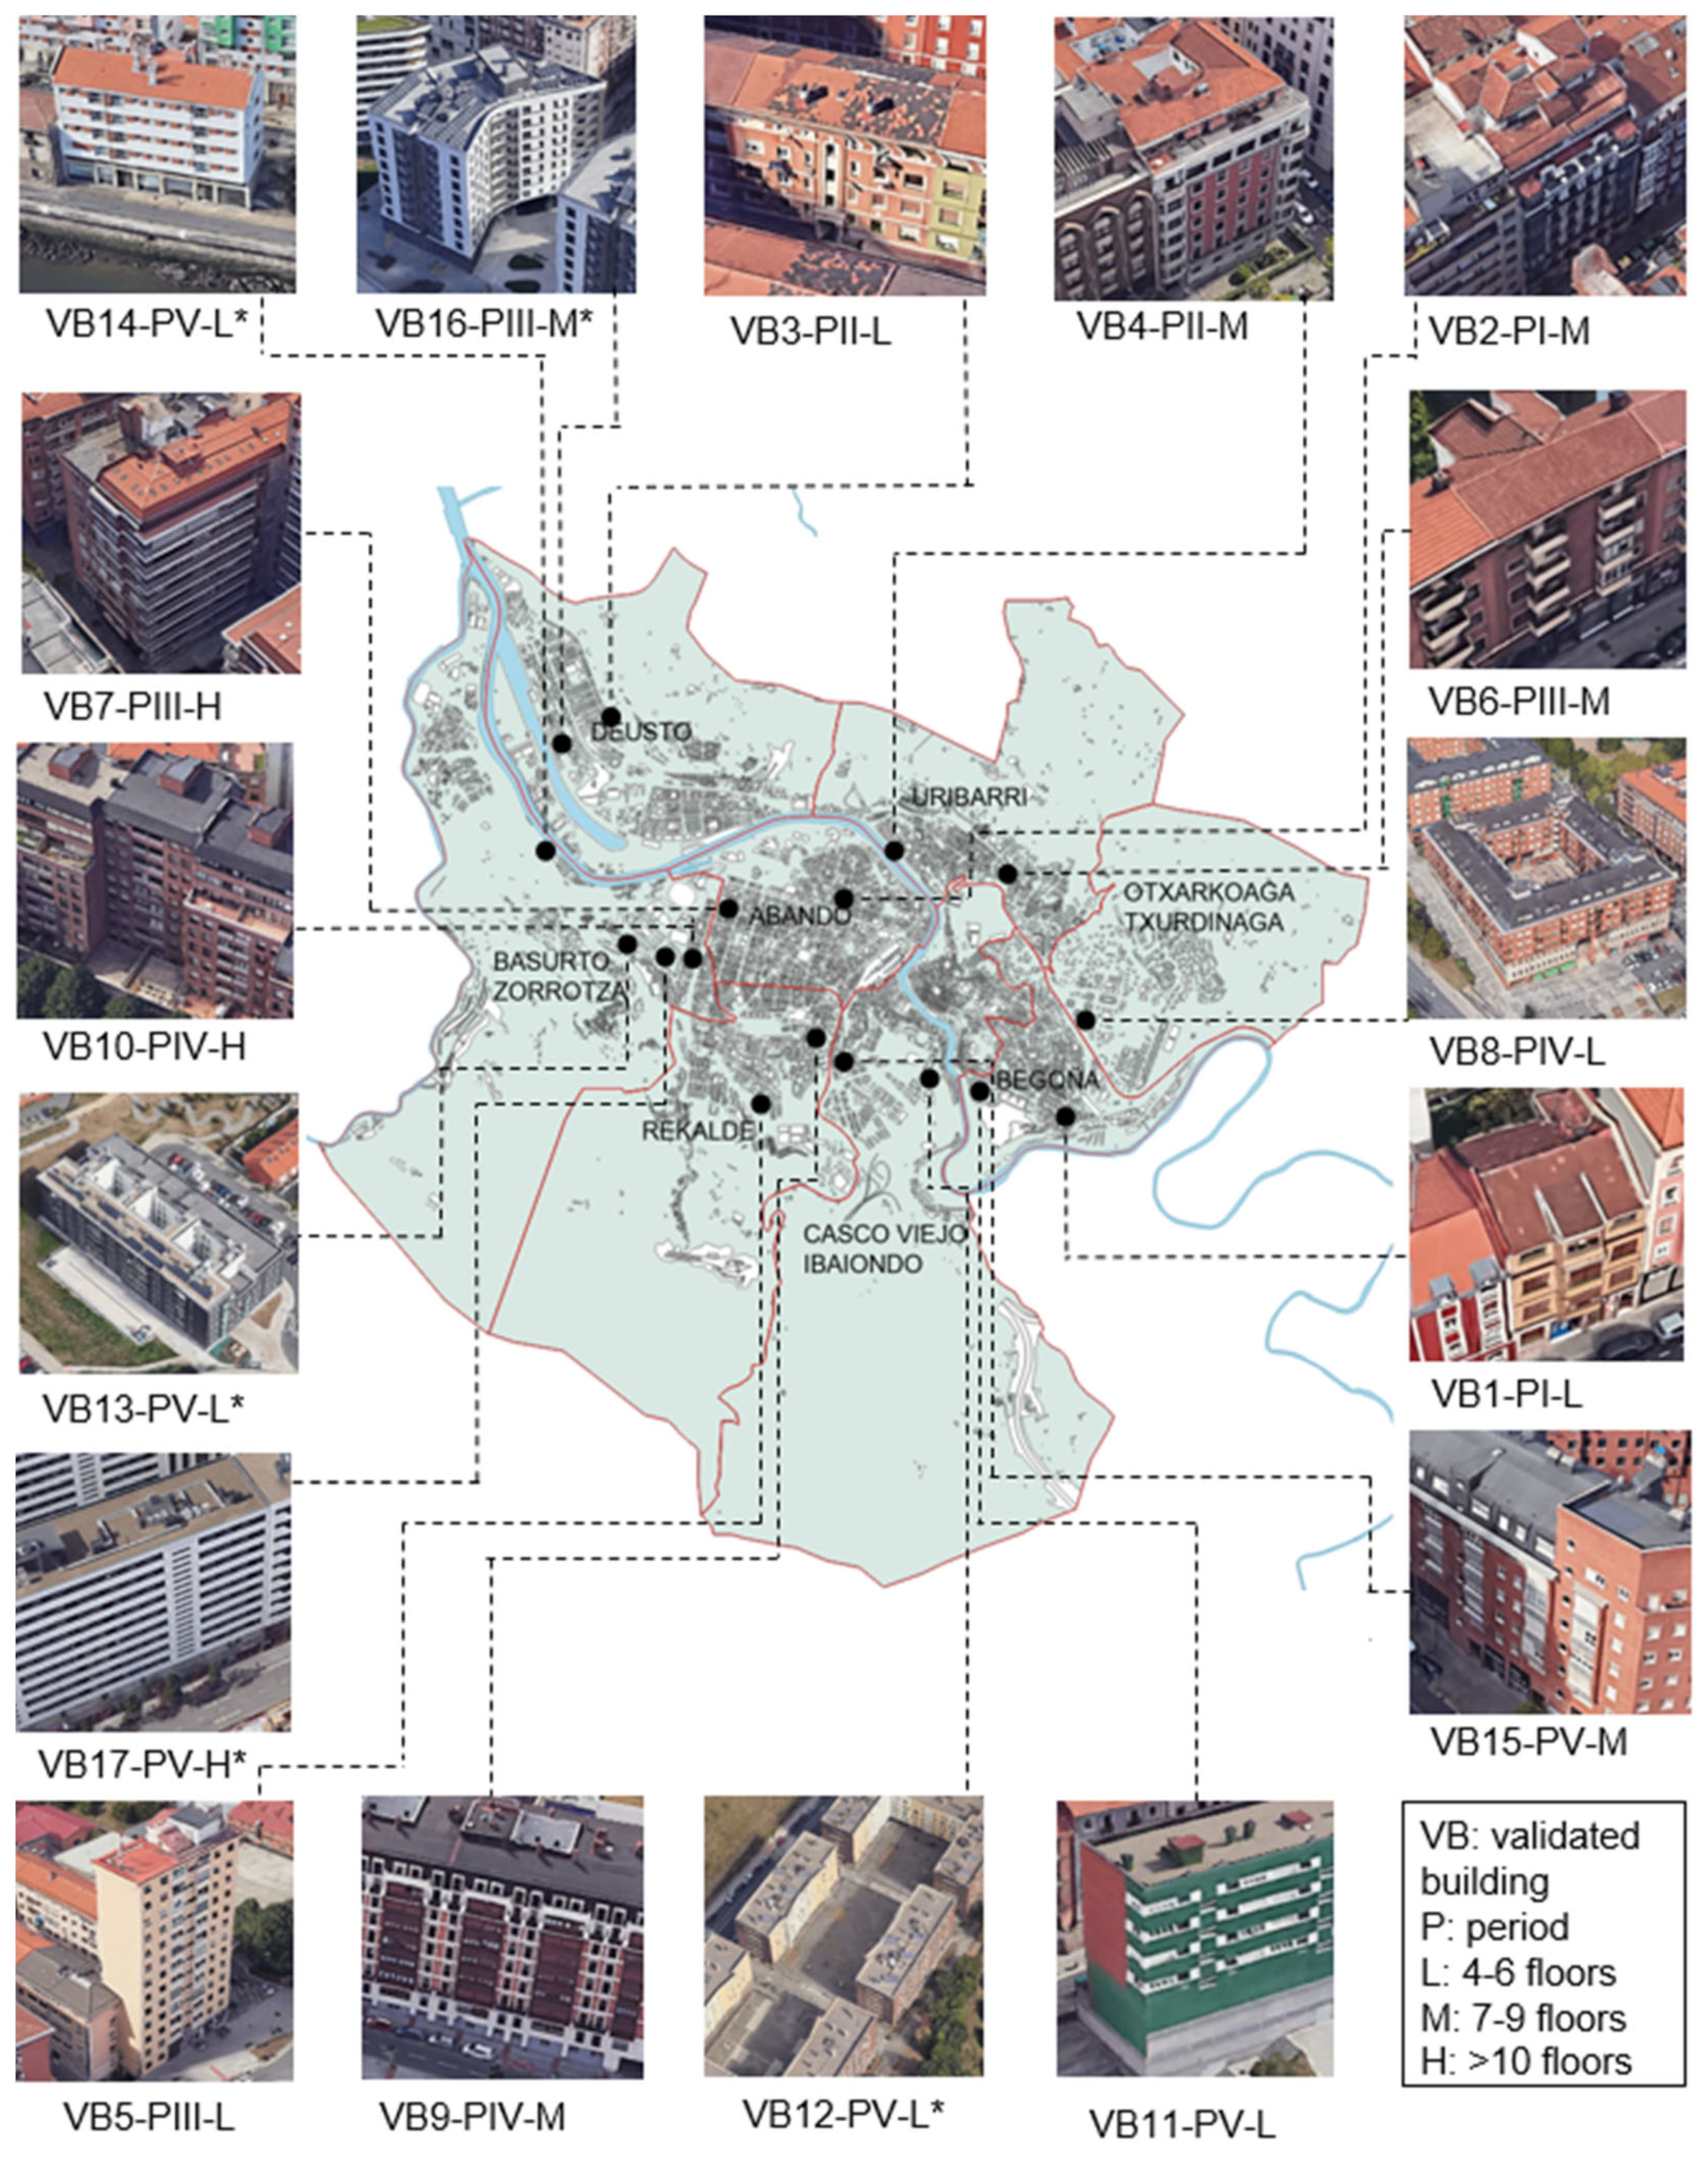
With the aim of demonstrating the usefulness of the proposed method, it was implemented and validated in a real case study. The building sample, as presented in
Section 3.3.2, was carried out with the aim of encompassing the most significant building typologies based on the number of floors of and the construction periods. These selected buildings also represented various districts within the evaluated region.
The consistency of the hypothesis assumed for defining building heights was validated by comparing these values to those obtained through the use of SDMs and façade elevation plans. Roof, wall, and opening surface areas were validated using EPCs, historical floorplans, and façade plans. Lastly, the U-values of the envelope were validated through EPCs and construction sections. Additionally, the U-values were obtained from construction details, considering the measurements obtained from drawings, and thermal conductivity values from those defined by the CTE.
6. Discussion
In light of the results presented in the previous section, some relevant issues can be highlighted. Regarding the geometry-related values calculated, the roof surface area, unlike the façade surface areas, shows a higher accuracy when the values obtained in QGIS are compared to those obtained from actual measurements. This is because this information is obtained almost directly from the cadastral data, requiring no specific assumptions beyond defining the horizontal surface area of the envelope linked to residential use. However, the façade surface areas, as previously described in the methodology, are not directly available in the cadastral data, so their calculation requires several assumptions to be made in order to define the heights of the floors on a broad scale, which, in turn, increase the potential error, and the uncertainty associated with these values. This uncertainty in turn has an effect on the calculation of the opening surface areas (and opaque surface areas of the façade), since they are calculated based on the obtained values of the façade surface areas. The respective uncertainty related to this issue is added to the uncertainty resulting from the hypothesis assumed for defining a window-to-wall ratio homogeneous to the entire residential building stock.
This fact is also demonstrated when the validation through EPCs is carried out. In this case, amongst the parameters considered, the opening surface areas again show the highest error. Instead, in this case, the values related to the roof surface areas surpass the error of the values related to wall and façade surface areas. In the comparison of the two validations for those specific buildings with accessible geometric parameter values, the data obtained in QGIS align more closely in defining the roof surface area as compared to the values obtained from measurements in the building plans. However, the surface area of the façade aligns more closely with the values from the EPCs. Yet, when calculating the overall error of the geometric parameters through both validation methods, it can be observed that the error obtained through the measurements from drawings (7.43%) is lower than that obtained through the EPCs (9.16%). It is worth noting that the values used to validate the methodology may also contain errors with respect to the actual dimensions of the buildings. Nevertheless, the data from building plans is assumed to be more reliable than those obtained from EPCs, which, to some extent, depend on the rigour of the technical personnel conducting them.
Regarding the thermal parameters determined through QGIS, it can be observed that the set values are considerably higher than those specified in the EPCs and estimated through the construction sections in the building plans. The values established in the methodology are based on the limits set by the regulations and are in every case conservative, meaning that a sensible share of the building stock shows a better energy performance than that assumed in this study (where all buildings are considered to merely meet the minimum requirements fixed in the regulation in force). A detailed study of the U-values of the components comprising the envelope of the buildings representative of the region under consideration could be conducted in order to obtain a more accurate picture of the energy performance of the building stock, and thus refine the proposed values further, but it would have to be applied to each specific case and this was beyond the scope of this work of research.
For a more refined definition of the studied parameters, that is the categorisation of the buildings, a more accurate criterion could be established by dividing the buildings not only by the period of construction, but also by other characteristics provided by cadastres, such as the number of floors or other representative parameters which allow specific archetypes to be defined. A more detailed level of the categorisation of the buildings would also require more specific values to be collected for the parameters. Two examples of a more detailed categorisation based on archetypes can be found in the research works of Jon Fernandez Luzuriaga [
17] and Modrego-Monforte et al. [
62]. Furthermore, it would be possible to examine the characteristic values of the region under analysis to enhance the precision in the established values.
Another potential beneficial adjustment in defining parameters in the future could involve the use of easily georeferenced EPC data. In the event that the data acquisition of EPCs were to be presented in a more disaggregated manner, the parameters could be directly determined with specific values for each individual building. However, as previously mentioned, the accuracy and reliability of the EPCs are questionable, and a significant level of uncertainty would be found in the estimated data.
In the light of these findings, some issues related to the existing limitations in parameter definition can be identified. Firstly, the construction period of a building is determined by considering the most recent year of construction or renovation recorded in the cadastre. It is important to note, however, that this date does not provide information about when the Project was officially approved, but the moment when the building is registered in the cadastre. In this regard, it should be noted that it is the date when the Project was officially approved that defines the regulation to be met by the building, and thus, what is crucial for defining the thermal characteristics of the building components.
Additionally, buildings are not classified by typology, but rather solely by the year of construction or refurbishment. Furthermore, unconditioned areas within buildings are not taken into consideration. The method for calculating façade surface areas is simplified by excluding projections on the horizontal plane. According to the window-to-wall ratio, a standardised percentage of openings is applied to all orientation façades and construction periods. Moreover, ventilation losses are computed assuming a fixed ventilation rate for the whole year, without differences between summer and winter or day and night. Similarly, internal gains are considered to be constant throughout the day. These limitations should be taken into account when the obtained results are evaluated.
Finally, it should be noted that, in the present research work, the methodology is implemented in the case study focusing only on the residential building stock; however, the general method can also be applied to commercial and other tertiary buildings. In this case, a redefinition of the archetypes assumed in the hypothesis, such as the window-to-wall ratio, heights, and thermal parameters, would be necessary.
7. Conclusions
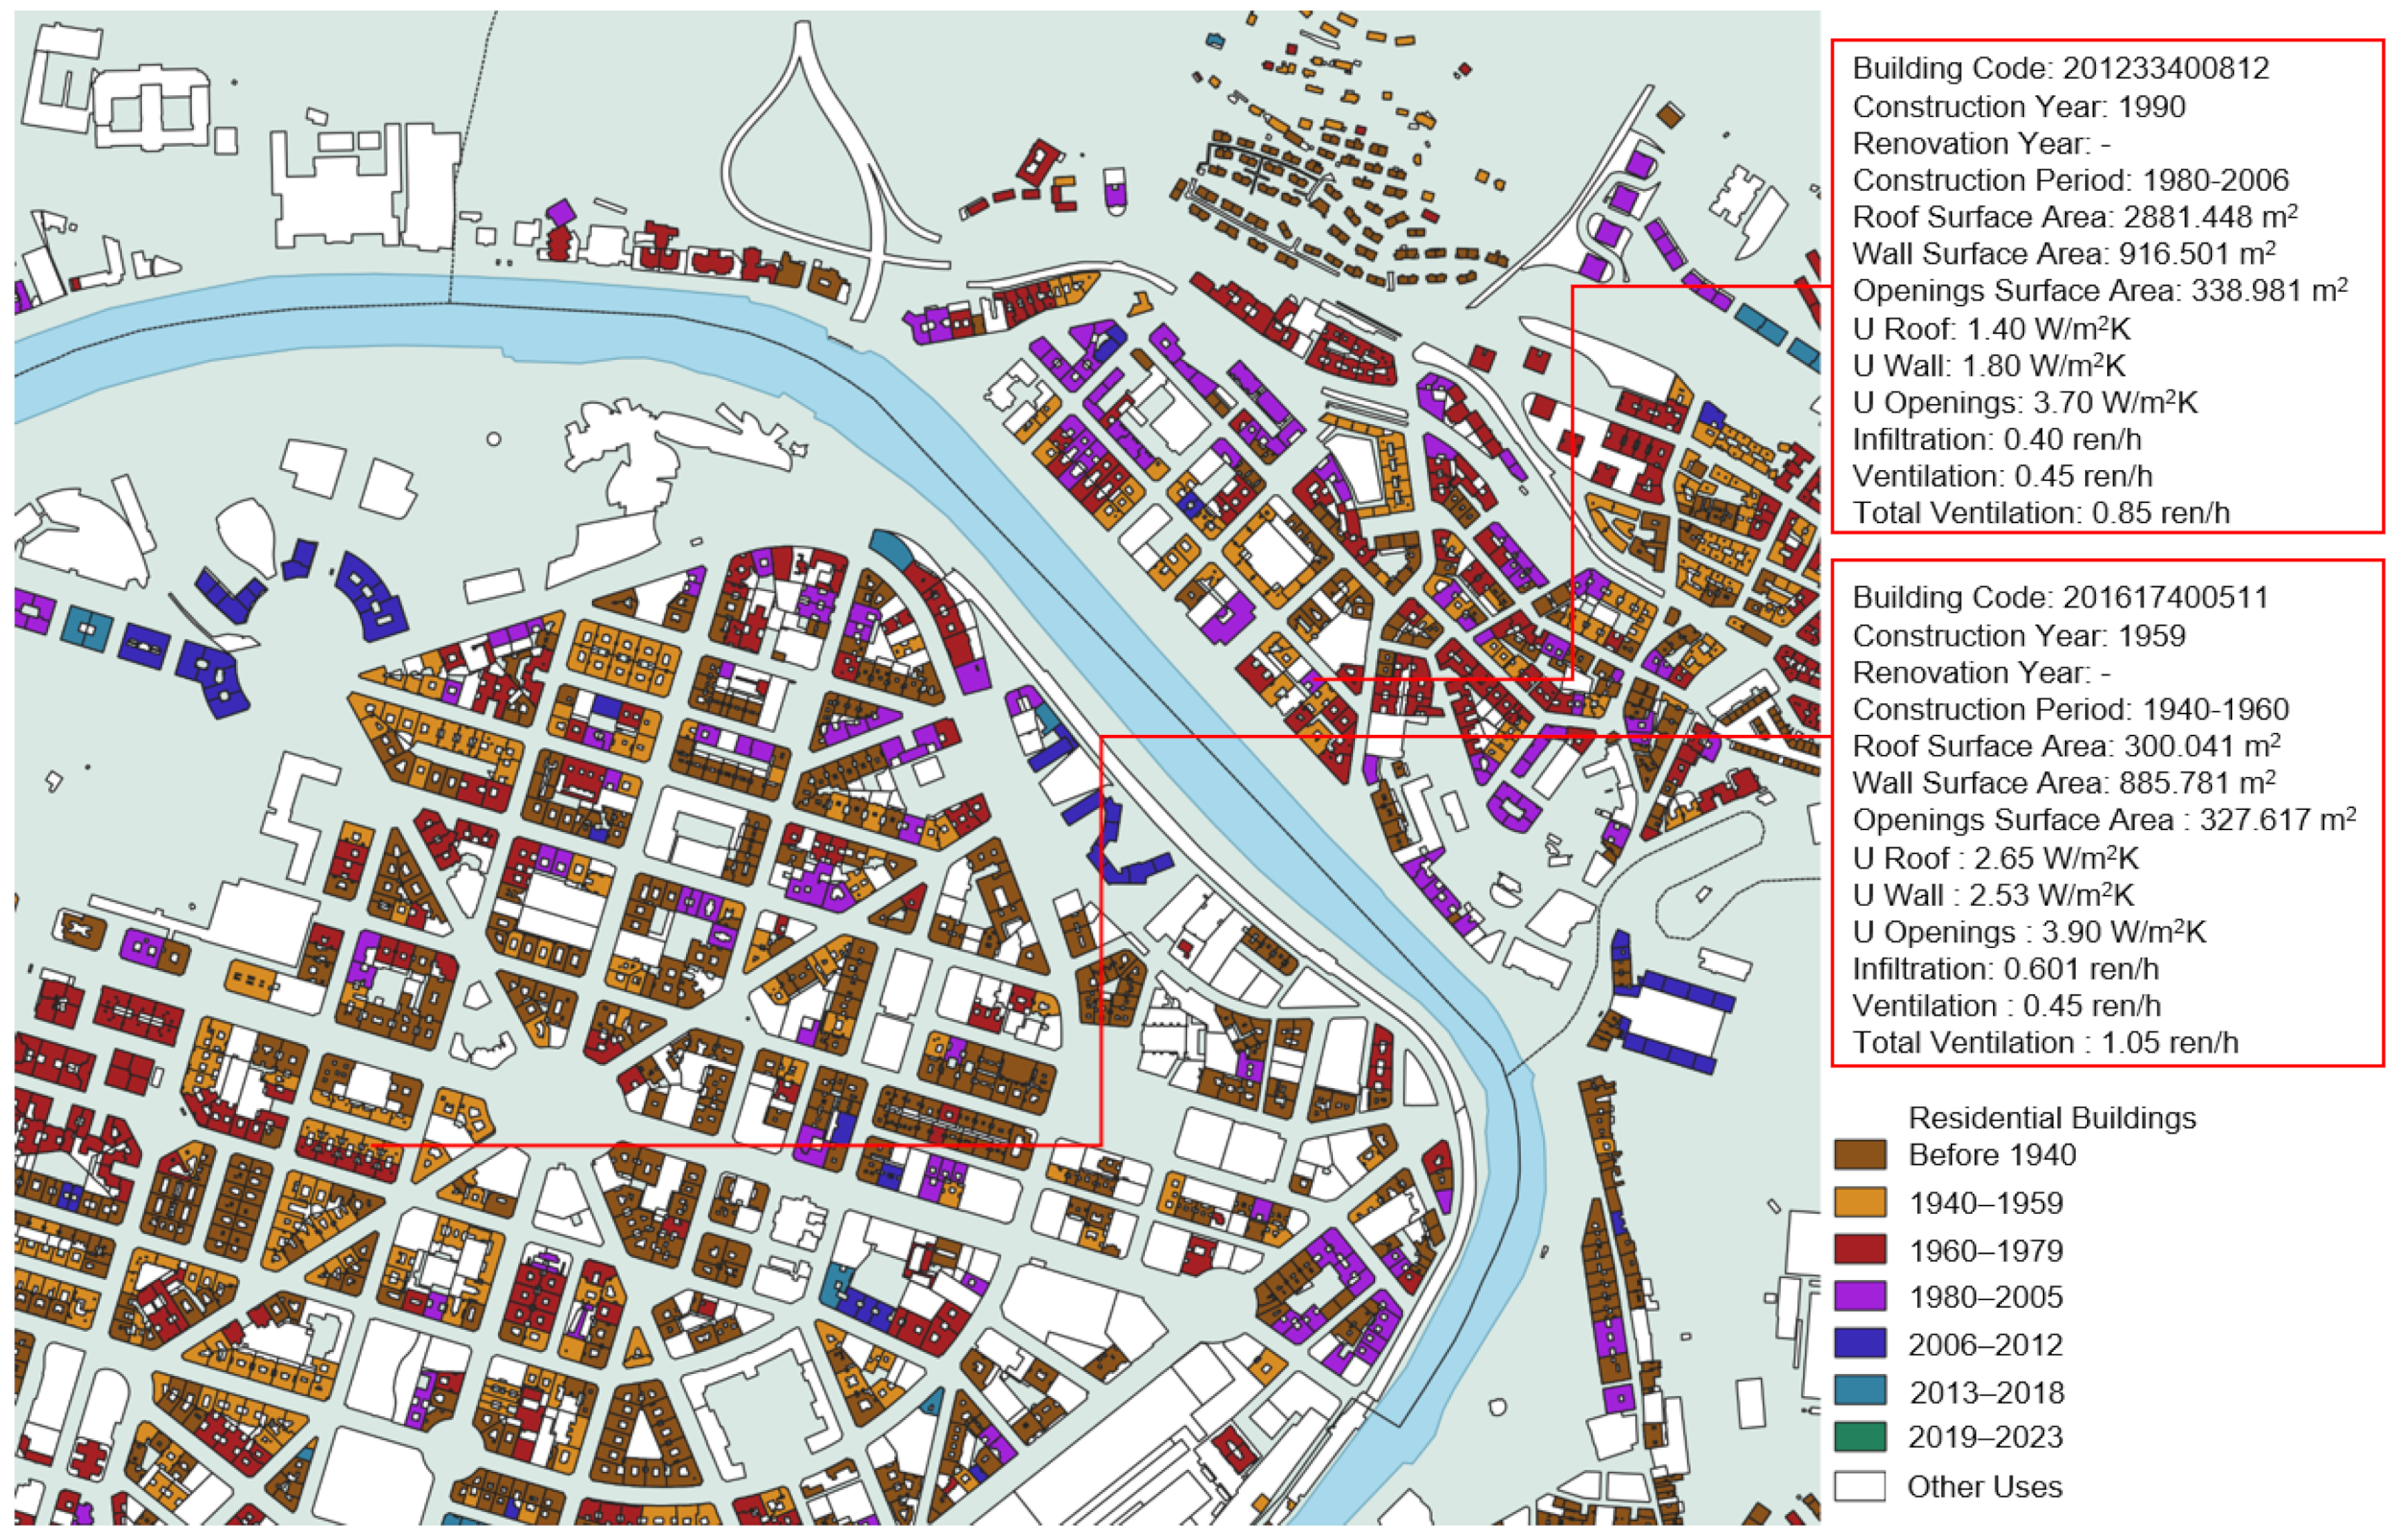
This study introduced a systematic methodology for the automated geometric and thermal characterisation of buildings on an urban scale using open data. The developed methodology is a crucial step in feeding simple energy demand models, enabling the generation of heating maps for well-informed decision making in efficient and equitable planning towards the energy transition. The methodology, applied to the city of Bilbao in the North of the Iberian Peninsula, uses publicly available data, updated monthly to account for variations in the defined parameters during renovations. The application of this methodology to the case study provides insights into roof, façade, and façade opening surfaces categorised by orientation in relation to the residential use of buildings. Additionally, it yields the U-values of envelope elements, ventilation losses, and internal gains for each building in Bilbao.
In terms of validation, measurements taken from drawings of 17 buildings in the case study were employed. The results revealed a higher error in façade surface area compared to that obtained for the roof surface area. Nevertheless, both errors fell within acceptable ranges, indicating the methodology’s precision in defining geometric parameters. Yet, in geometric validation through EPCs, the roof surface area exhibited a higher error than the façade surface area, with the surface area of openings in the façade presenting the largest error. A comparison of errors from the two validations indicated that the results from QGIS closely aligned with the values from drawings, establishing drawings as a more reliable data source for obtaining the geometric characteristics of buildings in this study.
The U-values of construction elements in buildings, as presented in energy audits and construction sections of drawings, were found to be lower than those proposed by the study. Standard limit values were considered for the definition of these parameters. Future work may involve a more detailed study of the thermal parameters in the residential building stock to define more accurate U-values. Building categorisation could also be refined to include representative typologies based on the number of floors, with this adjustment implementable in QGIS, as cadastres commonly provide the number of floors in buildings. However, it would involve the diversity of input data to define the parameters and would require the collection of representative values from the building stock, deviating somewhat from the automated method chosen for this research project.
The process in QGIS to obtain parameter values requires a significant amount of time, even with a high-performance processor and ample RAM. Running the process all at once may lead to program unresponsiveness, necessitating a district-by-district operation for data management.
For future work, the potential use of EPC data to determine thermal characteristics and even calculate the window-to-wall ratio is contemplated. This would be feasible as long as the public database containing energy certificate information includes disaggregated data for building parameters, similar to the way individual EPCs report capture. If easily georeferenced, such data could enhance the accuracy in defining the residential building stock. Access to this information for the definition and validation of results would be highly beneficial, contingent on the diligence of technical personnel conducting the said assessments.


 ,
, 

