1. Introduction
Improving the process of acquiring information from map systems largely depends on the development of tools supporting computer design and the process of urbanization and sharing open data. Map portals are supplemented with an increasing amount of open data, as well as geographical and graphic information. Spatial data from many areas accompany us in everyday life and can be directly accessed by users via their software. Advanced users employ professional software such as geographic information systems (GISs), e.g., QGIS 3.32 Lima, ArcGIS Pro 3.2.1, GRASS GIS 8.3.0, and SAGA GIS 7.8.2, for the analysis of these data. These tools use data sets that are obtainable through network services related to spatial data, e.g., Web Map Service (WMS, which provides maps in raster format). Such data sets are the basis for the spatial data available on the Internet or through Web Feature Service (WFS), which is applied to retrieve data in vector form, saved in the GML format [
1].
Virtual three-dimensional models of cities are ever more often being developed and then being made available on urban and municipal portals. These models will subsequently, as a result of changes and with varying frequency, be supplemented with interdisciplinary data from the changing objects and areas. This process is conducive to new directions of system development supporting modern digital support tools for spatial planning and urban development, and to the creation of new solutions for open-source programs and new open-source plugins for existing GIS programs [
2].
The integration of Building Information Modeling (BIM)/GIS systems complements the data for both areas; three-dimensional BIM models are mainly focused on modeling the digital twin of the object of the designed architecture [
3]. Models are created by interdisciplinary project teams, and their projects cover ever-broader areas around the buildings. In recent years, there has been a significant development of digital technologies and tools, as well as methods of obtaining data, also through photogrammetry and laser scanning. Point cloud, as a form of data acquisition, has become increasingly common, which has also significantly accelerated the development of GIS technology [
4]. Today, many researchers are attempting to combine such technologies and to integrate diverse database environments. Each of these activities is focused on the application of collected data in integrated activities. BIM and GIS integration takes place at the application and data levels, which are converted into GIS programs and the applications supporting them and used for data analysis [
5]. At the data level, data are exchanged between BIM and GIS in order to achieve efficiency of exchange between the two systems. This further facilitates integration at the application level and open analytical opportunities [
4]. The possibilities of integrating BIM and GIS at the level of tools and their effective use without losing data were carried out in the form of analyses and research in the operation of the GeoBIM 2019 benchmark, financed by ISPRS and EuroSDR [
6]. The assessment covered, among other subjects, interoperability, format conversion, and integration of procedures. The study reveals what areas should be further developed in software tools or by improving standards [
6].
Research on the application of BIM and GIS integration and the possibilities offered by this activity in the assessment of urban indicators was carried out previously [
7]. The team analyzed data from multiple levels, and the results demonstrate that there are still technical issues stemming from, among other things, the approach to data collection. The research group assessed, on the basis of a literature review, the possibilities of urban transformation, with particular emphasis on planning and issuing construction permits [
7]. The use of BIM and GIS data was also studied in the form of an experiment by Italian scientists based on their university campus and its surroundings, the purpose of which was to ascertain whether the resulting system can be applied to manage private and public assets. Of note, this research effort was based on open-source data management software [
8].
Moreover, integration at the application level was studied as an opportunity of using and applying BIM and GIS for a variety of tasks, e.g., for the assessment of flood damage [
9] and risk and safety management. In the petroleum industry, BIM can be used in the simulation and assessment of possible threats, enabling the development of effective security measures [
10]. Cities and urban areas converted into a 3D model are used in energy analyses, as what is of significance in the case of energy simulations is information on the height of the object, its shape, and the roof surface [
11,
12]. These data can also be used for analyses for investment areas and the future location of residential, commercial, and industrial buildings. The data, hence, should be constantly updated.
CityGML 3.0 (City Geography Markup Language) is an open standard that is based on XML (Extensible Markup Language), which is an international standard for storing and exchanging virtual city models. This format was created to define a virtual model of the city in 3D. The CityGML format enables its users to share and exchange information between various geodetic portals; this system also supports spatial analyses [
13]. This standard defines the geometric, topological, and semantic features of the models [
14], defining not only the city, buildings, and structure but also vegetation, watercourses, and objects of small architecture. Such a standard allows for the representation of 3D objects for many users and in various geographic information systems [
15]. In recent years, many articles have been published discussing the use of CityGML models, for example, to simulate energy performance [
16,
17]. The Energy Atlas Berlin project used a three-dimensional city model for energy analysis [
18]. The authors concluded that the standard CityGML would allow for the easy adoption of the same concepts in different cities. This will help identify several future research aspects for the development of a comprehensive strategic energy planning platform. Many improvements of the current data availability are necessary to track the energy performance of the observed building stock. This concerns, above all, the real energy consumption data; they are provided by the Regional Energy Balances (BER) [
19]. One such example may be a publication presenting the results of the EnerCity project [
20], one of the goals of which was to develop an application enabling energy performance estimation for all residential buildings in order to obtain a citywide energy map of the built environment. Similar heat-demand assessment studies based on 3D city models and CityGML Energy ADE were also carried out in the form of a case study for the city of Helsinki [
21]. Other scientists have also conducted research on similar topics [
22,
23]. The articles also analyzed map portals, their functionality, and technical and thematic compliance with the assumptions of the CityGML standards [
24,
25,
26].
For the present research, an analysis of the work of other scientists on how to convert IFC files to CityGML was carried out [
27,
28,
29,
30]. Integrating activities were described by scientists studying the wide possibilities of data exchange, capturing both geometric and semantic data, as well as examining the possibility of converting BIM to GIS files [
31,
32,
33]. Research was also conducted on a direct conversion scheme to extract indoor building information from BIM to Open Geospatial Consortium (OGC) IndoorGML. The main stages of the research included the topological conversion of the building model to an internal network model and the generation of the indoor geography markup language (IndoorGML) [
34]. One of studies, conducted by the team of Stouffs, Tauscher, and Biljecki [
35], schematically presents the roadmap from BIM to CityGML and also describes the state-of-the-art of file conversion. The authors concluded that the difficulty lies largely in obtaining complete and fully lossless mapping between the IFC model and the corresponding CityGML model. According to these authors, among other issues, this is due to differences in BIM models as a result of their preparation in various software supporting design in BIM technology [
13,
36]. Zhu and Wu’s team [
36] states that, to ensure a smooth flow of information, BIM models should be more reliable, while conversion paths should be more solid and efficient, and a more flexible data model on the GIS side is also needed. Research on the georeferencing method for the IFC format was also carried out [
37,
38]. Thus, there is no single coherent method, technique, or tool for converting the files [
7,
39], precisely because of the different modeling techniques [
7,
40].
The aim of this study was to determine the feasibility of implementing a BIM file into CityGML on the basis of proprietary data prepared on the basis of the modeled object. The action was to define the directions of the settings needed to convert the file to the IFC model, which could, at a later stage, be used as a CityGML object. The research problem concerns the possibility of combining new BIM models, as well as inventoried 3D objects with geospatial databases for analytical purposes. The main question to be answered concerns the determination of the directions for the development of the QGIS plugin in order to improve the work enabling energy, urban, and architectural analyses. The planned analyses include analyses of energy, urban, and architectural efficiency, enabling the determination of parameters of facilities, building materials, and sustainable energy use in buildings by using the BIM objects implemented in CityGML and geospatial databases.
The scope of activities undertaken in the article includes the following:
Analyses in the commune in relation to the available databases;
Examination of the possibilities of implementing new data in the current system supported by the GIS program;
Investigation of the possibility of converting a BIM file to CityGML;
Examination of feasibility of implementing files into GIS programs;
Examination of the method for the transmission of data collected in object queries to the GIS program;
Setting the directions of future pilot activities aimed at developing a plugin for spatial analysis in QGIS, as well as defining the types of plugins required to cover the area with data from various available free-access portals and databases.
The collected data and analyses conducted in the field are to be employed to develop, for the analysis, SMALLBIM objects (inventoried buildings developed as 3D models with simplified BIM information) that can be further converted to BIM-IFC—CityGML. The term “SMALLBIM” was adopted for the purposes of the article. This action is aimed at examining the possibilities of implementing new objects and those already existing in the resources of created databases in the portal of the selected municipality.
The section on methods contains a diagram of the procedure for converting BIM to IFC, and IFC to CityGML files. The path of adding a new CityGML object to the existing resource was also analyzed, wherein activities on the 3D model were based on the modeled object’s own example. Also conducted was an analysis of the state of activities undertaken in Poland towards the introduction of BIM. The results present a comprehensive range of analytical activities undertaken to prepare a scheme for the development of a new plugin for the QGIS program.
2. Materials and Methods
The Kobylanka municipality, a rural municipality in the West Pomeranian Voivodeship in the northwestern part of Poland that occupies a small area of 122 km
2, was selected for the study. It is located next to a large urban agglomeration of the city of Szczecin, and it serves as a kind of bedroom for the city. One of the main S10 expressways runs through the commune; it is a road that is intended to eventually connect the Szczecin–Świnoujście seaport with the Warsaw agglomeration. Road investments have increased the attractiveness of its areas for investors, resulting in many new developments in recent years. Lake Miedwie, one of the largest lakes in Poland, a navigable body of water with beaches that are a magnet for tourists, is also partially located within the borders of the municipality, and forms of natural protection in Kobylanka occupy 15.34% of its total area [
41]. Moreover, the 400/220/110 kV Morzyczyn power station is located within the municipality. This complex is important for ensuring energy security in the West Pomeranian Voivodeship, as it connects networks of overhead lines of national, supra-regional, and voivodeship importance. In addition, it ensures power output from both already existing units and planned power plant generating units and systemic and renewable energy sources [
42]. This basic information about the municipality demonstrates that the direction of Kobylanka’s development is also important for the nearby urban agglomeration. Pilot research on the possibility of introducing a system of activities supporting data management in the municipality began in 2019 on the basis of the available GUGiK database portal.
Currently, according to the analysis of the National Geoportal for August 2023, the analyzed area is covered with 3D objects with LoD1 designation [
43,
44]. However, no sufficient data set is currently available for further digital processing of the discussed area. What is more, no BDOT500 range data have been recorded for the analyzed area. In the areas where these are available, they contain information about the building and its function. Unfortunately, the database lacks basic information about the objects, such as its year of construction; the building technology used; the basic parameters, including roof geometry; and the building height to the ridge. Therefore, it proves difficult to perform spatial analyses of objects without this data. Additionally, there is currently no available program or plugin that would give the possibility, even with the support of an application using data from the GUGiK portal, and the proprietary data to generate information upon request.
Therefore, an IT solution is sought to support local government authorities that would enable the combination of collected data, available data downloaded from network services, and the possibility of implementing BIM into GIS. What is required for the efficient area management is a tool to enable land analysis, generate spatial information at the level of energy analysis, and determine the availability of areas for planned investments, with an indication of spatial guidelines and conditions that can be met in the process of a new form of development.
In order to examine the actual state of information, the following were analyzed: the data available to the municipality, available GIS software, and available software for converting files required for research. Analyses were carried out at three levels: territorial, consisting of queries within the municipality; online, consisting of the analysis of portals; and digital, consisting of the analysis of available software. All of these analyses are summarized in
Table 1.
The main analyses of the available data were carried out on the basis of the portal of the CAPAP Central Office of Geodesy and Cartography—GUGiK [
43] for the area of Poland, which allowed us to identify and approximate the process of developing directions of action in the process of implementing BIM in GIS for the area of Poland. The review of possible activities in the acquisition and exchange of data allowed us to set the planned directions of research on the possibility of data processing and their wider use in the BIM and GIS cooperation process. For this purpose, the types of models covering the area of Poland were analyzed. What follows from the acquired data is that 3D objects cover the entire area of Poland. According to data from the Geoforum portal, in 2023, GUGiK updated three-dimensional models of buildings [
44], and these are now all solid or block models. The models conform with the CityGML standard, and their details correspond to LoD1 for Western Poland and LoD2 for the eastern part, as presented in
Figure 1. The scope of information and the LoD for the studied municipality against the background of Poland are presented in
Figure 1.
3. State of Research on the Implementation of BIM Standards in Poland
Research carried out by analyzing the available literature on BIM objects implemented in Poland in recent years demonstrated that there is little information available about these objects. Examples of completed facilities about which information is available include: the Port of Gdynia, the Centre for Cross-Country Skiing and Biathlon, The Lower Silesian Park of Innovation and Science, and a pilot project using BIM technology at PKP Polskie Linie Kolejowe S.A. [
46]. Certainly, there are buildings for which BIM technology was used at the construction stage to supervise the investment process, but, most often, these data remain confidential. The construction industry employs its own studies consisting of redrawing the project to BIM technology; it turns out that this is a common practice at the stage of work carried out by the main project contractors. This is confirmed by the fact that the process of preparing data for analysis, especially in the area of BIM-GIS, is still at the implementation stage, and it is difficult to analyze experiences in this area. The low level of work in BIM technology in Poland is additionally confirmed by the fact that there are no legal regulations and requirements for the development of projects in BIM technology. Indeed, data from Poland demonstrate that the process of implementing BIM technology is still at the stage of consultation. In 2020, the “BIM Standard PL” manual was developed, created under the patronage of the Polish Association of Construction Employers PZPB and in cooperation with Building Contractors and experts of the EccBIM Foundation [
47]. In October 2022, the Minister of Development and Technology appointed a working group on BIM. Its task is to develop a strategy for implementing BIM, in particular, taking into account supervision of architectural and construction work, and construction supervision authority. These tasks are to support the implementation of investment projects, and the group is also to prepare proposals for legislative actions concerning the execution of projects in the construction industry in accordance with the BIM methodology, including public procurement [
48].
The designer has at his disposal many digital tools related to solid, functional, and spatial analyses of cubature objects. There are also many possibilities of applying generative modeling of variants using Formit, Dynamo, Marionette, and Grasshopper suites, while in spatial analysis solutions, there are still no comprehensive solutions taking into account data related to BIM.
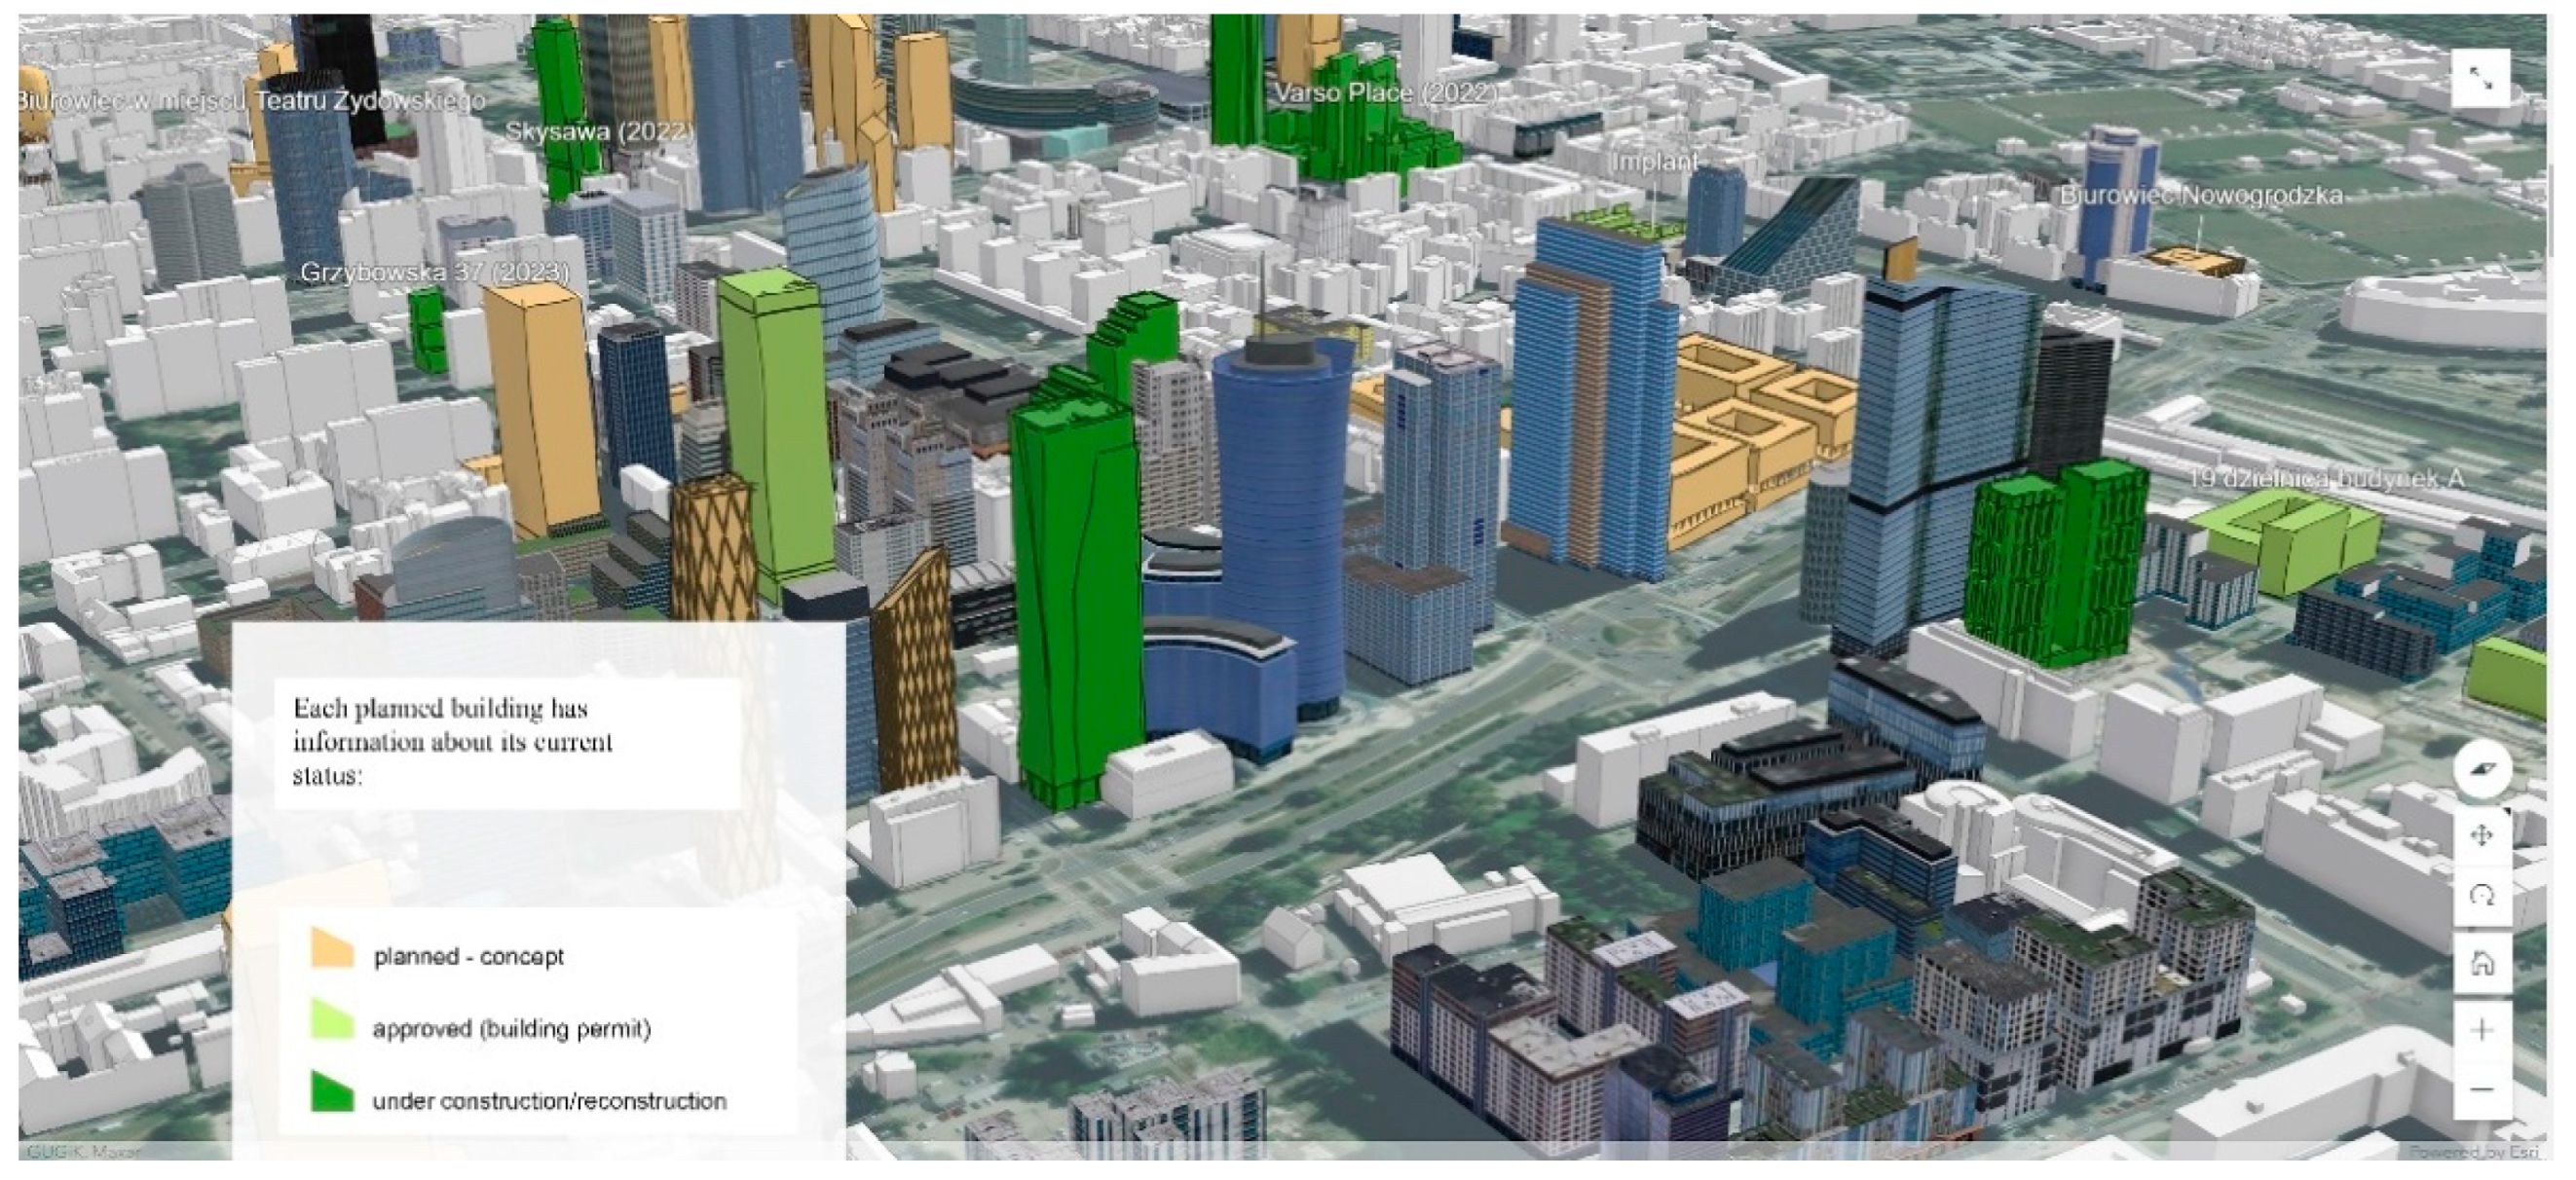
The current possibilities of using available digital tools and new BIM technologies do not affect the intense interest among designers in the development of work in the BIM standard, because the standards are still not in force and do not constitute law. The lack of mandatory design guidelines to be met hampers the transparency of data in map portals, rendering their updates troublesome. The forecasted activities should oblige the provision of models for new investments; this would enable the facility data to be updated in the main portals. Three-dimensional data should include at least a SMALLBIM model or one of the IFC or CityGML file formats. This would enable urban discussion and transparent energy and environmental analyses. The example that has been made available for the city of Warsaw presents information on planned investments against the background of existing facilities. The data were made available on the Warszawa 2025 portal [
49]; see
Figure 2.
Cities of the future is a direction of work and research on the use of AI capabilities [
50] in analyses that can accelerate the level of filtering information from the field and change the approach to sharing it. The direction of the changing flow of information of tools and additional plugins are discussed in more detail on the Esri portal [
50].
The State of Research on the Implementation of Data into GIS Software in Poland
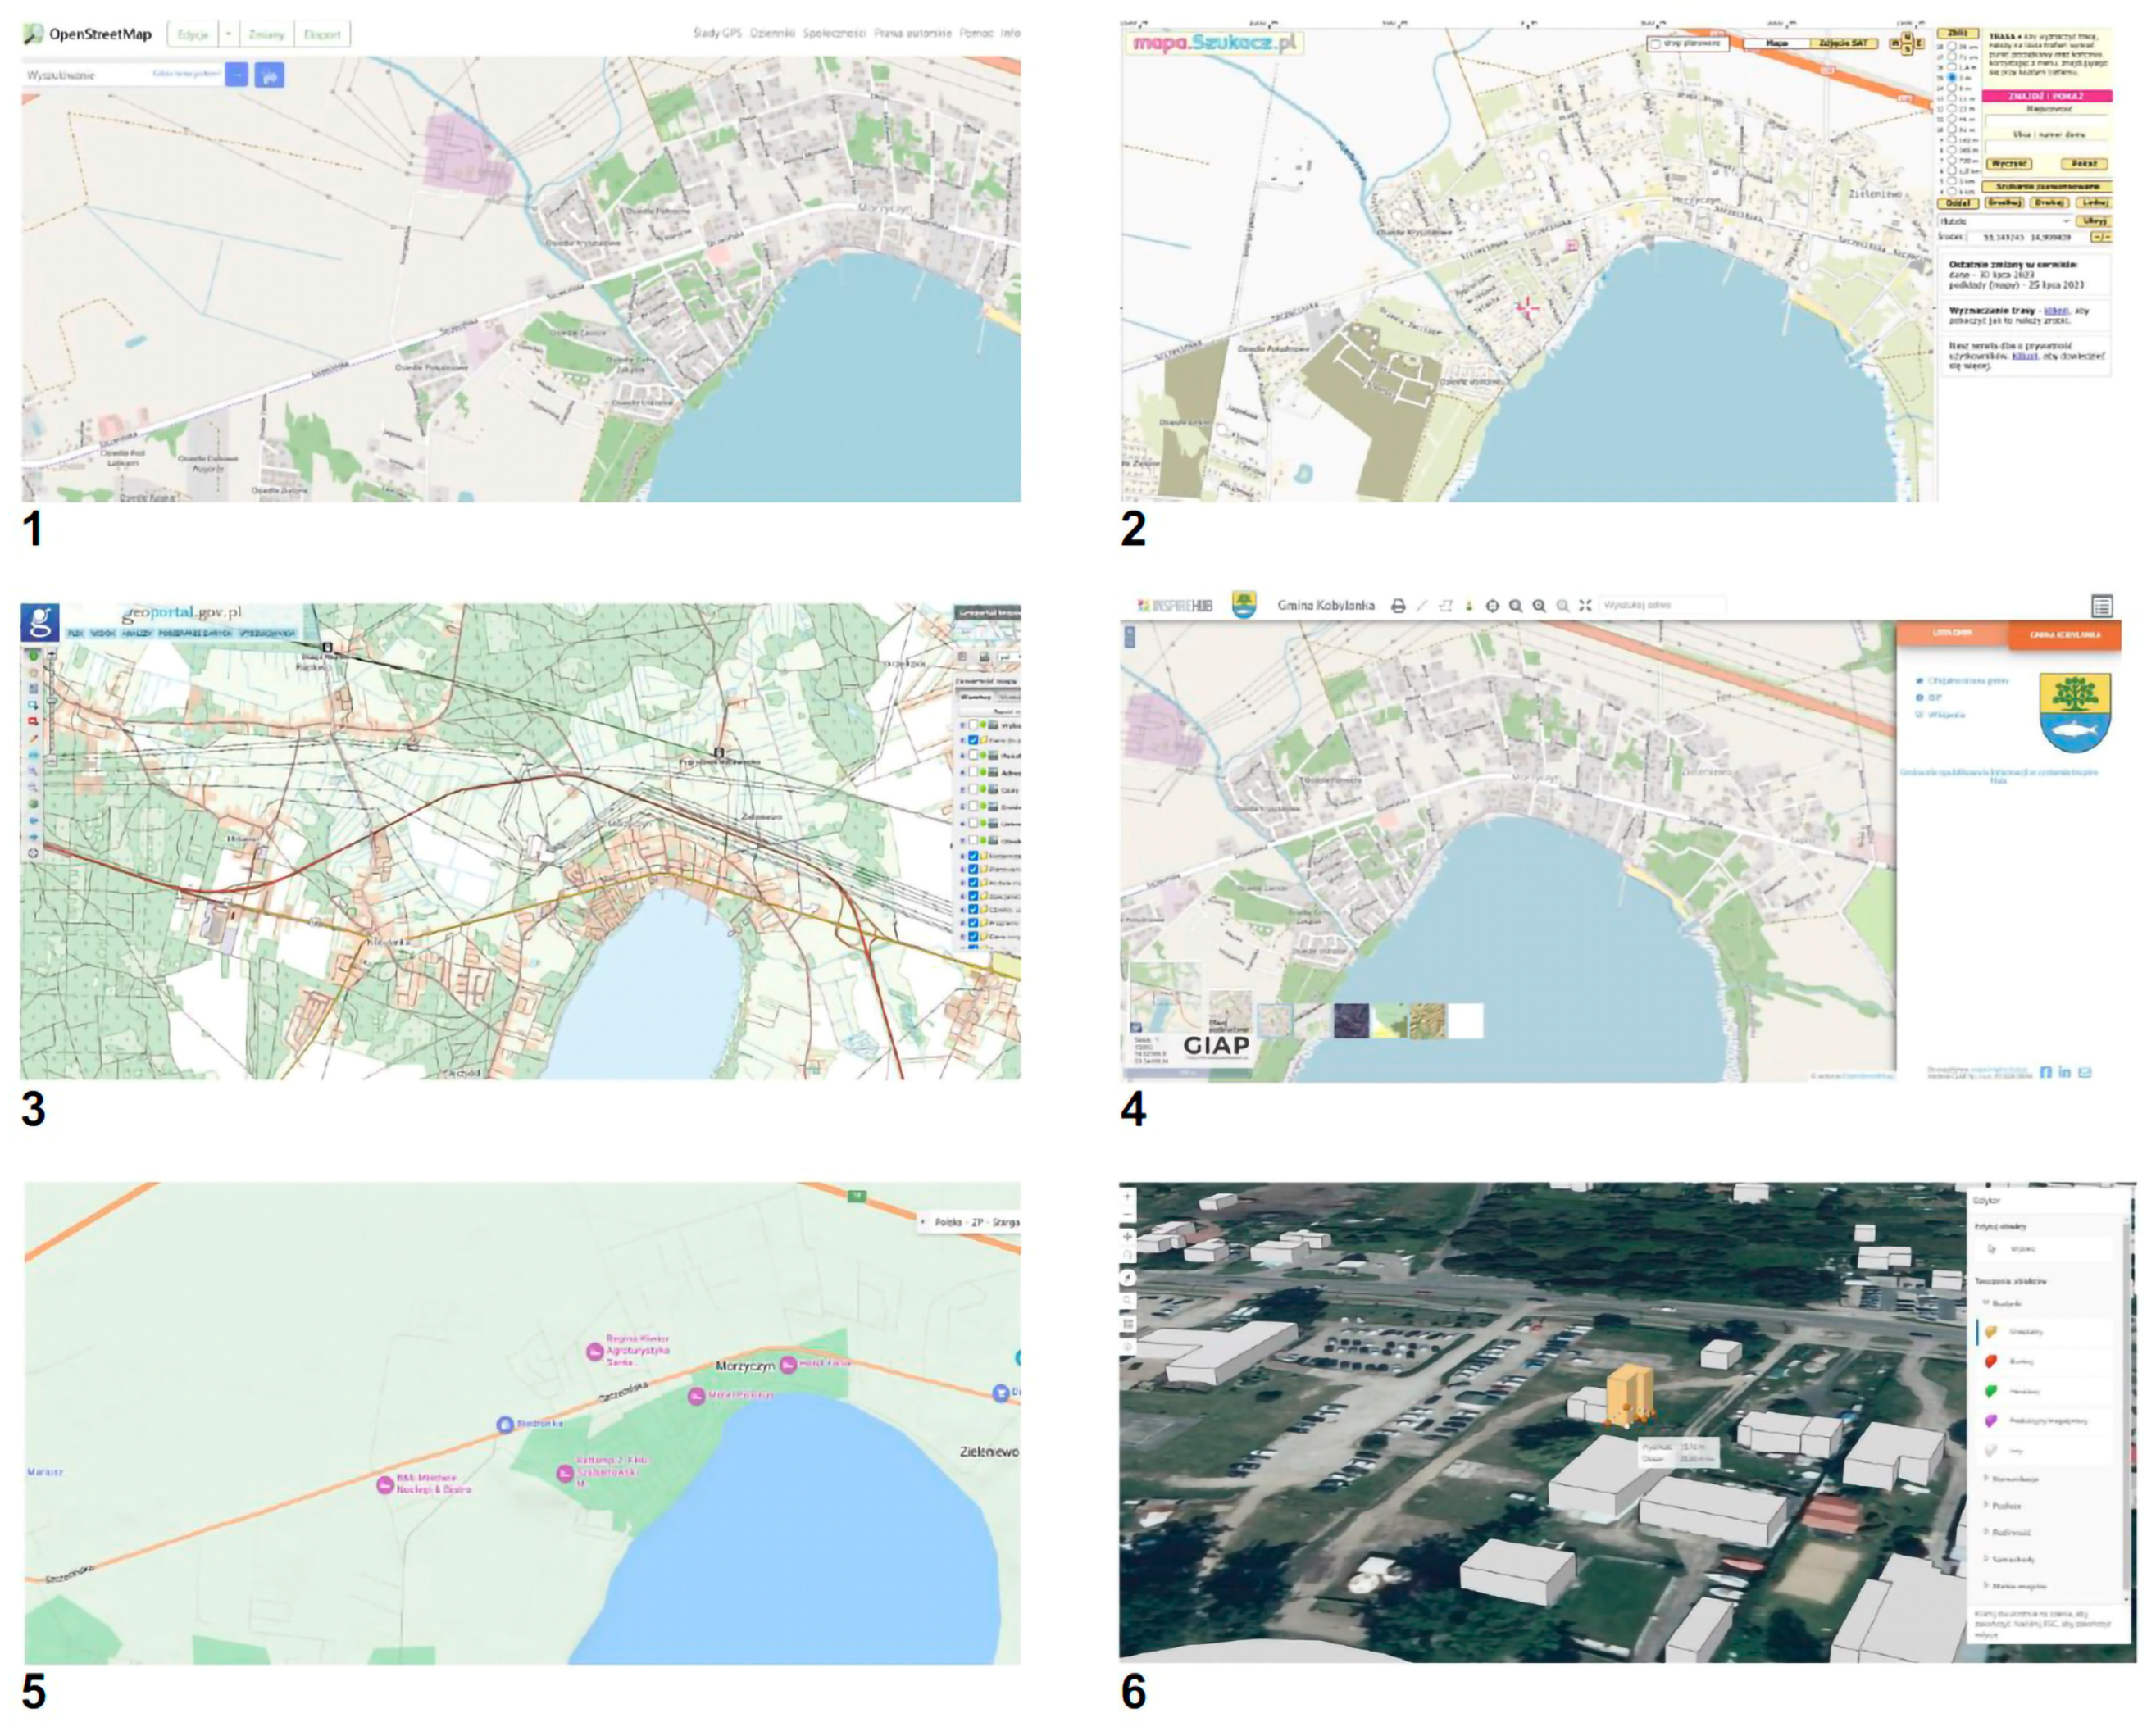
Currently, the standard preceding conceptual and design activities involve conducting numerous spatial analyses based on information directly related to the design space. The available map portals allow for various activities, such as data acquisition, simple analysis, and the simple modeling of new geometry. Among these portals, the following should be mentioned: geoportal [
41], enabling the most options for analyzing and downloading data, and direct access to municipal portals; OpenStreetMap [
45]; e-mapy.net [
51]; Inspire-hub [
52]; and placemaker3d, which is an interesting portal with a tool for own analysis and simple 3D drawing [
53]. All of this is outlined in
Figure 3.
Despite the data updates introduced, the basic portals reviewed for research in
Figure 3 do not offer too many possibilities in of themselves. The filtering of spatial information for analysis and design is available only from the level of GIS programs and applications dedicated to it. GIS programs use map portals read for them; this allows for the creation of your own project scenarios based on the data obtained and carrying out extensive data analyses. A distinction should also be made between access to free programs and applications and the commercial programs extended with tools dedicated to specialists in various fields. The analysis of available free programs was carried out by the team of Yap, Janssen, and Biljecki [
2].
So far, also in Poland, many actions have been taken to indicate various methods of spatial analysis of terrain, albeit only on a highly urbanized scale, i.e., on a city scale [
56,
57]. Methods using spatial landscape mapping are also available. These methods are applied for research in spatial design in landscape architecture [
57]. The phenomenon of suburbanization and processes related to it were studied from the perspective of spatial planning in the area of the Podlubie municipality by D. Mazur [
58]. The author also analyzed spatial conflicts in this area, confirming, like many other researchers, that the largest number of conflicts that arise in the process of spatial activities is associated with the uncontrolled sprawl of new housing developments [
58]. A. Stork [
59] conducted analyses related to the predisposition of the area as an area for new office investments. According to the author, one of the important issues related to the location of office buildings is the problem of their location in urban areas. The research made it possible to analyze the attractiveness of adjacent areas, and the collected data became a tool for making planning decisions by setting directions for the search for new locations outside the city center [
59]. Such activities prove what role that data play in the planning process. Beyond the aforementioned analyses, analyses based on GIS methods were carried out by P. Kryczka [
60], who analyzed the suburban municipalities of Wrocław. His conclusions included, among other notions, the need to implement integrated planning, as this will be a catalyst for a coherent spatial policy for the analyzed areas [
60]. The conclusions of P. Kryczka lead to the point where the basis for good data management is their availability. Access to map portals and the possibility of implementing these in GIS programs will allow for key components of integrated urban planning in the context of the MULTIPLY project [
61]. Analyses of high urban landscape buildings were also carried out, presenting digital techniques as methods enabling the analysis of visual impact; these studies were carried out as part of the 2TaLL project, and the research included Warsaw, Wrocław, Vienna, Milan, and Paris [
62,
63].
4. BIM to CityGML Model Conversion Results
A proprietary model was applied for research on the directions of activities confirming the feasibility of file conversion, with standard architectural and construction solutions developed for it. In order to organize and understand the functioning levels of detail of 3D models in geodetic portals referred to as the “CityGML standard”, it is important to understand the definition of LoD levels and the conversion of files and the method of saving data at different levels of detail. LoD levels define different levels of model detail [
15]:
LoD0: a flat surface representation—usually this is the result of projecting the shape of the object onto the plane and represents the outline, e.g., the external outline of a building.
LoD1: a volumetric representation of the object, where vertical spaces are presented; the solids are embossed, i.e., the solids are created from a horizontal outline by vertical embossing; it is a block model with flat roofs.
LoD2: a volumetric representation of a real-world object, presented spatially by a set of curves, a set of surfaces, or respective solids. The shape of the object is generalized, and smaller details are usually omitted. The model is presented with a distinction between flat and sloping roof types.
LoD3: a volumetric representation of a real-world object, presented spatially by a set of curves, a set of surfaces, or respective solids. Here, the superficial real-world objects are represented spatially using a set of surfaces, this is the highest level of detail, and the corresponding geometries include all available shape details, such as the exact roof shape and the exact external wall and roof textures.
To present LoD levels on the basis of common knowledge,
Figure 4 was developed.
The BIM model itself is not a CityGML standard; it should be saved to the IFC format from which it can then be converted to CityGM.
Figure 5 presents a schematic path in which to go through the stages of preparing a model of the designed objects in order to make it available to GIS from the BIM level. File conversions from IFC to CityGML can be executed with the use of publicly available file conversion software.
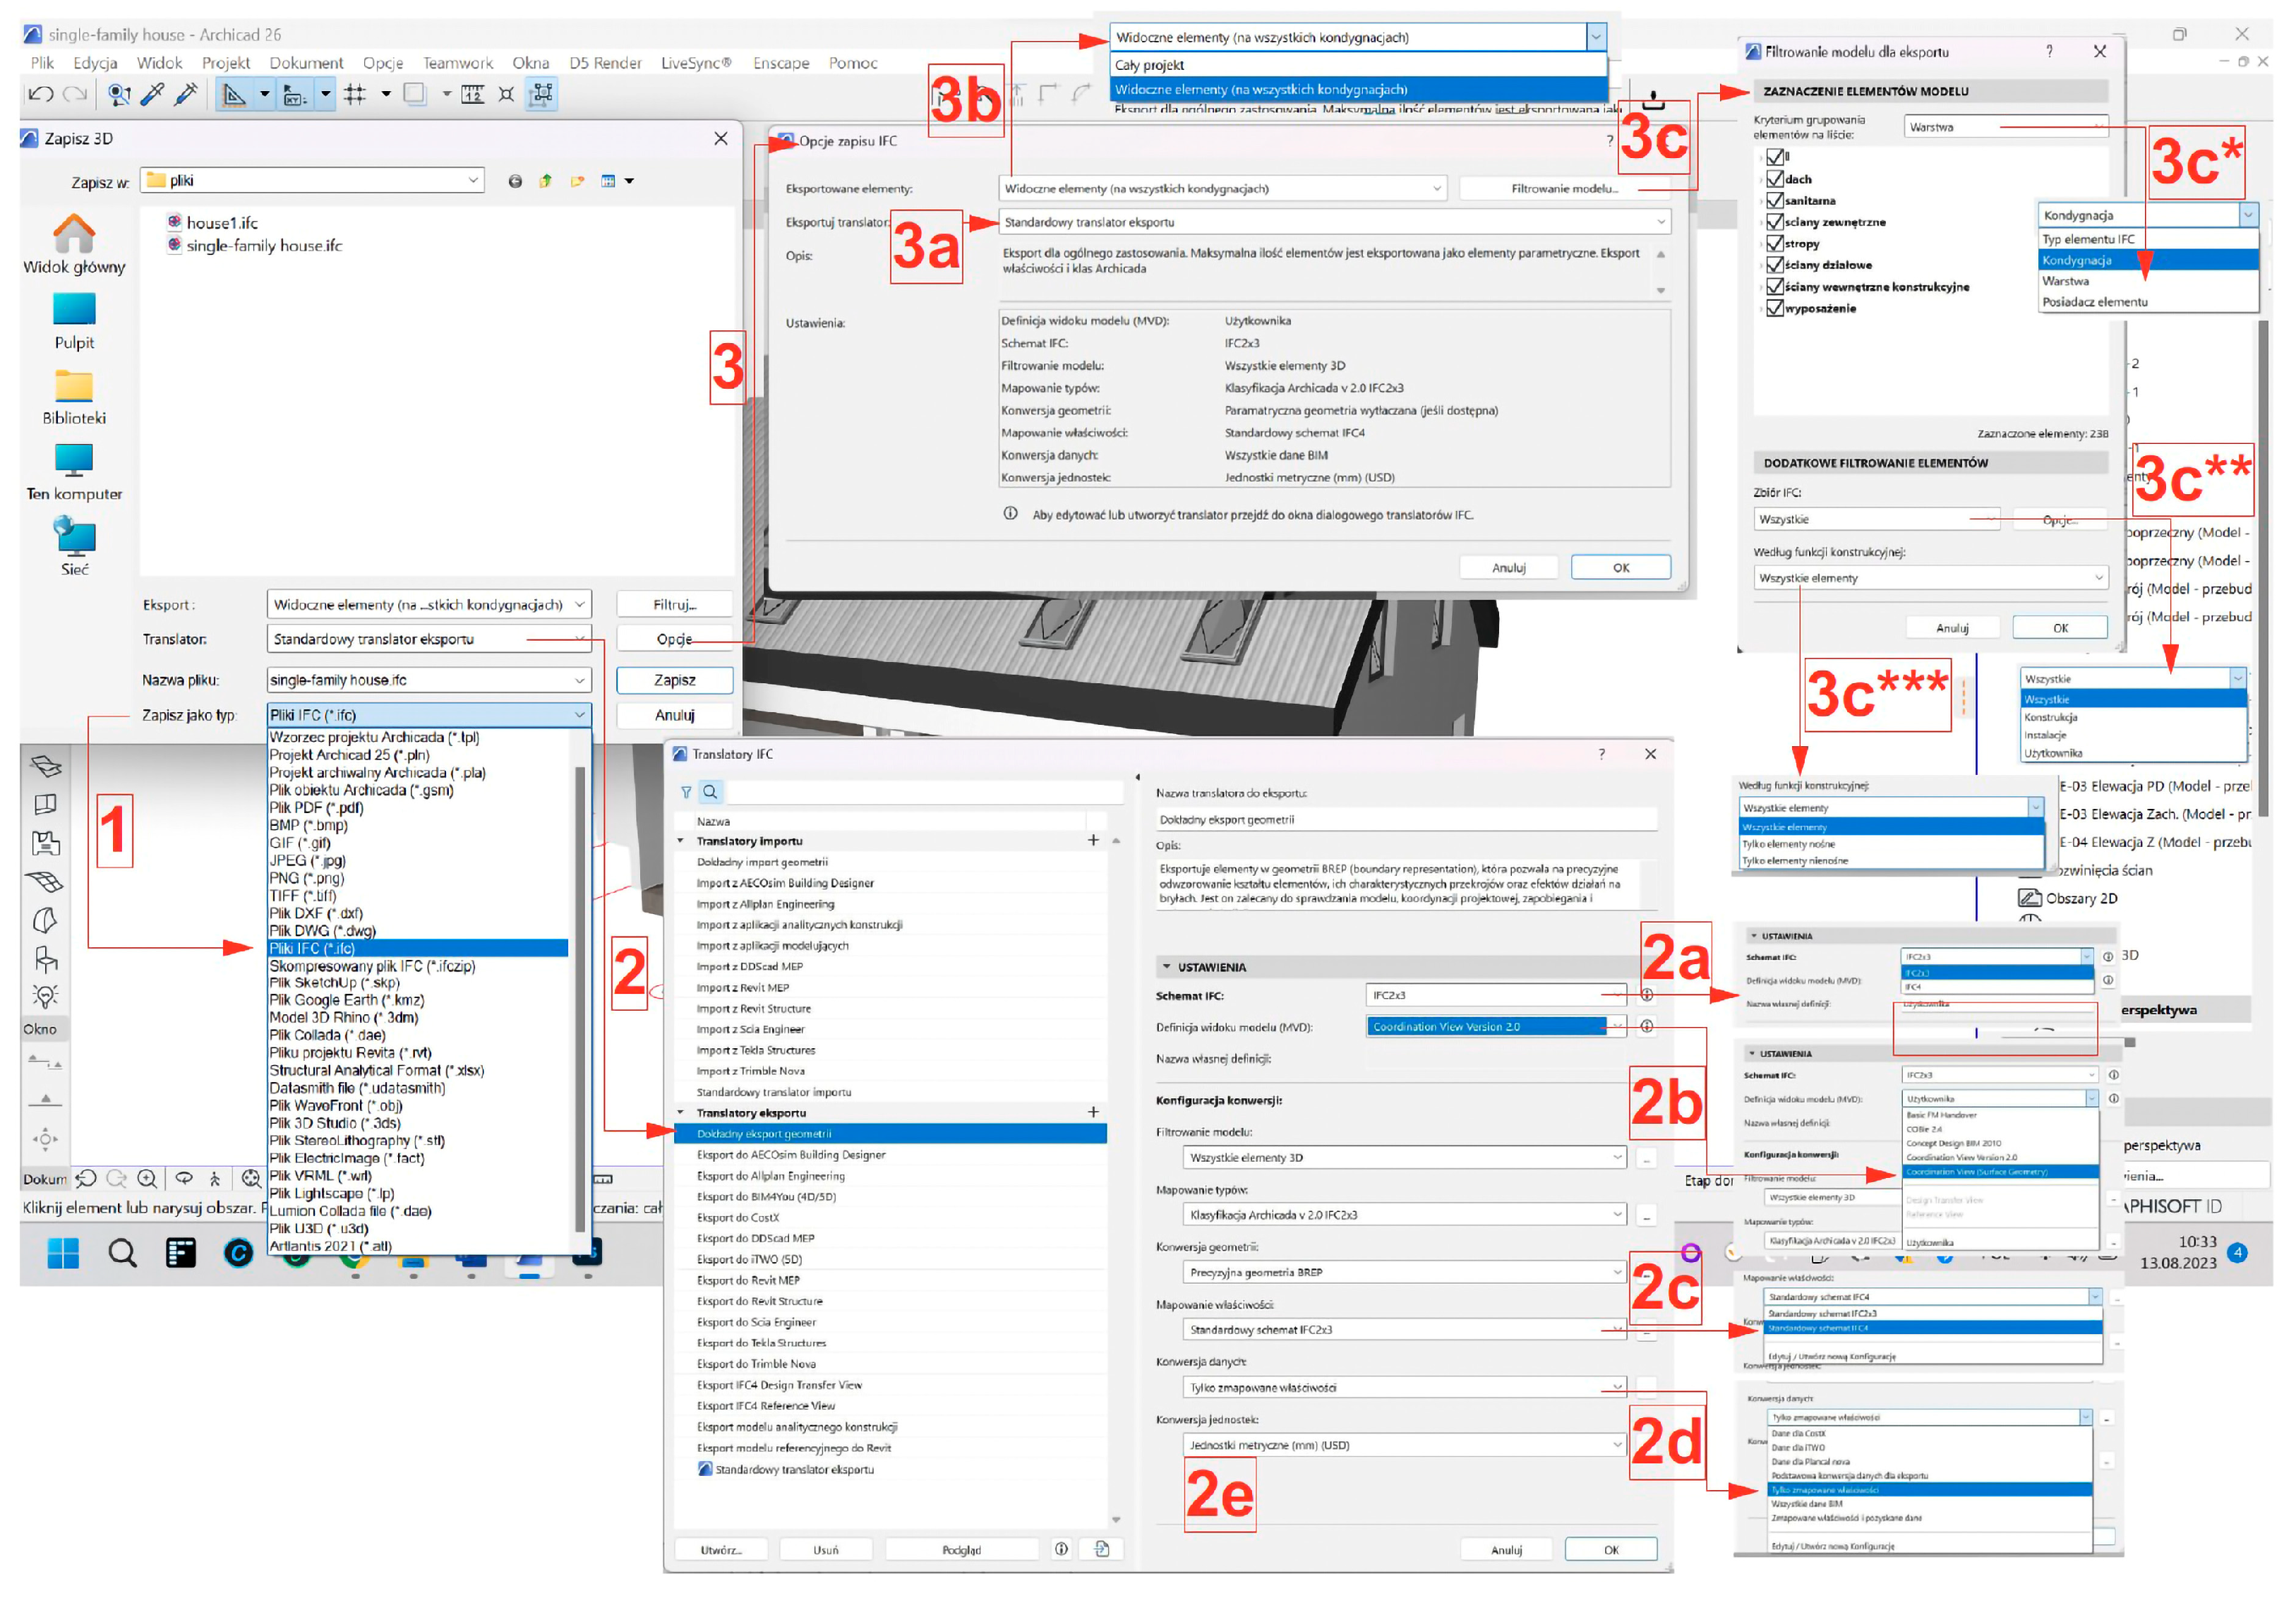
In order to confirm the possibility of executing the procedure, a 3D model was prepared. A model was prepared using its own simple design of a single-family building designed in the Archicad 26 suite, taking into account the design process of the BIM technology. The prepared amount of classification of IFC layers was minimized for research purposes. The object was saved to the IFC format 2x3, as presented in
Figure 6.
The diagram of the IFC file settings presented in
Figure 6 for saving the model developed in Archicad 26 begins with saving the model. The individual steps that should be performed are as follows: 1—saving the model in the IFC format; 2—selecting translator settings; 2a—selecting IFC version 2x3 or 4; 2b—setting the MVD (Model View Definitions)—it is recommended to set the Coordination View (Surface Geometry); 2c—setting the property mapping according to the IFC 2x3 or IFC 4 scheme; 2d—setting the data contained in the IFC file; and 2e—setting the unit system.
Item 3 contains settings for the IFC saving option: 3a—selecting a previously set translator that will be used during writing to IFC; 3b—determining the scope of saving the number of project elements to IFC (only the model or the entire project); and 3c—setting the filtering of the model (selection of how to group elements into collections).
Further detailed settings include the possibility of grouping elements: 3c*—discerning types of IFC elements, assigning to stories to layers, to the owner; 3c**—assessing the possibility of setting additional filtering of elements of the IFC set for final saving, saving all elements, saving only structural or installation elements, and saving according to the user definition; and 3c***—selecting the possibility of saving due to the construction function, i.e., saving all elements, or only load-bearing or only non-load-bearing elements. The resulting IFC file was used for conversion to CityGML in further research and analysis.
The process of preparing the model and saving it to the IFC format can also be performed by utilizing other CAD programs, e.g., in Revit or Vectorworks, but only the resulting IFC format is required for further research and analysis.
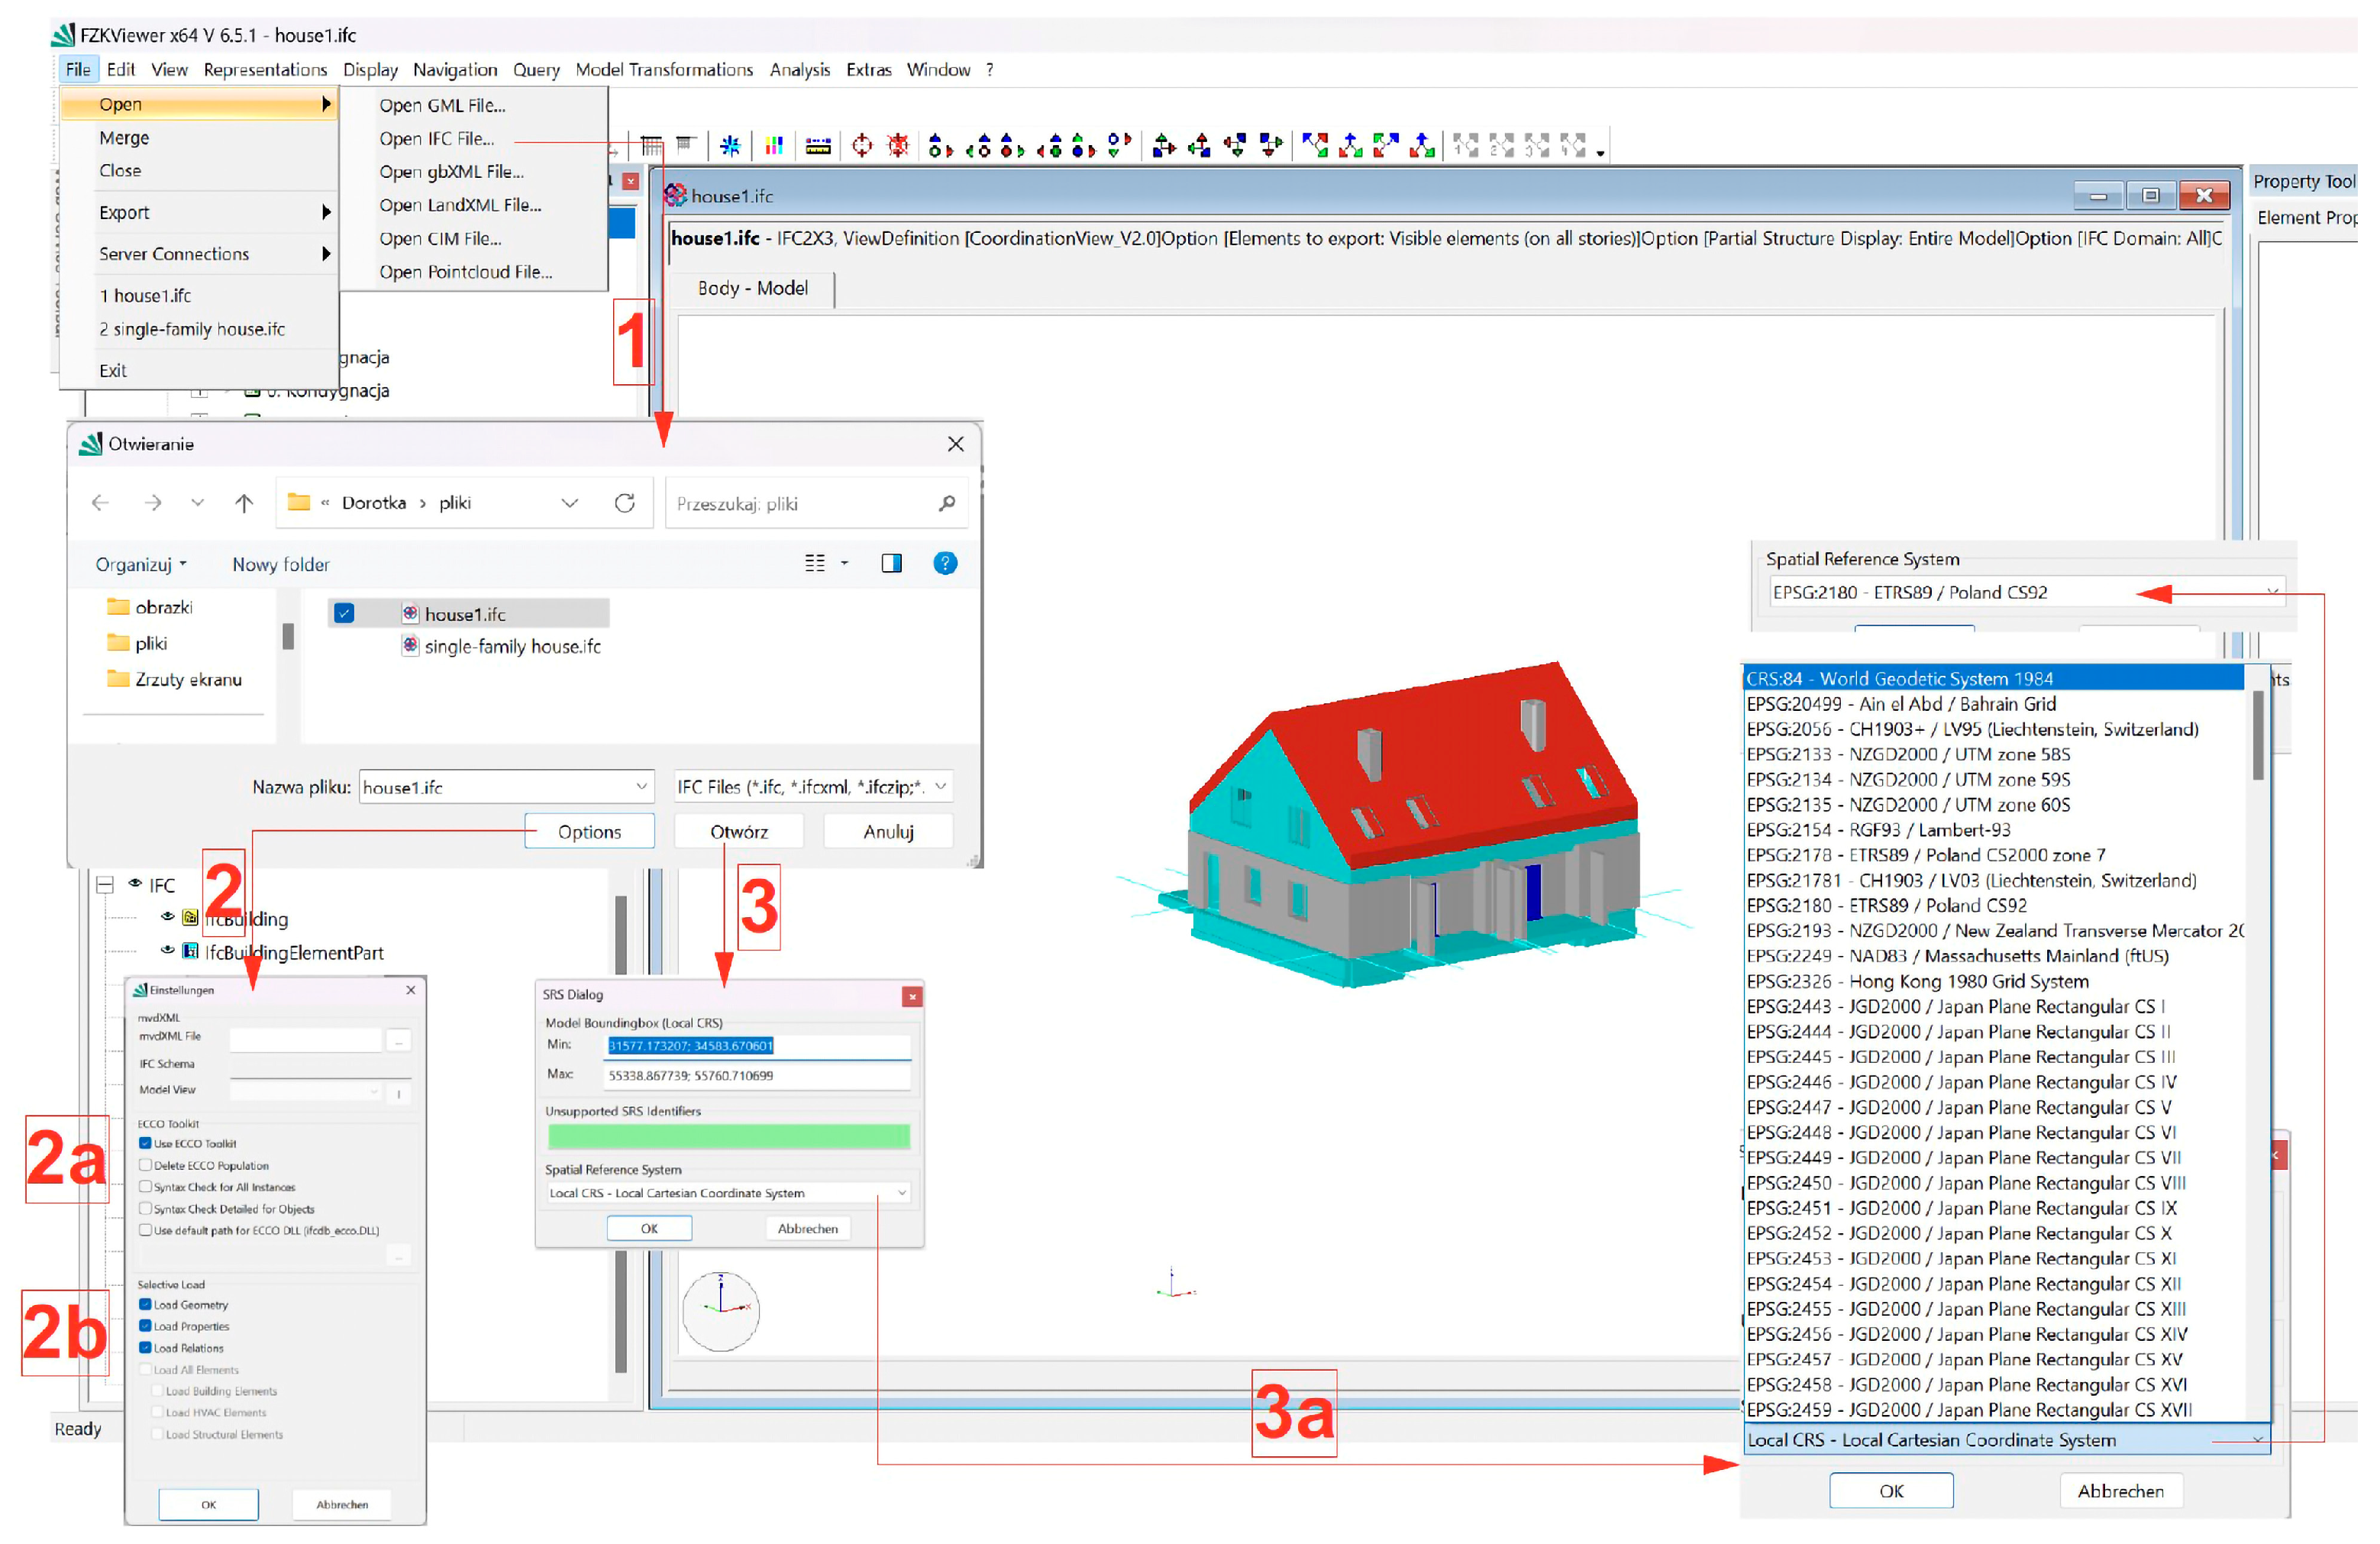
The open FZKViewer x64 V5.6.1 file conversion software was selected for further action. Loading the IFC file was performed in a browser that supports the CityGML format. The entire model preparation and conversion path is presented in
Figure 7 and
Figure 8.
The steps presented in
Figure 7 that were performed when loading the IFC file into a browser that supports the CityGLM format are as follows: 1—selecting the IFC read format; 2—setting additional read options, i.e., the implementation of data in the mvd XML format (the XML based language mvdXML was developed to define MVDs with IFC, it also has the ability to define allowable values at particular attributes of particular data types); 2a—the option to load ECCO data; 2b—setting the range of loaded data geometry, properties, and relations between objects; 3—when opening the file, the Local CRS (Coordinate Reference System) should be specified.
Figure 8 additionally presents the possible options for displaying the model, such as by separating individual building elements according to their classification; and the possibility of hiding building elements based on their assignment to a layer or based on element classes. In order to approximate the achievable LoD levels for the CityGML standard, after converting the IFC file, a comparative analysis of the IFC model with different levels (i.e., LoD2 and LoD3) was carried out in the summary of the amount and quality of element data presented in
Figure 9 and
Table 2.
The source building model was developed in BIM—LOD4, using the Archicad 26 suite, while the geometry transformation was carried out via IFC to CityGML with use of the FZKViwer x64 V5.6.1 browser. This enabled the saving in different LoDs. As a result, the LoD3 model was used for further research and analysis, but all levels were transferred for preliminary research to test them.
Figure 10 presents the entire transfer procedure.
The activities that were carried out are presented in
Figure 10, and during the transfer, the following steps were performed: 1—downloaded data from the selected geodetic portal; 2—imported data from the geodetic portal; 3—imported of the prepared 3D model in the form of GML; and 4—combined 3D geodetic data with the 3D model. At this stage, it is suggested to pay attention to the compatibility of both combined models with the SRS (Spatial Reference System).
The new model was implemented in the downloaded map with 3D models; this action demonstrated that conversion of the IFC file is possible, but doing so generates difficulties in the form of the number of steps to implement, as well as in the quality of geometry and semantics transfer. The operation may turn out to be difficult due to the mismatch of models in the modeling method. From the point of view of subsequent activities, it was determined that the type of file that will be added to the map viewer is also significant and may also depend on the selected browser tool or GIS software to which IFC and also other file types can also be imported.
Results of Analyses of Software Solutions That Can Be Implemented
Bearing in mind the above state of knowledge, actions were adopted to assess solutions based on available tools for average users, enabling analyses, data filtering, and GIS design support. ArcGIS GeoBIM gives us the ability to load maps and carry out analyses, as well as to add BIM models, IFC files, and 3D models. This program has various specialized applications and tools for sharing and cooperating with GIS and BIM data. In addition to extensive commercial analytical programs linking GIS with GPS technologies and remote sensing used in computer terrain modeling, open-source GIS software is also available.
The QGIS suite is a program licensed under the terms of the GNU General Public License as an official project of the Open Source Geospatial Foundation [
64]. This suite also performs field analyses and has many functionalities to improve work. QGIS runs on Linux, Unix, Mac OSX, Windows, and Android; and, importantly, due to its open-source code, it is free software. The program works with the simultaneous use of information contained in publicly available geoportals. At the same time, many plugins developed by its users are created for this program, and they are dedicated to various research areas.
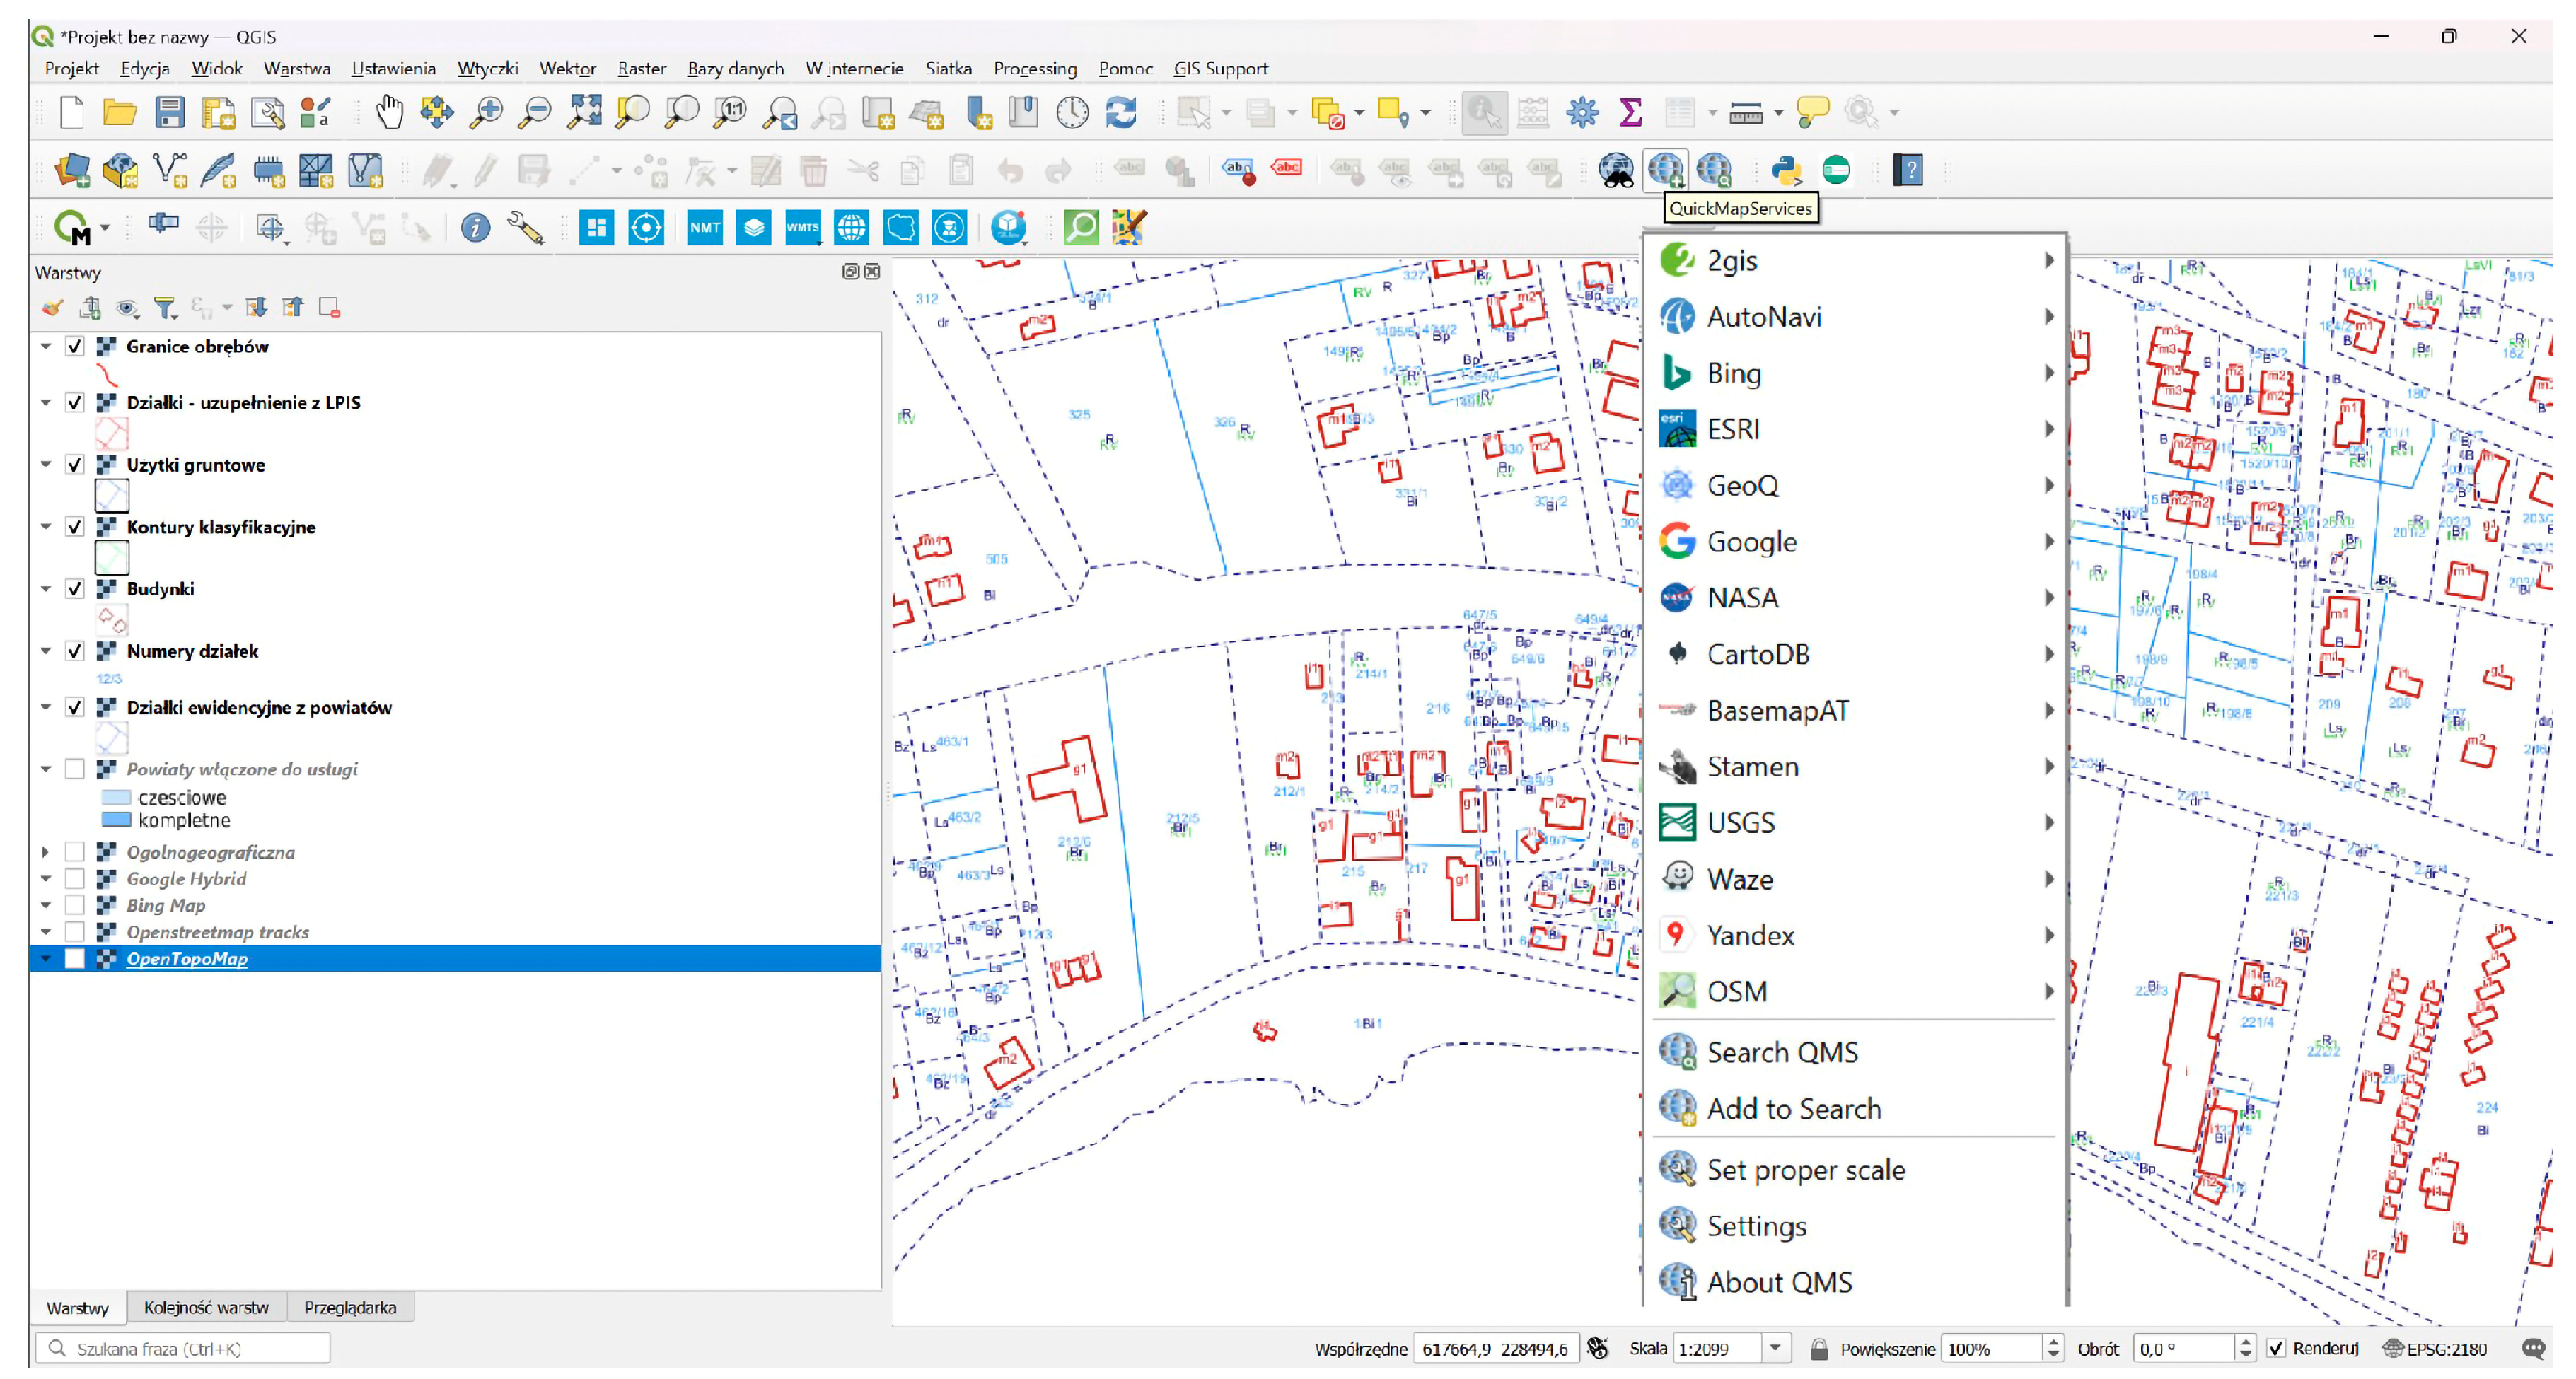
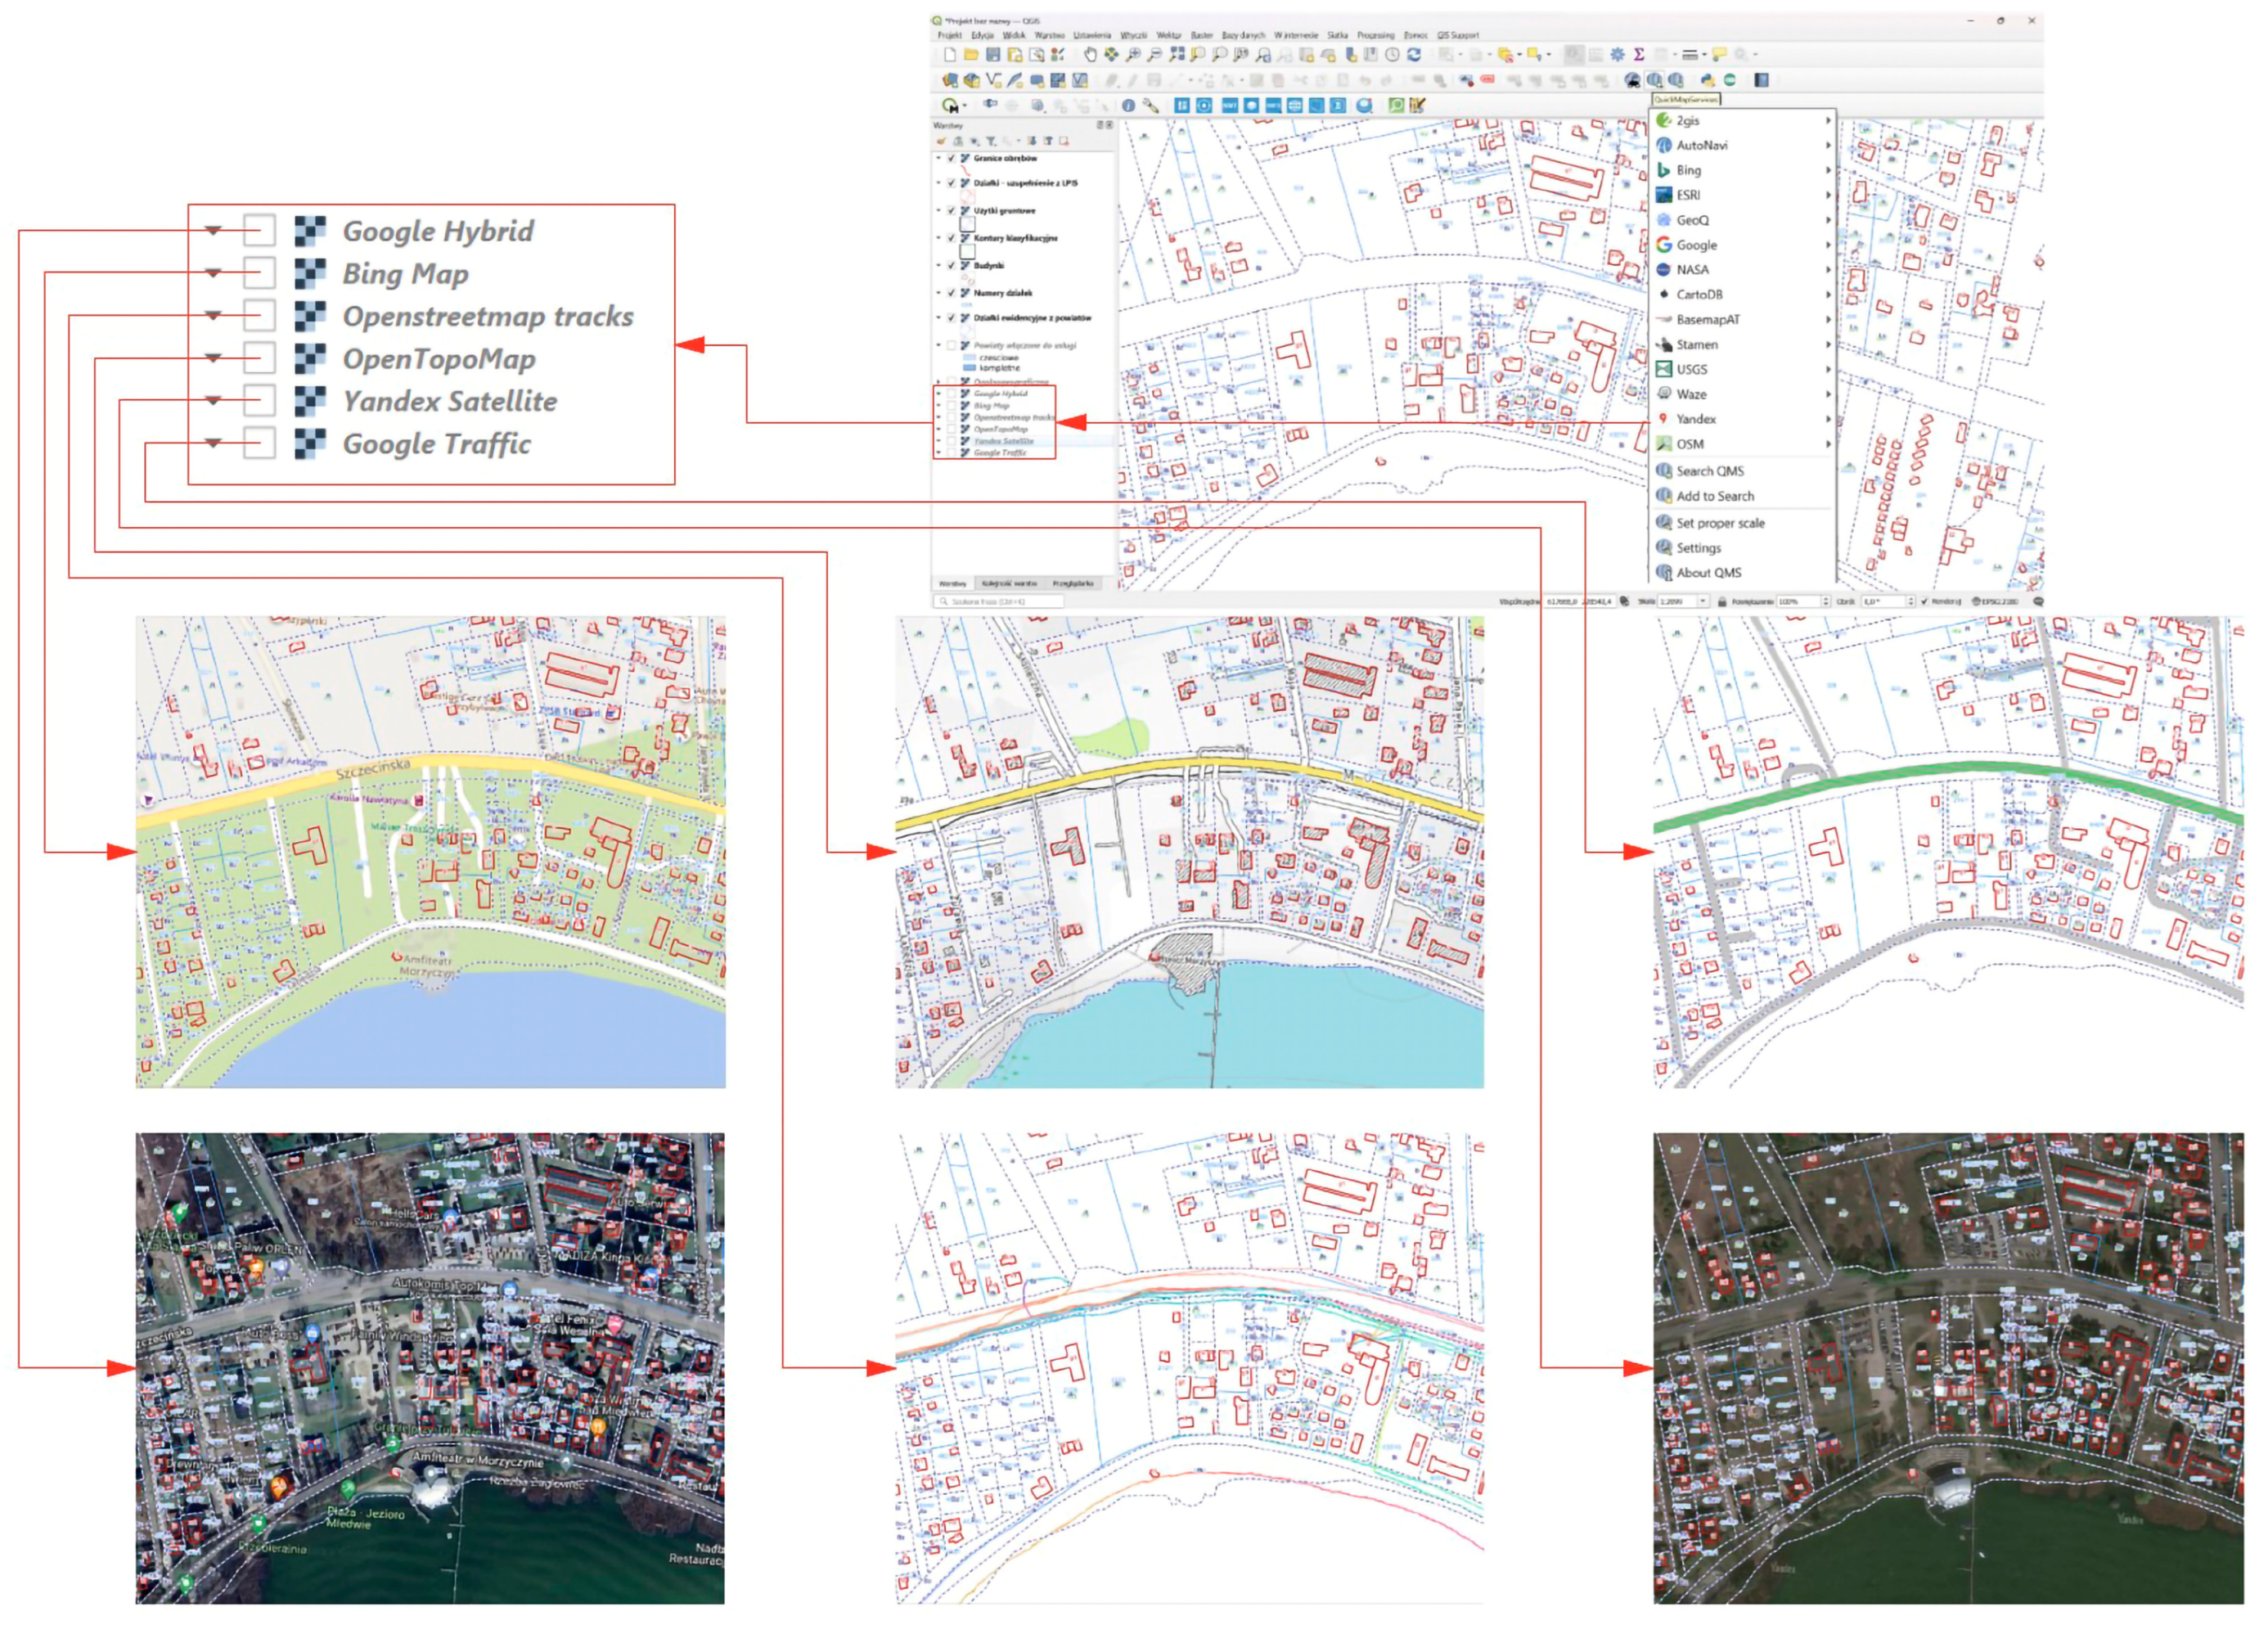
The study analyzed selected plugins and described their use. The QGIS version 3.32.3-Lima suite was employed to prepare the preliminary analyses. This suite analyzes the available map portals and the possibilities of using network services. The purpose of developing a new plugin is to assess the data acquired. It is also recommended to check available sources with databases. Detailed coverage of the area with data that enable us to conduct urban and architectural analyses is necessary for the research, and, for this purpose, as many sources from map services as possible should be used. To obtain information from websites, a plugin nested in QGIS “Open Layers” responsible for communication between QGIS and map portals was employed.
The work uses the latest version of QGIS 3.32.3 Lima, and the QuickMapServices QMS plugin, and this was applied as a plugin to implement map backgrounds as a graphic supplement to the areas covered by the analysis (
Figure 11). As a supplement to the information on the terrain and vectorization, the Earth Explorer and CadMapper services were also utilized (
Figure 12 and
Figure 13).
As part of the test, it is important to take into account all the necessary plugins so as to determine their usability and the possibility of analyzing the data they provide, In our study, the GIS Support plugin (
Figure 14) was imported into the QGIS version 3.32.3-Lima program. The plugin allows for the use of tools such as the following: 1—a search engine for cadastral plots (ULDK GUGiK); 2—the GUGiK NMT tool for reading altitude data from the indicated point of the terrain and for creating an altitude chart; 3—WMS with available national WMS services (borders, utilities, BDOT10k, BDOT500, usages, and many others); 4—WMTS; 5—MAPSTER, which allows us to display a list of old maps collected on the Mapster website, the range of which intersects with the coordinates of the selected point; 6—PRG, downloading borders in the form of polygons of municipalities, districts, and provinces for the indicated types of units. These tools enable easy and quick preparation of a full database of the respective study area (based on the information available in the services).
During the analyses in the QGIS version 3.32.3-Lima program, the WMS service was used, enabling access to many surveying services of government and public organizations that share their data. The data they contain concern cadastral divisions, geodetic numbers, the outline of objects, and, depending on the area, the routing of the utilities network.
Based on the imported data, which were acquired thanks to the GIS Support plugin (
Figure 14 and
Figure 15), a skeleton of the map can be created by taking into account the development, terrain shaping, and communication system.
Another important service to import is WFS (Web Feature Service). For this end, the “Quick OSM” plugin can be applied. The Quick OSM plugin allows for the application of detailed data into the map of the area covered by the analysis, the type of which can be determined using keys specifying the type of object, and then make it more precise using values that detail the function of selected objects. In addition, the information is divided into nodes, lines, relations, points, multilines, multipolygons, and metadata, which are then available in the resulting attribute table.
In order for the data to be complete, the data from the server address of the local geodetic center should be accessed. This gives the possibility of utilizing current cadastral and topographic data. The result of this is a comprehensive vector map with basic data uploaded from the individual websites. At this stage, vector, raster, sampling, geoprocessing, geometry, and database management analyses can be performed, with the use of options available in QGIS or the use of the available plugins that provide a wide range of geospatial analysis capabilities for running family algorithms.
Currently, as of December 2023, WFS EGiB data coverage is not complete and the same for all of Poland. This influences the appropriate preparation of our further research assumptions aimed at preparing a map analysis plugin. However, the lack of City GML LoD2 models in the selected area forces the authors to look for other ways to obtain the necessary information. Due to the intention to create, at a later stage of work, an add-on to QGIS that will allow for a selected analysis of any area, the authors must take into account the lack of the desired data in the selected area.
At the same time, the information and data available for our research are not sufficient for the planned analyses. The data that are important for research, such as roof geometry, building facade height, and building height to the ridge, and the data on construction technology are not information contained in the BDOT500 or EGiB databases. The authors concluded that this type of data would be obtained from other databases in combination and using measurement and descriptive methods obtained from queries. BDOT500 databases are kept by Starosts, who remain responsible for entering BDOT500 data. However, the large number of units responsible for this hinders the smooth filling of data. Most often, this is caused by the poor flow of information or poor organizational issues and the lack of GIS specialists in small centers. This has a significant impact on the existence of the database in a given area and on the amount of data contained in it and updated.
In the area of the studied commune, as of the last analysis in December 2023, BDOT500 data were not entered in the area of the studied municipality (
Figure 16). Therefore, there is no information on buildings not listed in the land or of buildings registered and structures permanently connected with the building, as well as independent structures, communication, fences, land development, sports and recreation facilities, water bodies, and land relief [
65].
5. Results
Currently, there is a 3D model developed in LoD1 for the Kobylanka commune. In the CityGML standard, the model contains many modules, such as buildings, water reservoirs, vegetation, transport, etc. The CityGML standard defines various levels of detail, as shown in
Figure 4. The figure clearly shows that the LoD1 level is not the data carrier necessary for research in the area analyzed.
As a result of the analyses, it was found that, in many places in Poland, there is still a lack of data regarding BDOT500 (
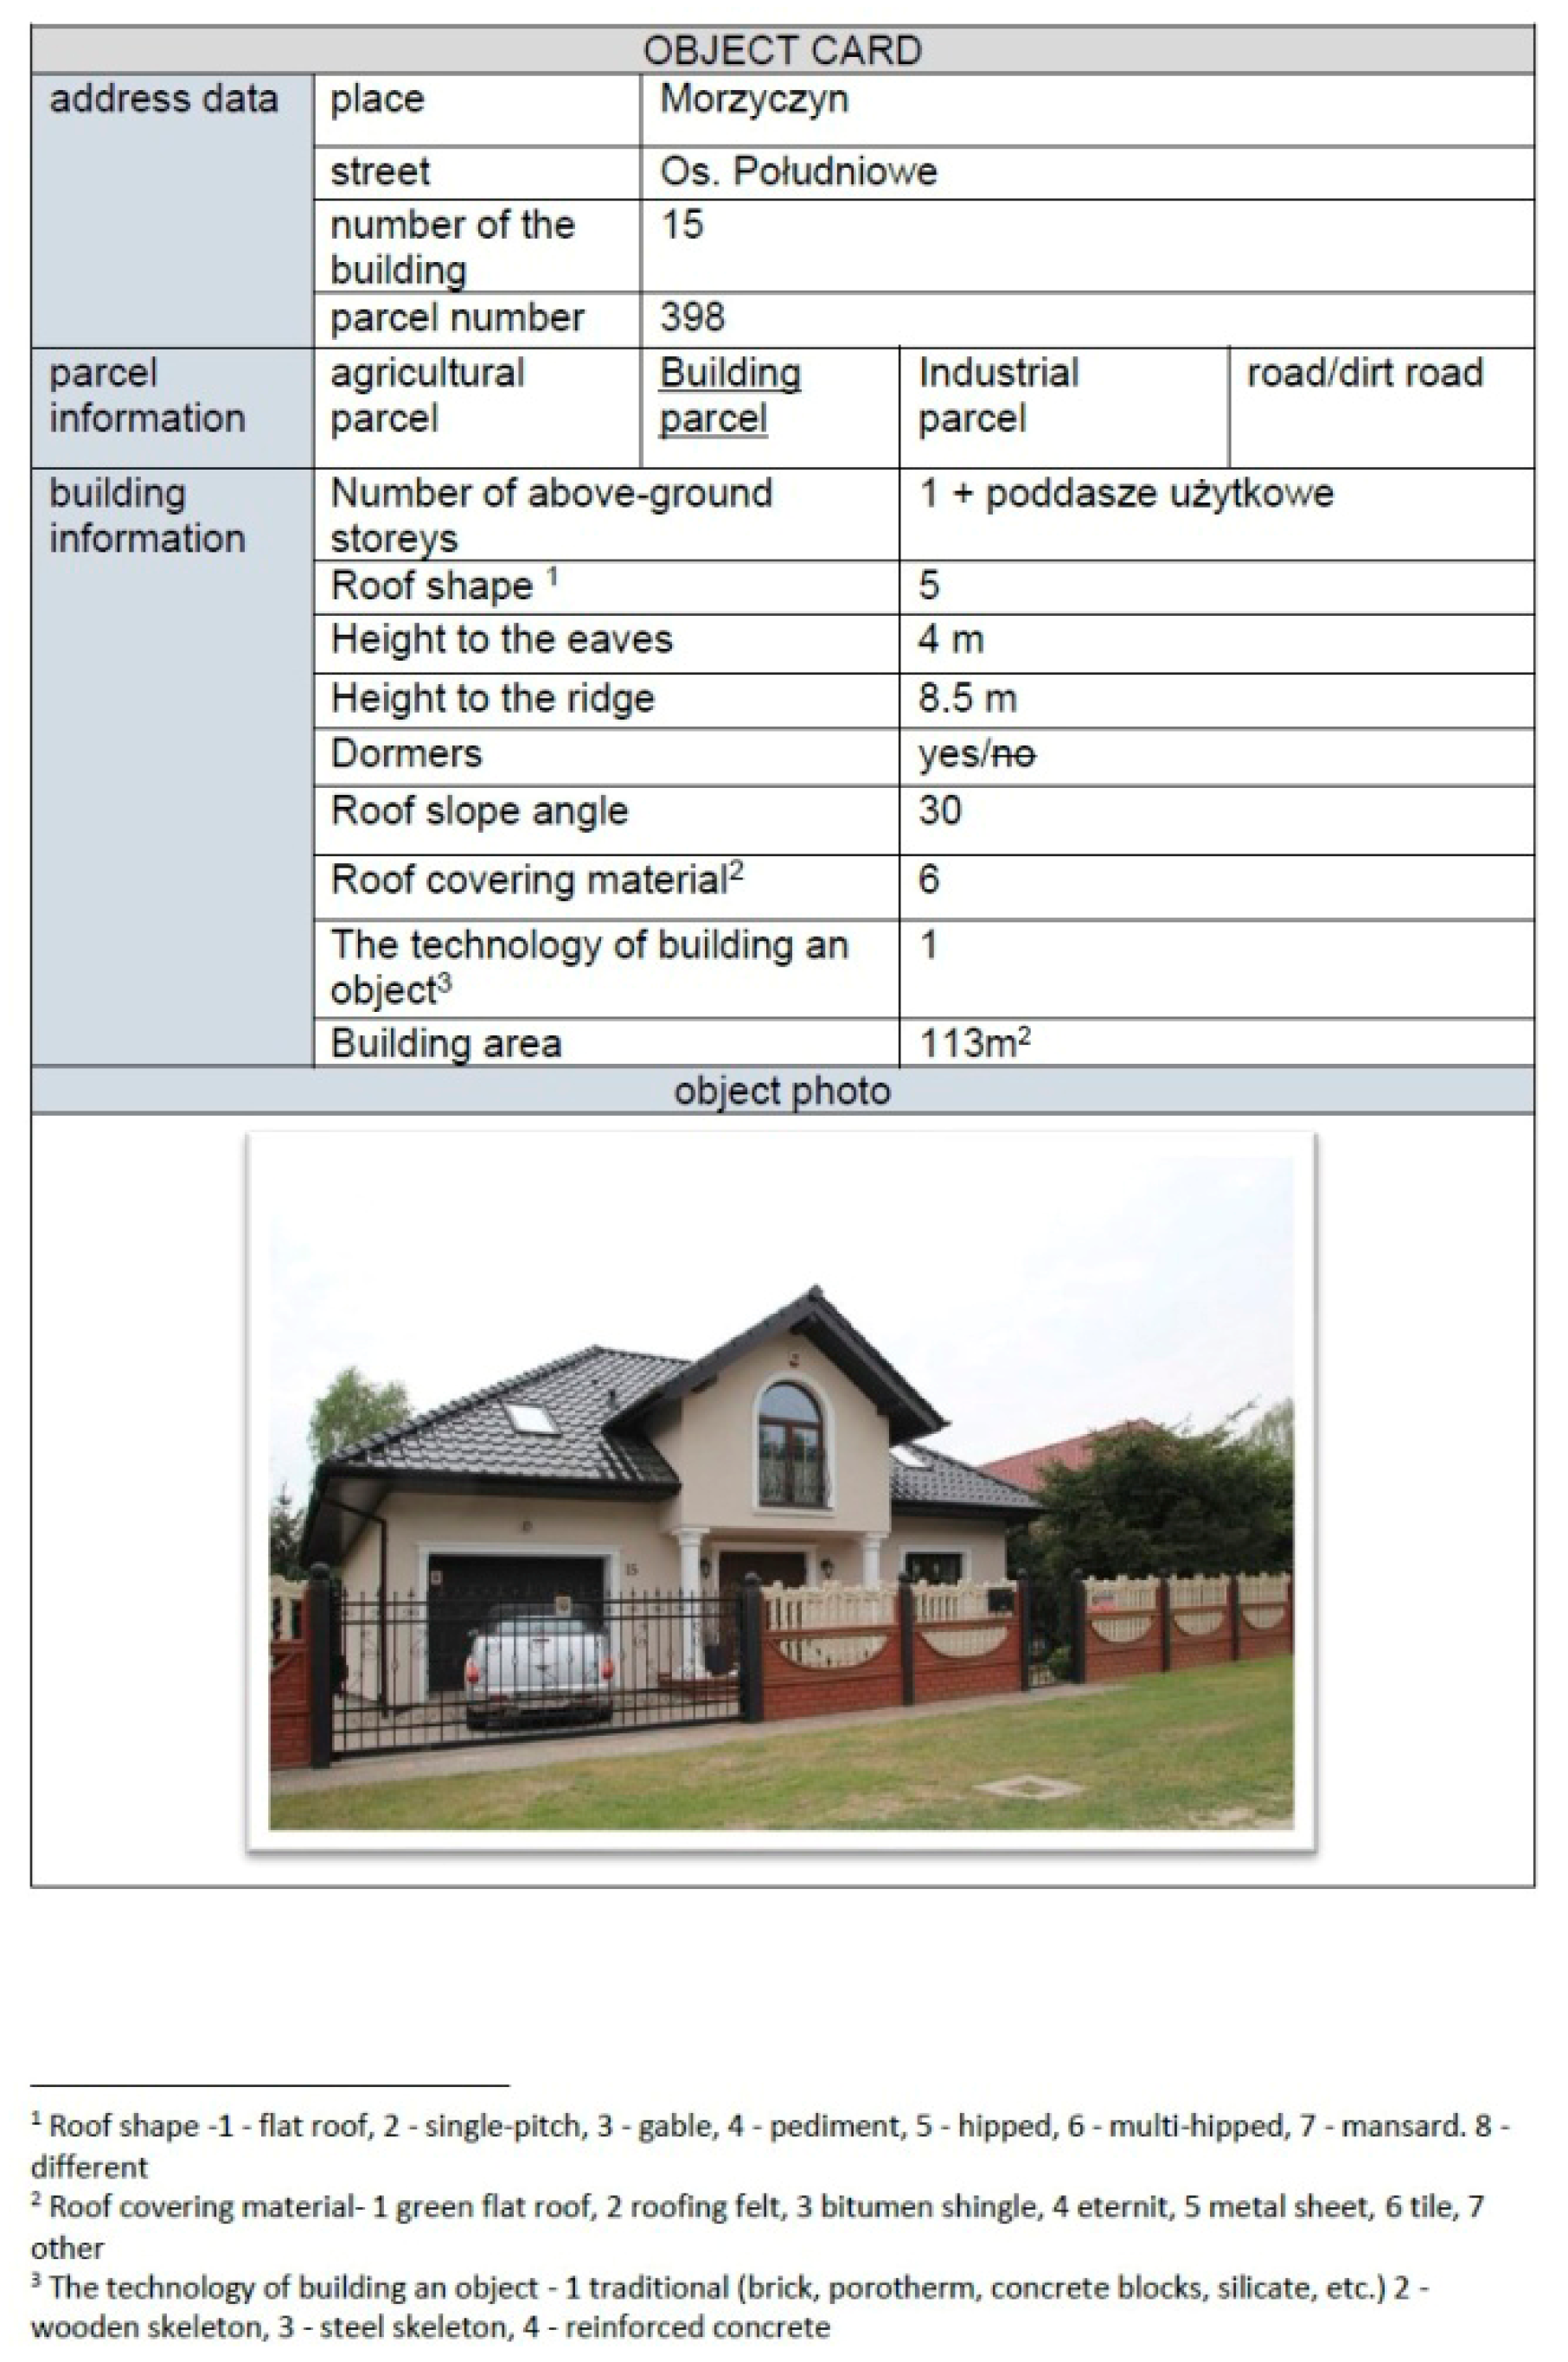
Figure 16). The coverage of Poland with EGiB WFS data is incomplete, making it impossible to develop maps for analysis when it comes to filtering the necessary information. At the same time, the information available for our further research about the objects is insufficient. To perform energy, urban, and architectural analyses, obtaining information on the roof geometry, ridge layout, height of the building’s facade, height of the building to the ridge, and information on its construction technology is necessary. To supplement the missing information, object cards were developed (
Figure 17). The research area was inventoried, and 700 cards were prepared by the end of 2019. Detailed photographic documentation was also made, which can be used to prepare models using photogrammetry.
It should be emphasized that the BEDOT500 and EGiB databases, in accordance with Polish legislation, are not intended to collect information on the height of objects. Therefore, other types of databases, such as DSM or LIDAR, should be used.
The research involved measuring the height and precise geometry of the roofs by using rangefinders. The available DSM data, in this case, were not sufficiently accurate (e.g., in large cities in Poland, the accuracy (LAS) was 12 points/m2). At the same time, manual measurements were made to verify the acquired data and to prepare for the next stage of the investigation. The manual measurements performed will be used to create a machine learning script verifying the roof height and geometry recognition system from DSM and LIDAR databases in the absence of CityGML LoD2 in the area. At the same time, it should be emphasized that the validity of 3D data resources in the research area had to be verified through a query.
These data supplement the missing building information. All data were collected directly from the area, and rangefinders were used for measurements. On the basis of the collected data, SMALLBIM models can be developed for objects of strategic importance.
The feasibility analysis for implementing BIM into CityGML demonstrated that it was possible to use this path for 3D objects modeled on the basis of the inventory. The subsequent step is to prepare BIM models for CityGM, the path of which is presented in
Figure 6,
Figure 7,
Figure 8 and
Figure 9. This action will also allow us to attain the desired level of detail when converting files from BIM to CityGML in order to implement them in the area of the municipality subject to research efforts.
The conducted research organized the state of knowledge and made it possible to carry out an analysis aimed at taking pilot actions in subsequent studies in the direction of creating a database plugin for spatial analyses. The data obtained at the earlier, already discussed stage will be used to save in XLSM, XLSX, and CSV formats, e.g., using Excel. In the program, specific information will be assigned to each cell, which, in further stages, will enable the incorporation of the data contained in the forms into the QGIS program responsible for loading spatial data.
6. Discussion
When the research began, it was expected that, for the selected municipality, the amount of available data would not be as large as for a large, developed city. Still, in reality, there are even fewer areas covered by current data. The query of databases and map portals allowed for a better understanding of other problems that were encountered. Among others, these concern the amount of supporting tools and plugins required to implement the already existing and newly created data. A large number of plugins indicate the need to develop current tools and the need to enable them to work at different analytical levels. The variety and amount of information contained in individual plugins and, at the same time, the lack of specific information hinder the conduct of the necessary analyses. A clear result of the research was the determination of the missing information and data that are necessary for further research and for the creation of a group of tools that can support the design process.
Although the reviewed tools support the analytical process well, there is a clear lack of urban and architectural plugins. The planned first action towards the development of a new plugin for the QGIS program is to group this information. The next action is to add the data prepared during the query from the developed facility cards, as well as new information sourced in researching the construction permits issued.
The present article analyzes the path that should be followed when creating a plugin for QGIS. For the subsequent stage of research, it is assumed to develop a range of functionalities for the planned plugin. The planned functionalities include the option to download, generate, and supplement data for analyses related to spatial planning.
The created databases based on the collected materials of the object cards are intended to be made available via a plugin from the QGIS program. The plugin will allow us to add further data resulting from subsequent analyses. The plugin will also be designed to filter the data originally entered and provide a preview of the object tabs. A process for conducting thematic, as well as spatial and energy, analyses is also to be set out. Programming work will be possible using the Python programming language. Pilot activities are aimed at obtaining answers to issues related to the following:
Analysis of averaged parameters of objects from a specific area in order to prepare development conditions;
Analysis of the percentage share of individual usable forms of plots from the selected area in order to manage investment areas;
Analysis of the amount and types of building materials used to determine the carbon footprint;
Analysis of energy demand;
Environmental analysis.
However, it was found that there are just a few programs through which interaction with GIS data is possible, and even fewer free tools. By design, it was decided to employ QGIS for analysis, as it allows for the expansion of its functionality without interfering with the source code. The programming language that can be utilized to develop the new QGIS plugin is Python. It is expected that the planned plugin will be useful and required for energy, urban, and architectural analyses for the indicated areas. It is assumed that the plugin, based on the data entered from the selected area, will enable the assessment of energy demand. Moreover, it will enable us to ascertain the amount of required and feasible renewable energy sources. It will, in addition, improve urban analysis by grouping guidelines for the indicated area and will define guidelines for decisions on development conditions in areas not covered by a spatial development plan. Furthermore, it will enable analysis and enhance the management of investment areas. What is more, the newly designed three-dimensional models are expected to be monitored when building permits are issued and implemented in municipal databases, which will enable area updates.
If the described functionality is achieved, the planned operation of the plugin will allow for the generation of information on the analyzed area based on the entered data in accordance with the developed scenario in the form of xml or xmls schedules.
7. Conclusions and Future Work
The discussed research problem concerned the possibility of combining new BIM models, as well as inventoried 3D objects with geospatial databases. The analysis reveals that there is no appropriate tool that would gather all the parameters necessary to develop energy, urban, and architectural analyses. It is, hence, reasonable to develop a QGIS plugin that will allow for simultaneous work at many analytical levels. The problem currently faced by municipalities and district offices in Poland due to the lack of local plans mostly concerns the possibility of issuing development conditions for newly planned investments. However, from the point of view of the future, it becomes important to supplement the databases with building permit decisions [
6,
8]. This is important from the point of view of sustainable urban development, and it is an issue encountered not only in Poland.
The research provided information on the possibility of converting BIM files to CityGML, as presented in
Figure 4,
Figure 5,
Figure 6,
Figure 7 and
Figure 8. The steps performed organized the directions of activities for the implementation of 3D models for map viewers and GIS programs. The conducted analyses enabled the determination of the state of available information and discussion of the research materials from the queries, which resulted in the obtained data in the form of object cards. Research and analyses clearly determined the need to implement a plugin for urban and architectural analyses for work with data for a selected municipality.
The database resources required for further urban planning (generally for spatial understanding) and for embedding them in the context of the built environment require data visualization in 3D space. Commonly, the representation of existing buildings is already developed in the form of LoD1 data models, which, however, differ depending on the specificity of the object. This, in turn, may render it difficult for researchers and urban planners to perform their analyses [
11,
66]. As future works, the possibility of performing a geometric analysis of models and their complex surfaces, taking into account roof types, is also foreseen for new buildings added to the portals under the account of energy and environmental interrelations and sustainable energy use in buildings.
The possibilities offered by current digital and open data tools, as well as advanced GIS software, allow for the development of an own path for a tool supporting urban analysis. Modern scientists and researchers are always surprised by the new solutions that AI offers. Currently, the new QChatGPT plugin has been added to QGIS, the functionality of which is still not fully discovered, so the planned field of analysis and tedious work on BIM modeling for CityGML may evolve and accelerate further planning and analysis, as well as enhance the possibility of developing the planned plugin.


