Abstract
Access to clean drinking water is fundamental to human health, but a significant portion of China’s population lacks this essential resource due to low water quality. Point-of-use (POU) water filtering systems, offering ease of installation and maintenance, have emerged as a viable solution for providing clean drinking water in China. However, despite their advantages, the adoption rate remains below 20%. This study investigates whether and how price affordability affects the adoption of residential POU water filtering systems in China. In doing so, we conduct a quantitative analysis of the national POU water filtering systems sales and household income data from 2007 to 2022 in China. Our results show that the ratio of the initial purchase price to per capita disposable income and the adoption rate of POU systems in China are strongly positively correlated. Our findings shed light on potential pathways to facilitating their wider adoption, not only in China but also in other emerging countries.
1. Introduction
Access to safe and clean drinking water is a fundamental human right and a cornerstone of sustainable development. In China, a nation with diverse landscapes and a vast population, ensuring water quality presents a complex and growing challenge. This is due to various factors, including inadequate infrastructure [1], unsatisfactory sanitation control [2], contamination of limited surface water resources [3,4,5,6,7], the depletion of groundwater [8,9,10], rapid urbanization [3,11,12] and climate change [13,14]. For instance, a majority of China’s cities (over ) struggle with water scarcity, while pollution chokes many rivers (over ) and lakes (). In addition, nearly 300 million people living in rural areas do not have access to safe drinking water [1,15].
China’s population distribution adds complexity to the water challenge. While over 90% of the population resides in the eastern half of the country, less than 5% are distributed across the southwest, northwest, and northern frontiers. The highest population density is concentrated in the lower Yellow River and Yangtze River areas [16]. Unfortunately, the quality of drinking water in the eastern part of China is significantly lower than in the western part (See Figure 1). This geographical disparity presents an added challenge to addressing the nation’s water problems. In addition, household incomes in the eastern part are usually higher than in the western part. The income inequality among households is primarily associated with inequality within regions between rural and urban areas, rather than among regions [17,18].
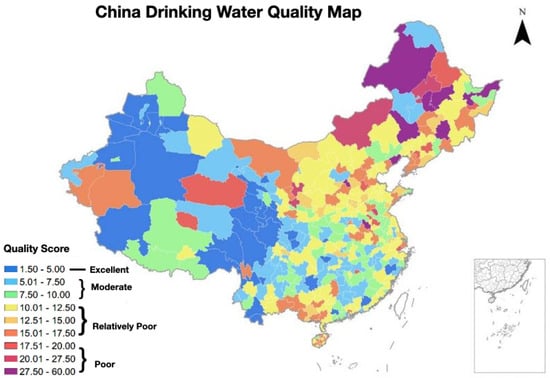
Figure 1.
China drinking water quality map of 2019 [19]. The quality scores were based on the weighted scores of over 60,000 monitoring points classified by the Ministry of Ecology and Environment’s environmental quality standards (Class I–Class V).
Thanks to rapid advancements in water treatment technologies such as activated carbon filters [20,21], ultrafiltration membranes [22,23], reverse osmosis (RO) systems [24,25], ultraviolet (UV) filters [26,27,28] and ceramic filters [29,30], point-of-use (POU) drinking water filtering systems have emerged as a promising solution to address water contamination at the household level in China.
A POU drinking water filtering system is installed directly on the household water supply line and filters water at a single point of use, such as a specific faucet or drinking water dispenser. These systems are typically installed under the sink or on the countertop, close to where the water is consumed. They remove hazardous contaminants like microbes [31], organic compounds [32], sediment [33], chlorine [34], lead [35], and other chemicals exceeding regulation limits [36,37], while preserving healthy and essential substances for human health [38].
POU residential drinking water filtering systems offer many advantages that make them a practical solution to ensuring access to clean and safe drinking water. They are typically installed at the specific point where water is consumed, which ensures that clean water is readily available for drinking and cooking without the need to wait for centralized filtering or rely on bottled water. These systems are often easy to install, maintain, and repair. Moreover, they are usually more cost-effective than whole-house filtration systems, making them suitable for both urban and rural residents [39].
Despite their many advantages, the adoption rate of POU residential water filtering systems was only in China in 2022 [40]. In this paper, we study how price affordability influences the adoption of POU water filtering systems in China. In particular, we quantify how the increased price affordability contributes to the fast adoption of POU residential water treatment systems. We further demonstrate how low affordability remains a key barrier to wider adoption.
2. Materials and Methods
In this section, we introduce the adoption process of point-of-use water filtering systems in China. We then analyze the use cost of point-of-use water filtering systems by calculating the annual total cost of ownership within ten years. Next, we compare the initial purchase cost with the average disposable income per capita and consumer expenditure data. Finally, we conduct a correlation analysis to investigate the relationship between price affordability and POU system adoption.
2.1. Data Collection
Measuring the price affordability of POU water filtering systems requires both average personal income data and the cost data of the systems themselves.
We collected per capita income and expenditure data in China from 2007 to 2022 from the National Bureau of Statistics of China [41]. The income data consists of the following items: average disposable income per capita, average total expenditure per capita, and average discretionary expenditure per capita. The average disposable income per capita is calculated by taking income earned from all sources, including wages, government transfers, and rental income, minus taxes, savings, and some non-tax payments, including fines, forfeitures, and donations, and dividing by the total Chinese population. It is a measure of the living standards of the population. The average total expenditure per capita measures the average annual expenditures of all consumer units including housing, transportation, food, insurance and pension, healthcare, education, and discretionary expenditure. Average discretionary expenditure per capita includes nonessential expenses like dining out, shopping, entertainment, and subscription services. Purchasing point-of-use drinking water treatment systems belongs to discretionary expenditure because it is considered a nonessential expense.
To quantify the cost of point-of-use drinking water treatment systems, we collect published sales data of point-of-use water filtering systems from major home appliance data platforms. Specifically, we compare the national sales revenue, units sold, units manufactured, and average price from the year 2007 to 2022. Note that the sales data used in this research are aggregated data at the national level because we do not have access to historical data at local levels.
Despite the increased price affordability of residential POU water filtering systems, their adoption rate in China remains below [40]. To better understand how adoption rate changes along with sales metrics and income data, we normalize the sales data and disposable income data by dividing them by their respective maximum values. We then visualize the growth trends of the adoption rate and the normalized revenue, units sold, units manufactured, average purchase price, and disposable income.
The costs of owning POU water filtering systems include purchase cost, installation cost, filter replacement cost, and water and electricity usage costs. In order to estimate the total cost of ownership, we crawl product description data from a major Internet Retailer—JD.com [42]. The dataset includes product information on the top 72 models sold in April 2020. For each model, we collect the following information: Rank in terms of units sold, brand, model number, price, flow rate, pure-to-drain ratio, volume, water cost per liter, and filter lifespan. These models are all under-the-sink water filtering systems for residential use. They use either ultrafiltration membrane technology [22,23] or reverse osmosis technology [24,25]. They all require electricity to operate. We then estimate the annual total cost of ownership by assuming a 10-year lifespan, which is the average lifespan of a water filtering system [43].
2.2. Metrics
The price affordability is measured by the purchase price to disposable income ratio. In China, most households usually have saving habits and only spend a small portion of their income on nonessential products and services. It is natural to also include price to total expenditure and price to discretionary expenditure as key indicators of affordability.
In practice, the annual cost of ownership could be a better indicator of price affordability than the purchase price. Unfortunately, we are unable to track the product description data for all the years from 2007 to 2022 due to limited data availability. Instead, we calculate the total cost of ownership of 72 models sold in China and then conduct a correlation analysis to investigate the correlation between purchase price and annual cost of ownership. Assuming a 10-year lifespan (the average lifespan of a water filtering system [43]), we calculate the annual cost of ownership using the following equation:
where the water cost includes the filter replacement cost, and the additional water and electricity usage cost within the filter’s lifespan (in month).
To study the correlation relationship between price affordability and the adoption of POU water filtering systems, we calculate the Pearson correlation coefficient [44,45] using the Pandas Python library [46].
The adoption rate is estimated by using the following formula:
where we estimate the accumulated units deprecated by assuming that a typical POU water filtering system has a 10-year lifespan.
2.3. Data Analysis
We first show how adoption rate changes compared with key sales numbers such as revenue, units sold, units manufactured, average price, and disposable income per capita. Then we compare the adoption rate with three price affordability ratios: purchase price to disposable income ratio, purchase price to total expenditure ratio, and purchase price to discretionary expenditure ratio. These ratios are particularly relevant in China, where households typically save a portion of their income and spend a smaller amount on non-essential items. We then conduct a correlation analysis to study the relationship between price affordability and adoption rate. In the correlation analysis, we normalized the data using the following formula.
where x is the original data point, is the normalized value, and are the minimum and maximum values of x in the dataset, respectively.
In addition, China’s diverse economic landscape contributes to significant disparities in income levels between urban and rural areas [47]. We compare the price affordability for both urban and rural households to study how these economic disparities influence the ability of households to invest in point-of-use water filtering systems.
In addition, the price affordability is also influenced by the sales channels. In China, Internet retailers often offer a cheaper price than physical stores for the same products due to lower operational costs. As a result, products bought online are often cheaper than those bought offline. To study if this observation applies to POU water filtering systems, we compare the price intervals of POU water filtering systems sold online with those sold offline.
3. Results
This section first describes the progress in the adoption of POU water filtering systems in China from year 2007 to 2022. It then presents the results of cost analysis and affordability analysis, followed by the correlation analysis of the adoption rate and the price affordability.
3.1. Adoption of Residential Point-of-Use Water Filtering Systems
Over the last two decades, China’s residential POU water treatment industry has experienced significant growth. The adoption rate of residential POU water filtering systems surges from in 2007 to in 2022 (See Figure 2a). In the meantime, the annual sales revenue has a compound annual growth rate of . It increases from 1.27 billion to 18.5 billion Chinese Yuan. The number of units sold increases from 0.677 million in 2007 to 7.39 million in 2022. The fast growth of water filtering systems sales contributes to its wide adoption.
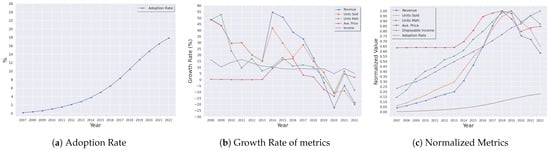
Figure 2.
A comparison of adoption rate and the growth rate of disposal income per capita, sales revenue, units sold, units manufactured, and average purchase price of point-of-use water filtering systems in China from 2007 to 2022.
During the adoption development, the price of the POU water filtering systems becomes much more affordable. In 2007, the average purchase price of a residential POU water filter system is 1876 Chinese Yuan. It remains flat until 2013 due to oversupply. The average price then increases significantly to its peak of 2953 in 2018 due to fast-growing demand and relatively tight supply (See Figure 2b). After that, it gradually drops to 2503 in 2022. During these 16 years, the price has only increased by . Unlike the purchase price, disposable income has enjoyed steady growth. It has quadrupled from 8584 in 2007 to 36,883 in 2022. The growth rate of the average price is significantly lower than that of sales revenue, units sold, units manufactured, and disposable income. The price to disposable income ratio decreases from in 2007 to in 2022, which implies that residential POU water filter systems have become substantially more affordable.
Figure 2c shows that China’s adoption of residential POU water filtering systems undergoes a transition from slow growth to rapid expansion and then to a slowdown. The adoption rate increases slowly and steadily from 2007 to 2012, primarily due to a small number of units sold in the early years. Only 0.677 million POU water filters are sold in 2007. The number stays under 3 million until 2013. The adoption rate increases from in 2013 to in 2019 due to a substantial increase in the units sold. After 2019, the number of annual units sold starts to decline. It drops from 2019’s 11.37 million to 7.39 million in 2022. Therefore, the adoption process gradually slows down.
3.2. Cost Analysis
The costs associated with using residential POU water filtering systems can vary depending on several factors, including the initial purchase cost, installation cost, filter replacement cost, electricity, water, and other maintenance costs.
The upfront cost of a POU water filtering system widely depends on the brand, model, and features (See Table 1). Basic systems may be more affordable, while systems with advanced features or higher filtration capacity may have a higher initial cost. The upfront cost can be a significant barrier to the adoption, especially for households with limited financial resources.

Table 1.
Annual Total Cost of Ownership of major Point-Of-Use Water Filtering Systems sold on JD.com in April 2020.
Installation costs play a relatively insignificant role in preventing adoption because professional installation is typically included in the upfront cost for POU systems sold in China. Additionally, some systems are designed for easy self-installation.
POU water filtering systems typically have multiple filters requiring periodic replacement, the frequency of which depends on water quality and usage. Replacement filters can vary in price, and costs can accrue over time. Many systems also require membrane replacement periodically, which is usually more expensive than other filter replacements. The frequency of both types of replacements varies based on usage and water conditions.
POU systems use electricity to operate and produce wastewater as part of the filtration process. The ratio of purified water to wastewater varies among systems. While the direct cost of energy consumption and wastewater is generally low, it still adds to the overall expense.
Regular maintenance, such as cleaning or sanitizing components, may be needed. Some homeowners can perform these tasks themselves, while others may opt for professional maintenance services.
When considering the costs of a residential POU water filtering system, it is important to evaluate not only the initial purchase price but also the long-term costs associated with maintenance, filter replacements, and potential additional expenses. In Table 1, we present the annual total cost of ownership for 72 major POU water filtering machines sold on JD.com in April 2020. The median total cost of ownership is Chinese Yuan while the median initial purchase price is 2299 Chinese Yuan.
Due to lower operational costs, products sold online are usually cheaper than those sold in physical stores. This observation also applies to POU water filtering systems. As illustrated by Figure 3, over of POU systems sold online have a price tag below 3000 Chinese Yuan, compared with only of them sold offline. This may also explain the increase in the portion of online sales in the overall sales from 2016 to 2022 (See Figure 4). To increase the price affordability, a promising solution would be to expand the online sales network.
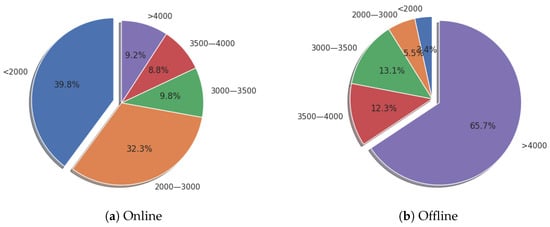
Figure 3.
Price intervals of China POU water filtering systems sold online and offline in 2020.
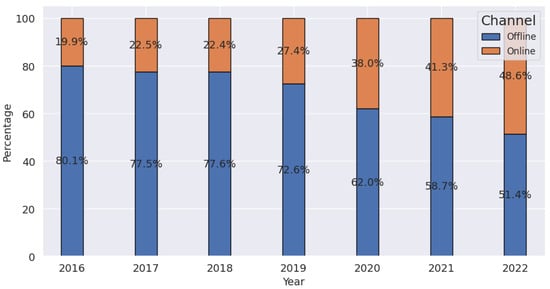
Figure 4.
Percentage of POU residential water filtering systems sales by channels from 2016 to 2022.
3.3. Affordability Analysis
Both disposable income and consumer spending of Chinese households has increased dramatically. Total expenditure per capita increased from 6592 Chinese Yuan in 2007 to 24,538 in 2022 (See Figure 5). Discretionary expenditure on household goods and services has also seen continuous growth, except for the year 2020 when they experienced negative growth.
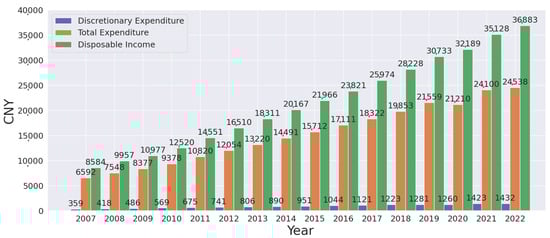
Figure 5.
A comparison of disposable income, total expenditure, and discretionary expenditure per capita in China from 2007 to 2022.
Fast growth in disposable income and a moderate rise in upfront cost contribute to increased price affordability of POU systems in China. We compare three different price affordability metrics: price to disposable income ratio, price to total expenditure ratio, and price to discretionary expenditure ratio (See Figure 6). The price to disposable income ratio dropped from in 2007 to . Since many Chinese households have saving habits, not all disposable income is spent. Thus, the price to total expenditure ratios tends to be higher than the price to disposable income ratios. The price to total expenditure decreased from to during the same period. Among all the spending, discretionary spending such as household products and services only make up a small part. The price of discretionary expenditure dropped from to . According to these metrics, the upfront purchase cost is still too high compared to the amount that they are willing to spend on nonessential products and services. Moreover, the annual total cost of ownership is also high compared to both personal income and spending (See Figure 7). This echoes the observation that the adoption rate is still low (less than ) despite the fast growth of the POU water filtering systems industry.
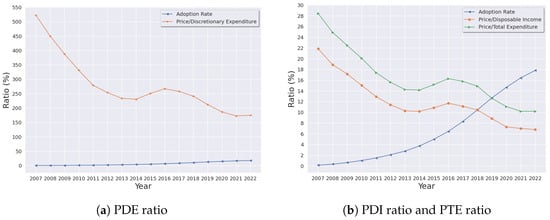
Figure 6.
A comparison of point-of-use water filtering systems adoption rate and three affordability metrics: price to discretionary expenditure (PDE) ratio, price to disposable income ratio (PDI), and price to total expenditure (PTE) ratio in China from 2007 to 2022.
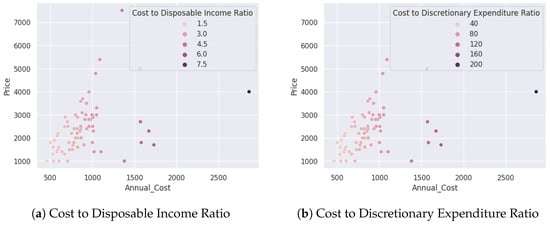
Figure 7.
Scatter plot of the initial price and annual total cost of ownership of 72 major POU machines sold in April 2020 compared with disposable income and discretionary expenditure.
While the affordability of residential POU water purifiers in China is increasing, the discretionary expenditure on household goods and services is still too low compared to the upfront purchase price as well as the annual cost of ownership (See Table 2). In addition, China has a diverse economic landscape with of residents living in rural areas [41]. Most rural residents have fewer financial resources than urban residents. Both the initial purchase price and the cost of ownership can be more challenging for rural residents than for urban residents. For instance, the median price to disposable income ratio accounts for for rural residents, compared to for urban residents in 2020. The median price to discretionary expenditure ratio for rural residents almost reaches , which is far from affordable.
Table 2.
Annual cost of ownership compared with disposable income and expenditure in 2020.
On the one hand, the low affordability implies that rural residents are less likely to purchase and install POU water filtering systems than urban residents. On the other hand, rural areas are more likely to lack access to centralized water treatment infrastructure [48,49]. This conflict indicates that more affordable POU water filtering systems are in urgent need for providing safe drinking water to regions with insufficient water infrastructures and limited financial resources.
3.4. Correlation between Affordability and Adoption
As shown in Table 3, the adoption rate and price to disposable income ratio, price to total expenditure ratio, price to discretionary expenditure ratio are all strongly negatively correlated, respectively (). The adoption rate and the price are strongly positively correlated (). The price and units sold, units manufactured, and proportion of products sold are all strongly positively correlated (). The correlation analysis indicates that price alone does not negatively influence the adoption of POU water filtering systems in China. The ratios of price to disposable income, price to total expenditure, and price to discretionary expenditure negatively affect the adoption. That is, low price affordability compared to per capita income impedes the adoption of POU water filtering systems in China.
Table 3.
The adoption rate and price affordability correlation coefficient matrix.
As shown in Table 4, the annual total cost of ownership and the price are moderately positively correlated (, ); the annual total cost of ownership and the maintenance cost is strongly positively correlated (, ). The result shows that the initial purchase price contributes modestly to the annual total cost of ownership, while the filter replacement cost accounts for the majority of the total cost of ownership. This finding indicates that stakeholders should put more effort into reducing maintenance costs in order to increase the affordability of the total cost of ownership.
Table 4.
The annual cost correlation coefficient matrix.
4. Discussion
4.1. Main Barriers to Adoption
Our findings reveal that the ratio of the price to the disposable income, rather than the price alone, is strongly correlated with the adoption rate. This indicates that one of the main barriers that impedes the widespread adoption of POU water filtering systems is affordability. It includes high initial purchase cost and maintenance costs compared to residents’ disposable income and spending. Therefore, enhancing affordability through promoting low-cost POU systems is crucial for making them accessible to a broader segment of the population.
To further increase the adoption rate, stakeholders need to promote cost-efficient POU water filtering technologies and improve the distribution and maintenance network of POU systems. In doing so, stakeholders can make POU water filtering systems more affordable and accessible, ultimately contributing to a healthier and safer water environment for a broader segment of the population.
4.2. Potential Solutions
To address the affordability challenge associated with point-of-use (POU) drinking water treatment systems, collaborative efforts are required from the government, private sector, and the general public. The primary focus should be on facilitating the rapid development and low-cost production of POU water treatment systems, thereby making them more accessible to a broader range of consumers. This can be achieved through increased investment in research and development to create more cost-effective POU technologies, the establishment of efficient distribution and maintenance networks, and the implementation of comprehensive consumer awareness education programs. By working together and implementing these strategies, stakeholders can make POU drinking water treatment systems more affordable and accessible, particularly in regions facing economic constraints.
4.3. Limits of This Study
In this research, we are unable to consider several factors that may influence the adoption of POU drinking water filtering systems due to limited data availability. These factors include limited awareness about the benefits of POU water treatment, perceptions of water quality that do not align with actual water quality, limited product availability in certain regions or communities, concerns about product quality and reliability, and user habits and preferences regarding water consumption and filtration. Overcoming these barriers requires a multifaceted approach. It involves education, awareness campaigns, technological innovation, and collaboration between government agencies, manufacturers, and community stakeholders. Tailoring solutions to address specific regional or demographic challenges is crucial for successful adoption. Further research is needed to identify the most effective solutions for promoting the widespread adoption of POU systems.
Both personal incomes and the prices of POU filtering systems can be affected by inflation. In our study, we were unable to consider the inflation factor due to limited data availability. Further studies are needed to identify the effect of inflation on personal incomes and the prices and costs of POU filtering systems.
In our work, we have focused on residential point-of-use water filtering systems. This leaves out the adoption process of the POU water systems in the commercial and public sectors.
In our research, we have studied factors that influence the adoption of POU drinking water filtering systems from the national level. Because of China’s vast landscape and income inequality among different regions, the adoption processes and their contributing factors can be different. It is important to understand how the geographical differences influence POU water filtering systems’ adoption in China. Unfortunately, we do not have access to regional or provincial data to investigate this important matter. Moreover, our correlation analysis is based on aggregated data at the national level. The correlation may be due to the confounding effect and may not hold for smaller scales such as regional or provincial areas. Further studies are required to identify specific factors that influence the adoption process of each area.
5. Conclusions
By facilitating the adoption of point-of-use water filtering systems, stakeholders can help residents access cleaner and safer drinking water at home, improving public health through reducing waterborne diseases and healthcare costs. This approach also benefits the environment since it reduces the energy and resources used in traditional water treatment and distribution. In addition, filter replacement also encourages responsible water use, promotes water conservation, and raises awareness of water quality. Overall, understanding the key factors influencing the adoption of point-of-use drinking water filtering systems supports a healthier, more sustainable, and economically efficient development in emerging countries like China.
In this paper, we present a quantitative analysis of how price affordability influences the adoption of point-of-use (POU) water filtering systems in China. We utilize sales data and income data from 2007 to 2022 and conduct a correlation analysis to identify the role of affordability on POU adoption.
Our findings have two key implications: first, increased affordability has contributed to the rapid adoption of POU systems in China. Second, initial purchase prices and annual ownership costs remain high compared to per capita income and expenditure, particularly for rural residents. This indicates a need for promoting cost-effective POU technologies and improving distribution and maintenance networks to further increase adoption. Our research sheds light on this critical barrier and suggests potential pathways for facilitating POU adoption in emerging countries. Further research is needed to identify the most effective strategies for achieving this goal.
Funding
This research was funded in part by the Ministry of Education of China Humanities and Social Sciences Youth Fund Project under number 23YJC840020, and Hohai University Research Grant under number B230207069.
Institutional Review Board Statement
Not applicable.
Informed Consent Statement
Not applicable.
Data Availability Statement
All the data are included in the paper.
Conflicts of Interest
The authors declare no conflict of interest.
References
- Liu, J.; Yang, W. Water sustainability for China and beyond. Science 2012, 337, 649–650. [Google Scholar] [CrossRef] [PubMed]
- Wang, T.; Sun, D.; Zhang, Q.; Zhang, Z. China’s drinking water sanitation from 2007 to 2018: A systematic review. Sci. Total Environ. 2021, 757, 143923. [Google Scholar] [CrossRef]
- Wu, J. Challenges for safe and healthy drinking water in China. Curr. Environ. Health Rep. 2020, 7, 292–302. [Google Scholar] [CrossRef] [PubMed]
- Wen, X.; Chen, F.; Lin, Y.; Zhu, H.; Yuan, F.; Kuang, D.; Jia, Z.; Yuan, Z. Microbial indicators and their use for monitoring drinking water quality—A review. Sustainability 2020, 12, 2249. [Google Scholar] [CrossRef]
- Rodríguez-Lado, L.; Sun, G.; Berg, M.; Zhang, Q.; Xue, H.; Zheng, Q.; Johnson, C.A. Groundwater arsenic contamination throughout China. Science 2013, 341, 866–868. [Google Scholar] [CrossRef] [PubMed]
- Liu, M.; Graham, N.; Wang, W.; Zhao, R.; Lu, Y.; Elimelech, M.; Yu, W. Spatial assessment of tap-water safety in China. Nat. Sustain. 2022, 5, 689–698. [Google Scholar] [CrossRef]
- Yang, G.; Fan, M.; Zhang, G. Emerging contaminants in surface waters in China—A short review. Environ. Res. Lett. 2014, 9, 074018. [Google Scholar] [CrossRef]
- Huang, Z.; Pan, Y.; Gong, H.; Yeh, P.J.F.; Li, X.; Zhou, D.; Zhao, W. Subregional-scale groundwater depletion detected by GRACE for both shallow and deep aquifers in North China Plain. Geophys. Res. Lett. 2015, 42, 1791–1799. [Google Scholar] [CrossRef]
- Huang, Z.; Yuan, X.; Sun, S.; Leng, G.; Tang, Q. Groundwater Depletion Rate Over China During 1965–2016: The Long-Term Trend and Inter-annual Variation. J. Geophys. Res. Atmos. 2023, 128, e2022JD038109. [Google Scholar] [CrossRef]
- Zhong, Y.; Zhong, M.; Feng, W.; Zhang, Z.; Shen, Y.; Wu, D. Groundwater depletion in the West Liaohe River Basin, China and its implications revealed by GRACE and in situ measurements. Remote Sens. 2018, 10, 493. [Google Scholar] [CrossRef]
- Yu, S.; Yu, G.; Liu, Y.; Li, G.; Feng, S.; Wu, S.; Wong, M.H. Urbanization impairs surface water quality: Eutrophication and metal stress in the Grand Canal of China. River Res. Appl. 2012, 28, 1135–1148. [Google Scholar] [CrossRef]
- Zhang, L.; Gao, S.; Wei, B.; Li, Y.; Li, H.; Wang, L.; Ye, B. Effects of urbanization on rural drinking water quality in Beijing, China. Sustainability 2017, 9, 461. [Google Scholar] [CrossRef]
- Wang, X.; Li, Z.; Li, M. Impacts of climate change on stream flow and water quality in a drinking water source area, Northern China. Environ. Earth Sci. 2018, 77, 1–14. [Google Scholar] [CrossRef]
- Ji, Y.; Wu, J.; Wang, Y.; Elumalai, V.; Subramani, T. Seasonal variation of drinking water quality and human health risk assessment in Hancheng City of Guanzhong Plain, China. Expo. Health 2020, 12, 469–485. [Google Scholar] [CrossRef]
- Chinese Academy of Science Sustainable Development Research Group. China Sustainable Development Strategy Report 2007 Water: Governance and Innovation; Science Press Social: Beijing, China, 2007. [Google Scholar]
- Teng, F.; Wang, Y.; Wang, M.; Wang, L. Monitoring and Analysis of Population Distribution in China from 2000 to 2020 Based on Remote Sensing Data. Remote Sens. 2022, 14, 6019. [Google Scholar] [CrossRef]
- Li, S.; Sicular, T. The distribution of household income in China: Inequality, poverty and policies. China Q. 2014, 217, 1–41. [Google Scholar] [CrossRef]
- Wang, C.; Wan, G.; Yang, D. Income inequality in the People’s Republic of China: Trends, determinants, and proposed remedies. In China’s Economy: A Collection of Surveys; John Wiley and Sons: Hoboken, NJ, USA, 2015; pp. 99–123. [Google Scholar]
- IPE. Expansion of Water Quality Monitoring and Information Disclosure—First Release of National Water Quality Map; Technical Report; The Institute of Public and Environmental Affairs (IPE): Beijing, China, 2019. [Google Scholar]
- Synder, J., Jr.; Mains, C.N.; Anderson, R.E.; Bissonnette, G.K. Effect of point-of-use, activated carbon filters on the bacteriological quality of rural groundwater supplies. Appl. Environ. Microbiol. 1995, 61, 4291–4295. [Google Scholar] [CrossRef] [PubMed]
- Alfredo, K.; Lin, J.; Islam, A.; Wang, Z.W. Impact of activated carbon block point-of-use filters on chloraminated water quality. AWWA Water Sci. 2020, 2, e1180. [Google Scholar] [CrossRef]
- Arnal, J.; Garcia-Fayos, B.; Verdu, G.; Lora, J. Ultrafiltration as an alternative membrane technology to obtain safe drinking water from surface water: 10 years of experience on the scope of the AQUAPOT project. Desalination 2009, 248, 34–41. [Google Scholar] [CrossRef]
- Li, X.; Jiang, L.; Li, H. Application of ultrafiltration technology in water treatment. IOP Conf. Ser. Earth Environ. Sci. 2018, 186, 012009. [Google Scholar] [CrossRef]
- Malaeb, L.; Ayoub, G.M. Reverse osmosis technology for water treatment: State of the art review. Desalination 2011, 267, 1–8. [Google Scholar] [CrossRef]
- Eisenberg, T.N.; Middlebrooks, E.J. Reverse Osmosis Treatment of Drinking Water; Elsevier: Amsterdam, The Netherlands, 2013. [Google Scholar]
- Brownell, S.A.; Chakrabarti, A.R.; Kaser, F.M.; Connelly, L.G.; Peletz, R.L.; Reygadas, F.; Lang, M.J.; Kammen, D.M.; Nelson, K.L. Assessment of a low-cost, point-of-use, ultraviolet water disinfection technology. J. Water Health 2008, 6, 53–65. [Google Scholar] [CrossRef] [PubMed]
- Chatterley, C.; Linden, K. Demonstration and evaluation of germicidal UV-LEDs for point-of-use water disinfection. J. Water Health 2010, 8, 479–486. [Google Scholar] [CrossRef]
- Lui, G.Y.; Roser, D.; Corkish, R.; Ashbolt, N.J.; Stuetz, R. Point-of-use water disinfection using ultraviolet and visible light-emitting diodes. Sci. Total Environ. 2016, 553, 626–635. [Google Scholar] [CrossRef] [PubMed]
- Oyanedel-Craver, V.A.; Smith, J.A. Sustainable colloidal-silver-impregnated ceramic filter for point-of-use water treatment. Environ. Sci. Technol. 2008, 42, 927–933. [Google Scholar] [CrossRef]
- Farrow, C.; McBean, E.; Huang, G.; Yang, A.; Wu, Y.; Liu, Z.; Dai, Z.; Fu, H.; Cawte, T.; Li, Y. Ceramic water filters: A point-of-use water treatment technology to remove bacteria from drinking water in Longhai City, Fujian Province. J. Environ. Inform. 2018, 32, 63–68. [Google Scholar] [CrossRef]
- Abbaszadegan, M.; Hasan, M.N.; Gerba, C.P.; Roessler, P.F.; Wilson, B.R.; Kuennen, R.; Van Dellen, E. The disinfection efficacy of a point-of-use water treatment system against bacterial, viral and protozoan waterborne pathogens. Water Res. 1997, 31, 574–582. [Google Scholar] [CrossRef]
- Anumol, T.; Clarke, B.O.; Merel, S.; Snyder, S.A. Point-of-use devices for attenuation of trace organic compounds in water. J.-Am. Water Work. Assoc. 2015, 107, E474–E485. [Google Scholar] [CrossRef]
- Bortone, G. Sediment treatment—A general introduction. In Sustainable Management of Sediment Resources; Elsevier: Amsterdam, The Netherlands, 2007; Volume 2, pp. 1–10. [Google Scholar]
- Smith, E.M.; Plewa, M.J.; Lindell, C.L.; Richardson, S.D.; Mitch, W.A. Comparison of byproduct formation in waters treated with chlorine and iodine: Relevance to point-of-use treatment. Environ. Sci. Technol. 2010, 44, 8446–8452. [Google Scholar] [CrossRef]
- Sublet, R.; Simonnot, M.O.; Boireau, A.; Sardin, M. Selection of an adsorbent for lead removal from drinking water by a point-of-use treatment device. Water Res. 2003, 37, 4904–4912. [Google Scholar] [CrossRef]
- Sobsey, M.D.; Stauber, C.E.; Casanova, L.M.; Brown, J.M.; Elliott, M.A. Point of use household drinking water filtration: A practical, effective solution for providing sustained access to safe drinking water in the developing world. Environ. Sci. Technol. 2008, 42, 4261–4267. [Google Scholar] [CrossRef] [PubMed]
- Abebe, L.S.; Su, Y.H.; Guerrant, R.L.; Swami, N.S.; Smith, J.A. Point-of-use removal of cryptosporidium parvum from water: Independent effects of disinfection by silver nanoparticles and silver ions and by physical filtration in ceramic porous media. Environ. Sci. Technol. 2015, 49, 12958–12967. [Google Scholar] [CrossRef] [PubMed]
- Wu, J.; Cao, M.; Tong, D.; Finkelstein, Z.; Hoek, E.M. A critical review of point-of-use drinking water treatment in the United States. NPJ Clean Water 2021, 4, 40. [Google Scholar] [CrossRef]
- Labhasetwar, P.K.; Yadav, A. Membrane Based Point-of-Use Drinking Water Treatment Systems; IWA Publishing: London, UK, 2023. [Google Scholar]
- Go, C.B. 2022 China Residential Water Treatment Systems Market Report; Insights and Info: Beijing, China, 2022. [Google Scholar]
- National Bureau of Statistics. Available online: https://www.stats.gov.cn/ (accessed on 2 October 2023).
- JD Mall. Available online: https://www.jd.com/ (accessed on 20 April 2020).
- Seaberg, J.; Weckler, P.; Ringer, J.; Wilber, G. Construction and testing of a point-of-use drinking water disinfection and filtration system for developing nations. Int. J. Serv. Learn. Eng. 2020, 15, 33–53. [Google Scholar]
- Kowalski, C.J. On the effects of non-normality on the distribution of the sample product-moment correlation coefficient. J. R. Stat. Soc. Ser. Appl. Stat. 1972, 21, 1–12. [Google Scholar] [CrossRef]
- Cohen, I.; Huang, Y.; Chen, J.; Benesty, J.; Benesty, J.; Chen, J.; Huang, Y.; Cohen, I. Pearson correlation coefficient. In Noise Reduction in Speech Processing; Springer: Berlin/Heidelberg, Germany, 2009; pp. 1–4. [Google Scholar]
- McKinney, W. Pandas: A foundational Python library for data analysis and statistics. Python High Perform. Sci. Comput. 2011, 14, 1–9. [Google Scholar]
- Lee, B.S.; Peng, J.; Li, G.; He, J. Regional economic disparity, financial disparity, and national economic growth: Evidence from China. Rev. Dev. Econ. 2012, 16, 342–358. [Google Scholar] [CrossRef]
- Pooi, C.K.; Ng, H.Y. Review of low-cost point-of-use water treatment systems for developing communities. NPJ Clean Water 2018, 1, 11. [Google Scholar] [CrossRef]
- Duan, Y.; Wu, R.; Ji, H.; Chen, X.; Xu, J.; Chen, Y.; Sun, M.; Pan, Y.; Zhou, L. Drinking water behavior and willingness to use filters by middle-aged and elderly residents in rural areas: A cross-sectional study in Tengchong, China. Front. Public Health 2022, 10, 961870. [Google Scholar] [CrossRef]
Disclaimer/Publisher’s Note: The statements, opinions and data contained in all publications are solely those of the individual author(s) and contributor(s) and not of MDPI and/or the editor(s). MDPI and/or the editor(s) disclaim responsibility for any injury to people or property resulting from any ideas, methods, instructions or products referred to in the content. |
© 2024 by the author. Licensee MDPI, Basel, Switzerland. This article is an open access article distributed under the terms and conditions of the Creative Commons Attribution (CC BY) license (https://creativecommons.org/licenses/by/4.0/).