Article

Tannin Industry Waste-Derived Porous Carbon: An Effective Adsorbent from Black Wattle Bark for Organic Pollutant Removal

by
Juliana Schultz
1,2,
Tarcisio Wolff Leal
2,*,
Gláucia Pantano
1,
Estela M. C. C. Batista
1,
Tassya T. S. Matos
1,
Laiéli S. Munaretto
1,
Jailson B. de Andrade
3 and
Antonio S. Mangrich
1,3
1
Department of Chemistry, Federal University of Paraná, P.O. Box 19032, Curitiba 81531-980, PR, Brazil
2
Department of Environmental Engineering, Federal University of Paraná, P.O. Box 19011, Curitiba 81531-980, PR, Brazil
3
National Institute of Science and Technology—Energy and Environment (INCT E&A), Salvador 40170-155, BA, Brazil
*
Author to whom correspondence should be addressed.
Sustainability 2024, 16(2), 601; https://doi.org/10.3390/su16020601
Submission received: 4 December 2023 / Revised: 3 January 2024 / Accepted: 4 January 2024 / Published: 10 January 2024

Abstract

:
In Brazil, a significant part of the biomass is unused, contributing to environmental pollution. The tannin industry commonly extracts tannins from the bark of Acacia mearnsii or black wattle, leaving a significant residue of 70% (w w−1). This study investigates the conversion of black wattle bark into a porous carbonaceous material to efficiently remove organic pollutants. Using ZnCl2 as a chemical activation reagent, the experiments varied the impregnation time, carbonization rates, and temperatures. Additional experiments aimed to increase the specific surface area (SSA). X-ray diffraction (XRD) analysis showed the formation and removal of ZnO, which increased porosity. Scanning electron microscopy (SEM) showed an irregular morphology with pores. Fourier-transform infrared (FTIR) spectroscopy indicated characteristic bands, and electron paramagnetic resonance (EPR) detected organic free radicals. The SSAs exceeded 1000 m2 g−1, averaging 1360 m2 g−1, with a maximum of 1525 m2 g−1. Micropores (1.4 nm) were consistent. The structure of the material and the high SSA suggest a potential for efficient removal of aromatic impurities by π–π interactions. This approach addresses the issue of biomass waste, provides a solution for environmental remediation, and represents a transformative strategy for biomass utilization.

1. Introduction

Brazil is one of the world’s largest producers of biomass waste, notably from the food industry, including materials such as sugarcane bagasse, rice husks, orange peel, and coconut husks, among others. One residue that deserves more attention is derived from Acacia mearnsii (De Wild), popularly known as black wattle, one of the raw materials used in the tannin extraction industry. This plant contains only 20–40% (w w−1) tannin, leaving about 70% (w w−1) residue after extraction. In 2021, black wattle production in Brazil was about 227,251 t [1], so considering that, all the black wattle produced was used for tannin extraction, leading to more than 150,000 t of residual biomass.
In most cases, this residue is not used for industrial purposes, as it is not suitable for use in nature, leading to environmental problems such as increasing landfill volumes and generating greenhouse gases due to improper treatment, as well as posing significant risks to human health [2,3,4].
One of the most important possible applications of this residual biomass is producing carbonaceous materials such as biochar and activated biochar (AB) due to its low cost, accessibility, and high carbon content [5,6,7]. AB is an activated carbon obtained exclusively from biomass raw material (fossil and synthetic sources are also used to produce activated carbon), with characteristics such as high surface area and porosity, chemical stability [8], and the potential to be functionalized to improve the adsorption capacity. Therefore, as an absorbent material, AB has a wide range of applications, including in air control and purification [9], wastewater treatment [10], solvent recovery [11], and semiconductors [12], among others.
The application of AB is determined by the specific properties of the material, which are related to the manufacturing process, considering aspects such as the preparation method, temperature, heating rate, residence time, type of activation, and biomass used [13,14].
The activated carbon (AC) production process typically employs two steps, where the first is carbonization and the second is activation, which may be physical or chemical. The carbonization step involves heat treatment of the raw material, which leads to a change in composition due to the pyrolysis process, increasing the carbon content of the organic substances (Figure 1).
Physical activation uses an oxidizing gas, such as water vapor, atmospheric air, carbon dioxide, or a mixture. A high temperature is required for this type of activation since a large amount of carbon mass is removed from the material’s interior. In chemical activation, it is necessary to impregnate the raw material with chemical reagents, such as NaOH, KOH, H3PO4, FeCl3, or ZnCl2, before carbonization [15,16]. These reagents are cheap and readily available. The impregnation step is crucial since the activating chemical used in it acts as a dehydrating agent that affects pyrolysis and promotes porous carbon production [17]. Chemical activation offers several advantages over physical activation, including a lower pyrolysis temperature and a shorter activation time. In addition, carbonization and activation take place simultaneously, resulting in activated carbon with a greater yield and a higher surface area [18].
The black wattle’s potential as an adsorbent for removing organic pollutants has not yet been sufficiently researched. Recent studies emphasize its effectiveness, especially as bark or sawdust. Moraes et al. [19] developed H3PO4-activated carbon xerogels from black wattle tannin/kraft lignin, showing a high adsorption capacity.
Azevedo et al. [20] focused on controlling water pollutants and developed magnetic biochar (MB) from black wattle sawdust, enabling efficient metoprolol adsorption and easy regeneration. Beckinghausen et al. [21] investigated NH4-N-loaded biochar for soil improvement and emphasized material-dependent treatment success. Lutke et al. [22] investigated black wattle bark waste. They produced an efficient activated carbon for the adsorption of phenol, demonstrating its potential for the treatment and reuse of industrial wastewater.
Given this background, the present study aimed to produce an AB with high surface area and porosity using the bark of Acacia mearnsii, an agro-industrial waste product, with elucidation of the effect of chemical activation by ZnCl2. The new material characterization was performed using scanning electron microscopy (SEM), Raman spectroscopy, Fourier-transform infrared (FTIR) spectroscopy, and electron paramagnetic resonance (EPR). Specific surface area and pore size/volume determinations used the Brunauer–Emmett–Teller (BET) and Barrett–Joyner–Halenda (BJH) methods, respectively.

2. Material and Methods

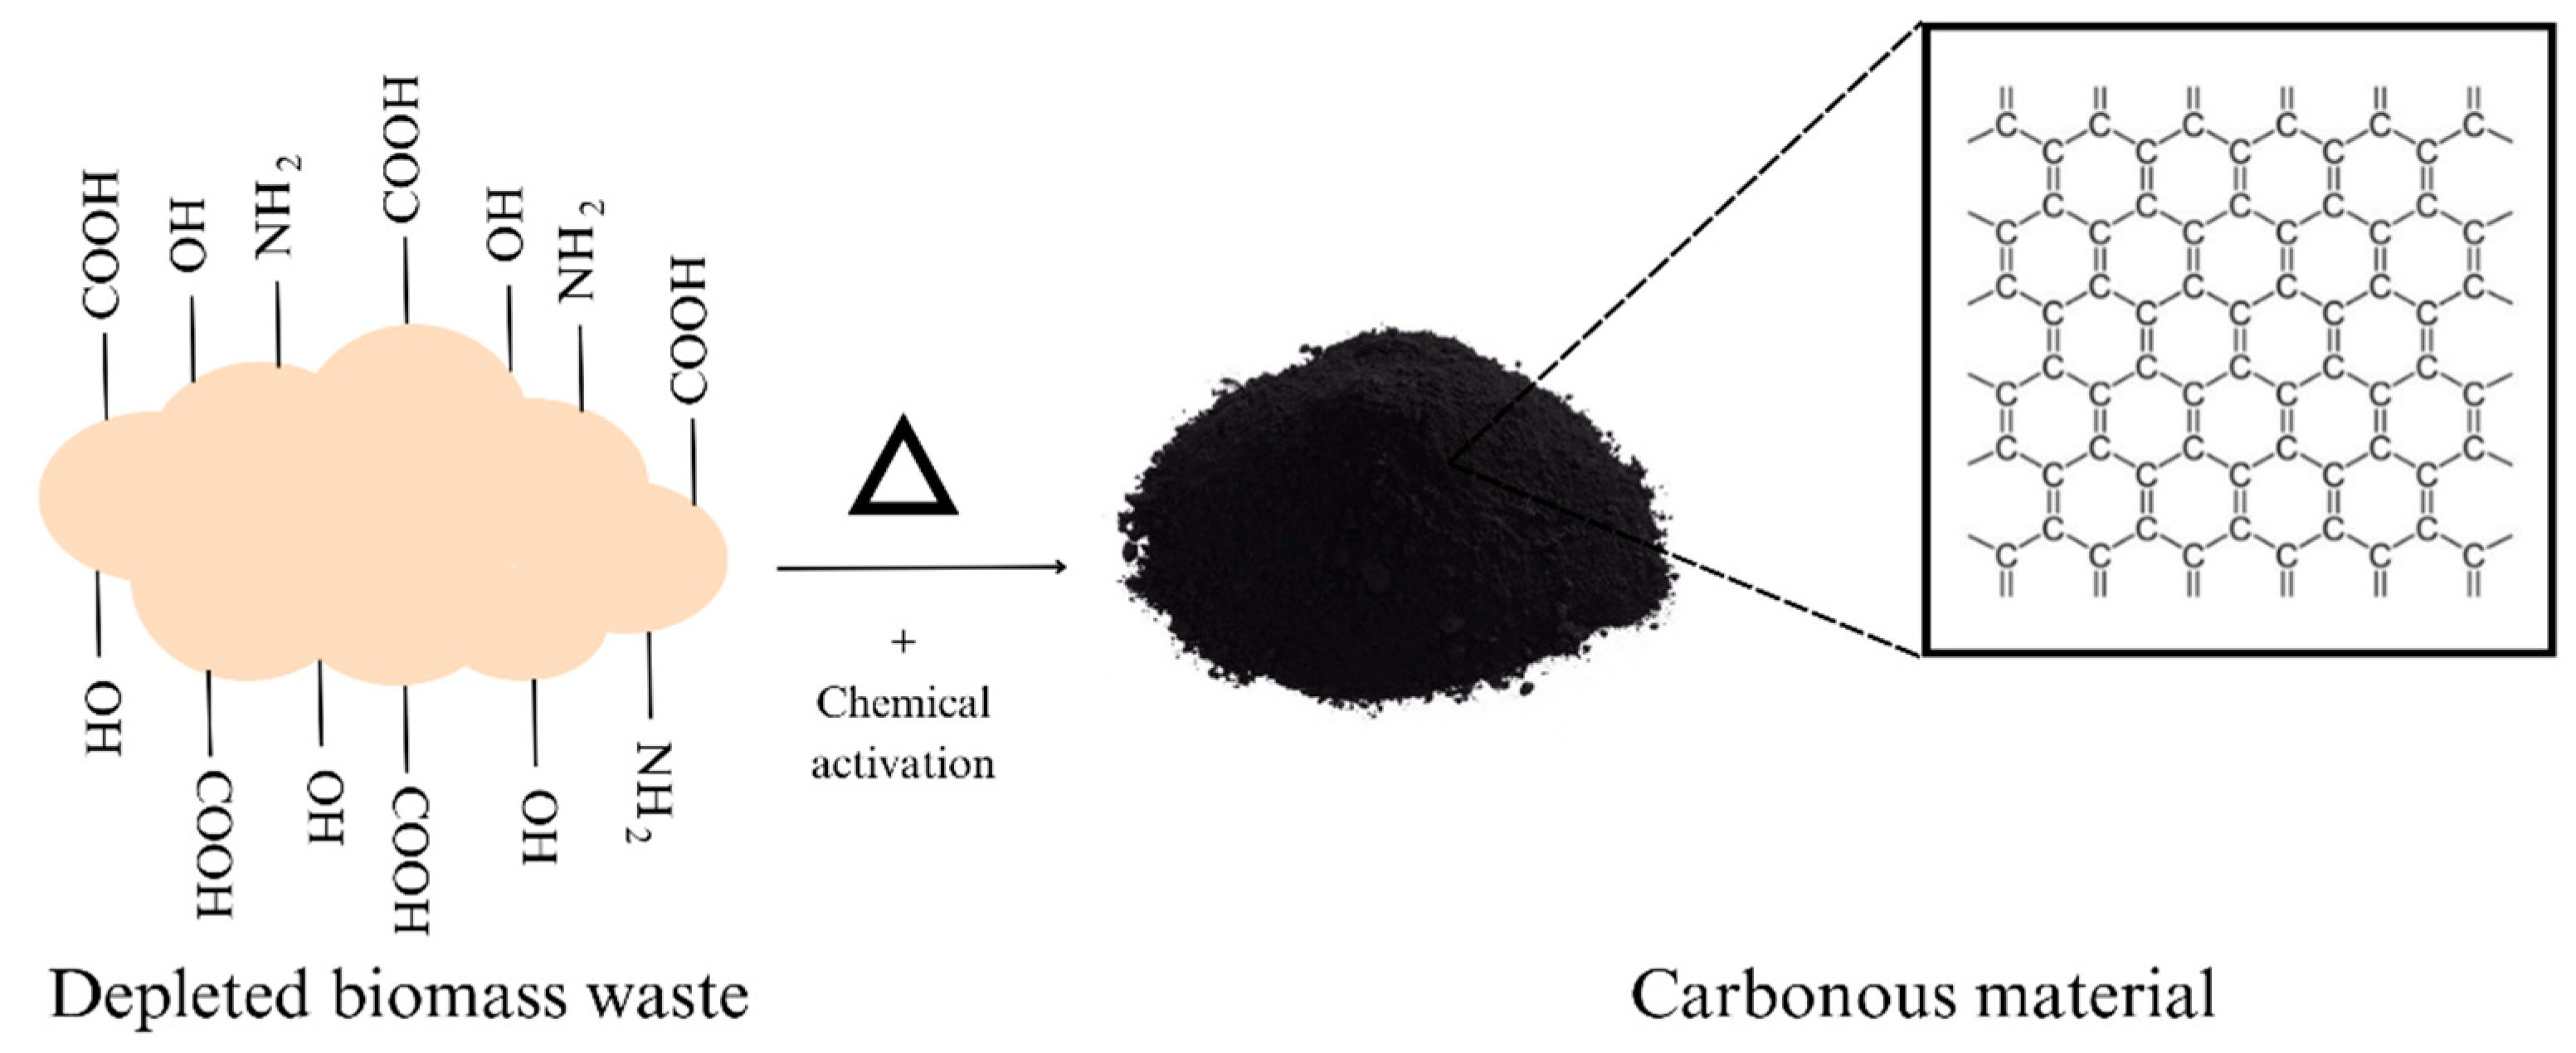
2.1. Experimental Design for the Synthesis of Carbonaceous Material

The exhausted black wattle bark used as a precursor for obtaining the activated biochar was provided by Tanac S.A. (Montenegro, Rio Grande do Sul state, Brazil). The bark was ground using a knife mill (FT 50 = Willye, Piracicaba, Brazil), sieved through screens (Bertel, Caieiras, Brazil) to give an average particle size of 40–80 mesh, and dried in an oven (Gehaka, São Paulo, Brazil) at 80–105 °C until constant weight. For the determination of the optimal conditions, a complete factorial design (23) was applied, considering the effects of impregnation time (A), final carbonization temperature (B), and heating rate (C). Duplicated samples were prepared for the factorial design experiments. Table 1 provides the levels of each factor. The experimental design matrix is presented in Supplementary Material S1.
Chemical activation was performed using a 1:2 (w w−1) biomass-to-chemical reagent ratio. The precursor was mixed with ZnCl2 (analytical grade, Vetec, Duque de Caxias, Brazil) in distilled water to improve the impregnation. Subsequently, the mixture was dried in an oven at 90–110 °C for either 6.5 or 13 h (according to the factorial design). Following impregnation, pyrolysis experiments were carried out using a tubular furnace (FT 40 HI, EDG, São Carlos, Brazil). The sample was heated at 3 °C min−1 until reaching 250 °C, held for 30 min, followed by increasing the temperature at either 5 or 10 °C min−1, according to the specified schedule, until reaching either 400 or 600 °C, maintaining the final temperature for 1 h. No inert atmosphere was used during sample preparation. Afterward, the material was cooled to room temperature at the standard cooling rate of the furnace. To dissolve and remove residual ash, the samples were washed with aqueous HCl (10% v v−1) and hot distilled water (70–90 °C), filtered, and dried at 110 °C for 12 h. The results obtained from this experimental design were treated using Statistica 10 software (StatSoft, Tulsa, OK, USA), which allowed analysis of the mass yield, as shown below. The characterization parameters were evaluated for comparison purposes only, following the experimental design.

2.2. Characterization Procedures

Before characterization, the samples were dried in an oven at 110 °C for 12 h and then cooled to room temperature in a glass desiccator filled with dried silica gel beads.

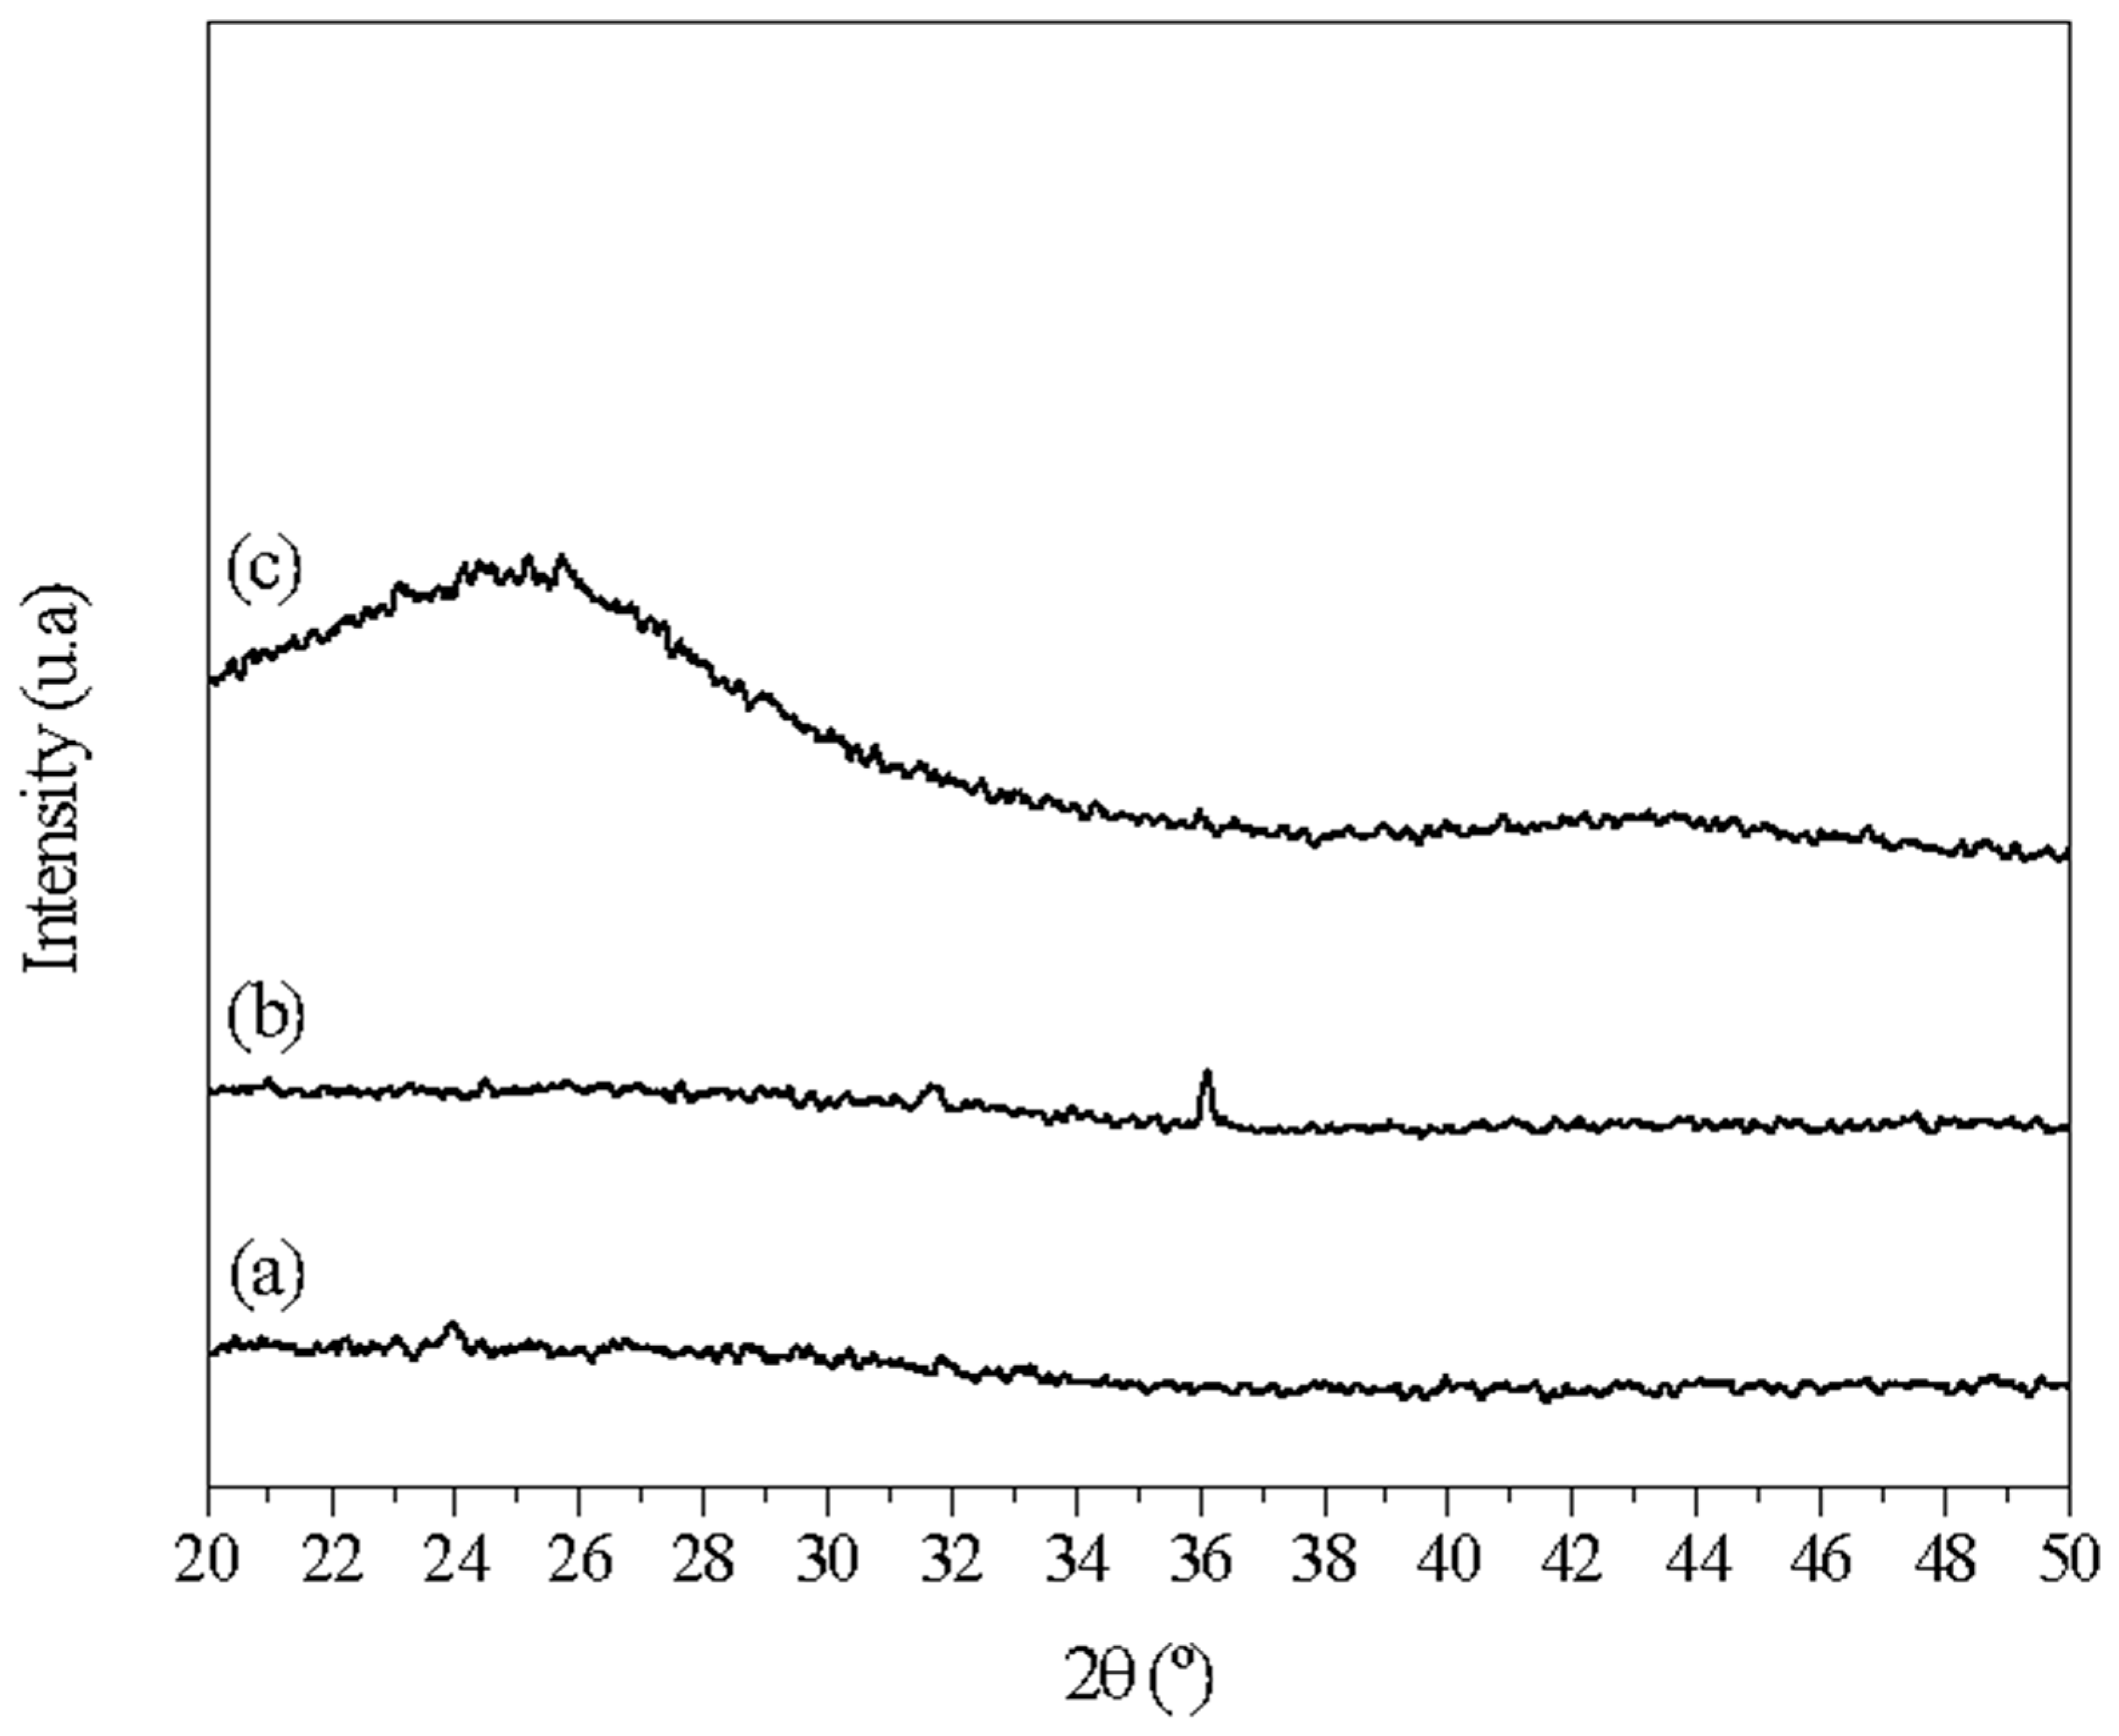
2.2.1. X-ray Diffraction (XRD)

XRD analysis was used to identify the crystalline phases of the different samples (carbonized at 250 °C, carbonized at 600 °C without washing, and the final selection after washing). A Rigaku DMAX100 diffractometer (Tokyo, Japan) was operated using Cu Kα radiation (λ = 1.5406 nm) and scanning in the 2θ range from 10 to 60°, in steps of 0.02° min−1. Phase identification was performed by comparing the diffractograms of the samples with standards provided by the JCPDS (Joint Committee on Powder Diffraction Standards). XRD analysis showed the absence of diffraction peaks and the presence of an amorphous halo, indicating that the presence of Zn contributes to increased porosity through the formation of ZnO.

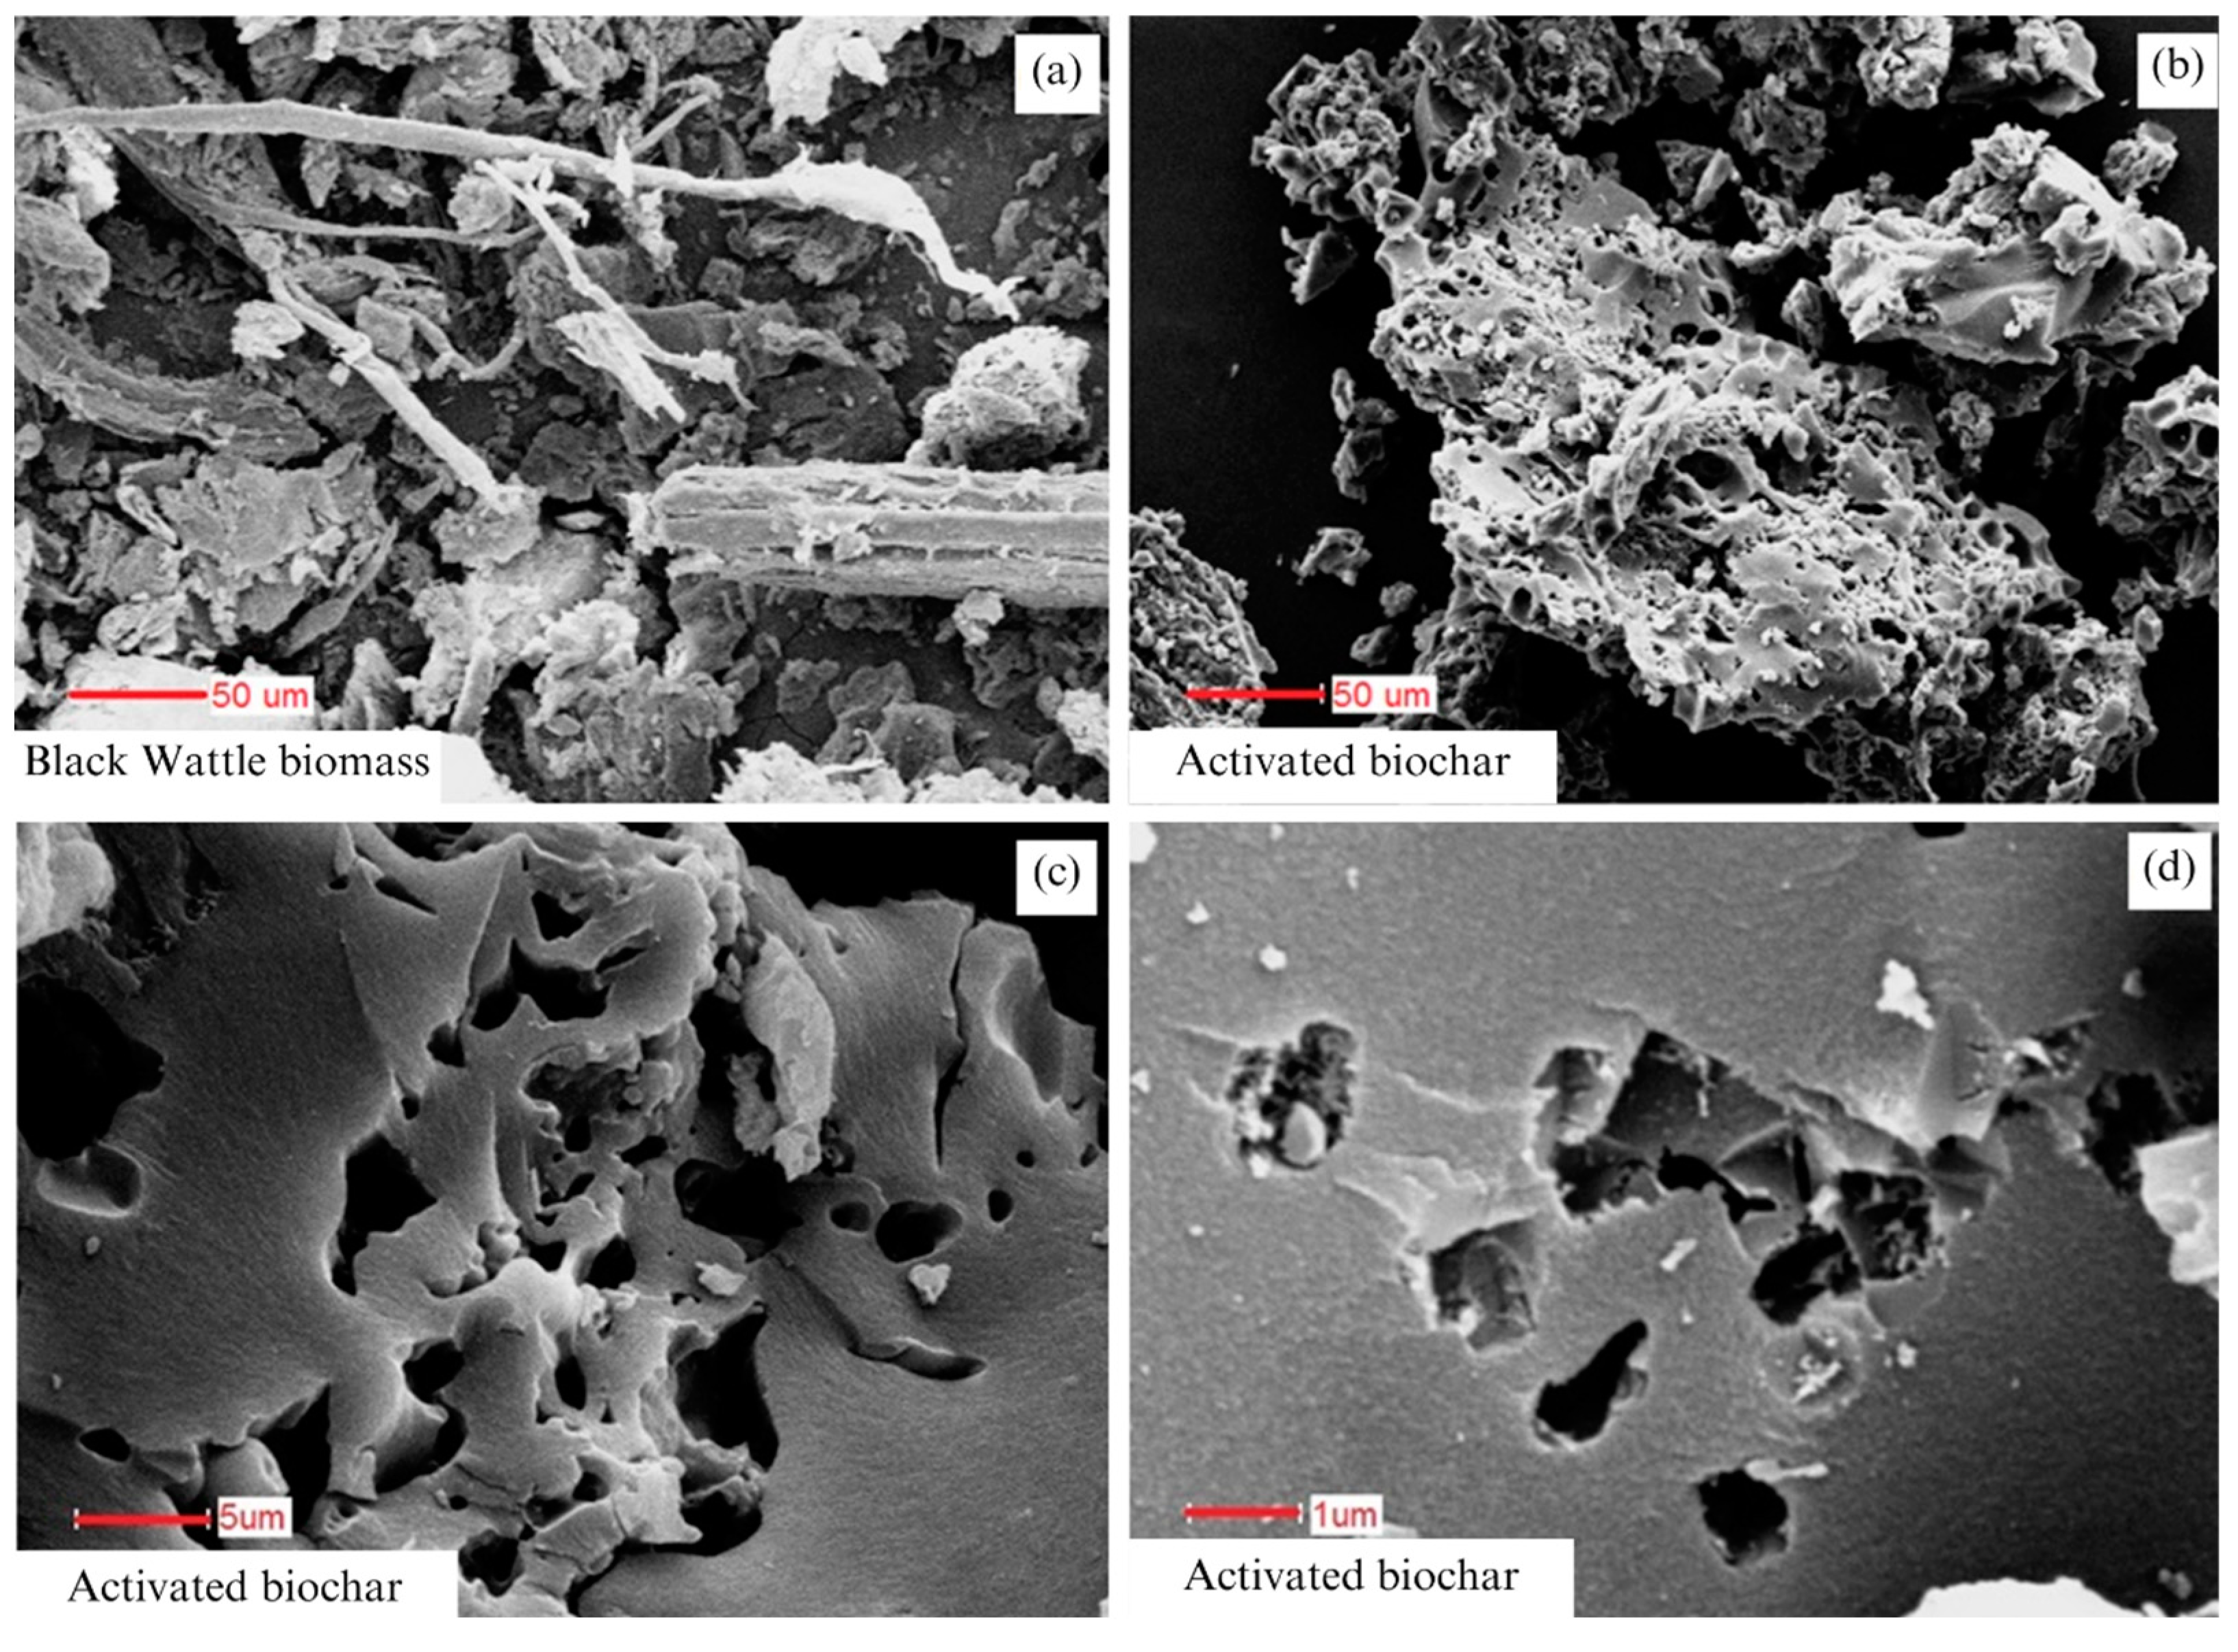
2.2.2. Scanning Electron Microscopy (SEM)

The carbonaceous materials’ surface morphology was studied by SEM using a Shimadzu SSX-550 instrument (Kyoto, Japan) operated under high vacuum at 15 kV, with emission and filament currents of 29,500 and 1850 nA, respectively. The samples were previously metalized using a Shimadzu IC-50 sputter coater (Kyoto, Japan). From the SEM analysis, it is possible to deduce the surface morphology from the presence of cracks, fissures, and pores. These are related to the production parameters of biochar.

2.2.3. Brunauer-Emmett-Teller (BET) and Barrett-Joyner-Halenda (BJH) Analyses

The specific surface areas of the carbonaceous materials were determined by nitrogen adsorption at 300 K using a Quantachrome NOVA 1200 analyzer (Boynton Beach, FL, USA) according to the BET method, involving measurement of the volume of adsorbed nitrogen gas by adsorption and desorption at different pressures. The material’s pore size distributions and total pore volumes were determined according to the BJH method. Before the analyses, the biochar was degassed for 2 h at 150 °C under a vacuum. The specific surface area depends on the pyrolysis temperature, the heating rate, the oven’s residence time, and the biochar’s modification. The specific surface area, pore volume, and pore size were determined using the BET method, and the volume of mesopores, mesopore surface area, and mesopore size were calculated using the BJH method.

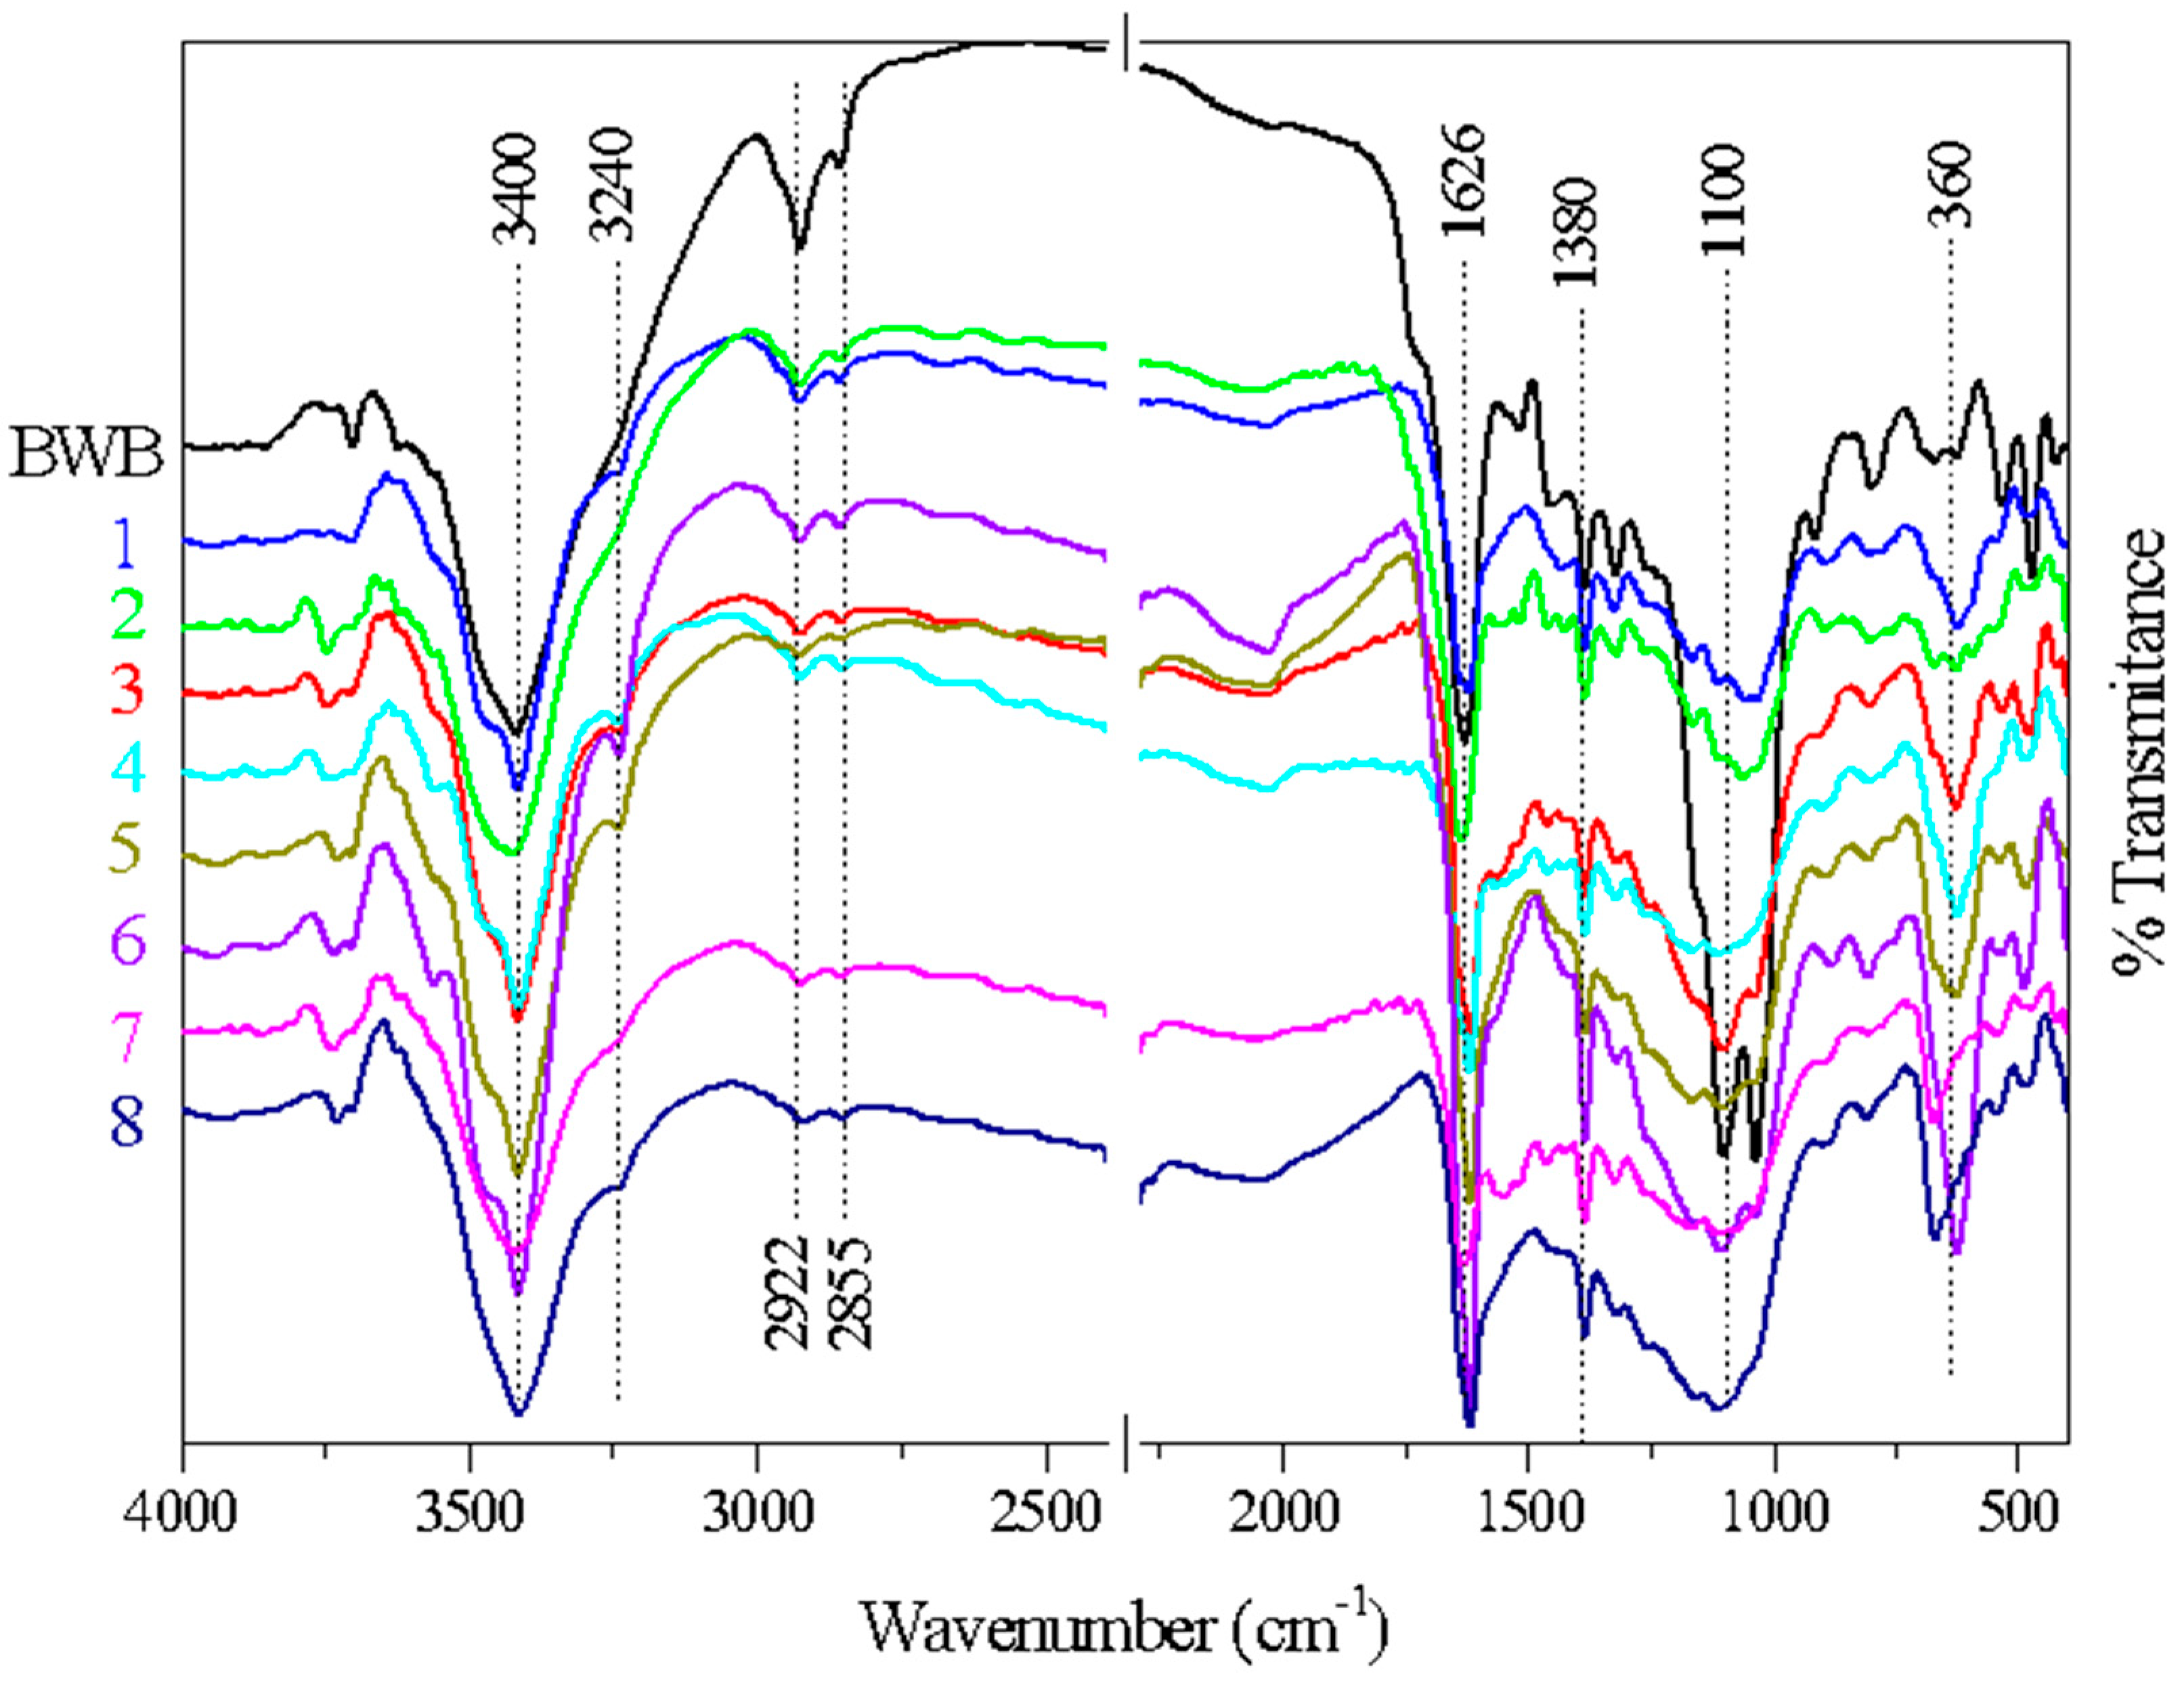
2.2.4. Fourier-Transform Infrared Spectroscopy (FTIR)

FTIR spectra of the activated biochar were obtained using a spectrophotometer (Excalibur Series FTS 3500 GX, Bio-Rad, Hercules, CA, USA) operated in transmission mode. The samples were prepared as pellets by pressing a mixture of approximately 99 mg of spectroscopic-grade KBr (Sigma-Aldrich, Saint Louis, MO, USA) and 1 mg of biochar. The spectra were acquired from 4000 to 400 cm−1, at a resolution of 4 cm−1, with an accumulation of 32 scans. The FTIR analysis revealed functional groups on the carbon surface that are crucial for sorption. In chemisorption, the functional groups realize the cation exchange capacity (CEC) of the biochar so that the exchange and sharing of electrons between the molecules of the adsorbate and the biochar takes place, resulting in a chemical reaction. The adsorbent and biochar interaction occurs through Van Der Waals forces in physisorption. This interaction is linked to the aromatic groups on the surface of the biochar, and no molecular change in the substances involved takes place.

2.2.5. Raman Spectroscopy

Raman scattering measurements were performed using a Witec Alpha 300R (Ulm, Germany) spectrophotometer at a wavelength of 540 nm with a resolution of 0.02 cm−1. The spectral bands were deconvoluted using the Lorentz fitting method from 854 to 1868 cm−1. Data analysis was performed using Origin 9.0 software. Raman spectroscopy was used to examine the extent of the samples’ graphitization, indicating their resemblance to the graphite structure.

2.2.6. Electron Paramagnetic Resonance (EPR)

EPR spectra were recorded at room temperature (~300 K) using a Bruker EMX spectrometer operating in the X-band (~9.5 GHz) with a modulation frequency of 100 kHz and a field sweep of 5000 G. The EPR data were processed using WinEPR software (Version V2.22 Rev.12). The EPR analysis provided information on the heating rate and carbonization temperature. It also revealed a single-line organic radical resonance (OFR).

2.3. Application of the Activated Biochar

Carbonaceous materials have been used as adsorbents to remove pollutants from contaminated water. Since the presence of natural hormones in aquatic ecosystems has gained recent attention, batch adsorption tests were performed with estrone in an aqueous solution using Erlenmeyer flasks containing 10 mL of 1.0 mg L−1 estrone solution and 4 mg of adsorbent. The flasks were shaken at 25 °C and 150 rpm in an orbital shaker for predetermined contact times, followed by filtration using glass fiber membrane filters (GF-3, 0.45 µm, Macharey Nagel, Düren, Germany). The estrone residual concentrations were determined using HPLC-DAD [23]. A commercial activated carbon (CAC) sample (analytical grade, Dinâmica, Indaiatuba, Brazil) was also used for comparison.
The removal percentage was calculated using Equation (1):
% R e m o v a l = C 0 C t C 0 100
where C 0 is the initial concentration (in mg L−1) of the estrone in contact with the sorbent and C t is the estrone concentration at instant t .

3. Results and Discussion

In this study, the exhausted bark of black wattle was thoroughly processed by grinding, sieving, and drying until a constant weight was obtained. A complete factorial experimental design (23) was then conducted to accurately determine the best conditions for chemical activation with a ZnCl2 solution. The impregnation time, final carbonization temperature, and heating rate were carefully controlled factors within this experimental design. The study aimed to evaluate the activated biochar samples’ mass yield and various characterization parameters.

3.1. Pyrolysis Process and Evaluation of ZnCl2 Doping by XRD

Applying a ZnCl2 solution followed by a prolonged doping process (13 h) is a highly advantageous approach. This method facilitates the swelling of the internal channels within the biomass, as suggested by Ahmadpour and Do [24], improving access of the ZnCl2 into the structure. As the temperature increases, most of the sample’s water content evaporates, allowing the incorporation of zinc ions into the precursor structure [25]. Adding ZnCl2 has a significant effect because it acts as a dehydrating agent during carbonization, promoting the removal of moisture, minimizing other volatile losses, reducing tar formation, and ultimately increasing the yield of fixed carbon (leading to a higher reaction yield) [25].
The purpose of the initial carbonization step at 250 °C was to induce slow degassing of the precursor, minimizing the premature opening of macro- and mesopores in the carbonaceous matrix. The subsequent step at 400 or 600 °C was performed to complete the carbonization process [26,27]. In all these processes, slow heating rates were used to ensure low-temperature gradients and promote better pore development and uniformity. The charring process involves several complex chemical reactions as well as heat and mass transfer phenomena. The pyrolysis process can be summarized by the following general equation [28]:
C a H b O c   b i o m a s s + h e a t l í q u i d C d H e O f + g a s C g H h O i + H 2 O + C   ( c a r b o n )
After the activation/carbonization process, the impregnated ZnCl2 and its reduction product, the residual zinc, were removed by washing with HCl and hot water. The HCl converted the metallic zinc to ZnCl2, with the salt then being removed by successive washes with hot water (at temperatures between 70 and 90 °C) until pH 7 was reached. Hot water was chosen for this purpose due to the greater solubility of the salt at higher temperatures.
During the carbonization/pyrolysis step, hydrolysis reactions co-occurred in the particles, with the ZnCl2 chemical reagent exerting a dehydration effect on the biomass composition (such as hemicellulose, cellulose, and lignin). This reagent can also inhibit tar formation and increase the yield of solid carbon compounds [29]. The results of XRD analyses suggested that the presence of zinc increased porosity by forming ZnO.
The diffractogram for sample 3 (Figure 2) showed an absence of diffraction peaks and the presence of an amorphous halo in the 2θ range from 20° to 30°. This indicated a lack of crystallinity in the material’s structure, ruling out the presence of zinc oxide or zinc chloride. However, a small diffraction peak can be seen in the green diffraction pattern (at 600 °C), corresponding precisely to the 1 0 1 diffraction of zinc oxide (36°). Remarkably, this peak disappeared after acid treatment.

3.2. Effects of Primary Factors and Second-Order Interactions on Mass Yield

A 23 complete factorial design was used to investigate the effects of process parameters on the mass yield of the ZnCl2-doped biomass (1:2 w w−1) after the pyrolysis process. The results of the experimental design assays are presented in Supplementary Material S1.
The mass yields obtained in the experiments were in the range of 40.6 to 48.5%, with the most favorable results achieved in experiments 5 (A: 6.5 h; B: 400 °C; C: 10 °C min−1) and 6 (A: 13 h; B: 400 °C; C: 10 °C min−1), where the obtained values were 48.5 and 48.2%, respectively.
Comparison with data from the literature showed that the yields were close to those reported in other studies using the same activating chemical reagent, albeit with different biomasses. For example, Onal et al. [30] obtained yields of 34 and 35% (at temperatures of 400 and 600 °C for 1 h), producing activated carbon using beet bagasse as a precursor. Ahmed and Theydan [31] obtained yields of about 45 and 35% (at temperatures of 400 and 600 °C for 1 h) using date seeds as feedstock. Similarly, Sayğili and Güzel [32] obtained yields of about 44% (at a temperature of 600 °C for 1 h) using residues from the industrial processing of grapes as feedstock. Dural et al. [33] obtained yields from 40 to 48% (at a temperature of 600 °C for 2 h) using Posidonia oceanica (seagrass) as feedstock.
The selected factors were analyzed at a 95% confidence level, considering both main effects and second-order interactions. The results of the analysis of variance (ANOVA) for mass yield can be found in Supplementary Material S2. The Pareto chart in Figure 3 visually represents the statistically significant effects on mass yield. Based on the ANOVA results and the Pareto chart, only the final carbonization temperature (B) and the second-order interaction between carbonization temperature and heating rate (B × C) had significant effects on mass yield (p-value < 0.05). Increasing the carbonization temperature resulted in a significant 5.10% decrease in yield. It is noteworthy that carbonization of the samples at 400 °C (experiments 1, 2, 5, and 6) resulted in higher yields compared to carbonization at 600 °C (experiments 3, 4, 7, and 8), highlighting the influence of carbonization temperature on the mass yield of activated carbon.

3.3. Characterization of the Samples

3.3.1. SEM

Figure 4 shows SEM images of the black wattle biomass and the samples produced in this study at different magnifications. The photos revealed a heterogeneous and irregular surface morphology with cracks, fissures, and pores. A notable feature was the appearance of pores after the carbonization/activation process, especially macropores, in the samples. However, the microporosity could not be directly identified since it was beyond the instrument’s detection limit. Nevertheless, the micropores were indirectly characterized using the BJH method, which is explained in detail in the following section.

3.3.2. BET and BJH Analyses

The results of the BET and BJH analyses of the biomass sample and the biochar doped with ZnCl2 (1:2 w w−1) after the pyrolysis and washing process, including the specific surface area ( A B E T ), total pore volume ( V p ), and average pore diameter ( D p ), can be found in Supplementary Material S3. Additionally, for comparison purposes, Supplementary Material S4 provides the results obtained for the analyses of commercial activated carbon (CAC) (obtained from Dinâmica) and biochar samples prepared with ZnCl2 at a 1:1 (w w−1) ratio.
Based on the results, the replicated samples of the 23 factorial design showed good similarity, except in the case of run 2, for which the A B E T values were significantly different (1301.4 and 765.4 m2 g−1). This inconsistency could be attributed to sample contamination. Samples 1, 2, 5, and 6 had the lowest A B E T values, so analogous samples were not produced using the activating chemical reagent at a 1:1 ratio. These samples were charred at the lowest temperature of 400 °C, indicating that this temperature was insufficient to achieve A B E T higher than 1000 m2 g−1, regardless of impregnation time and heating rate. This suggested that higher temperatures were more effective for achieving higher A B E T values [31,34].
The samples carbonized at 600 °C and with an impregnation time of 6.5 h (run 7: 1477.23 and 1537.99 m2 g−1 and run 3: 1524.84 and 1548.98 m2 g−1) exhibited the highest A B E T values. Alteration of the heating rate (from 5 to 10 °C min−1) had no significant effect. Comparing the results with data from the literature and considering that activated carbon usually has A B E T between 500 and 1500 m2 g−1 or higher [35,36], it could be concluded that the A B E T values obtained here were satisfactory. Furthermore, a comparison of these results with previous black wattle studies revealed that chemical activation with ZnCl2 resulted in significantly higher A B E T values than the reported ones (414.97 m2 g−1) [22].
The average pore sizes of the samples (Supplementary Material S3) showed a predominance of micropores, as defined by IUPAC, which considers micropores to be pores with diameters smaller than 2 nm [37].
The SSA values for the samples prepared using ratios of 1:2 and 1:1 showed that using a higher proportion of the chemical reagent resulted in higher A B E T (Supplementary Material S3 and S4). Similar observations were made by Moreno-Piraján and Giraldo (2010) [38], who found that A B E T increased with the increase in chemical reagent concentration. Furthermore, a higher V p was observed with the increase in the activating chemical reagent concentration, which was consistent with the results obtained here.

3.3.3. FTIR Analyses

FTIR is an essential technique for identifying characteristic functional groups on the surface of biochar. Figure 5 shows the FTIR spectra of the raw material and the biochar samples prepared using a 1:2 (w w−1) ratio of biomass to chemical reagent. The spectra for the replicates were averaged to obtain a representative range.
The results showed substantial similarity of the chemical functional groups in all the samples, suggesting that the carbonization process did not cause complete elimination of the functional groups present in the original raw material. A characteristic band at around 3400 cm−1 could be attributed to stretching vibrations of the O-H groups [30,39,40]. Compared to the biomass spectrum, the intensity of this band decreased after the charring process, in agreement with the results reported by Onal et al. [30], who studied the effect of varying the charring temperature (400 to 900 °C) employing the same chemical reagent (ZnCl2). A small band at 2922 cm−1 corresponded to C-H stretching of aliphatic groups [41,42], in agreement with a band at 1380 cm−1, assigned to angular deformation of aliphatic C-H [7,43].
The spectra for all the samples showed two prominent bands in the range of 1000–1260 cm−1, corresponding to C-O stretching vibrations of alcohols, phenols, ethers, or esters in cellulose, hemicellulose, and lignin [34,44,45]. A distinct band in the range of 1500–1600 cm−1 corresponded to C=C stretching vibrations of unsaturated aliphatic structures or aromatic rings [32,46]. The studies by Sayğılı and Güzel [32] and Geçgel et al. [46], using the same chemical reagent (ZnCl2) and a carbonization temperature of 600 °C, also found the presence of these functional groups (C-O and C=C). Similarly, Geçgel et al. [47,48] detected C-O and C=C vibrations when a carbonization temperature of 240 °C was used. Hence, as observed in this study, the bands associated with these functional groups are consistently present, regardless of the carbonization temperature.

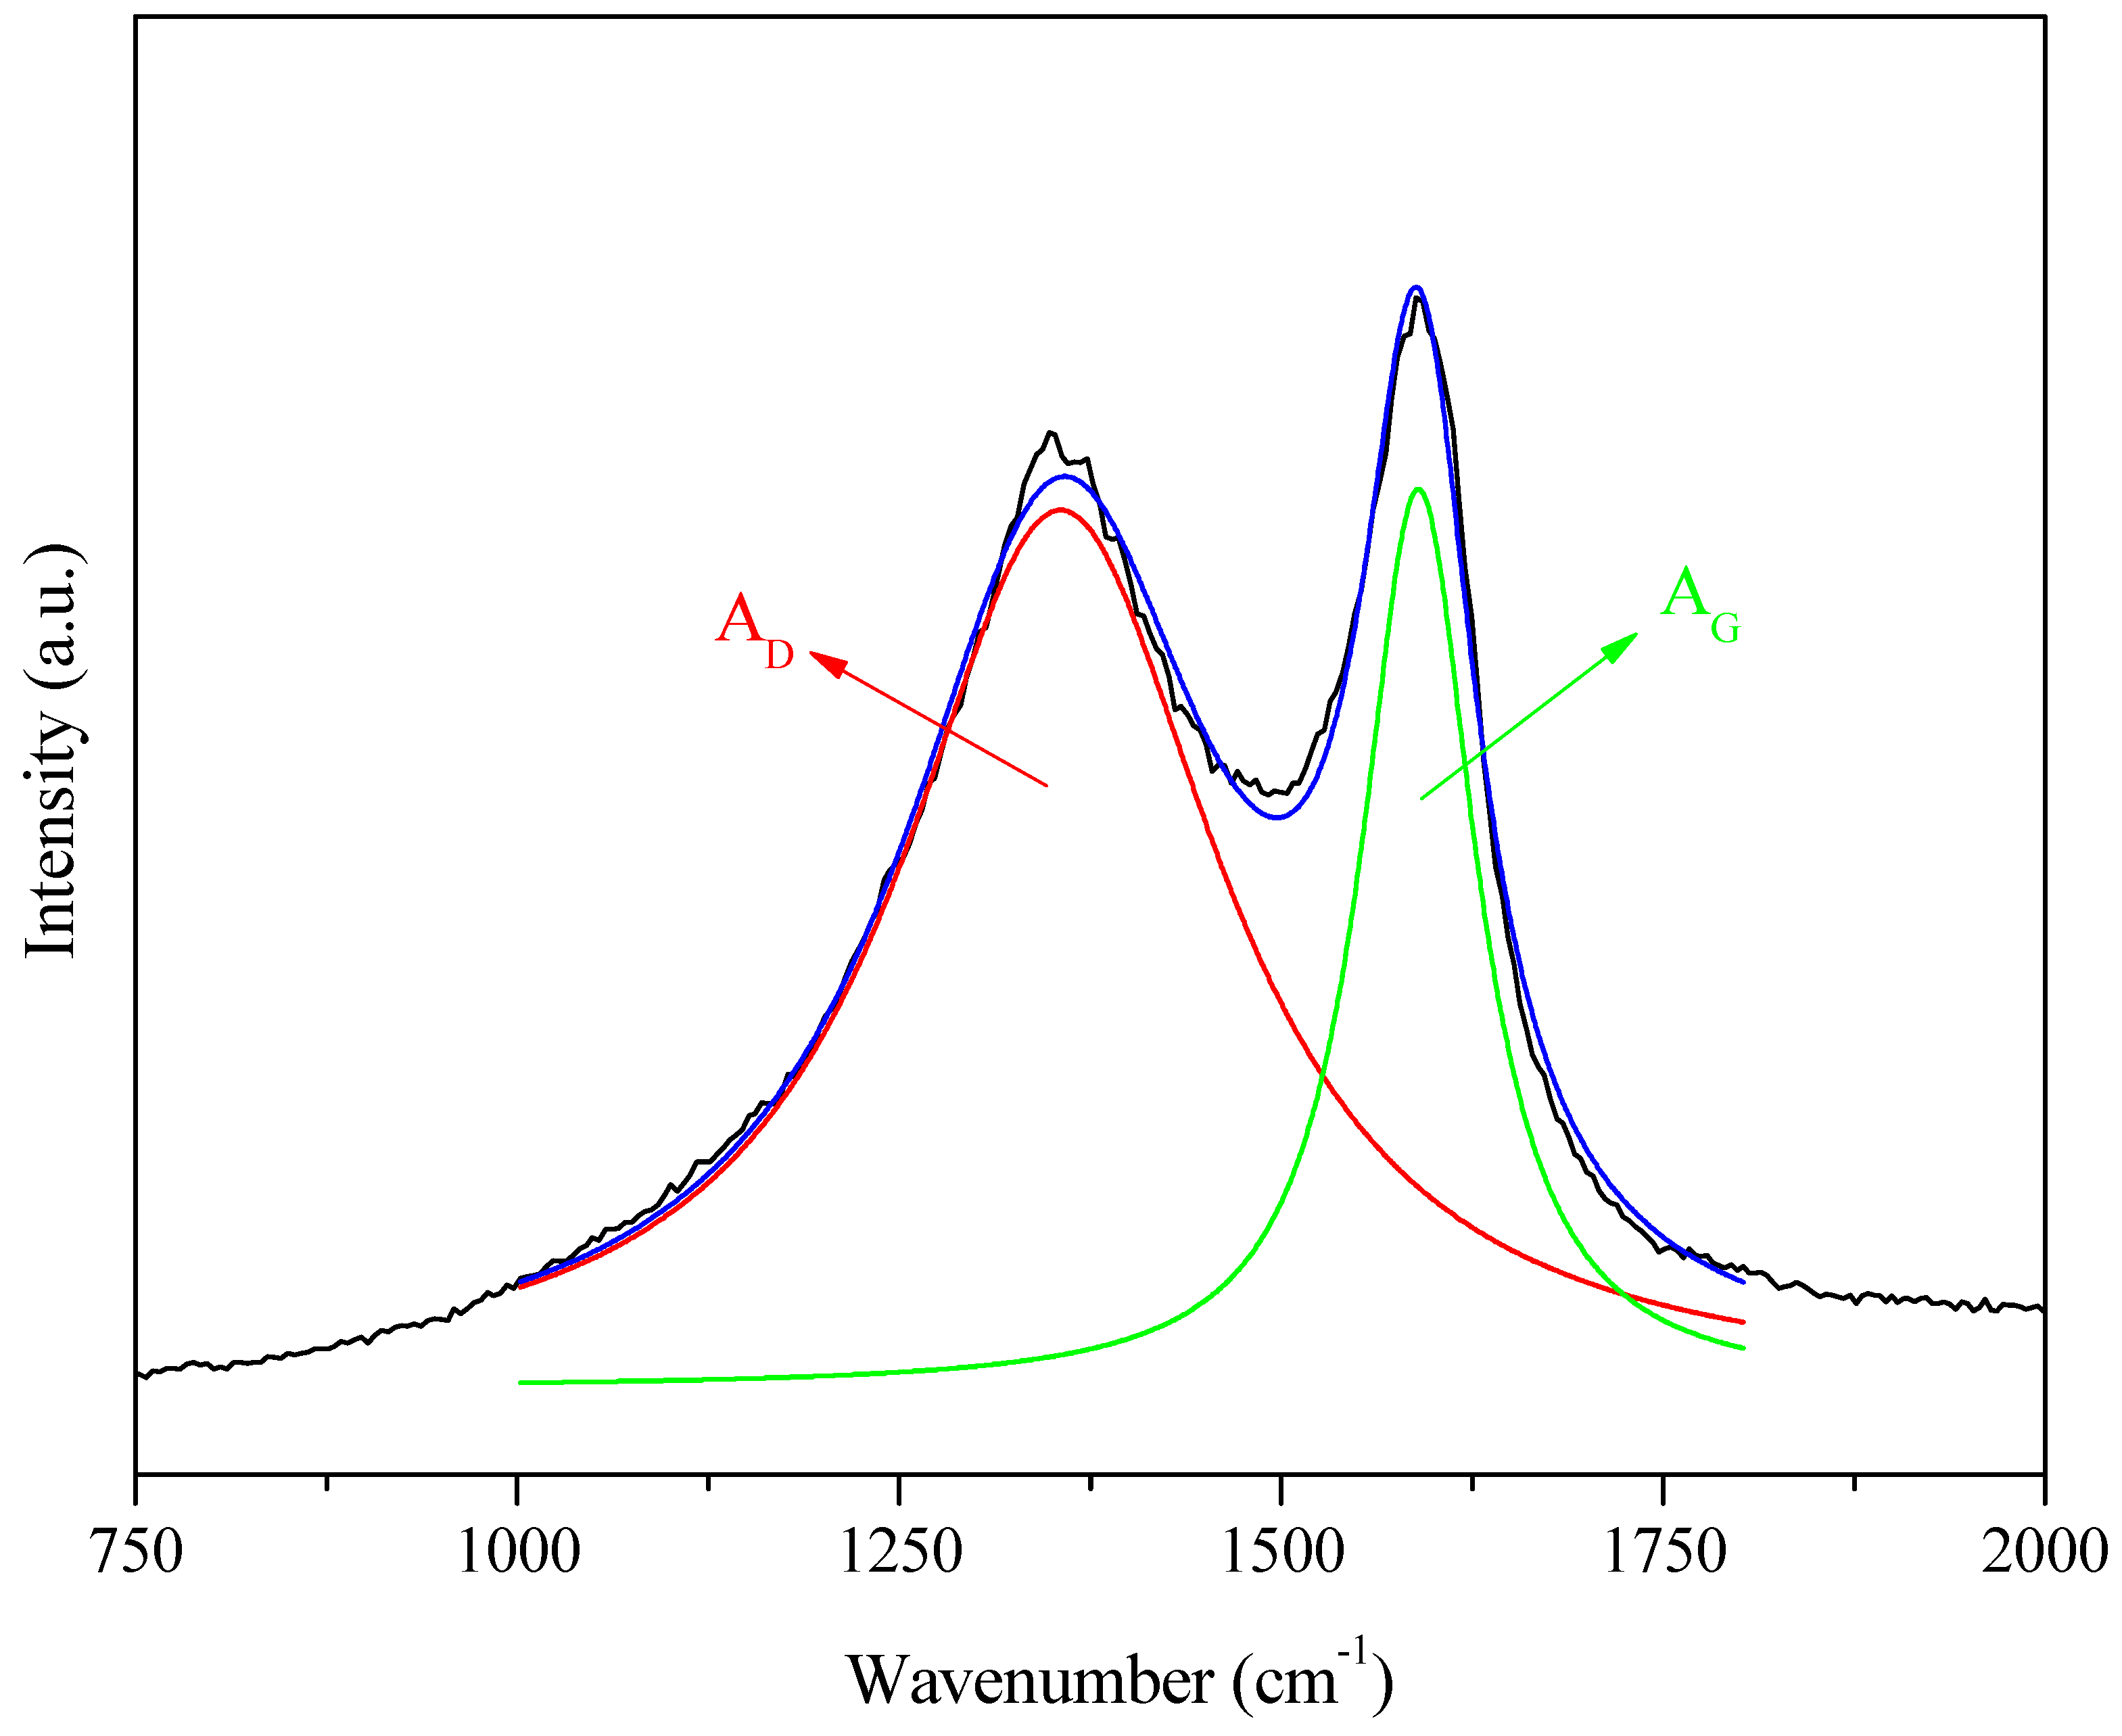
3.3.4. Raman Spectroscopy Analyses

Raman spectroscopy was used to investigate the degree of graphitization of the samples (in other words, their similarity to the graphite structure). Two samples carbonized at the lowest temperature (runs 5 and 6) and two samples carbonized at the highest temperature (runs 3 and 7) were selected. The results are shown in Figure 6 and Figure 7 and Table 2.
All the carbonaceous materials showed two distinct bands in the 800–2000 cm−1 range, one at 1360 cm−1, the so-called D band, commonly referred to as the defect or disorder band in the sp2 structure of graphene, and another at 1580 cm−1, called the G band, also known as the graphene band. In addition, a third band was evident at 2650 cm−1, referred to as the 2D band, which is typical of the structural transformation from amorphous to graphitic carbon [49].
Therefore, the ratio between the areas under the D and G bands ( I D / I G ) could be used to evaluate the extent of structural defects present in the samples, where a lower I D / I G ratio indicates fewer defects in the structure, suggesting more significant similarity to the graphene structure and an increase in the sp2 carbon domain [49]. The intensity of the peaks decreased from sample 6 (charred at 400 °C) to sample 3 (charred at 600 °C), which could be explained by the loss of aliphatic and oxygen-containing functional groups in sample 3, with the growth of aromatic ring systems. Therefore, increasing the carbonization temperature enhanced the aromaticity, which could increase light absorption and decrease the Raman scattering intensity [50].
Lorentzian deconvolution of the bands (Figure 7) enabled estimation of the I D / I G parameter and the total width at half height for the D band ( W D ) and the G band ( W G ). The results (Table 2) showed a difference between the I D / I G ratios for samples 3 and 7, with values of 2.7 and 3.2, respectively. The only difference in the preparation of these samples was the heating rate, with the first sample heated at 5 °C min−1 and the second at 10 °C min−1. This demonstrated that a lower heating rate for the same carbonization temperature led to fewer defects in the carbon structure [51]. For samples 5 and 6, which differed only in the chemical reagent impregnation time (13 and 6.5 h, respectively), the difference in the I D / I G ratio, for the same carbonization temperature and heating rate, was about 0.1. The D band appeared less intense for all the samples than the G band. However, the total width at half height ( W D ) was significantly larger, indicating a considerable presence of amorphous carbon in the samples [51].

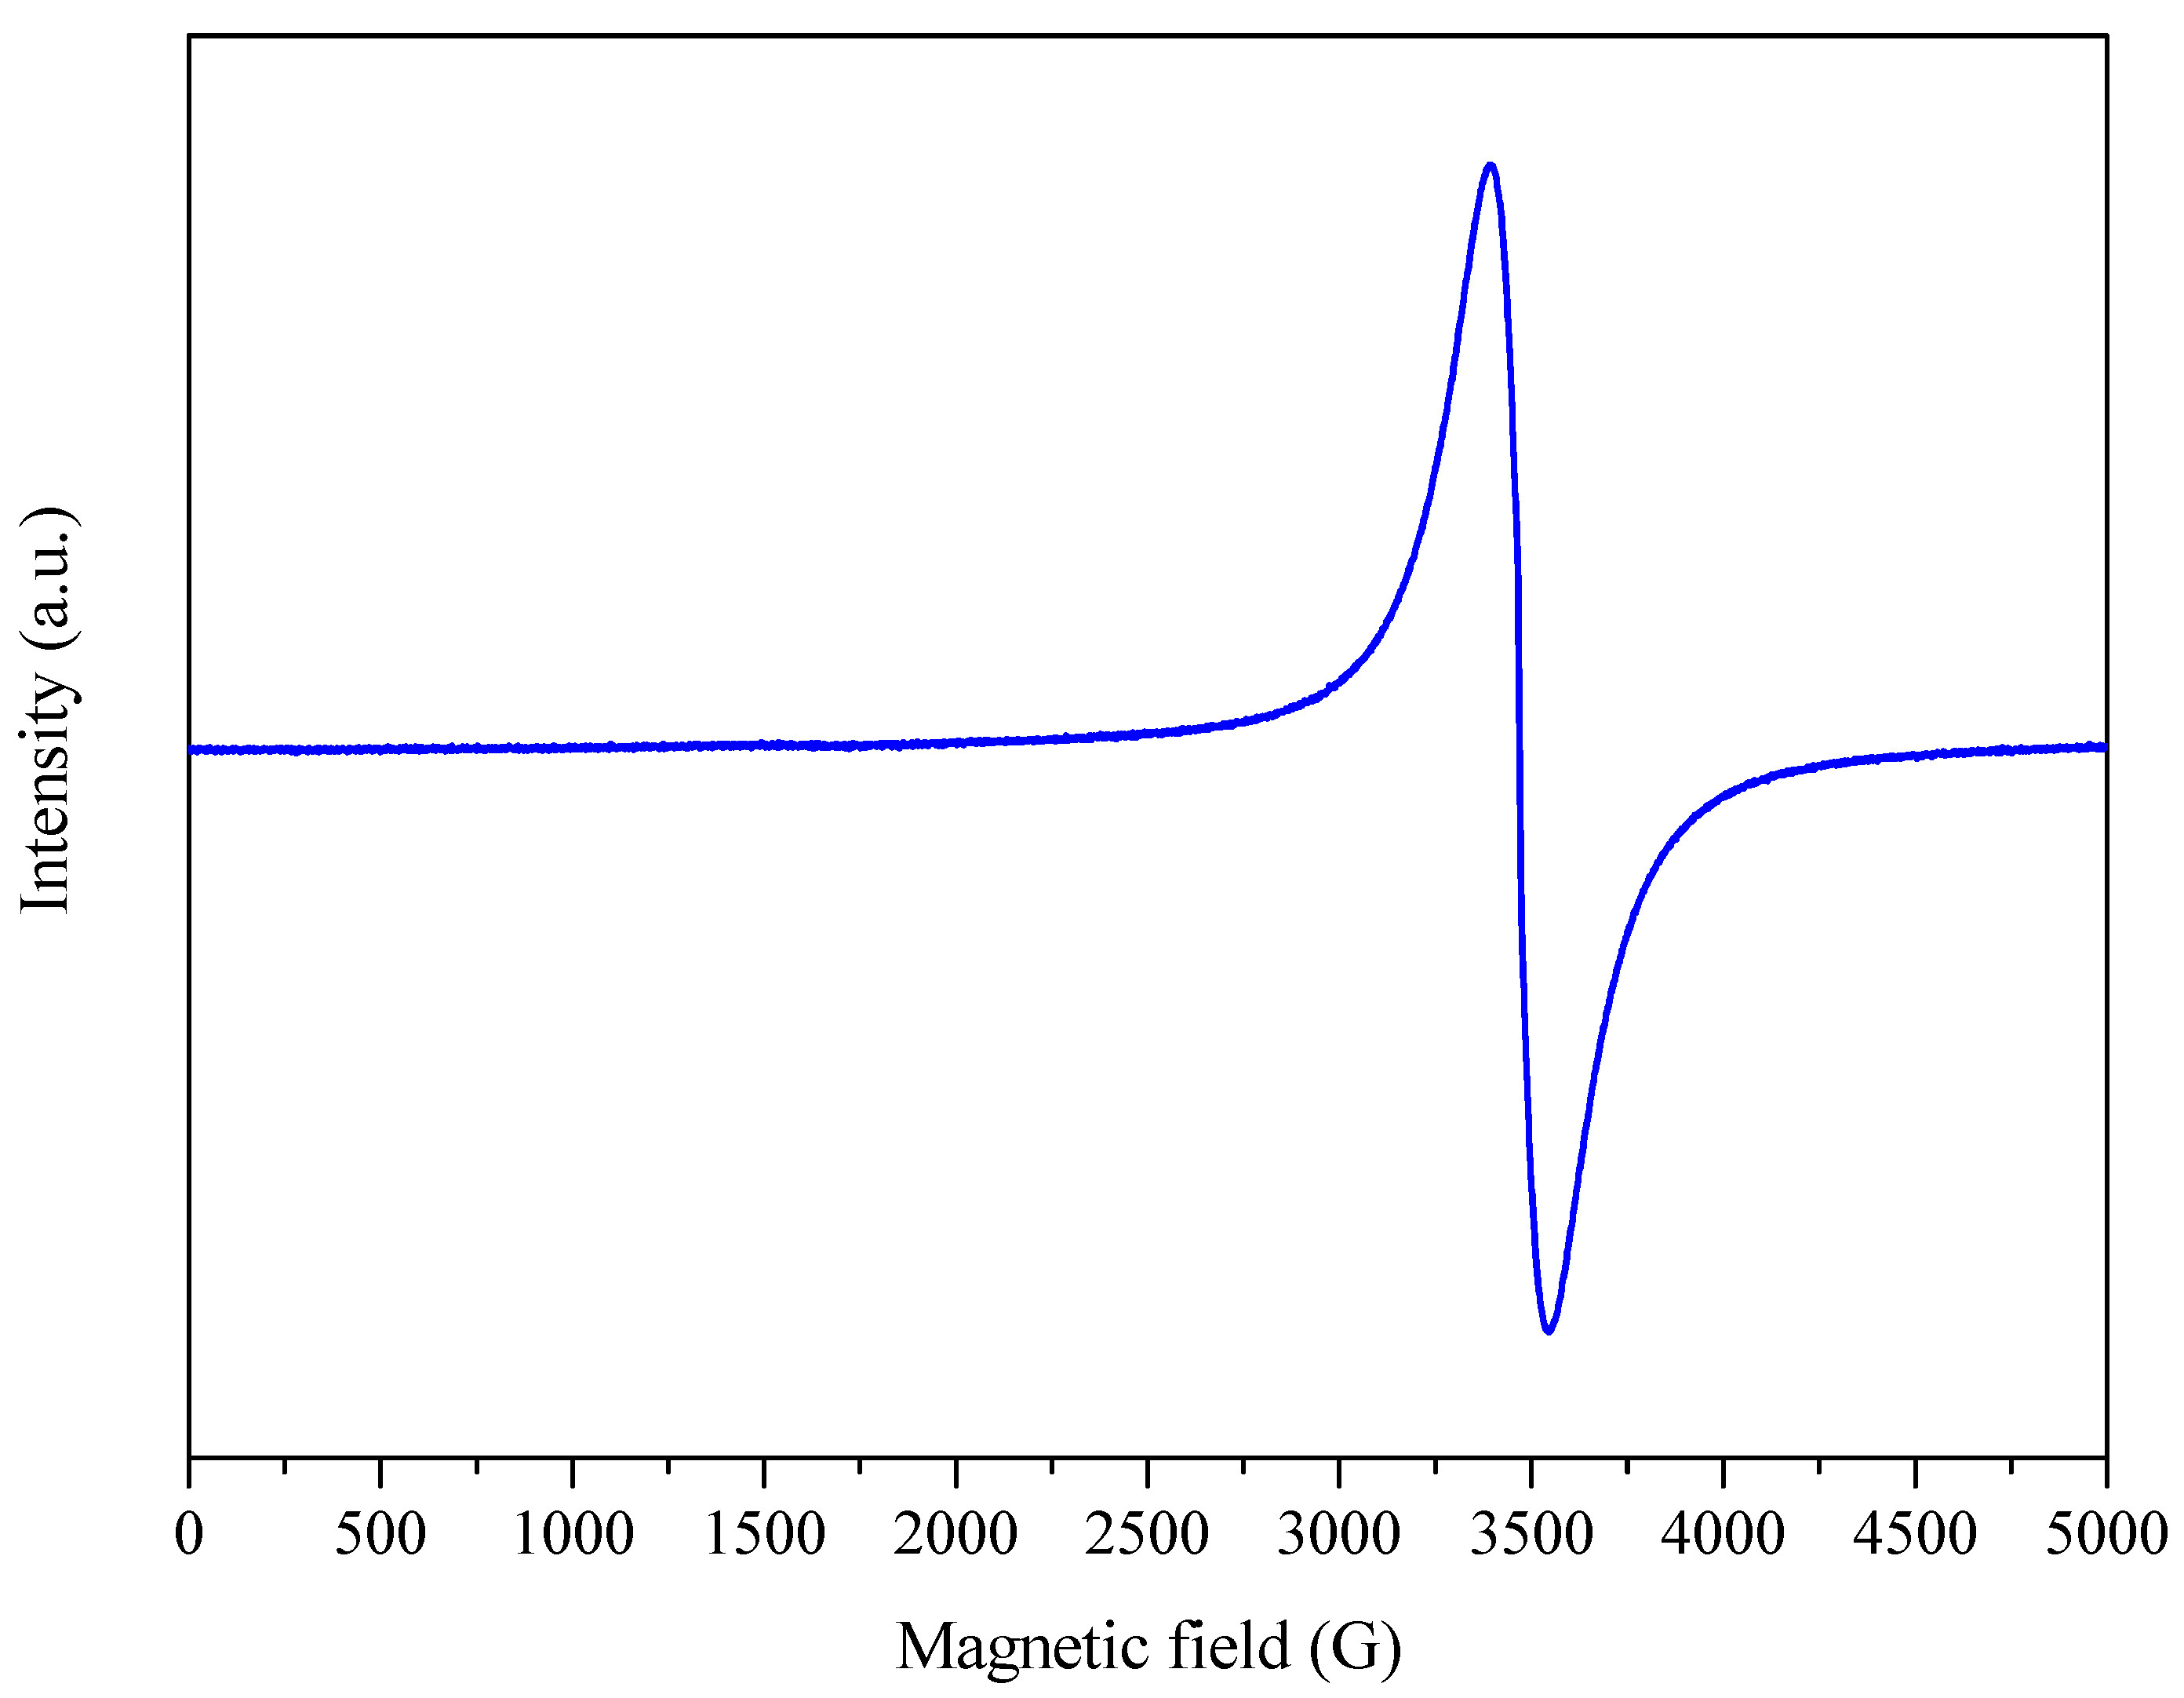
3.3.5. EPR Spectroscopy

The EPR spectra of the samples were mainly close to the spectrum shown in Figure 8, with a single-line organic free radical (OFR) resonance. All the samples showed a high degree of similarity and differed in intensity only for some replicates, which the different amplification of the equipment could explain. Therefore, only the results for sample 3 are considered in the following discussion.
The results (Figure 8 and Supplementary Material S5) showed that the samples presented a single resonance line with g ~2.00 and that the width of this line was modulated by the stronger or weaker interaction of the OFR with atoms such as C, N, and O [52].
In addition, the g-factor tended to increase at higher heating rates. At these higher rates, the same factor also increased with temperature. This suggested that the solid material absorbed gases, such as CO and CO2, near aromatic structures where the OFR was more stable. This possibility was based on the fact that the measured g -factor is described by Equation (2), that is, the g -factor depends on the interactions of unpaired electrons with the surrounding atoms [53]:
g = g e + λ E
where g   is the EPR proportionality factor, g e is the free electron (an unbounded electron with a constant value of 2.0023), λ is the spin-orbit coupling constant, and Δ E is the electron transition energy (the energy difference between the orbital containing the unpaired electron and the nearest available orbital). The λ value increases with atomic number, while Δ E decreases with atomic number [53].
The electron spin and orbital motion interaction analyses showed that the carbonized samples produced using a lower heating rate (5 °C min−1) had g = 2.0030, indicating that the unpaired electrons were located closer to the carbon atoms with a low spin-orbit coupling constant and high electronic transition energy. On the other hand, at a heating rate of 10 °C min−1, the g values tended to increase and reached g = 2.0034, indicating a shift of the unpaired electrons to sites in the molecule closer to the oxygen atoms, which have a higher spin-orbit coupling constant and a lower electronic transition energy [54,55].
The samples had high concentrations (~1019 spins g−1) of paramagnetic centers (Supplementary Material S5), which probably resulted from chemical bond breaking during the thermal treatment of the biomass. These paramagnetic centers included OH, CH3, and Φ (phenyl) formed by the thermal degradation of lignin. When the carbonization temperature was increased, the concentration of paramagnetic centers decreased from ~1019 to ~1016 spins g−1, which could be explained by the formation of condensed aromatic units/phenols (OH + Φ → Φ-OH) or methanol (OH + CH3 → H3C-OH) in the samples [54,56].

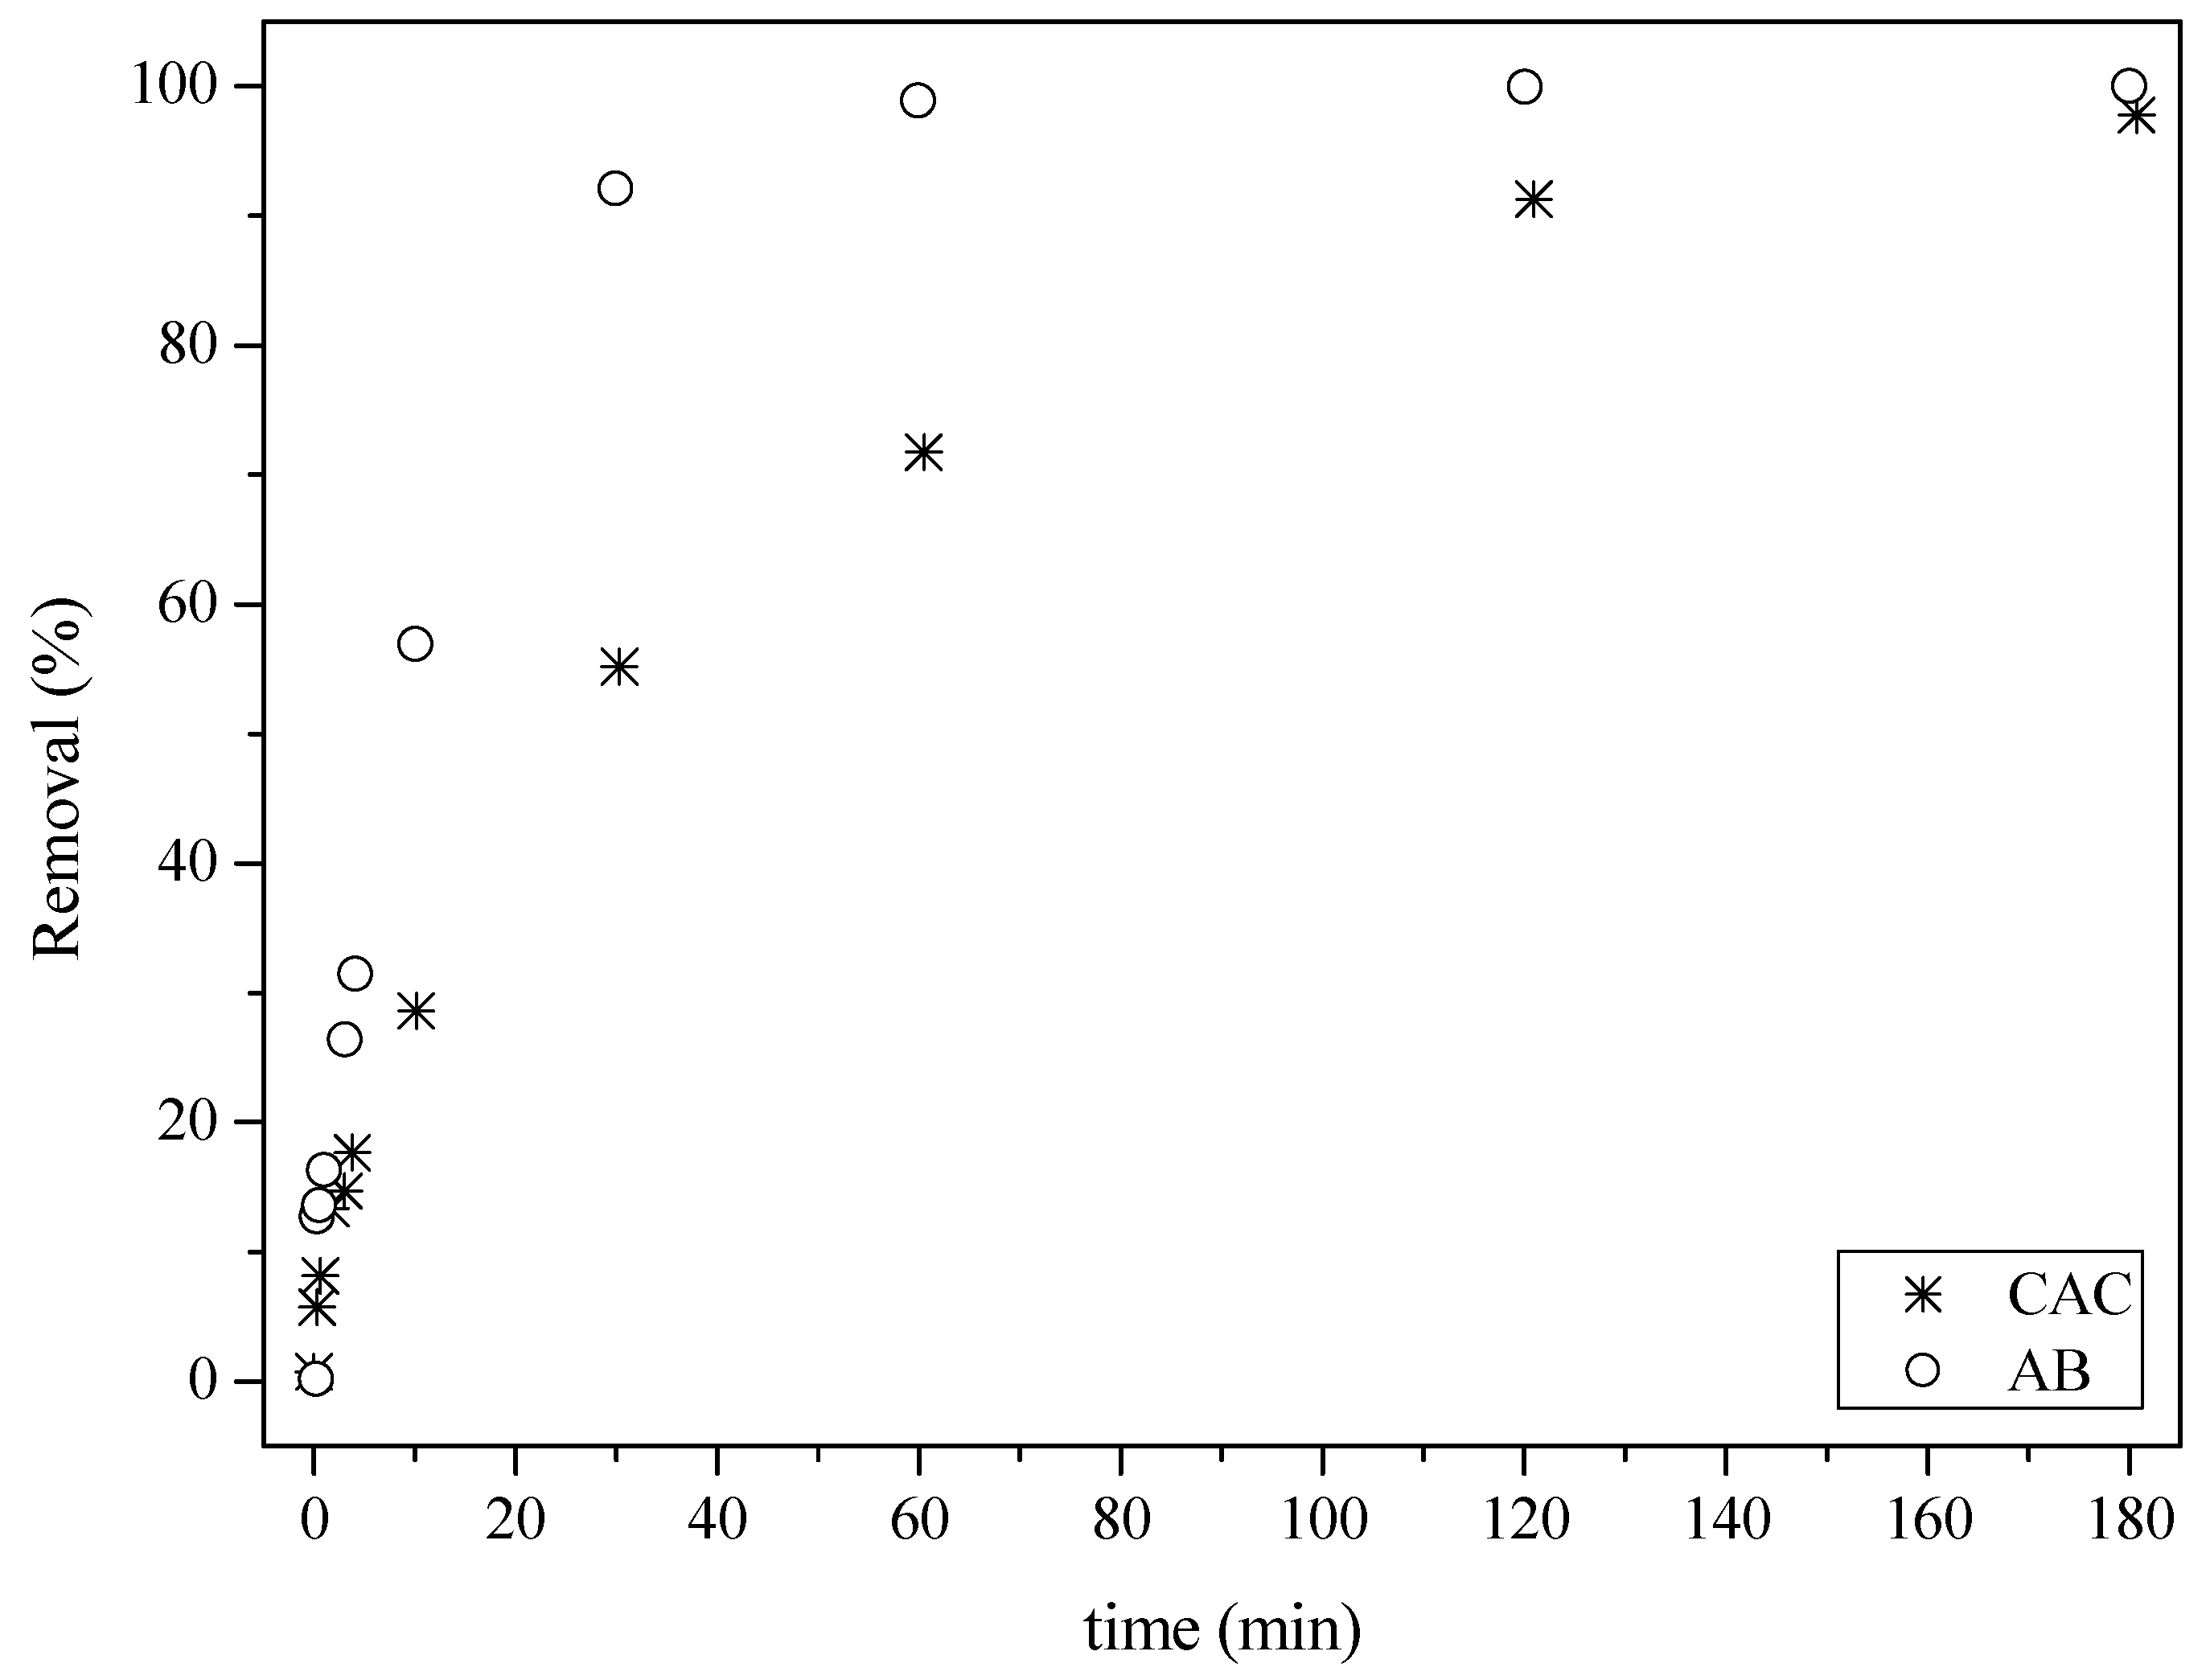
3.4. Application of Biochar

The newly activated biochar application was evaluated, revealing its promising activity as an adsorbent for hormones in an aqueous solution. Adsorption of the hormone estrone (Figure 9) led to the removal of approximately 30% in 10 min, while about 100% removal was achieved after 60 min. In the case of the commercial activated carbon sample, a reduction of around 70% was obtained after 60 min, with nearly 100% removal only achieved after 180 min.
Previously, in the work by Matos et al. [42], an analogous activated biochar produced with the same chemical agent (ZnCl2) was shown to be effective in removing the pesticides thiacloprid and thiamethoxam from aqueous solutions.
When evaluating the production costs, considering only the variable energy component, the production costs amount to approximately US$1.28 per kilogram of biochar. Given this cost efficiency and the significant removal of estrone, this carbonaceous material proves to be a promising and environmentally friendly alternative to address the problem of natural hormones in aquatic ecosystems.
Therefore, the encouraging results obtained in the present study suggest that this carbonaceous material has potential for use in the removal of hormones as well as agrochemicals from aqueous matrices.

4. Conclusions

The findings of this work indicated that black wattle has excellent potential for use in the production of activated biochar, employing chemical activation with ZnCl2 as the activating agent. The optimized parameters were a biomass to ZnCl2 ratio of 1:2, an impregnation time of 6.5 h, and a charring temperature of 600 °C, with a heating rate of either 5 or 10 °C min−1. SEM analysis showed that the biochar had an irregular and heterogeneous surface with pores after activation. Raman spectroscopy analysis indicated a high degree of organization of the activated carbon, as evidenced by a low I D / I G ratio, suggesting structural similarity to graphene. FTIR analysis showed the predominance of O-H, C-O, and C=C groups on the carbon surface. The EPR analysis provided information on the effects of the heating rate and carbonization temperature variables. The g -factor values were lower for samples carbonized using a lower heating rate and higher for those with a higher heating rate. The line width values ( H p p ) correlated with the specific surface areas, with values below 120 G being associated with surface areas higher than 1000 m2 g−1, while samples with line width values of around ~20 G had surface areas lower than 1000 m2 g−1. Applying the BET and BJH methods showed that it was possible to obtain biochar with a specific surface area of around 1500 m2 g−1. The average pore size of the samples was smaller than 2 nm, indicating a microporous nature. The newly developed material showed promise for application as an adsorbent for hormones and pesticides such as thiacloprid and thiamethoxam present in aqueous matrices. Therefore, using activated biochar produced from tannin industry residue is an option for water treatment and can contribute to a circular economy.

Supplementary Materials

The following supporting information can be downloaded at: https://www.mdpi.com/article/10.3390/su16020601/s1.

Author Contributions

Validation, E.M.C.C.B.; Formal analysis, T.T.S.M. and J.B.d.A.; Investigation, J.S.; Data curation, L.S.M.; Writing—original draft, T.W.L.; Writing—review & editing, G.P.; Supervision, A.S.M. All authors have read and agreed to the published version of the manuscript.

Funding

Financial support for this work was provided by CAPES (scholarship) and the Brazilian National Council of Scientific and Technological Development (CNPq, Grant #305241/2014-1 and 301927/2019-7).

Institutional Review Board Statement

Not applicable.

Informed Consent Statement

Not applicable.

Data Availability Statement

Data are contained within the article and Supplementary Materials.

Conflicts of Interest

The authors declare no conflict of interest.

References

  1. IBGE Production of Siviculture and Vegetal Extraction. Available online: https://cidades.ibge.gov.br/brasil/pesquisa/16/12705 (accessed on 29 May 2023).
  2. Doumer, M.E.; Arízaga, G.G.C.; da Silva, D.A.; Yamamoto, C.I.; Novotny, E.H.; Santos, J.M.; dos Santos, L.O.; Wisniewski, A., Jr.; de Andrade, J.B.; Mangrich, A.S. Slow Pyrolysis of Different Brazilian Waste Biomasses as Sources of Soil Conditioners and Energy, and for Environmental Protection. J. Anal. Appl. Pyrolysis 2015, 113, 434–443. [Google Scholar] [CrossRef]
  3. Ferreira-Leitão, V.; Gottschalk, L.M.F.M.F.; Ferrara, M.A.A.; Nepomuceno, A.L.L.; Molinari, H.B.C.B.C.; Bon, E.P.S.P.S.; Ferreira-Leitao, V.; Gottschalk, L.M.F.M.F.; Ferrara, M.A.A.; Nepomuceno, A.L.L.; et al. Biomass Residues in Brazil: Availability and Potential Uses. Waste Biomass Valorization 2010, 1, 65–76. [Google Scholar] [CrossRef]
  4. Nair, L.G.; Agrawal, K.; Verma, P. An Overview of Sustainable Approaches for Bioenergy Production from Agro-Industrial Wastes. Energy Nexus 2022, 6, 100086. [Google Scholar] [CrossRef]
  5. Amalina, F.; Razak, A.S.A.; Krishnan, S.; Sulaiman, H.; Zularisam, A.W.; Nasrullah, M. Biochar Production Techniques Utilizing Biomass Waste-Derived Materials and Environmental Applications—A Review. J. Hazard. Mater. Adv. 2022, 7, 100134. [Google Scholar] [CrossRef]
  6. Schultz, J.; Capobianco, G.; da Silva Veiga, P.A.; Fornari, M.R.; Antonangelo, A.R.; Tebcherani, S.M.; Mangrich, A.S.; Pianaro, S.A. Sustainable Activated Carbon Obtained as a By-Product of the Sugar and Alcohol Industry for Removal of Amoxicillin from Aqueous Solution. Energy Ecol. Environ. 2020, 5, 433–443. [Google Scholar] [CrossRef]
  7. da Silva Veiga, P.A.; Cerqueira, M.H.; Goncalves, M.G.; da Silva Matos, T.T.; Pantano, G.; Schultz, J.; de Andrade, J.B.; Mangrich, A.S. Upgrading from Batch to Continuous Flow Process for the Pyrolysis of Sugarcane Bagasse: Structural Characterization of the Biochars Produced. J. Environ. Manag. 2021, 285, 112145. [Google Scholar] [CrossRef] [PubMed]
  8. Wang, H.; Nan, Q.; Waqas, M.; Wu, W. Stability of Biochar in Mineral Soils: Assessment Methods, Influencing Factors and Potential Problems. Sci. Total Environ. 2022, 806, 150789. [Google Scholar] [CrossRef]
  9. Díaz-Maroto, C.G.; Mašek, O.; Pizarro, P.; Serrano, D.P.; Moreno, I.; Fermoso, J. Removal of NO at Low Concentrations from Polluted Air in Semi-Closed Environments by Activated Biochars from Renewables Feedstocks. J. Environ. Manag. 2023, 341, 118031. [Google Scholar] [CrossRef]
  10. El-Bestawy, E.A.; Gaber, M.; Shokry, H.; Samy, M. Effective Degradation of Atrazine by Spinach-Derived Biochar via Persulfate Activation System: Process Optimization, Mechanism, Degradation Pathway and Application in Real Wastewater. Environ. Res. 2023, 229, 115987. [Google Scholar] [CrossRef]
  11. Piloni, R.V.; Fontes Coelho, L.; Sass, D.C.; Lanteri, M.; Zaghete Bertochi, M.A.; Laura Moyano, E.; Contiero, J. Biochars from Spirulina as an Alternative Material in the Purification of Lactic Acid from a Fermentation Broth. Curr. Res. Green Sustain. Chem. 2021, 4, 100084. [Google Scholar] [CrossRef]
  12. Bhavani, P.; Hussain, M.; Park, Y.-K. Recent Advancements on the Sustainable Biochar Based Semiconducting Materials for Photocatalytic Applications: A State of the Art Review. J. Clean. Prod. 2022, 330, 129899. [Google Scholar] [CrossRef]
  13. Cha, J.S.; Park, S.H.; Jung, S.-C.; Ryu, C.; Jeon, J.-K.; Shin, M.-C.; Park, Y.-K. Production and Utilization of Biochar: A Review. J. Ind. Eng. Chem. 2016, 40, 1–15. [Google Scholar] [CrossRef]
  14. Yaashikaa, P.R.; Senthil Kumar, P.; Varjani, S.J.; Saravanan, A. Advances in Production and Application of Biochar from Lignocellulosic Feedstocks for Remediation of Environmental Pollutants. Bioresour. Technol. 2019, 292, 122030. [Google Scholar] [CrossRef]
  15. Demiral, H.; Demiral, İ.; Tümsek, F.; Karabacakoğlu, B. Pore Structure of Activated Carbon Prepared from Hazelnut Bagasse by Chemical Activation. Surf. Interface Anal. 2008, 40, 616–619. [Google Scholar] [CrossRef]
  16. Kılıç, M.; Apaydın-Varol, E.; Pütün, A.E. Preparation and Surface Characterization of Activated Carbons from Euphorbia Rigida by Chemical Activation with ZnCl2, K2CO3, NaOH and H3PO4. Appl. Surf. Sci. 2012, 261, 247–254. [Google Scholar] [CrossRef]
  17. Heidarinejad, Z.; Dehghani, M.H.; Heidari, M.; Javedan, G.; Ali, I.; Sillanpää, M. Methods for Preparation and Activation of Activated Carbon: A Review. Environ. Chem. Lett. 2020, 18, 393–415. [Google Scholar] [CrossRef]
  18. Yang, K.; Peng, J.; Srinivasakannan, C.; Zhang, L.; Xia, H.; Duan, X. Preparation of High Surface Area Activated Carbon from Coconut Shells Using Microwave Heating. Bioresour. Technol. 2010, 101, 6163–6169. [Google Scholar] [CrossRef]
  19. de Moraes, N.P.; Boldrin, F.H.C.; Campos, T.M.B.; Thim, G.P.; Lianqing, Y.; de Vasconcelos Lanza, M.R.; Rodrigues, L.A. Black-Wattle Tannin/Kraft Lignin H3PO4-Activated Carbon Xerogels as Excellent and Sustainable Adsorbents. Int. J. Biol. Macromol. 2023, 227, 58–70. [Google Scholar] [CrossRef] [PubMed]
  20. de Azevedo, C.F.; Rodrigues, D.L.C.; Silveira, L.L.; Lima, E.C.; Osorio, A.G.; Andreazza, R.; de Pereira, C.M.P.; Poletti, T.; Machado Machado, F. Comprehensive Adsorption and Spectroscopic Studies on the Interaction of Magnetic Biochar from Black Wattle Sawdust with Beta-Blocker Metoprolol. Bioresour. Technol. 2023, 388, 129708. [Google Scholar] [CrossRef] [PubMed]
  21. Beckinghausen, A.; Reynders, J.; Merckel, R.; Wu, Y.W.; Marais, H.; Schwede, S. Post-Pyrolysis Treatments of Biochars from Sewage Sludge and A. Mearnsii for Ammonia (NH4-n) Recovery. Appl. Energy 2020, 271, 115212. [Google Scholar] [CrossRef]
  22. Lütke, S.F.; Igansi, A.V.; Pegoraro, L.; Dotto, G.L.; Pinto, L.A.A.; Cadaval, T.R.S. Preparation of Activated Carbon from Black Wattle Bark Waste and Its Application for Phenol Adsorption. J. Environ. Chem. Eng. 2019, 7, 103396. [Google Scholar] [CrossRef]
  23. de Liz, M.V.; Nagata, N.; Peralta-Zamora, P. Considerações Sobre o Preparo de Amostras Contendo Micropoluentes Estrogênicos. Quim. Nova 2012, 35, 1213–1215. [Google Scholar] [CrossRef]
  24. Ahmadpour, A.; Do, D.D. The Preparation of Activated Carbon from Macadamia Nutshell by Chemical Activation. Carbon N. Y. 1997, 35, 1723–1732. [Google Scholar] [CrossRef]
  25. Almansa, C.; Molina-Sabio, M.; Rodríguez-Reinoso, F. Adsorption of Methane into ZnCl2-Activated Carbon Derived Discs. Microporous Mesoporous Mater. 2004, 76, 185–191. [Google Scholar] [CrossRef]
  26. Cherik, D.; Louhab, K. Preparation of Microporous Activated Carbon from Date Stones by Chemical Activation Using Zinc Chloride. Energy Sources Part A Recover. Util. Environ. Eff. 2017, 39, 1935–1941. [Google Scholar] [CrossRef]
  27. Foo, P.; Lee, L. Preparation of Activated Carbon from Parkia Speciosa Pod by Chemical Activation. In Proceedings of the World Congress on Engineering 2010, London, UK, 30 June–2 July 2010; Volume II, pp. 1–17. [Google Scholar]
  28. Basu, P. Pyrolysis. In Biomass Gasification, Pyrolysis and Torrefaction; Elsevier Inc.: Amsterdam, The Netherlands, 2013; pp. 147–176. ISBN 978-0-12-396488-5. [Google Scholar]
  29. Ozhan, A.; Sahin, O.; Kuçuk, M.M.; Saka, C. Preparation and Characterization of Activated Carbon from Pine Cone by Microwave-Induced ZnCl2 Activation and Its Effects on the Adsorption of Methylene Blue. Cellulose 2014, 21, 2457–2467. [Google Scholar] [CrossRef]
  30. Onal, Y.; Akmil-Başar, C.; Sarici-Ozdemir, Ç.; Erdoğan, S. Textural Development of Sugar Beet Bagasse Activated with ZnCl2. J. Hazard. Mater. 2007, 142, 138–143. [Google Scholar] [CrossRef] [PubMed]
  31. Ahmed, M.J.; Theydan, S.K. Physical and Chemical Characteristics of Activated Carbon Prepared by Pyrolysis of Chemically Treated Date Stones and Its Ability to Adsorb Organics. Powder Technol. 2012, 229, 237–245. [Google Scholar] [CrossRef]
  32. Sayğılı, H.; Güzel, F. Performance of New Mesoporous Carbon Sorbent Prepared from Grape Industrial Processing Wastes for Malachite Green and Congo Red Removal. Chem. Eng. Res. Des. 2015, 100, 27–38. [Google Scholar] [CrossRef]
  33. Dural, M.U.; Cavas, L.; Papageorgiou, S.K.; Katsaros, F.K. Methylene Blue Adsorption on Activated Carbon Prepared from Posidonia oceanica (L.) Dead Leaves: Kinetics and Equilibrium Studies. Chem. Eng. J. 2011, 168, 77–85. [Google Scholar] [CrossRef]
  34. Saka, C. BET, TG–DTG, FT-IR, SEM, Iodine Number Analysis and Preparation of Activated Carbon from Acorn Shell by Chemical Activation with ZnCl2. J. Anal. Appl. Pyrolysis 2012, 95, 21–24. [Google Scholar] [CrossRef]
  35. da Costa Lopes, A.S.; de Carvalho, S.M.L.; Brasil, D.D.S.B.; de Alcântara Mendes, R.; Lima, M.O. Surface Modification of Commercial Activated Carbon (CAG) for the Adsorption of Benzene and Toluene. Am. J. Anal. Chem. 2015, 6, 528–538. [Google Scholar] [CrossRef]
  36. Saleem, J.; Shahid, U.B.; Hijab, M.; Mackey, H.; McKay, G. Production and Applications of Activated Carbons as Adsorbents from Olive Stones. Biomass Convers. Biorefinery 2019, 9, 775–802. [Google Scholar] [CrossRef]
  37. Lu, X.; Jaroniec, M.; Madey, R. Use of Adsorption Isotherms of Light Normal Alkanes for Characterizing Microporous Activated Carbons. Langmuir 1991, 7, 173–177. [Google Scholar] [CrossRef]
  38. Moreno-Piraján, J.C.; Giraldo, L. Adsorption of Copper from Aqueous Solution by Activated Carbons Obtained by Pyrolysis of Cassava Peel. J. Anal. Appl. Pyrolysis 2010, 87, 188–193. [Google Scholar] [CrossRef]
  39. Mahamad, M.N.; Zaini, M.A.A.; Zakaria, Z.A. Preparation and Characterization of Activated Carbon from Pineapple Waste Biomass for Dye Removal. Int. Biodeterior. Biodegrad. 2015, 102, 274–280. [Google Scholar] [CrossRef]
  40. Rovani, S.; Censi, M.T.; Pedrotti, S.L.; Lima, É.C.; Cataluña, R.; Fernandes, A.N. Development of a New Adsorbent from Agro-Industrial Waste and Its Potential Use in Endocrine Disruptor Compound Removal. J. Hazard. Mater. 2014, 271, 311–320. [Google Scholar] [CrossRef] [PubMed]
  41. Liao, W.; Zhang, X.; Ke, S.; Shao, J.; Yang, H.; Zhang, S.; Chen, H. The Influence of Biomass Species and Pyrolysis Temperature on Carbon-Retention Ability and Heavy Metal Adsorption Property during Biochar Aging. Fuel Process. Technol. 2023, 240, 107580. [Google Scholar] [CrossRef]
  42. Matos, T.; Schultz, J.; Khan, M.; Zanoelo, E.; Mangrich, A.; Araújo, B.; Navickiene, S.; Romão, L. Using Magnetized (Fe3O4/Biochar Nanocomposites) and Activated Biochar as Adsorbents to Remove Two Neuro-Active Pesticides from Waters. J. Braz. Chem. Soc. 2017, 28, 1975–1987. [Google Scholar] [CrossRef]
  43. Liu, Y.; Liao, C.; Tang, Y.; Tang, J.; Sun, Y.; Ma, X. Techno-Environmental-Economic Evaluation of the Small-Scale Municipal Solid Waste (MSW) Gasification-Based and Incineration-Based Power Generation Plants. J. Taiwan Inst. Chem. Eng. 2022, 141, 104594. [Google Scholar] [CrossRef]
  44. Corrales, R.C.N.R.; Mendes, F.M.T.; Perrone, C.C.; Sant’anna, C.; de Souza, W.; Abud, Y.; Bon, E.P.D.S.; Ferreira-Leitão, V. Structural Evaluation of Sugar Cane Bagasse Steam Pretreated in the Presence of CO2 and SO2. Biotechnol. Biofuels 2012, 5, 36. [Google Scholar] [CrossRef]
  45. Irfan, M.; Syed, Q.; Sher, M.G.; Baig, S.; Nadeem, M. FTIR and SEM Analysis of Thermo-Chemical Fractionated Sugarcane Bagasse. Turk. J. Biochem. 2011, 36, 322–328. [Google Scholar]
  46. Geçgel, Ü.; Kocabıyık, B.; Üner, O. Adsorptive Removal of Methylene Blue from Aqueous Solution by the Activated Carbon Obtained from the Fruit of Catalpa Bignonioides. Water Air Soil Pollut. 2015, 226, 1–14. [Google Scholar] [CrossRef]
  47. Ceyhan, A.A.; Şahin, Ö.; Baytar, O.; Saka, C. Surface and Porous Characterization of Activated Carbon Prepared from Pyrolysis of Biomass by Two-Stage Procedure at Low Activation Temperature and It’s the Adsorption of Iodine. J. Anal. Appl. Pyrolysis 2013, 104, 378–383. [Google Scholar] [CrossRef]
  48. Ceyhan, A.A.; Şahin, Ö.; Saka, C.; Yalçın, A. A Novel Thermal Process for Activated Carbon Production from the Vetch Biomass with Air at Low Temperature by Two-Stage Procedure. J. Anal. Appl. Pyrolysis 2013, 104, 170–175. [Google Scholar] [CrossRef]
  49. Dehkhoda, A.M.; Ellis, N.; Gyenge, E. Effect of Activated Biochar Porous Structure on the Capacitive Deionization of NaCl and ZnCl2 Solutions. Microporous Mesoporous Mater. 2016, 224, 217–228. [Google Scholar] [CrossRef]
  50. Asadullah, M.; Asaduzzaman, M.; Kabir, M.S.; Mostofa, M.G.; Miyazawa, T. Chemical and Structural Evaluation of Activated Carbon Prepared from Jute Sticks for Brilliant Green Dye Removal from Aqueous Solution. J. Hazard. Mater. 2010, 174, 437–443. [Google Scholar] [CrossRef]
  51. Sheng, C. Char Structure Characterised by Raman Spectroscopy and Its Correlations with Combustion Reactivity. Fuel 2007, 86, 2316–2324. [Google Scholar] [CrossRef]
  52. Boyera, S.J.; Clarksonb, R.B. Electron Paramagnetic Resonance Studies of an Active Carbon: The Influence of Preparation Procedure on the Oxygen Response of the Linewidth. Colloids Surf. A Physicochem. Eng. Asp. 1994, 82, 217–224. [Google Scholar] [CrossRef]
  53. Weil, J.; Bolton, J. Electron Paramagnetic Resonance: Elementary Theory and Practical Applications, 2nd ed.; John Wiley & Sons, Inc.: Hoboken, NJ, USA, 2007; ISBN 9780471754961. [Google Scholar]
  54. Krzesińska, M.; Pilawa, B.; Pusz, S.; Ng, J. Physical Characteristics of Carbon Materials Derived from Pyrolysed Vascular Plants. Biomass Bioenergy 2006, 30, 166–176. [Google Scholar] [CrossRef]
  55. dos Santos, J.V.; Mangrich, A.S.; Pereira, B.F.; Pillon, C.N.; Novotny, E.H.; Bonagamba, T.J.; Abbt-Braun, G.; Frimmel, F.H. 13C NMR and EPR Spectroscopic Evaluation of Oil Shale Mined Soil Recuperation. J. Braz. Chem. Soc. 2013, 24, 320–326. [Google Scholar] [CrossRef]
  56. Łoś, S.; Duclaux, L.; Kempiński, W.; Połomska, M. Size Effect in the Characterization of Microporous Activated Nanostructured Carbon. Microporous Mesoporous Mater. 2010, 130, 21–25. [Google Scholar] [CrossRef]
Figure 1. Pyrolysis process of plant biomass and production of carbonaceous material.
Sustainability 16 00601 g001
Figure 2. XRD patterns of the biochar: (a) after carbonization at 250 °C, (b) after carbonization at 600 °C before the washing process, and (c) after carbonization at 600 °C and the washing process.
Sustainability 16 00601 g002
Figure 3. Pareto chart of standardized effects for the 23 complete factorial design. A: impregnation time, B: final carbonization temperature, and C: heating rate.
Sustainability 16 00601 g003
Figure 4. SEM images: (a) black wattle biomass (240× magnification), (b) carbonaceous material (240× magnification), (c) carbonaceous material (2400× magnification), and (d) carbonaceous material (10,000× magnification).
Sustainability 16 00601 g004
Figure 5. FTIR spectra of biochar samples doped with ZnCl2 using a 1:2 (w w−1) biomass-to-chemical reagent ratio after the pyrolysis and washing processes (Runs 1 to 8), and the spectrum for the black wattle biomass (BWB).
Sustainability 16 00601 g005
Figure 6. Examples of the Raman spectra of the samples: (a) run 3 (A: 6.5 h; B: 600 °C; C: 5 °C min−1) and (b) run 6 (A: 13 h; B: 400 °C; C: 10 °C min−1).
Sustainability 16 00601 g006
Figure 7. An example of the procedure for Lorentzian curve fitting of the D (red) and G (green) bands extracted from Raman spectra (black) and its corresponding smoothed counterpart (blue).
Sustainability 16 00601 g007
Figure 8. EPR spectrum of sample 3 (A: 6.5 h; B: 600 °C; C: 5 °C min−1) in a magnetic field of 5000 G at room temperature (~25 °C).
Sustainability 16 00601 g008
Figure 9. Adsorption of the hormone estrone at 25 °C: (○) activated biochar sample (AB) and (*) commercial activated carbon (CAC).
Sustainability 16 00601 g009
Table 1. Factors and levels applied in the 23 complete factorial design.
FactorCodeLow (−1)High (+1)
Impregnation time (h)A6.513
Final carbonization temperature (°C)B400600
Heating rate (°C min−1)C510
Table 2. Raman spectroscopy results for the samples from runs 3, 5, 6, and 7.
RunD Band
(cm−1)
G Band
(cm−1)
I D / I G W D
(cm−1)
W G
(cm−1)
31355.61589.82.7256.092.4
51365.11591.52.8317.286.1
61361.21586.32.9304.098.5
71356.31590.43.2288.194.2
Disclaimer/Publisher’s Note: The statements, opinions and data contained in all publications are solely those of the individual author(s) and contributor(s) and not of MDPI and/or the editor(s). MDPI and/or the editor(s) disclaim responsibility for any injury to people or property resulting from any ideas, methods, instructions or products referred to in the content.

