
Energy Performance Analysis and Study of an Office Building in an Extremely Hot and Cold Region

Abstract
1. Introduction
2. Literature Review
2.1. At the Building Skin Level
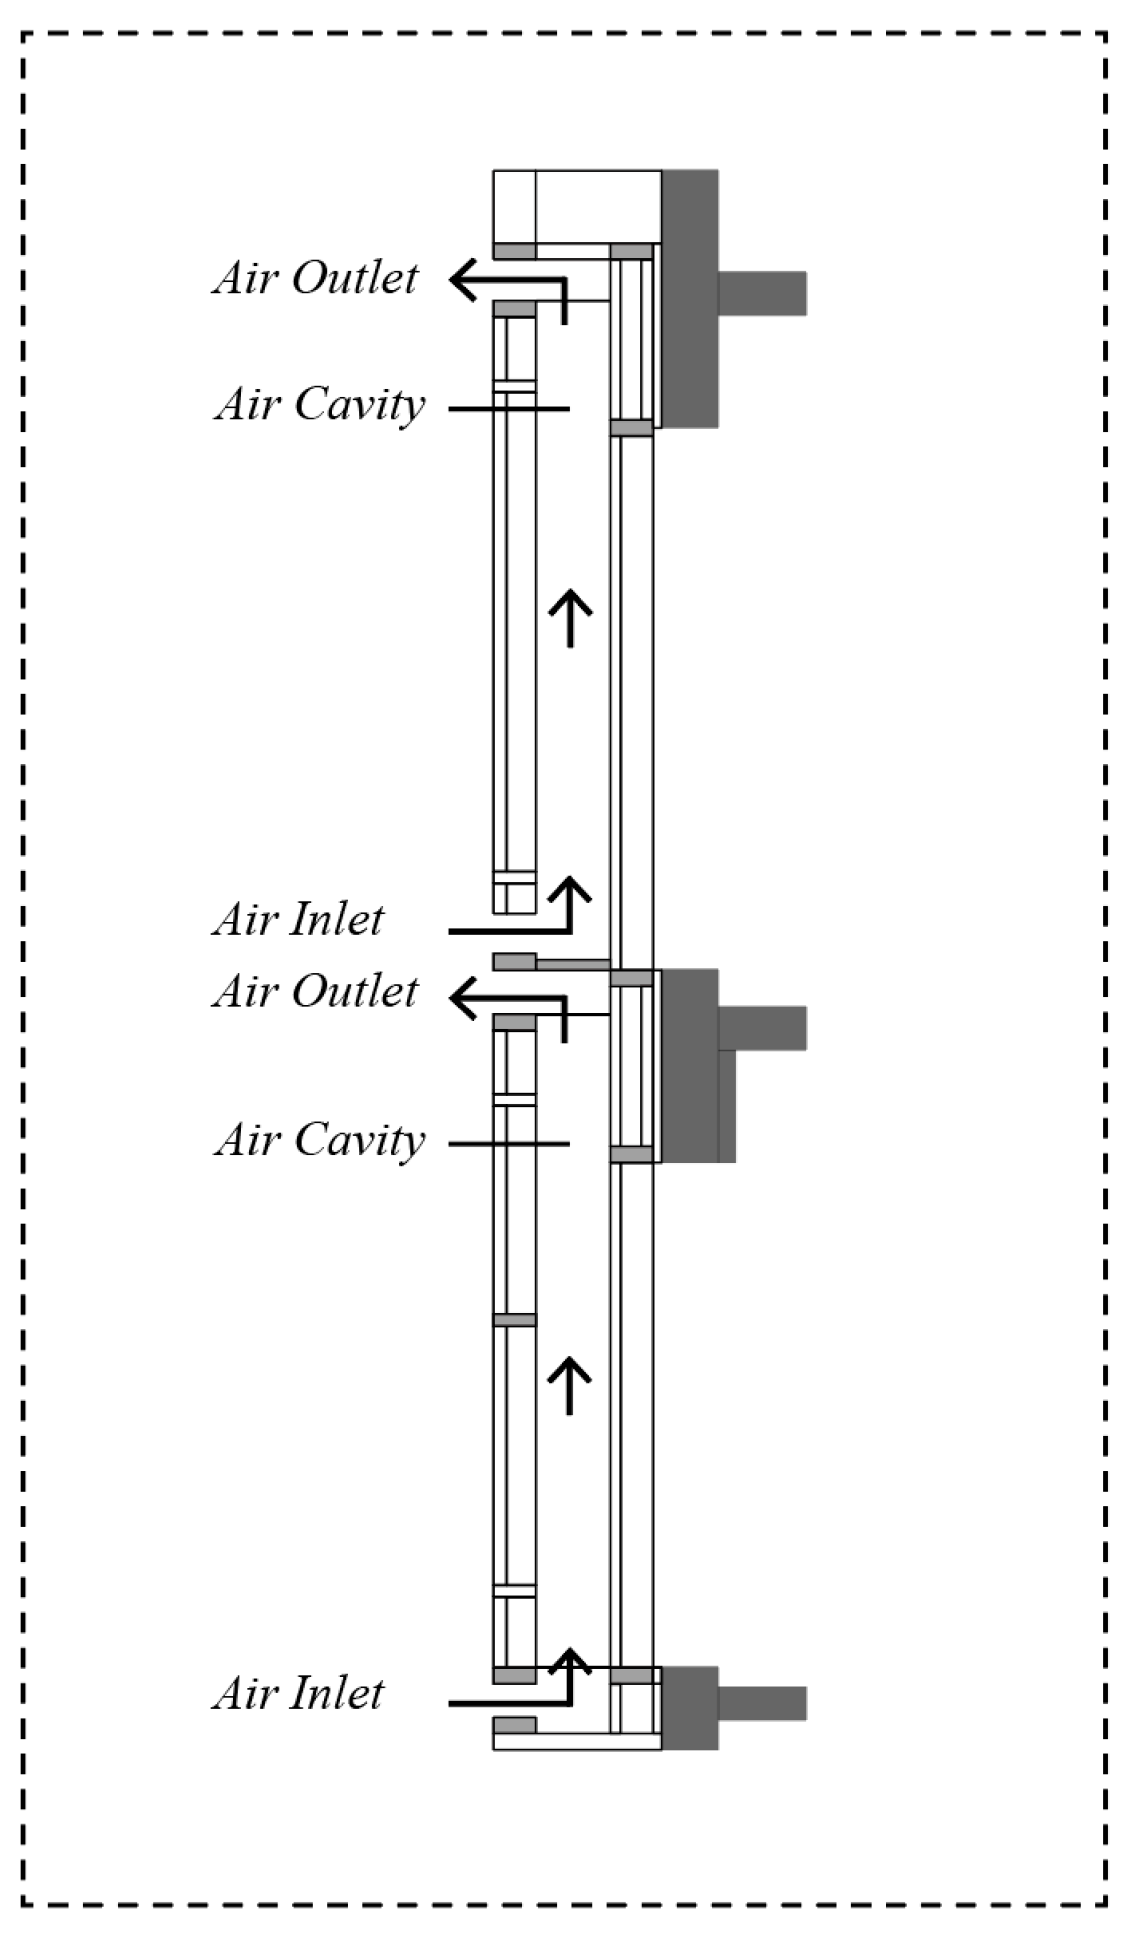
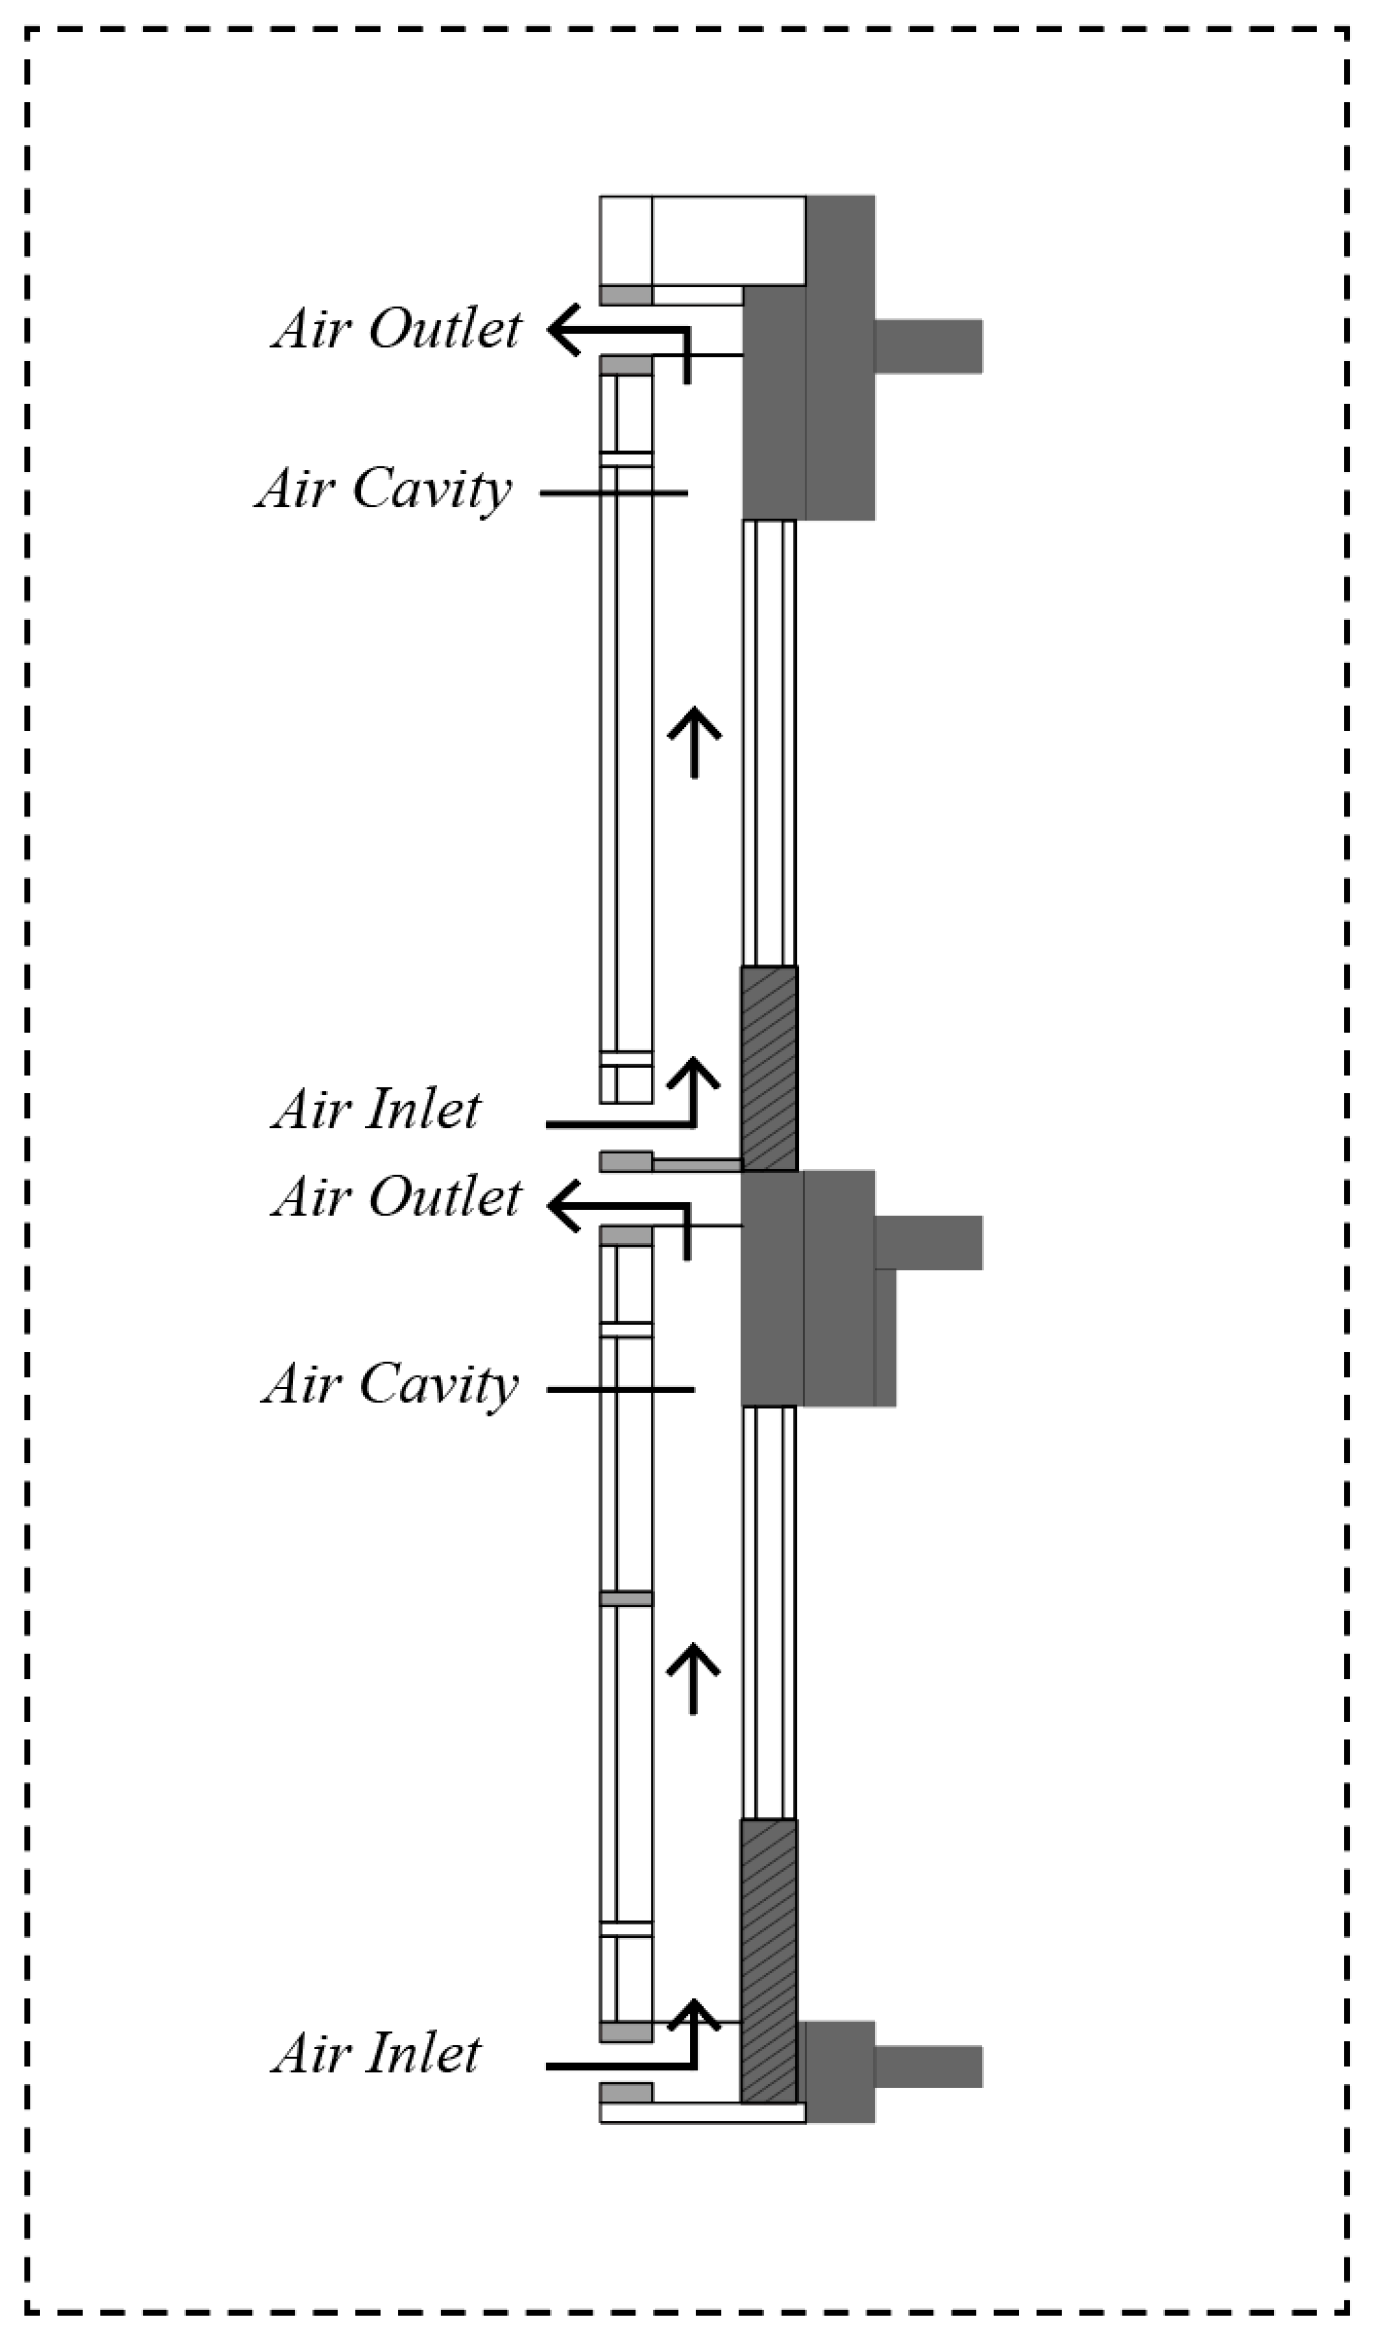
2.2. At the Window Performance Level
- (1)
- To reduce the level of energy consumption, this paper proposes two optimization strategies, renovation, and new construction, in combination with the characteristics of office buildings in Turpan. This strategy can provide designers with ideas to guide them when designing.
- (2)
- Prioritization of energy-efficient retrofit programs for office buildings in Turpan (TOPSIS method using information entropy and different weighting factors). This can help guide designers when making trade-off judgments.
3. Research Methodology and Thesis Framework
3.1. Presentation of Energy Consumption Indicators
3.2. Introduction to the Entropy-Based TOPSIS Method Approach
- (1)
- Establishment of the sample matrix:
- (2)
- Calculation of entropy value of evaluation indicators:
- (3)
- Establishment of coefficients of variation for evaluation indicators:
- (4)
- Determination of entropy weights for evaluation indicators:
- (5)
- Distance of the calculated result to the positive and negative ideal solutions:
- (6)
- Calculate the relative posting progress for each evaluation indicator:
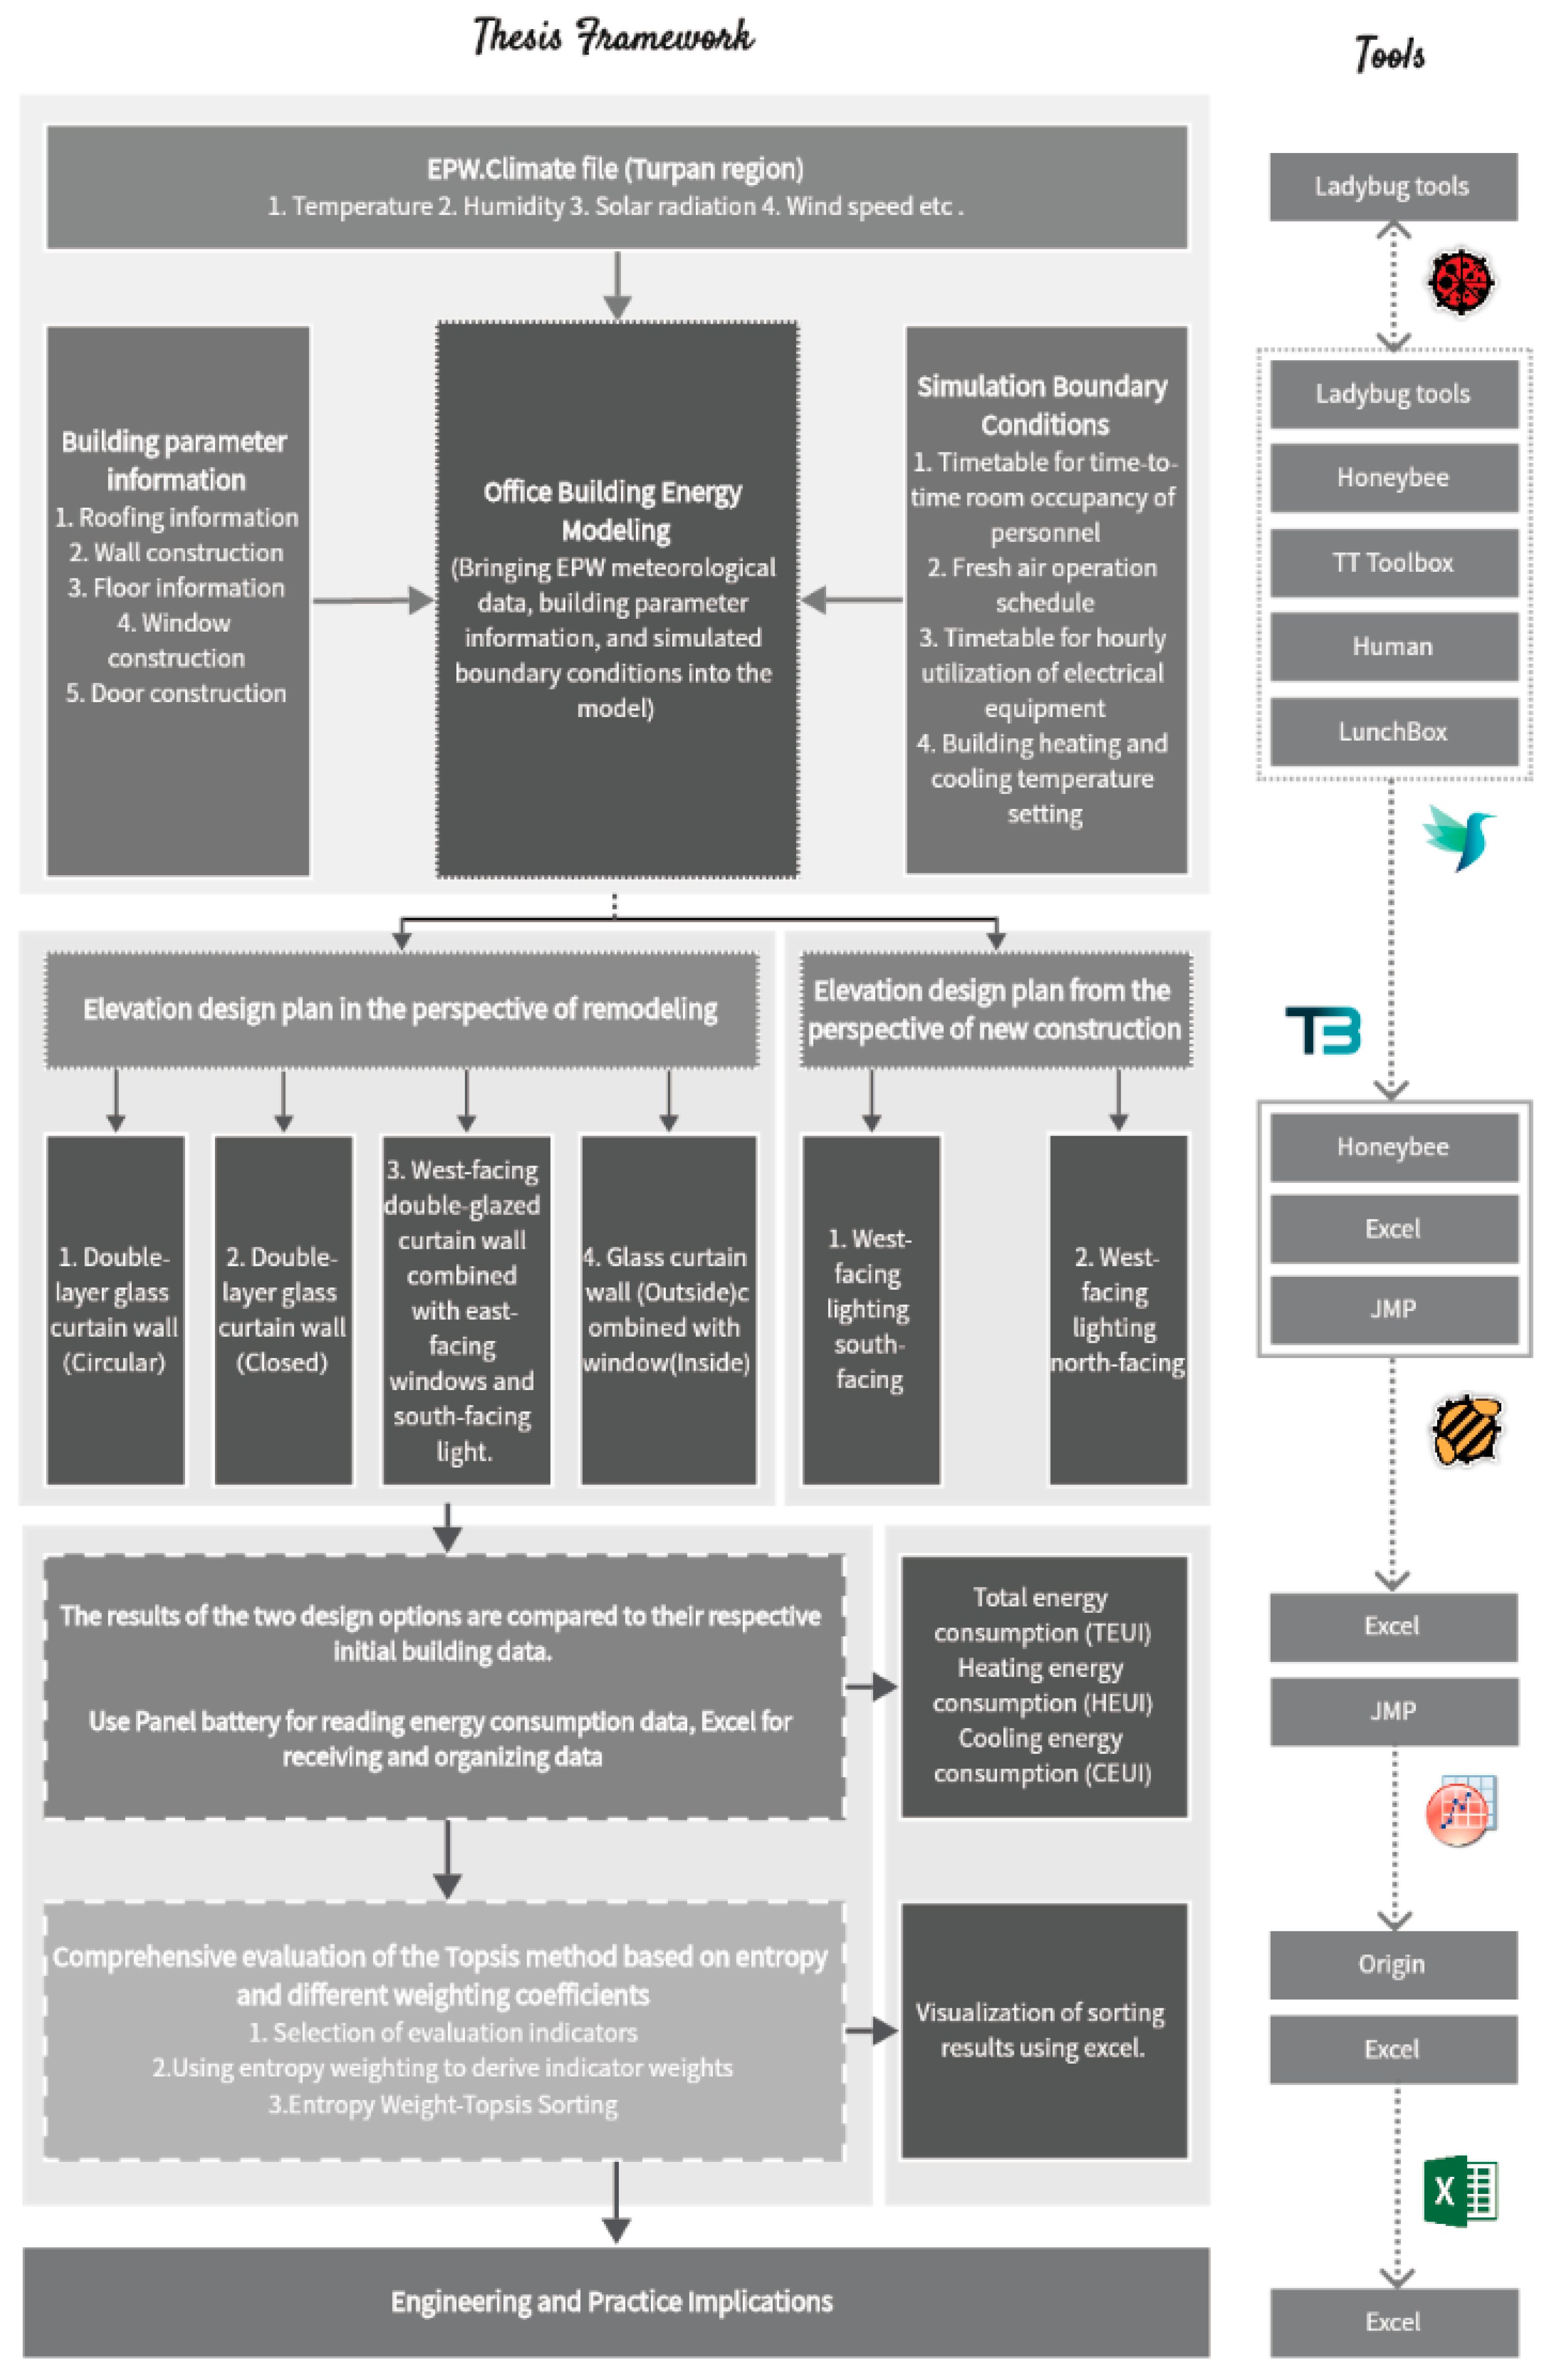
3.3. Research Framework
4. Energy Consumption Simulation Analysis
4.1. Simulation Tools
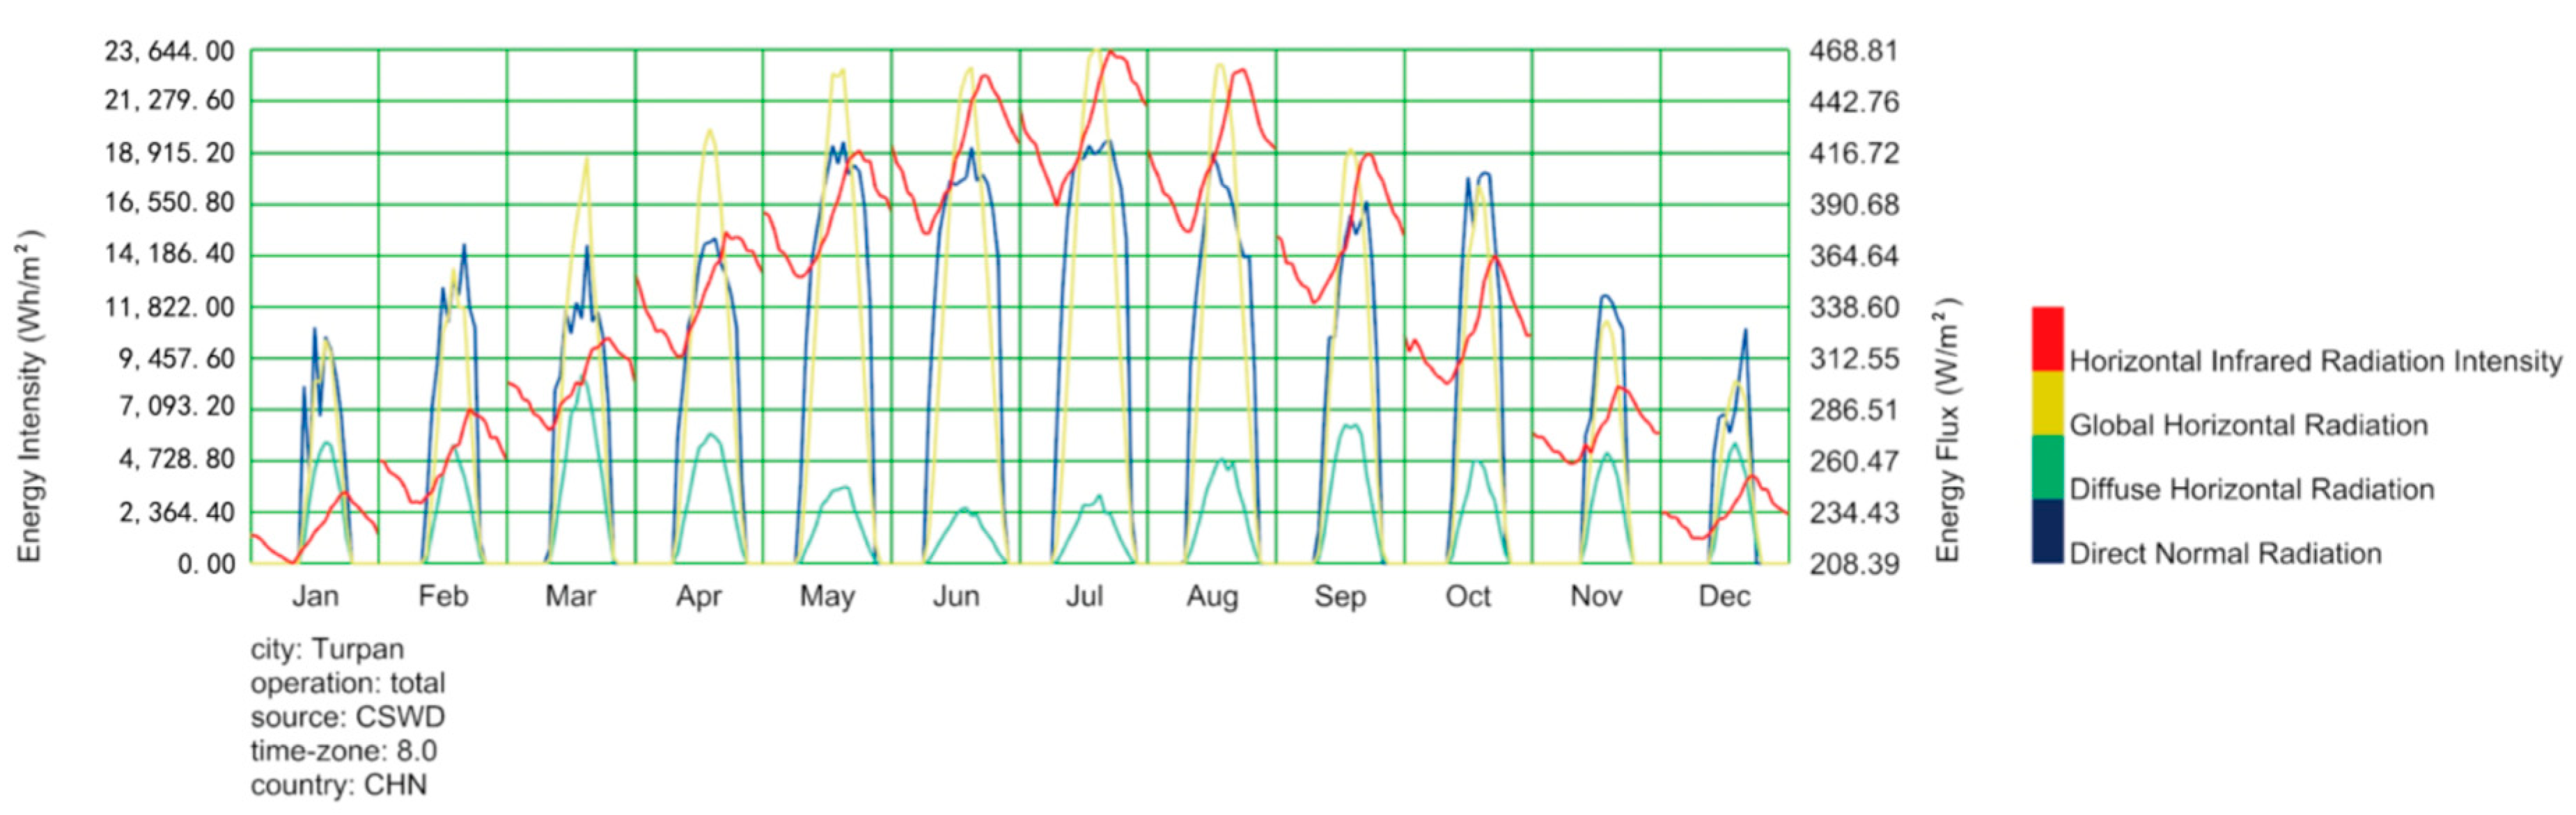
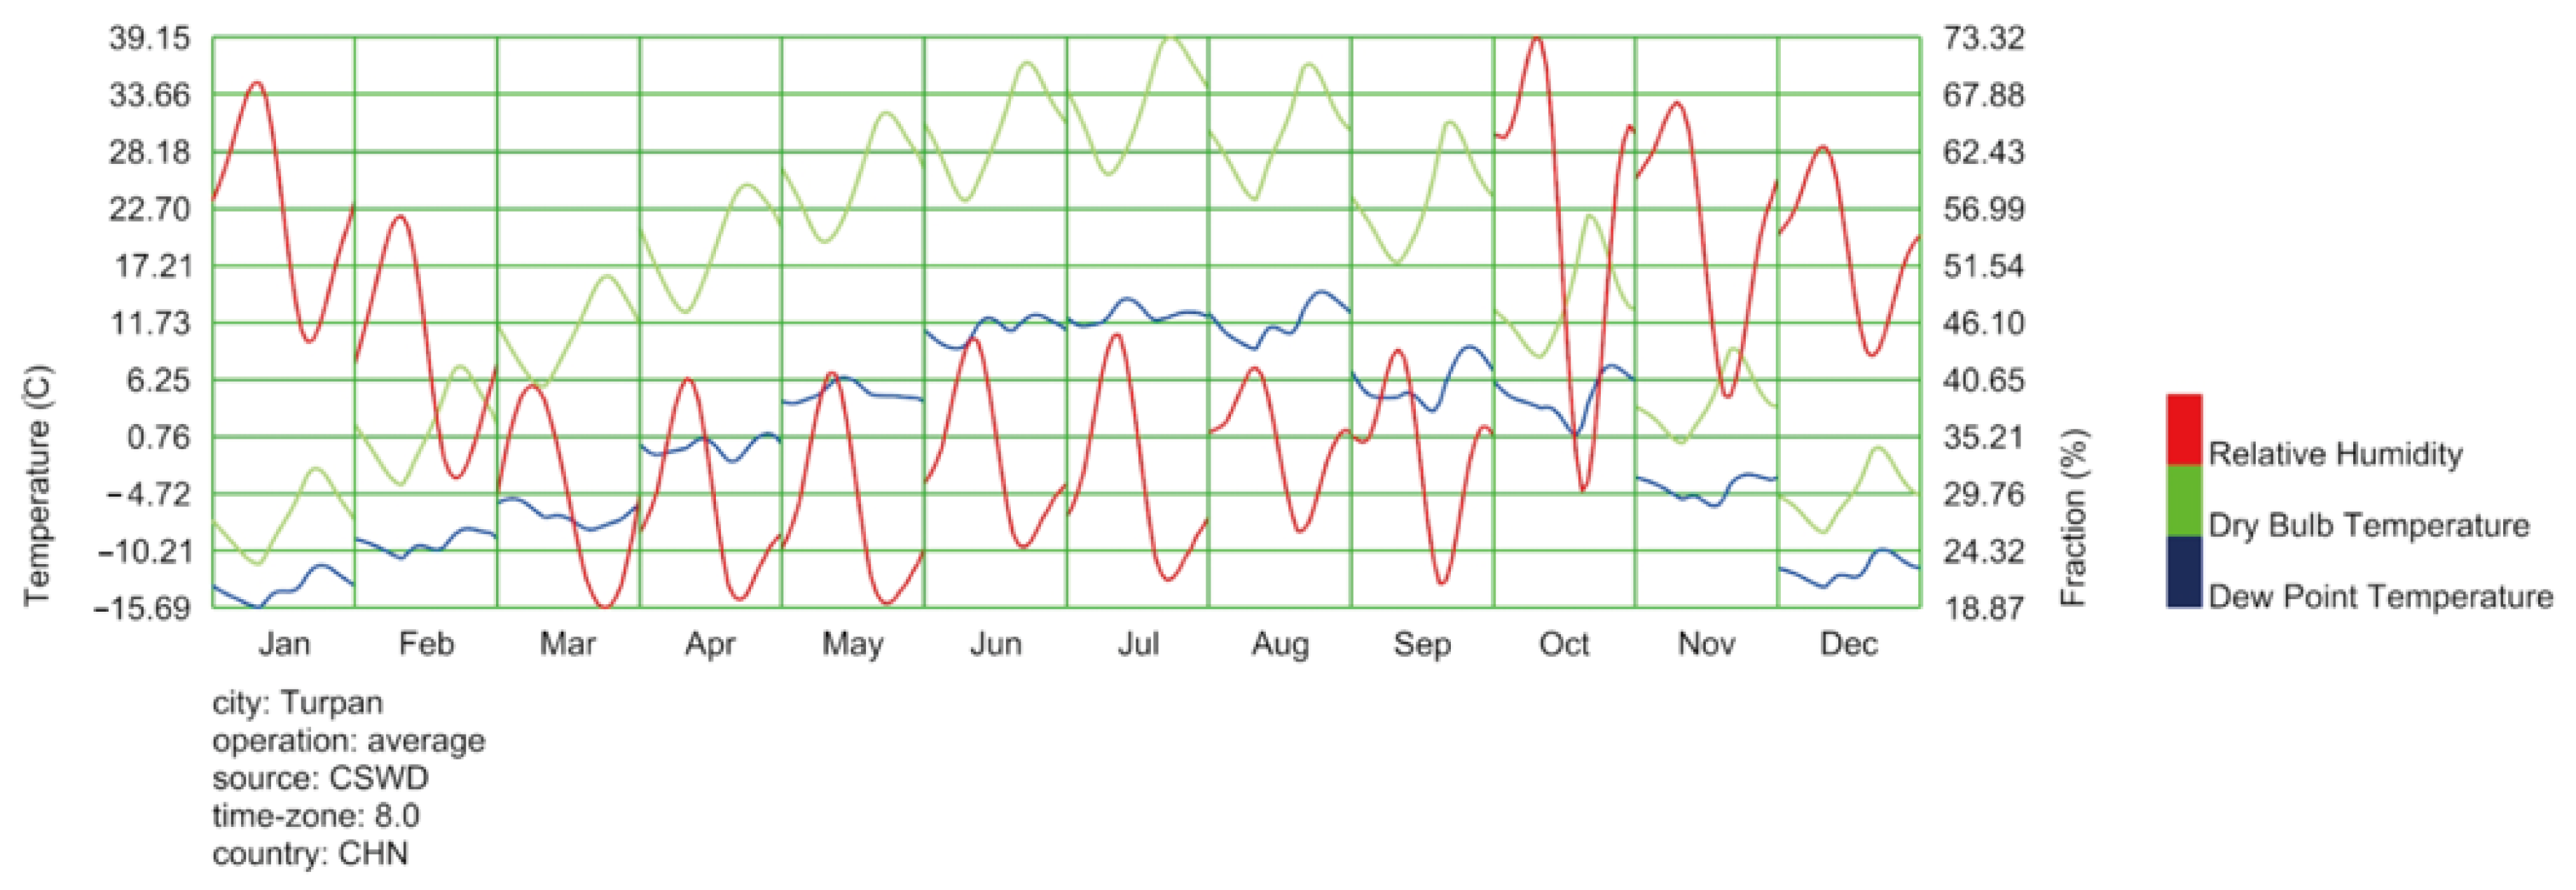
4.2. Establishment of Climate Data and Simulation Sites
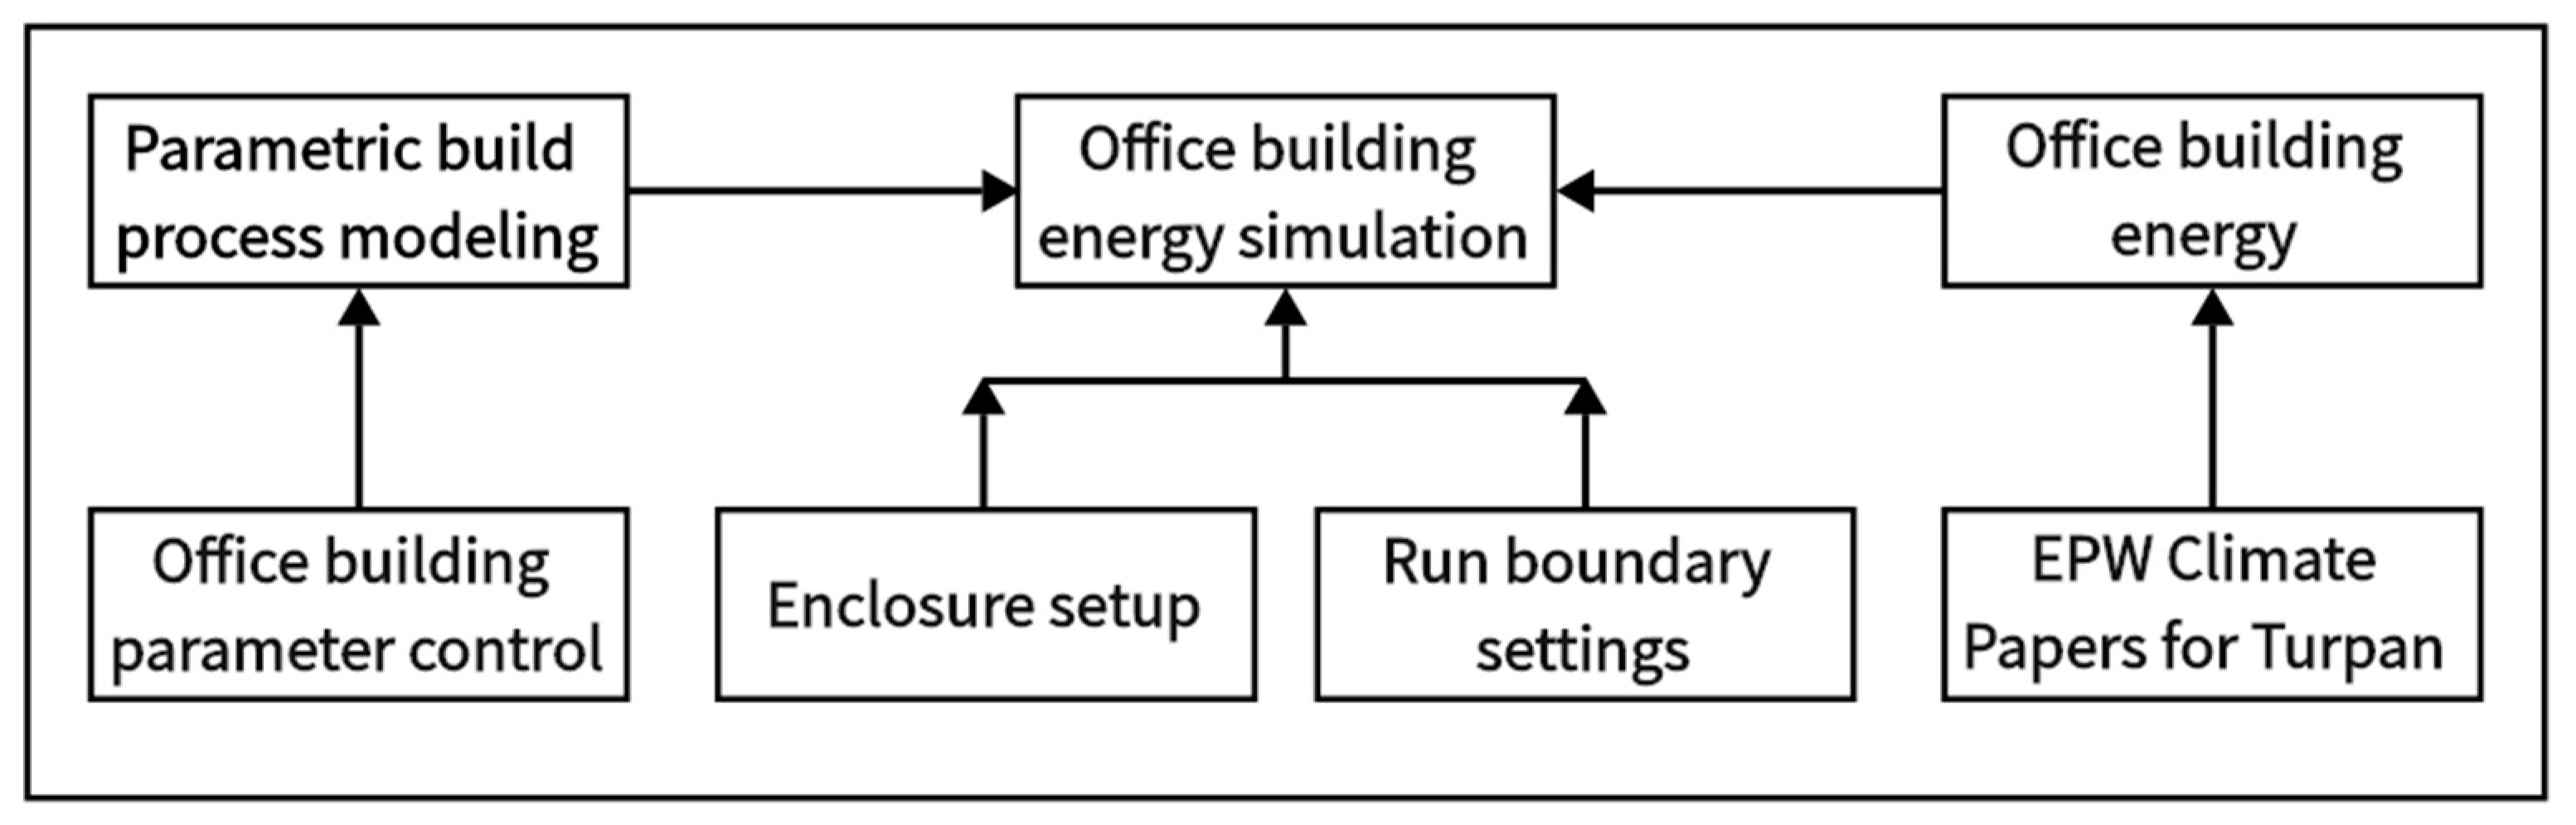
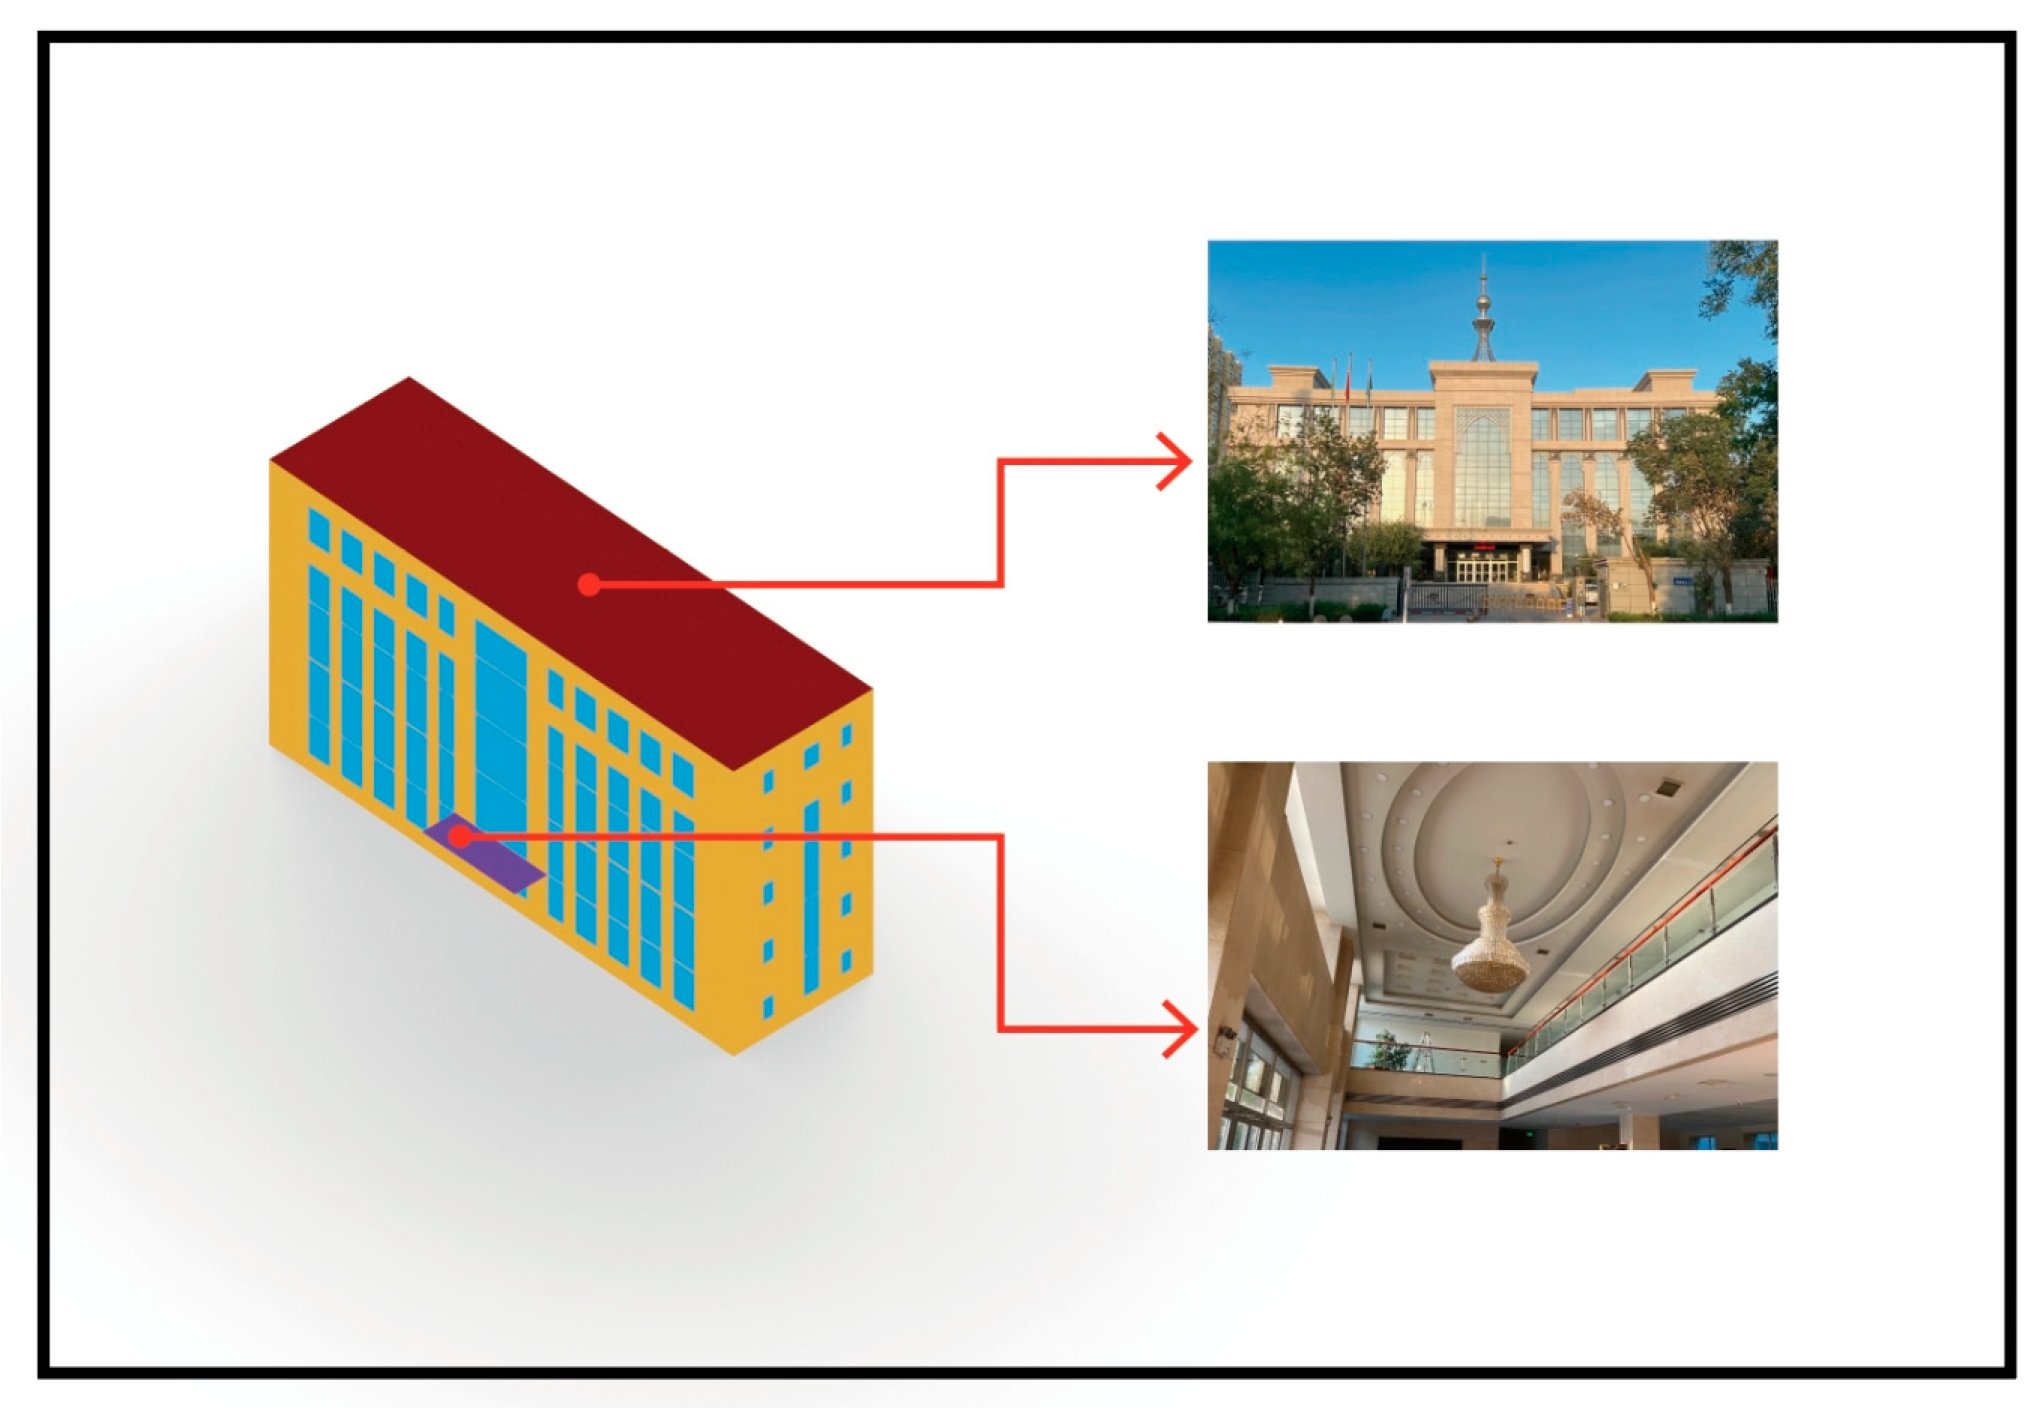
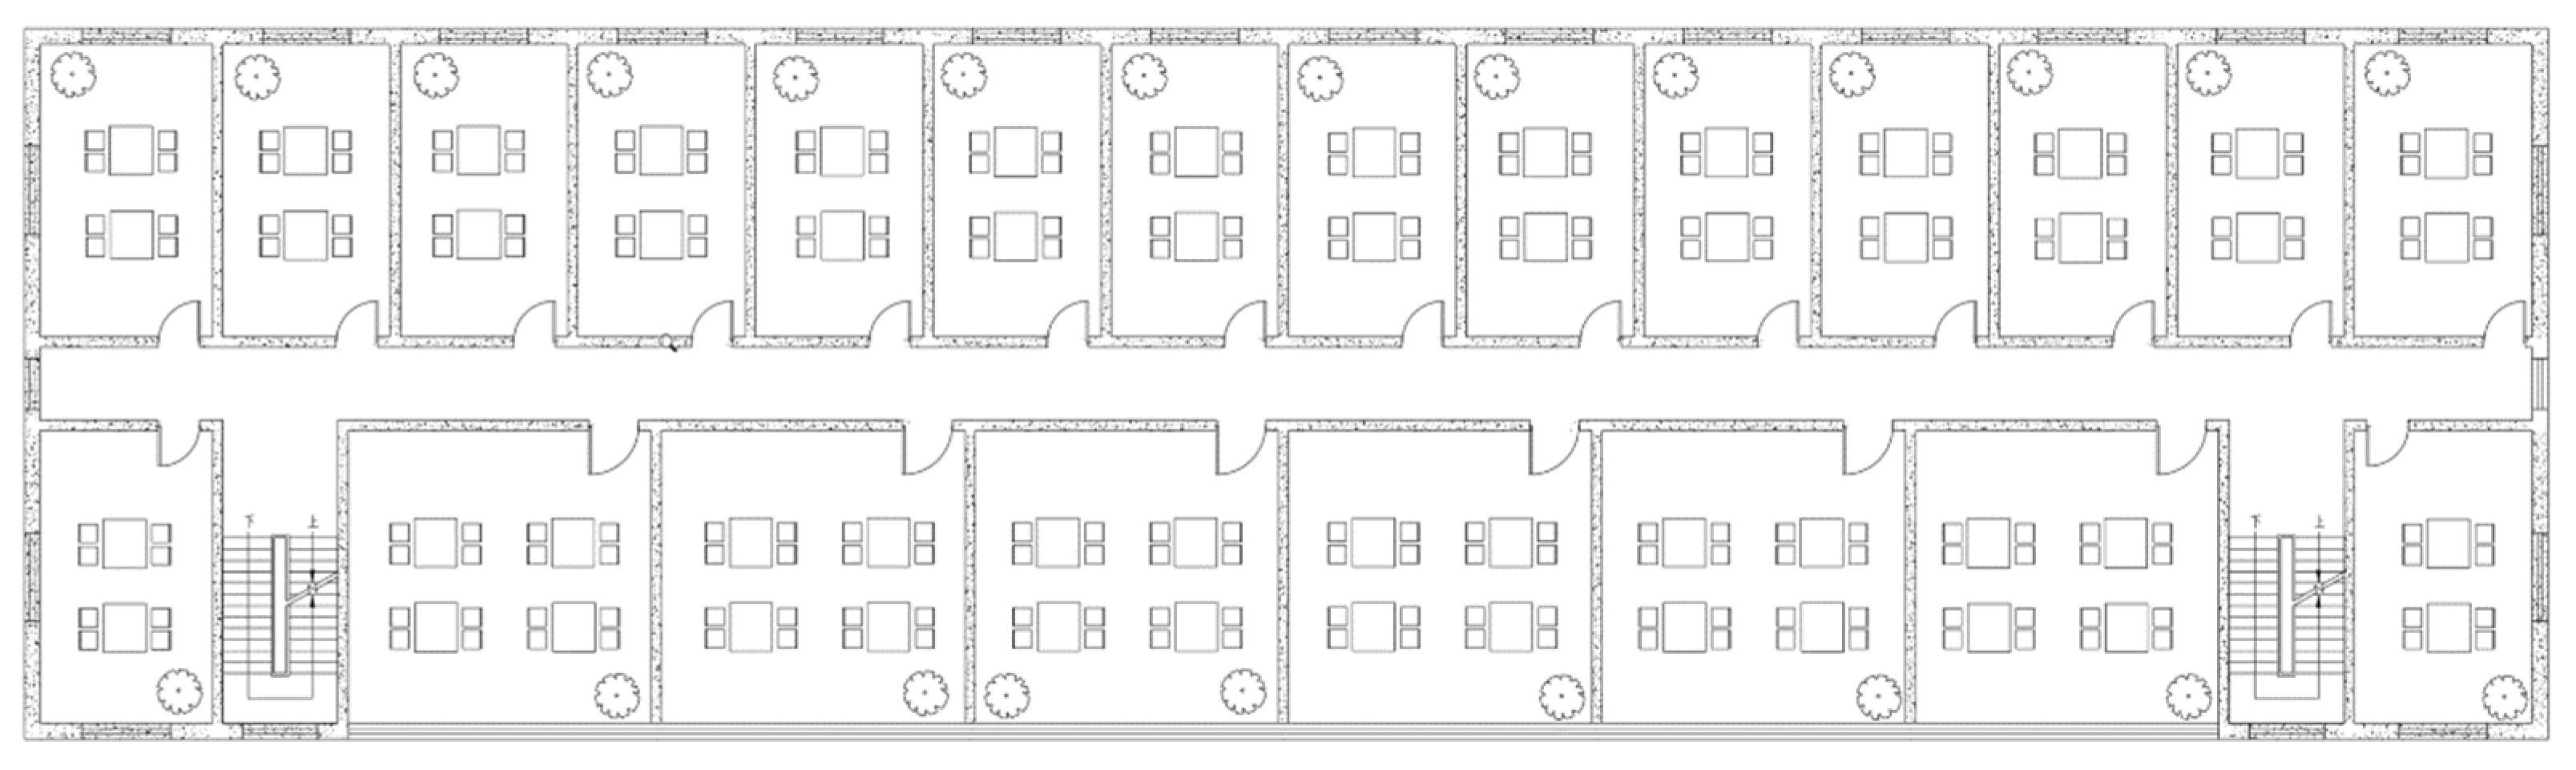
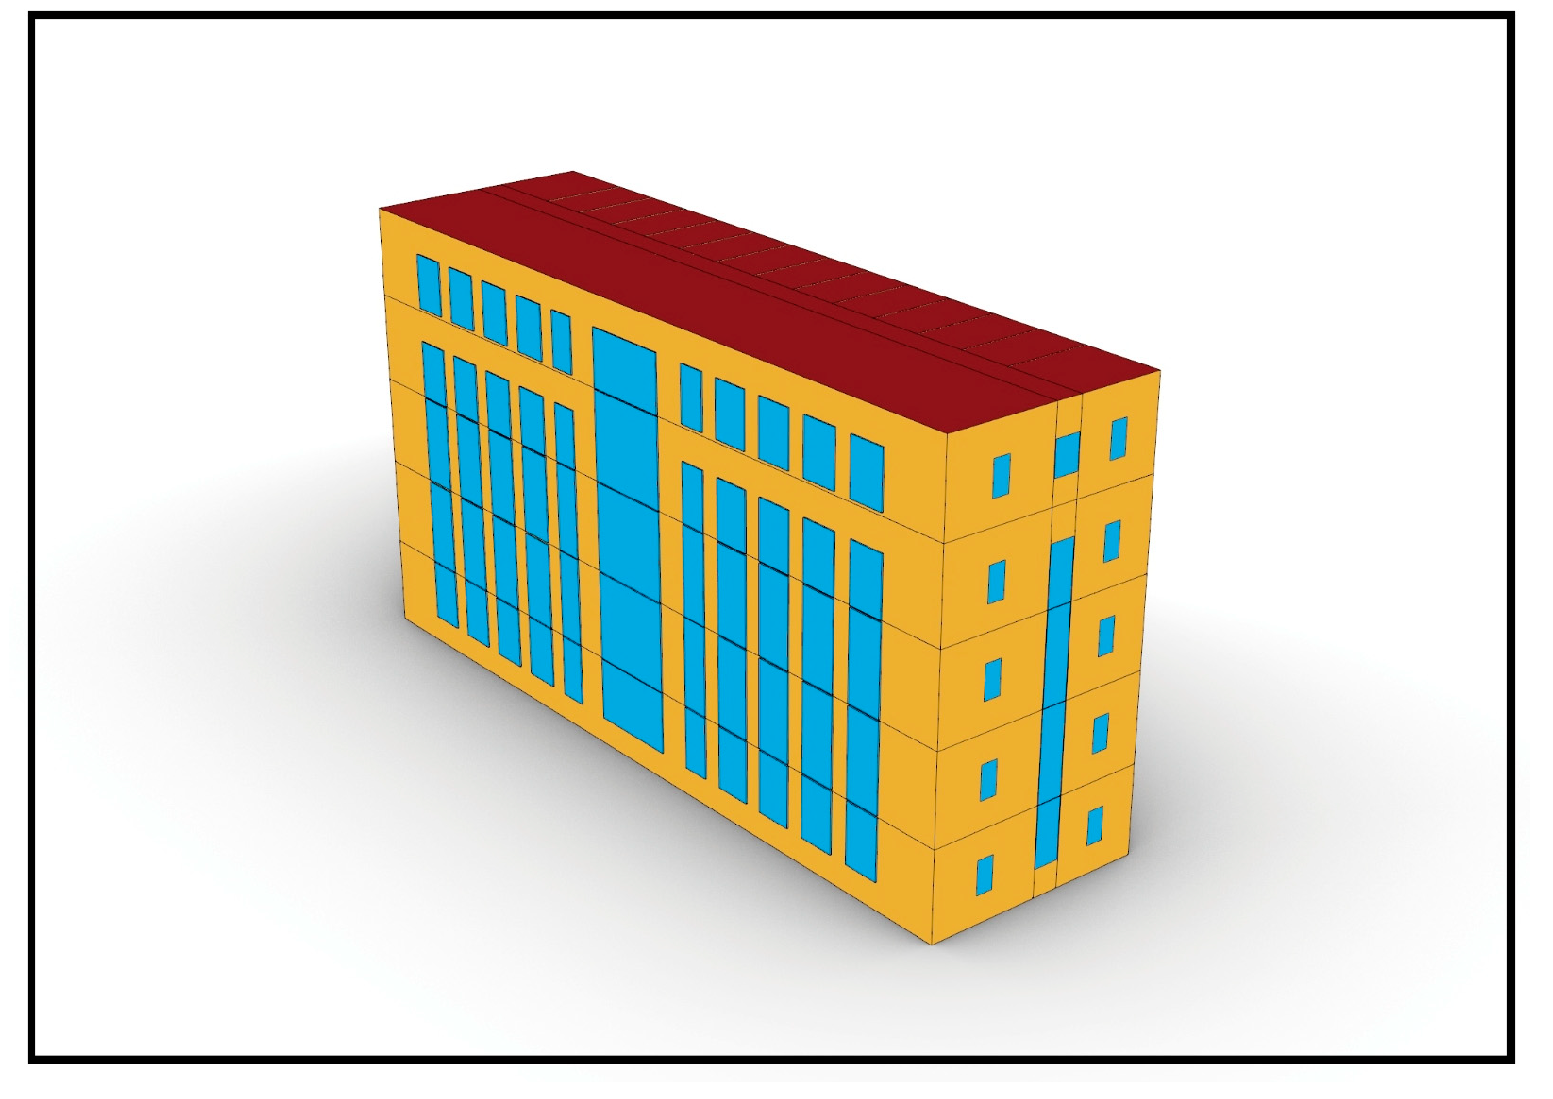
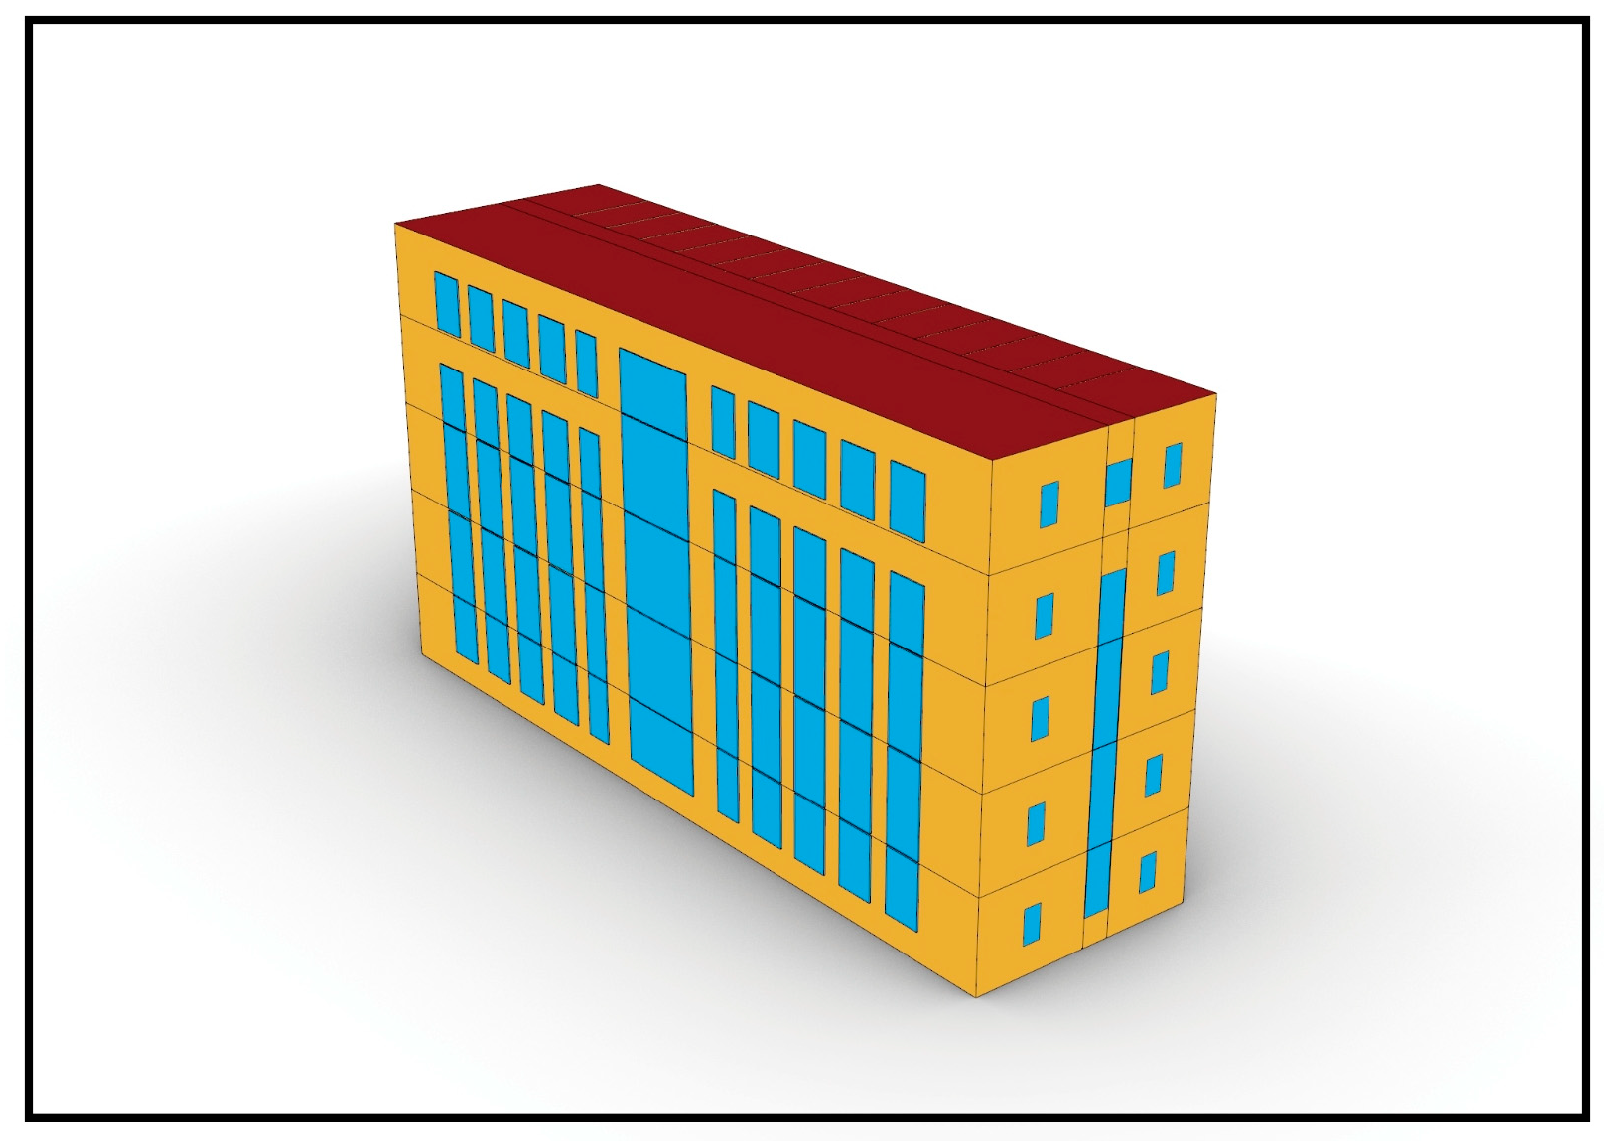
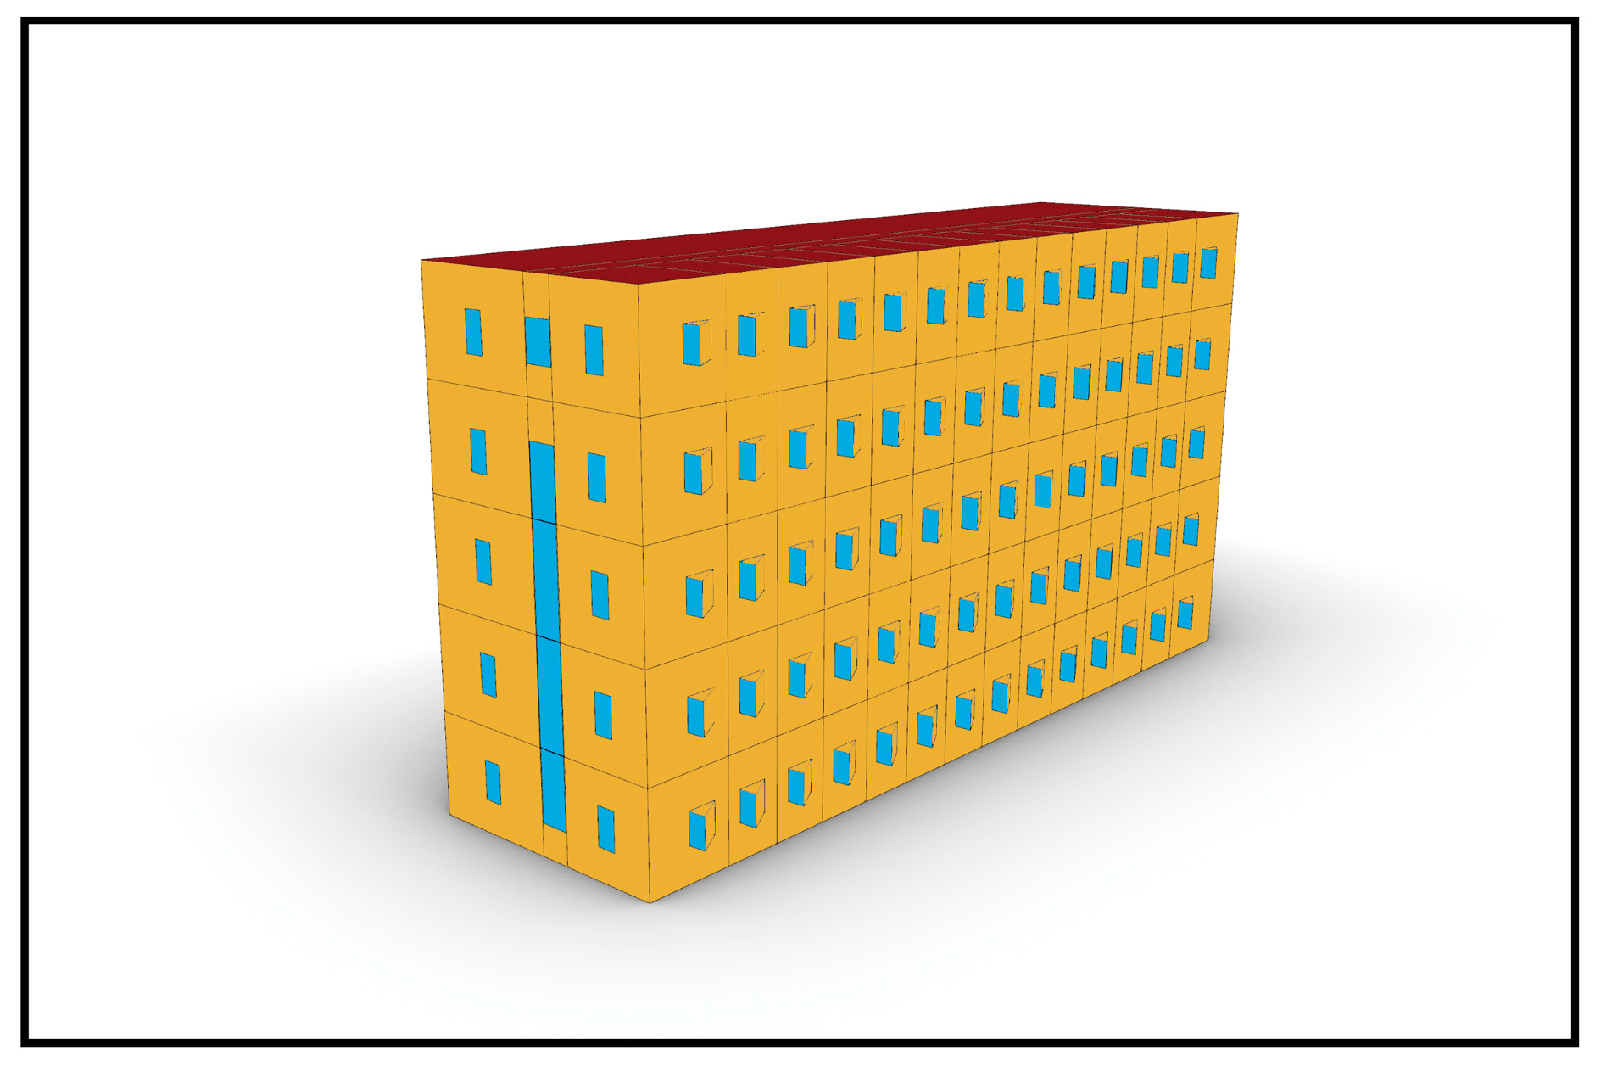
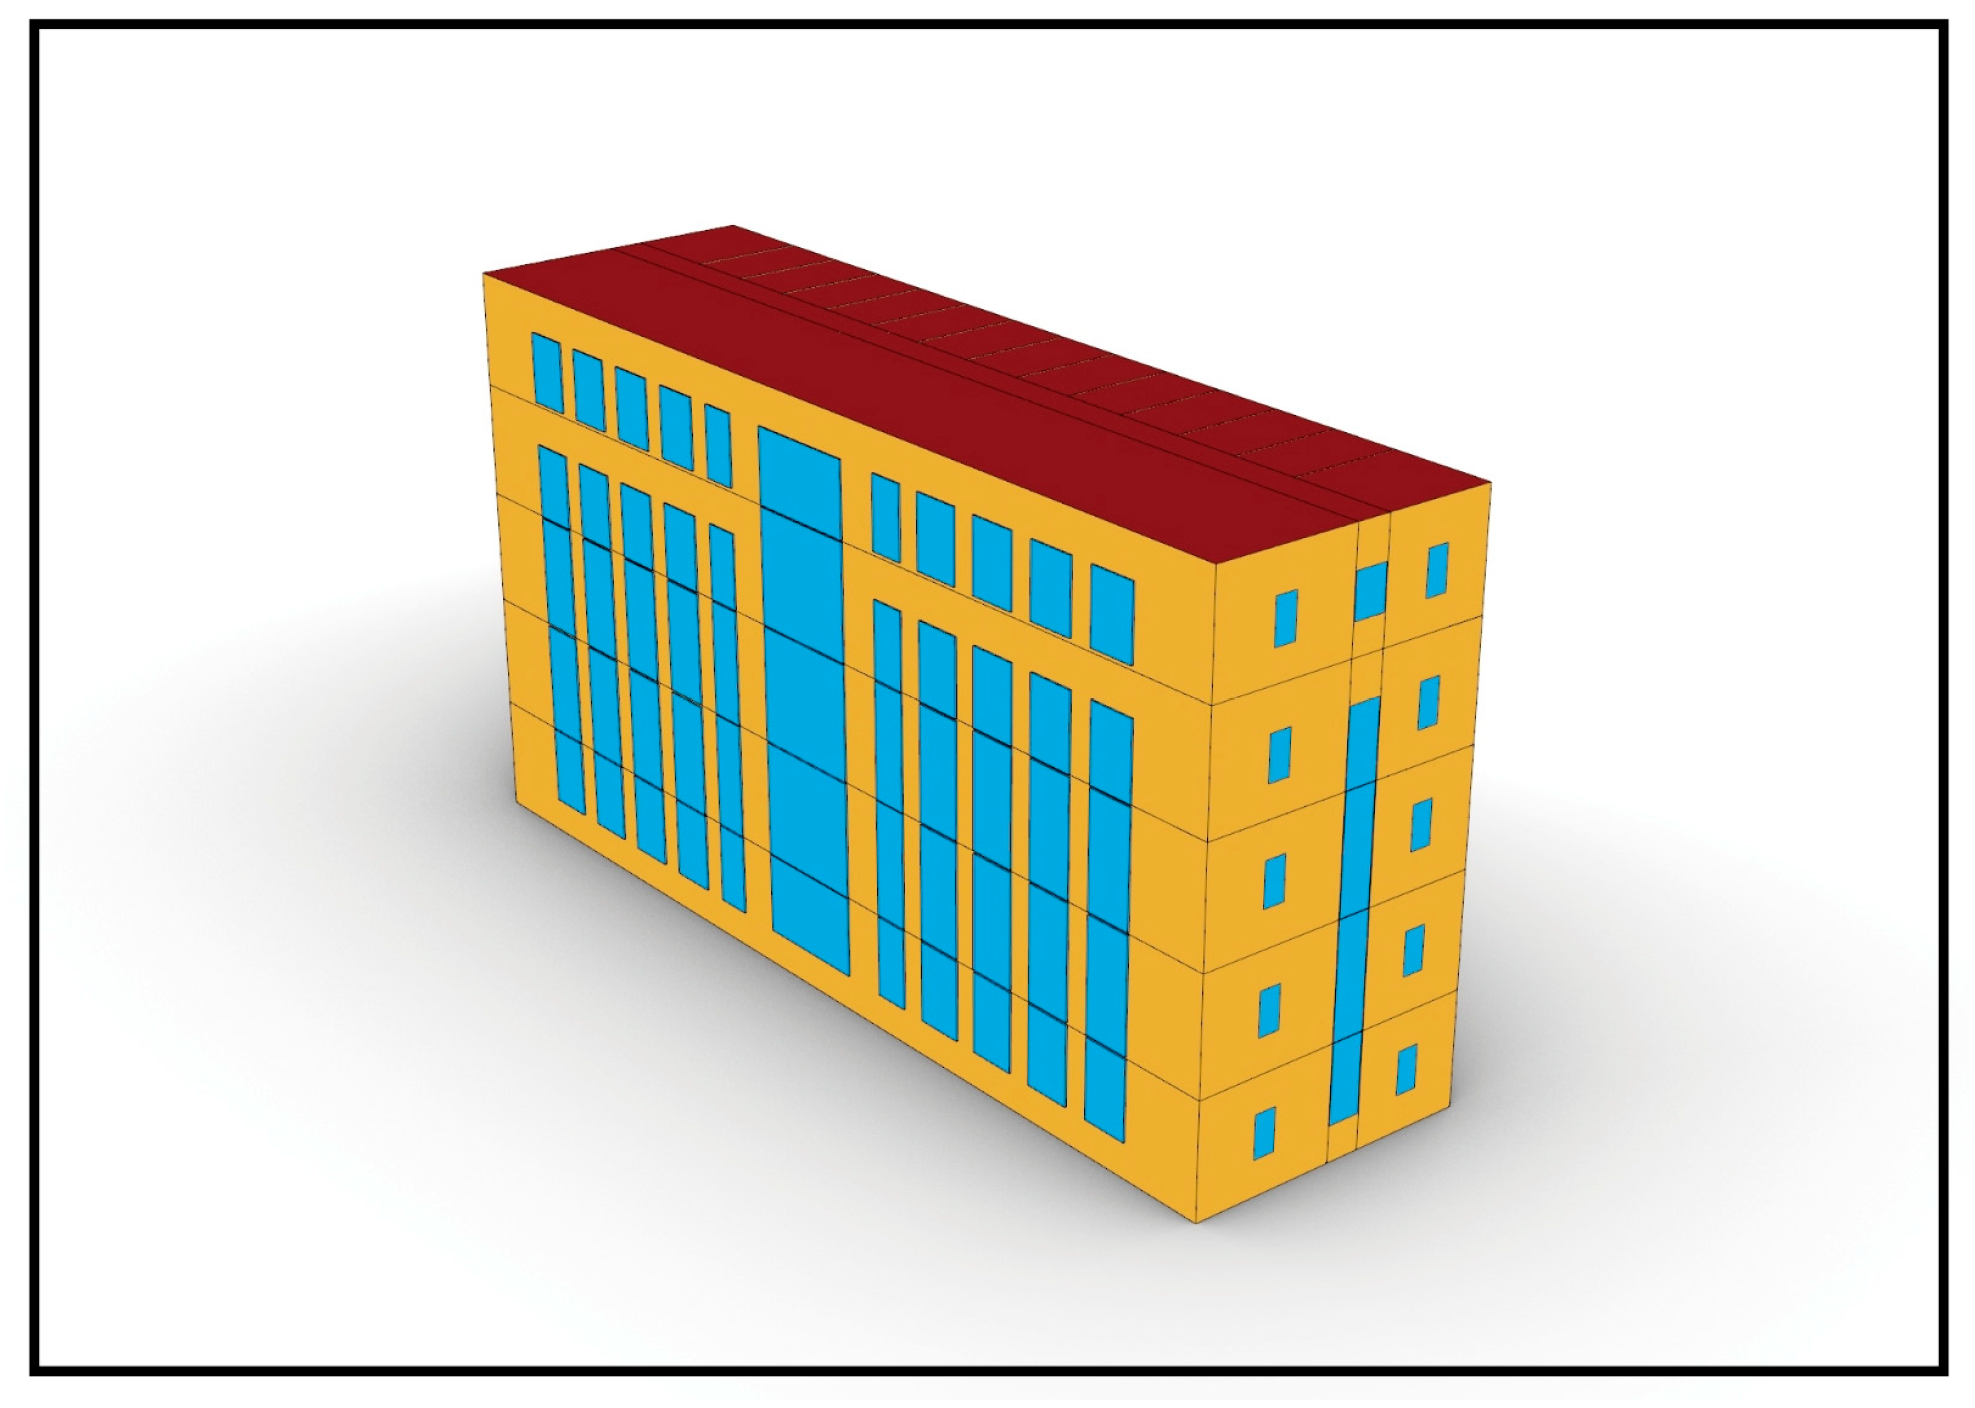
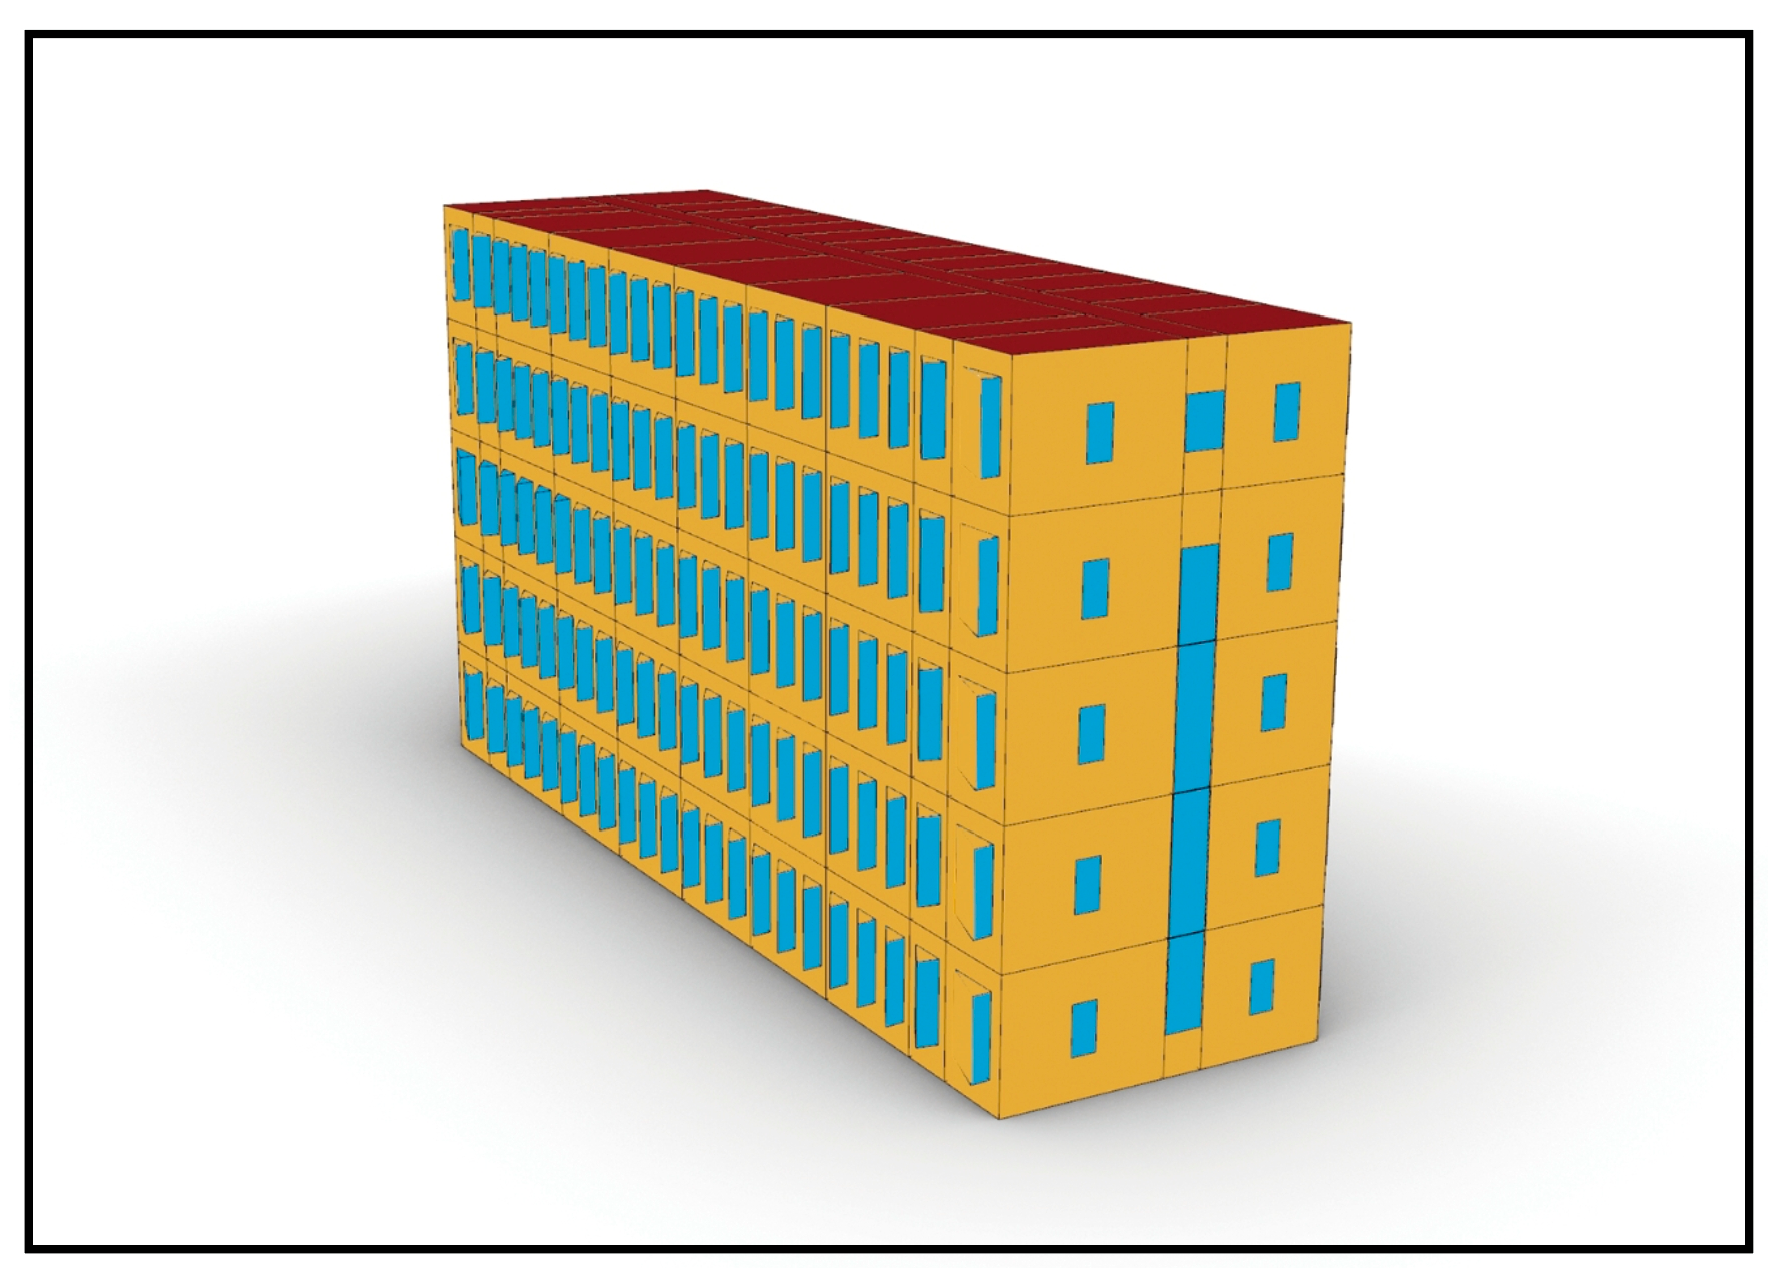
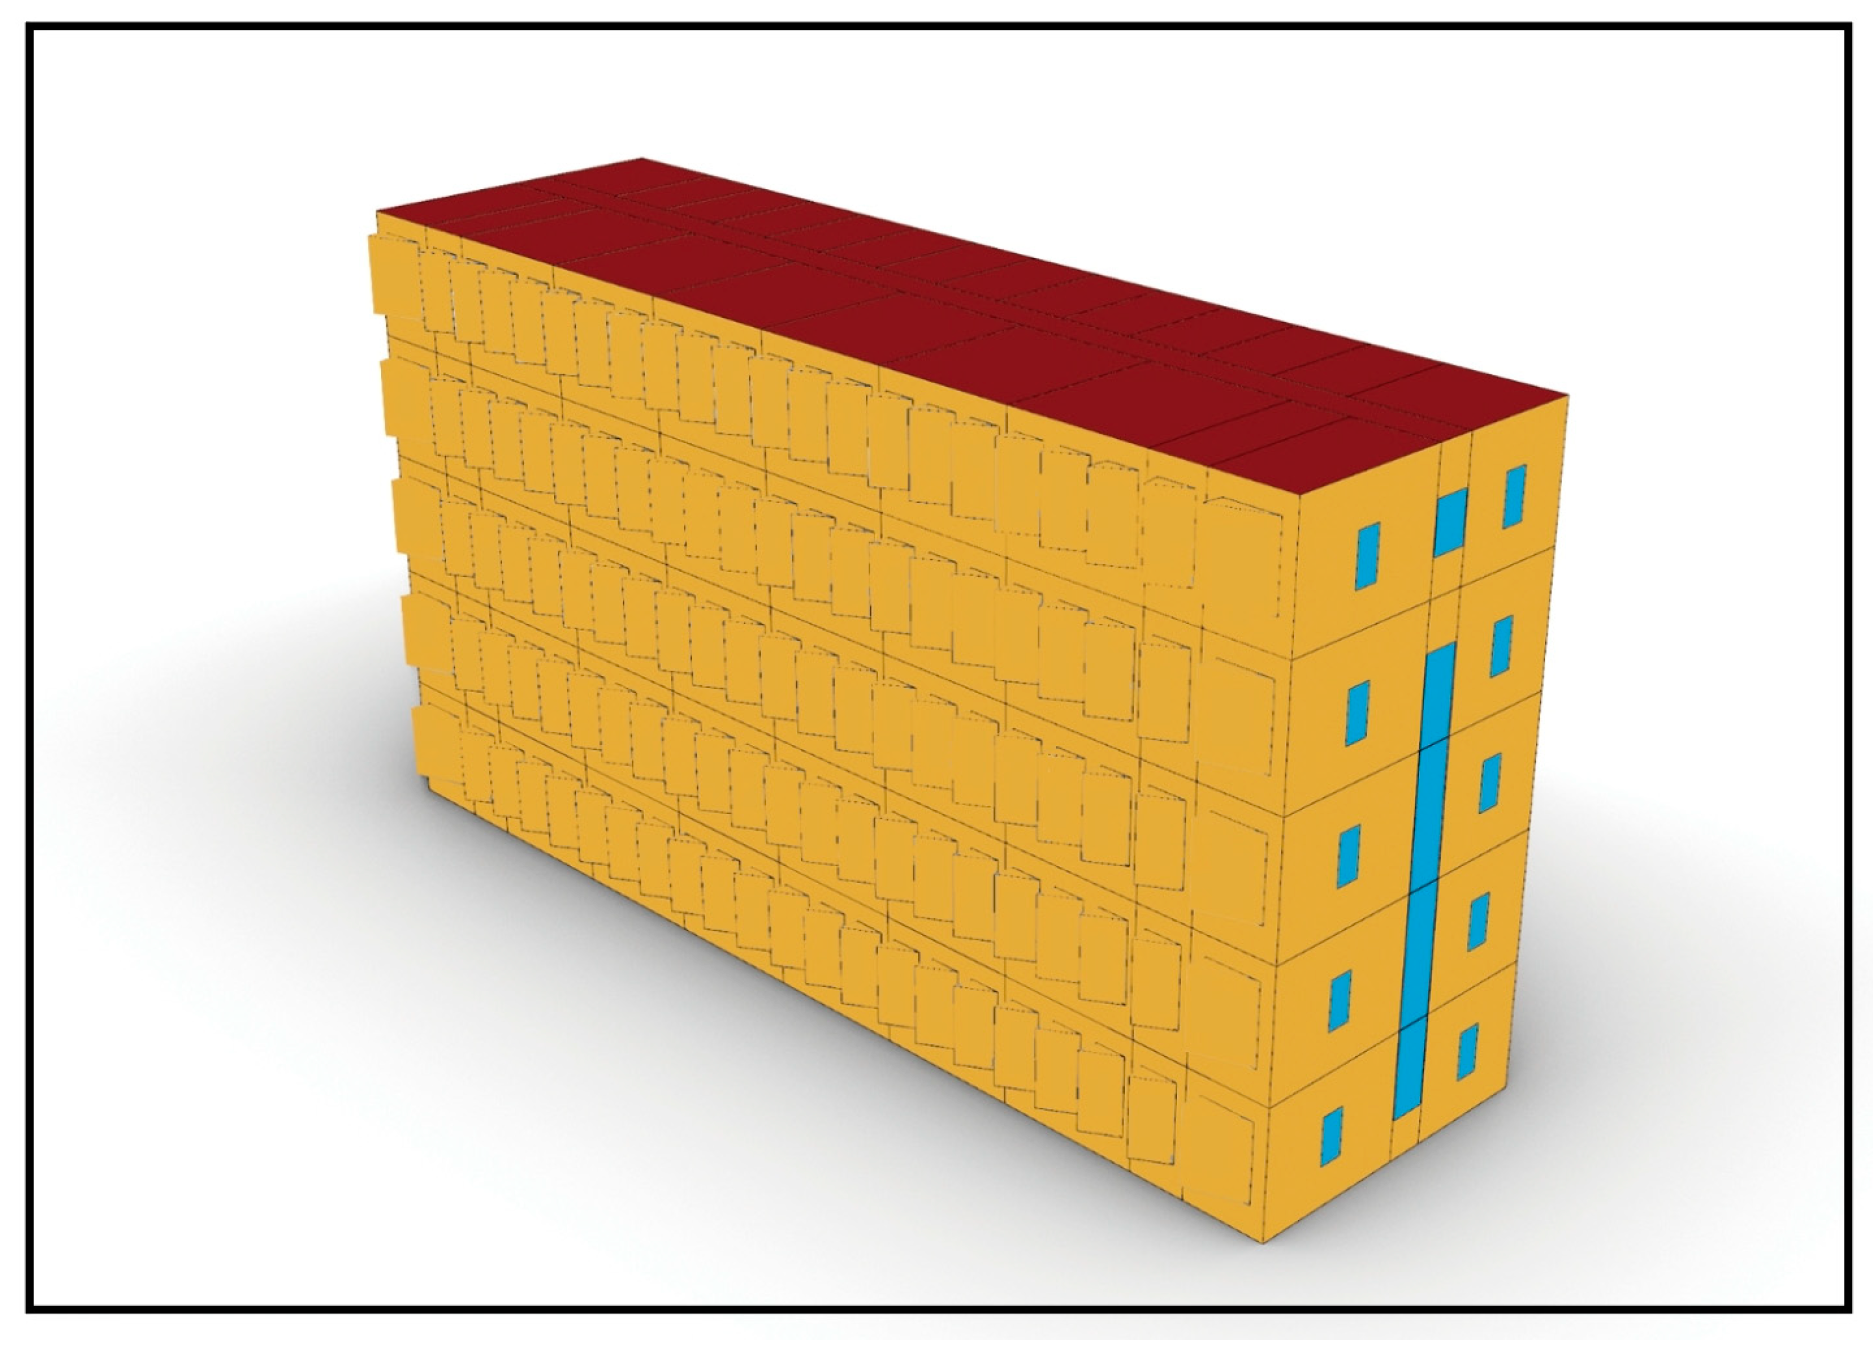
4.3. Construction of the Model
- (1)
- Setting of boundary conditions.
- (2)
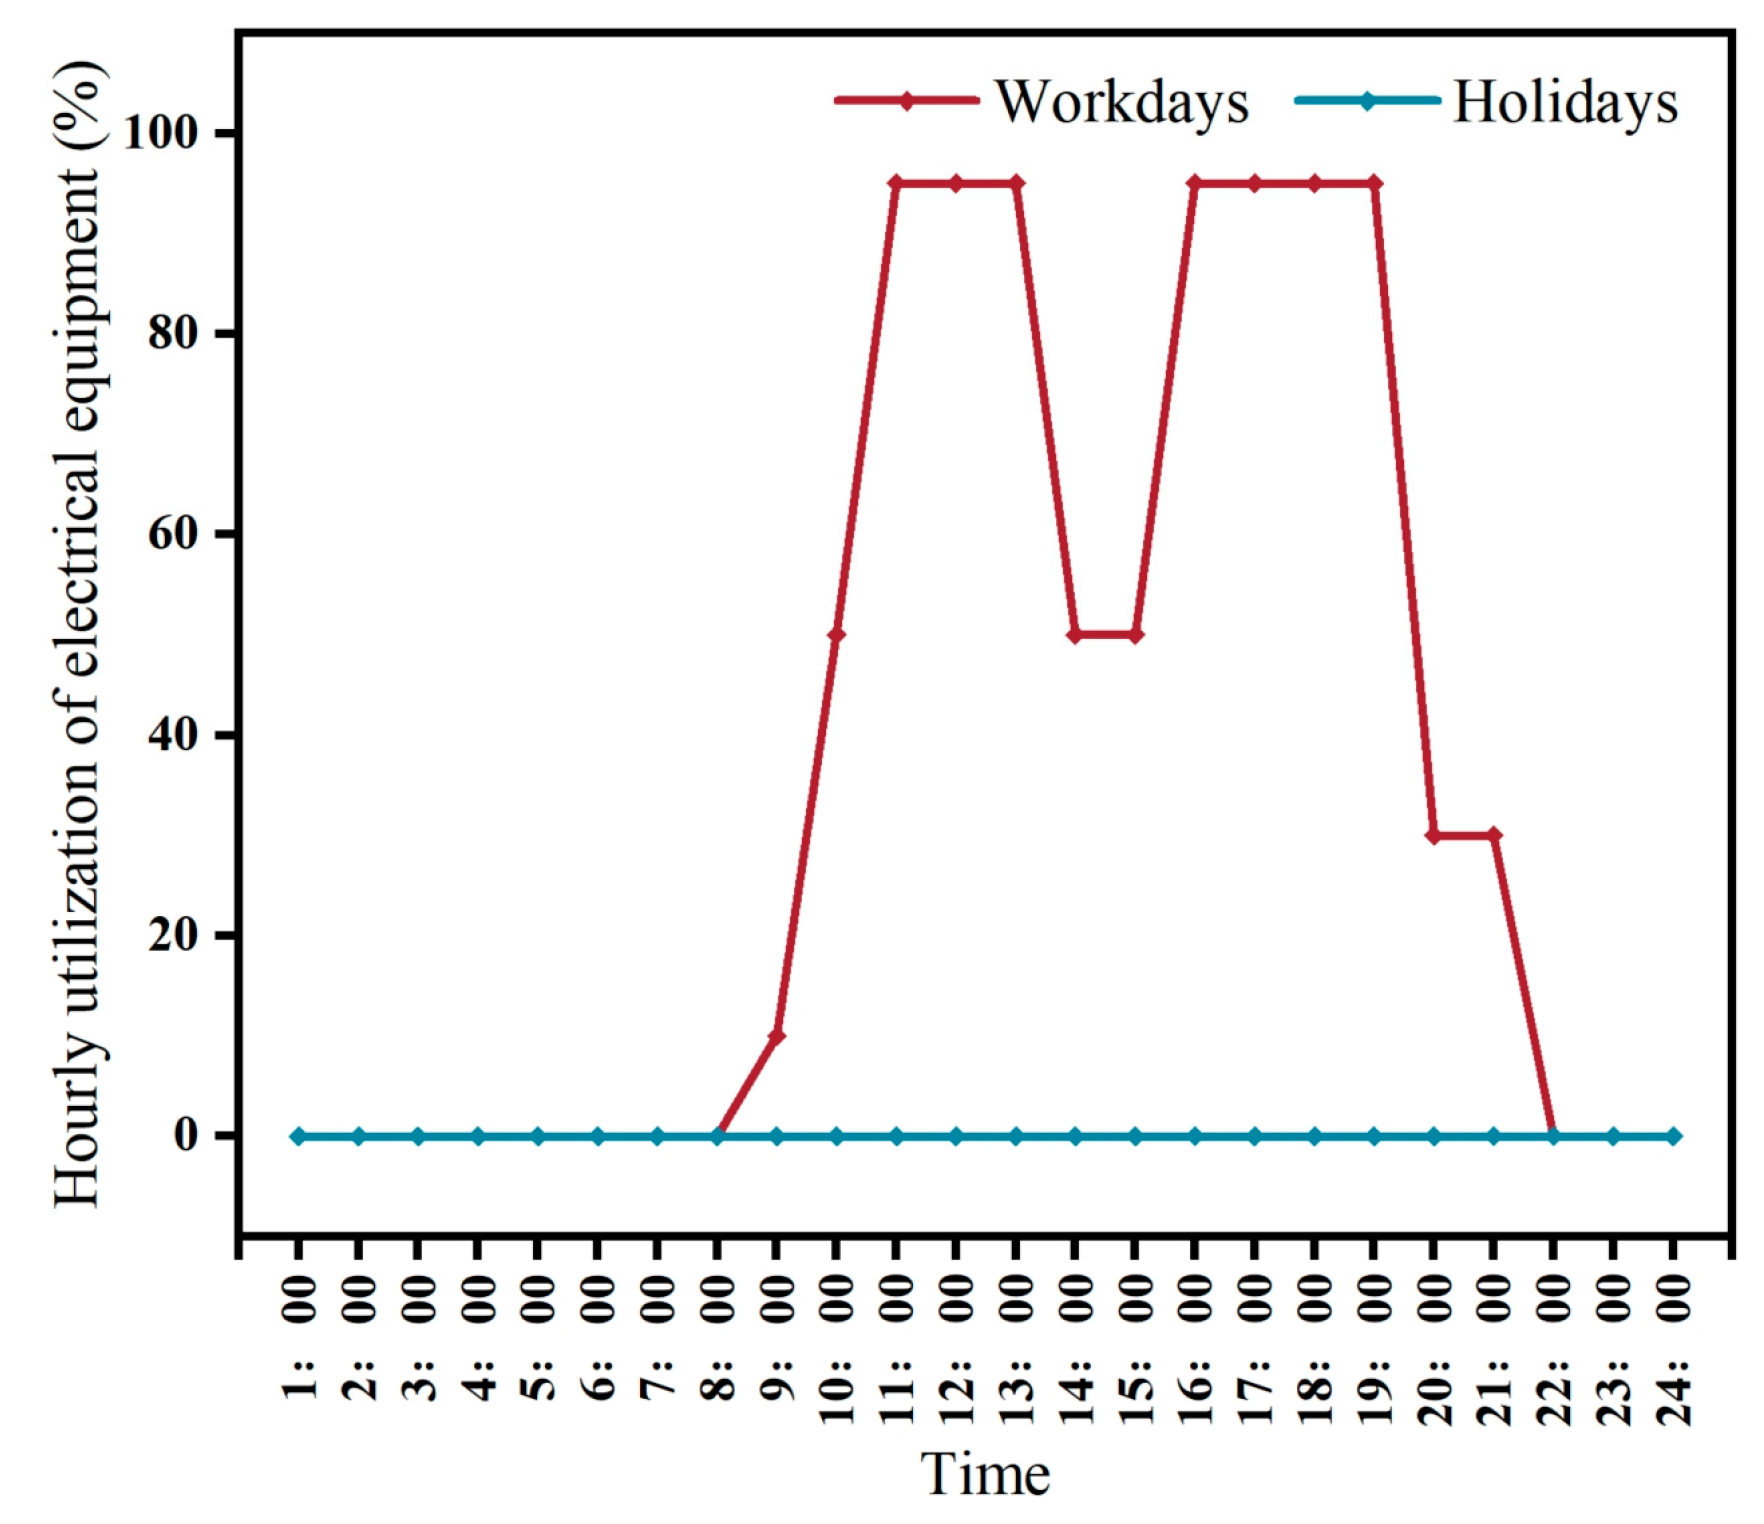
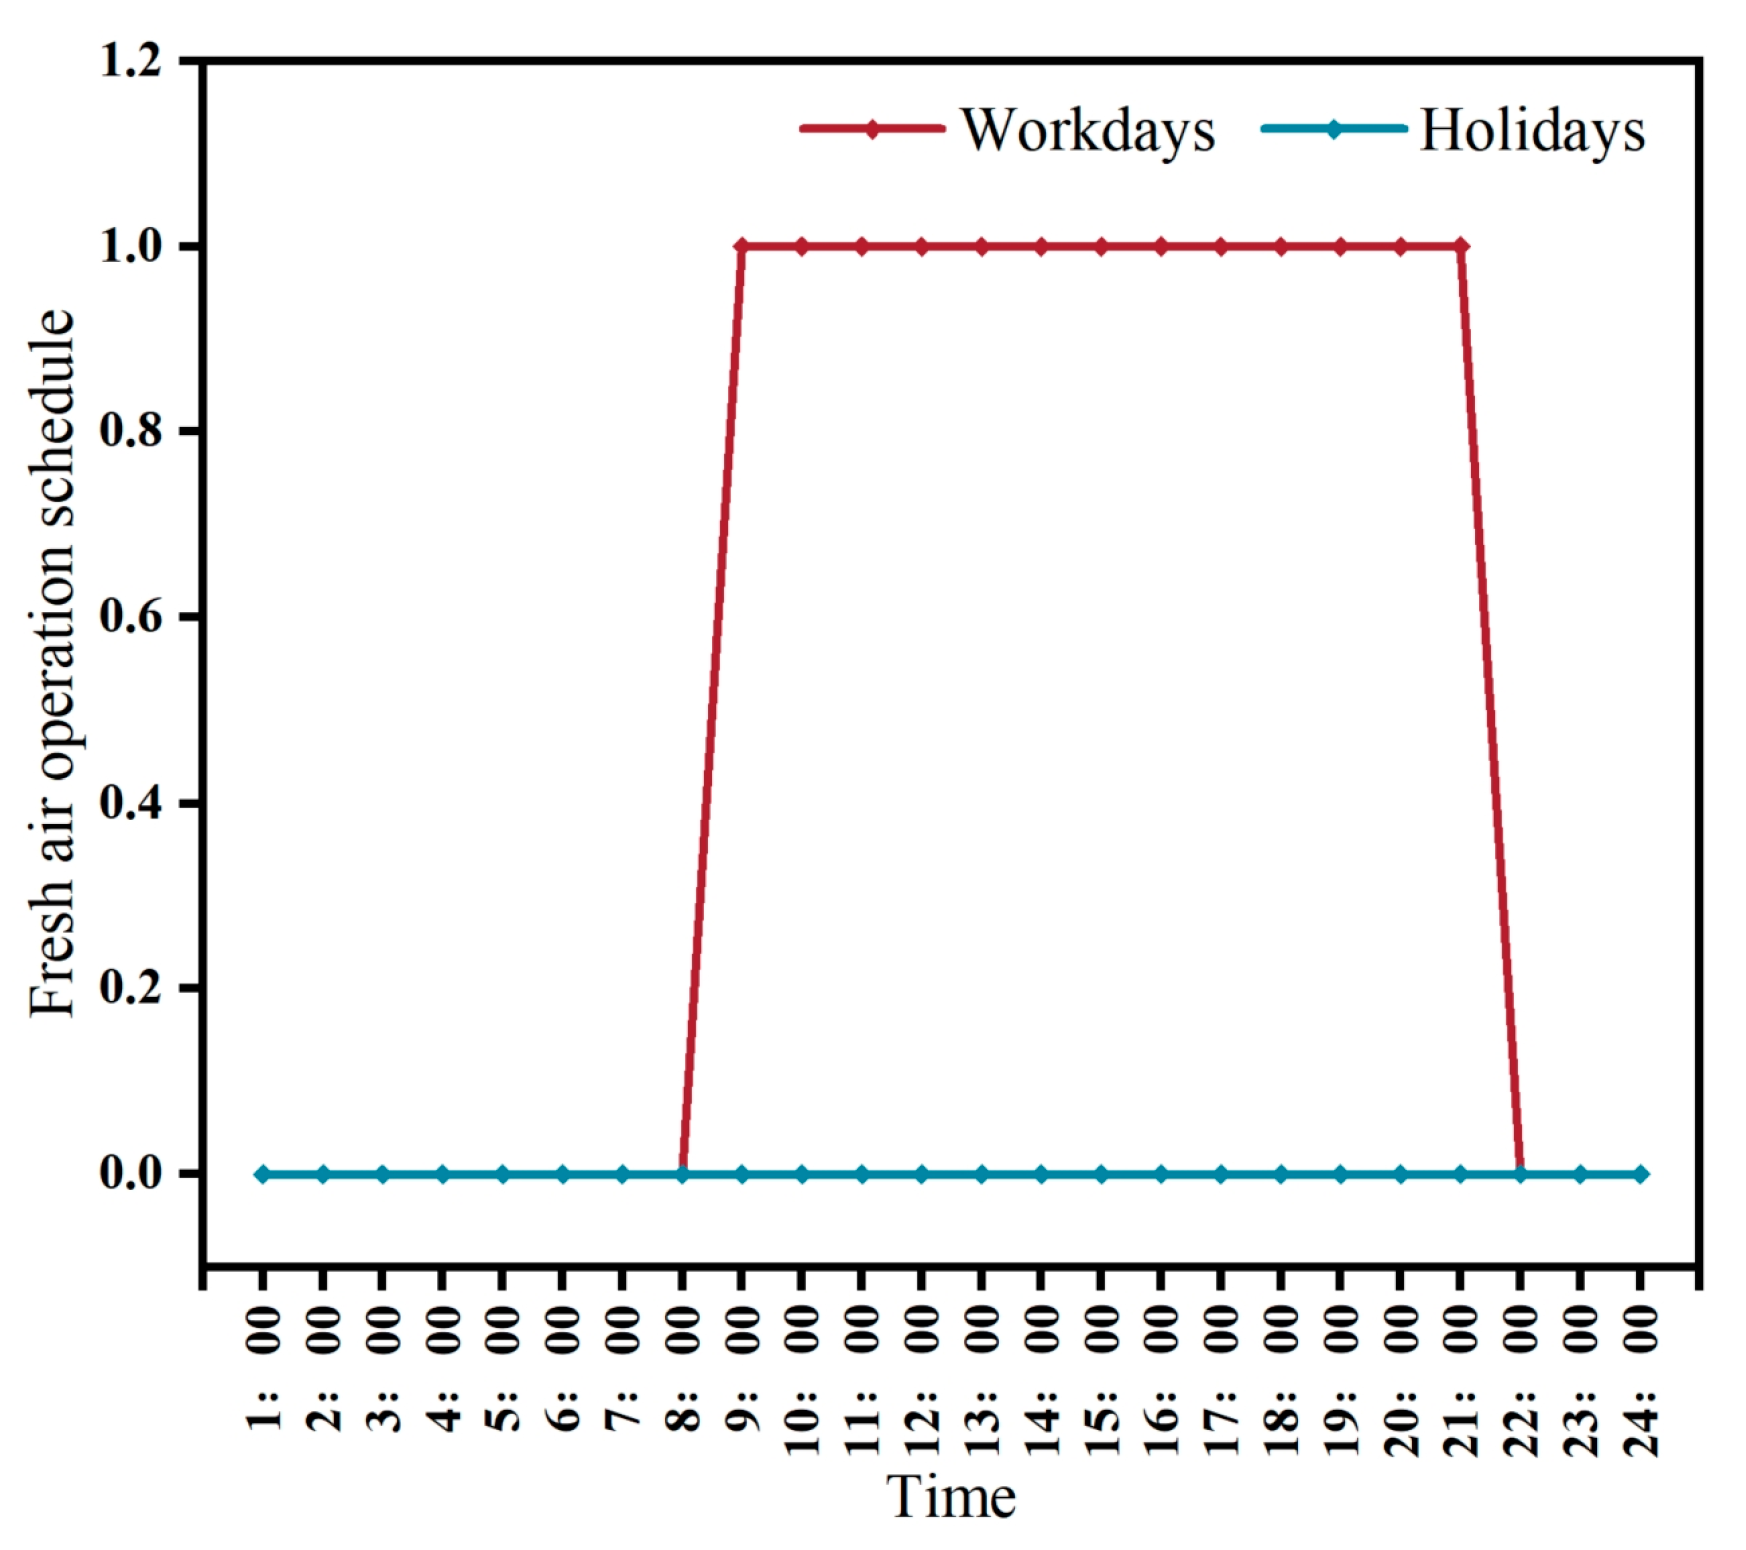
- Setting of other conditions.
5. Analysis of Simulation Data Results
5.1. Study of Energy-Saving Retrofit Strategies for Retrofitting Purposes
5.1.1. Initial Building Control Group
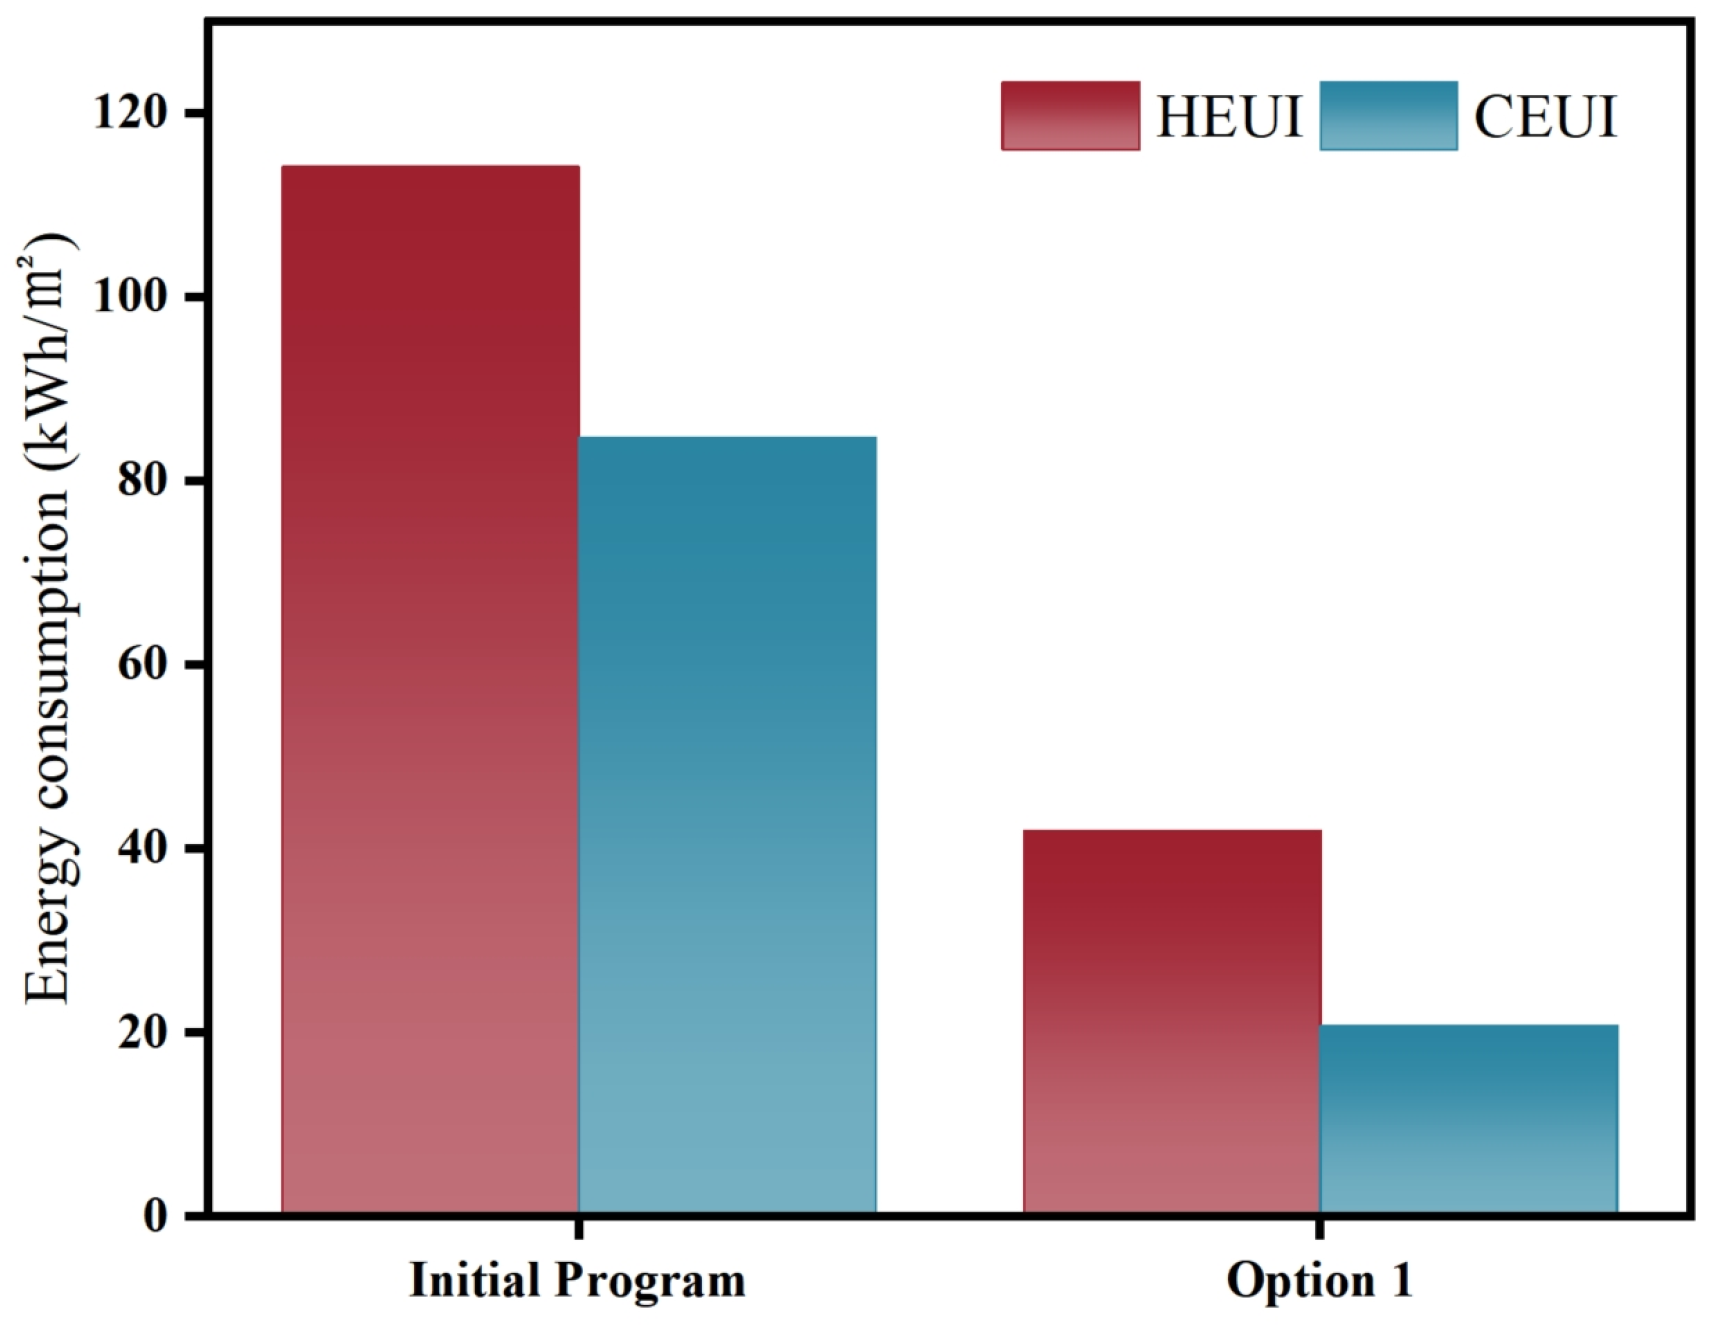
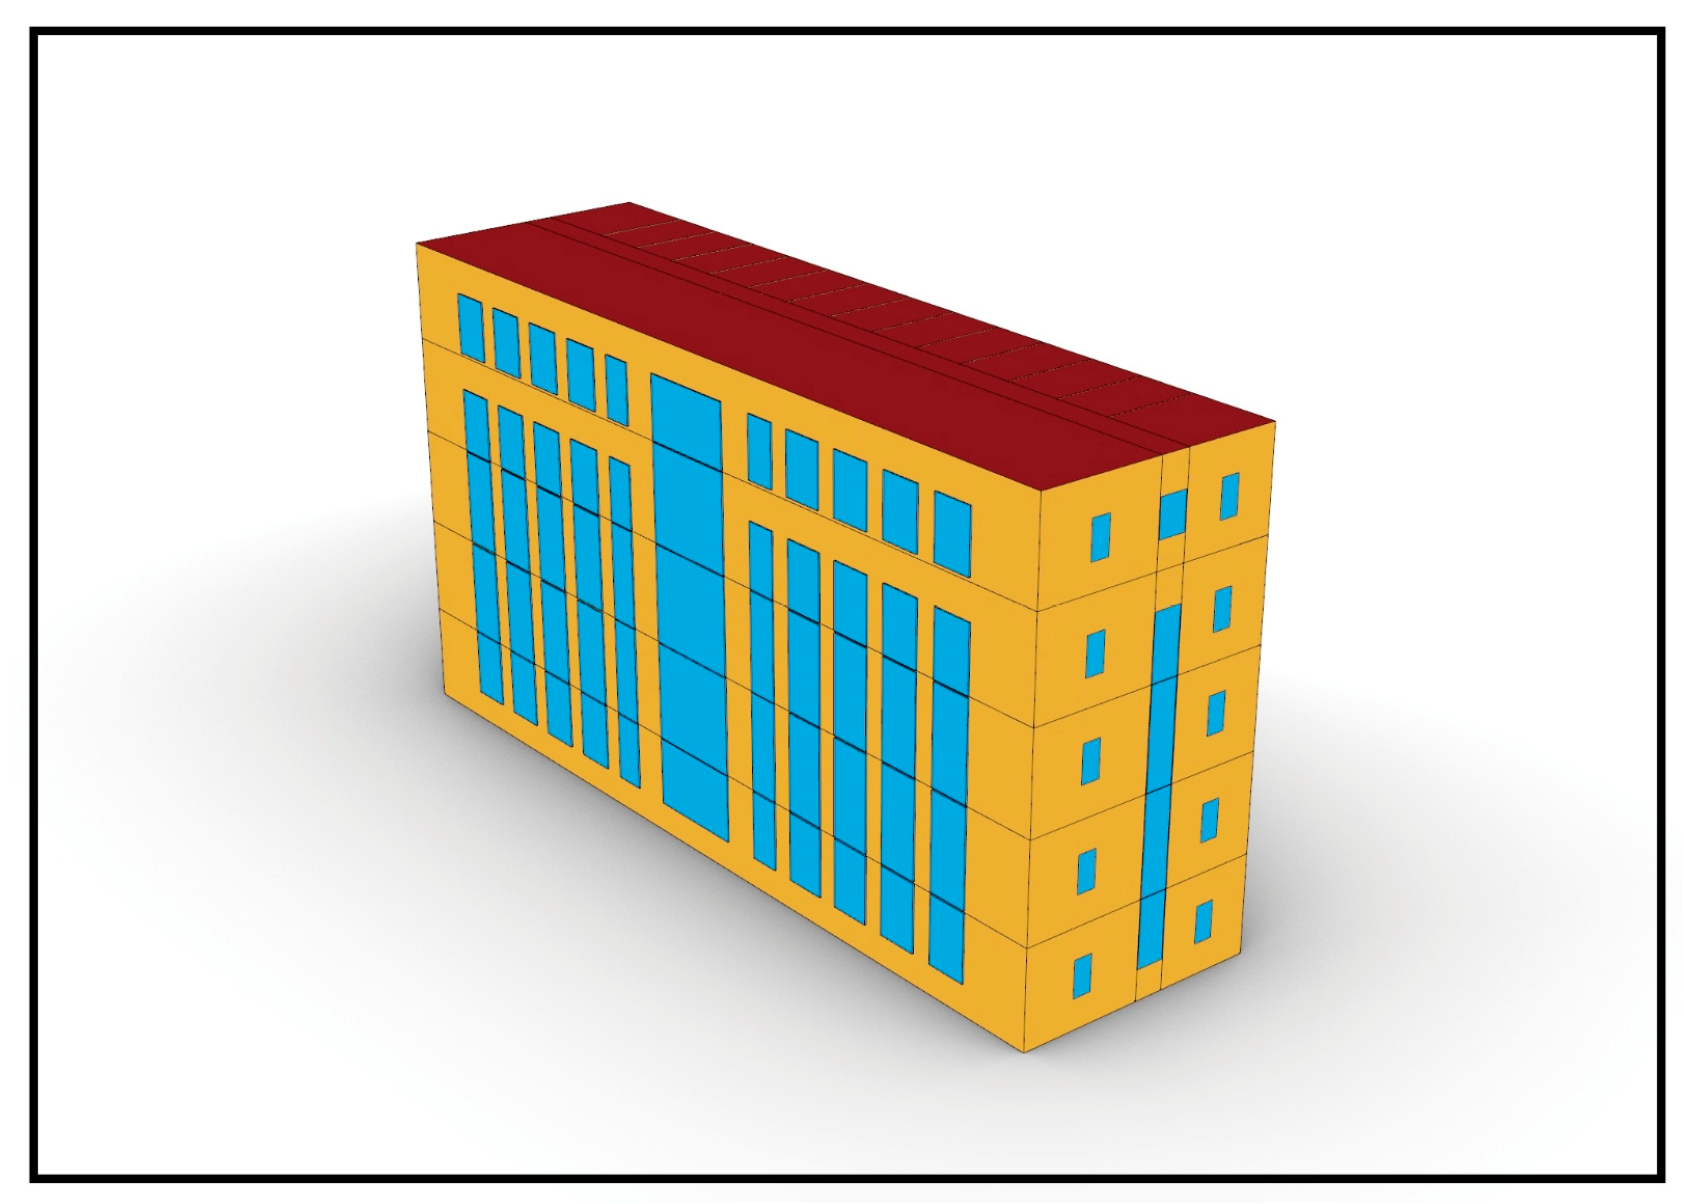
5.1.2. Option 1
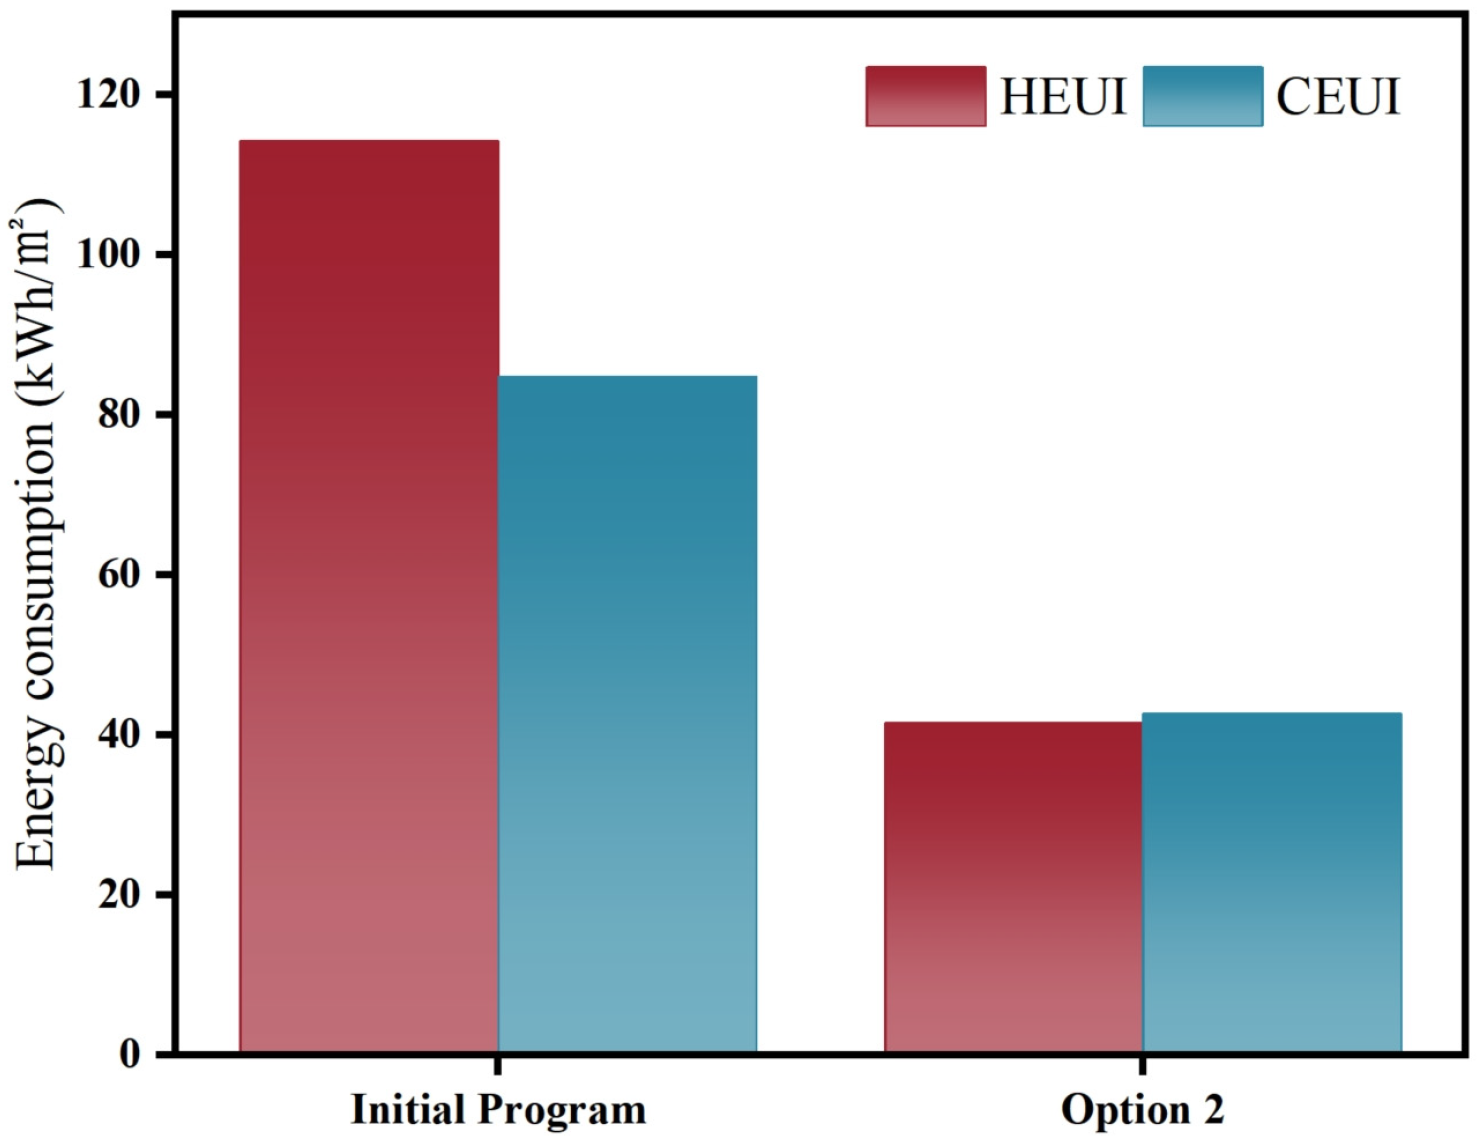
5.1.3. Option 2
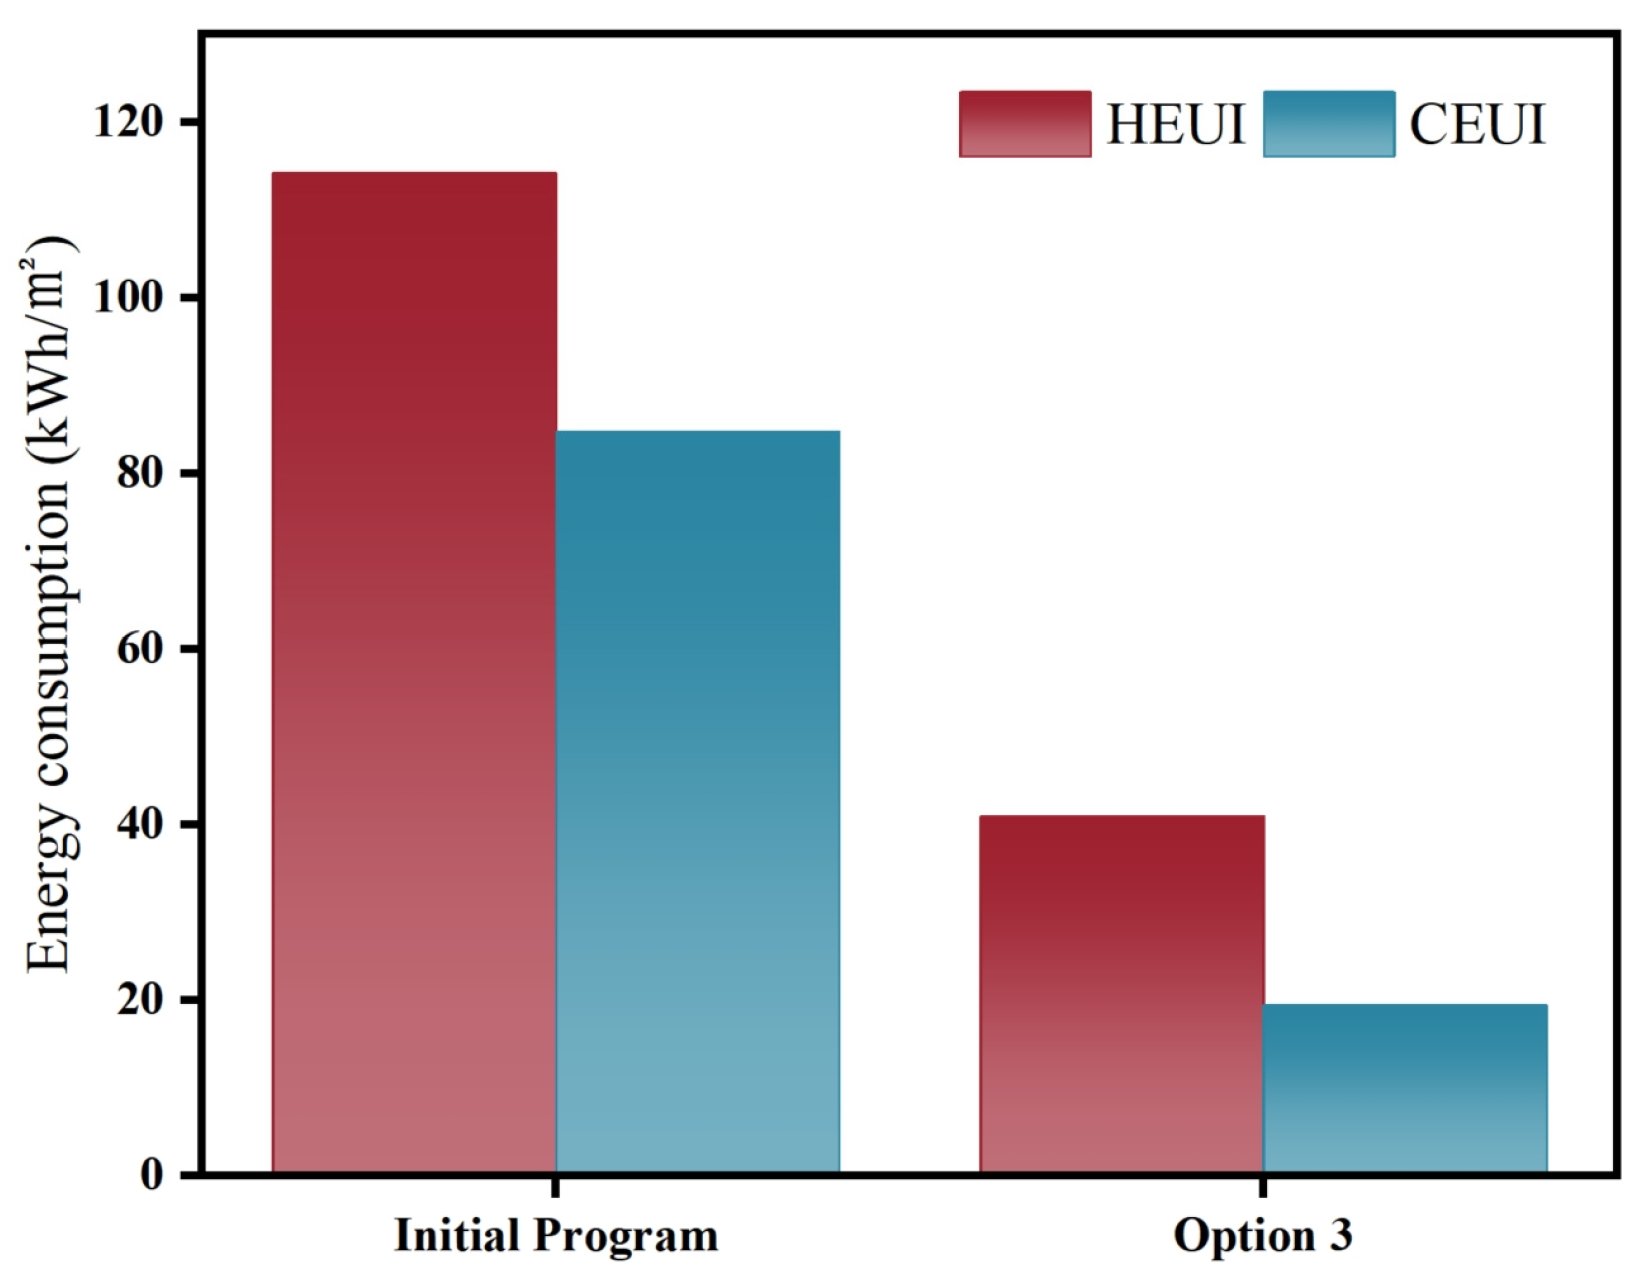
5.1.4. Option 3
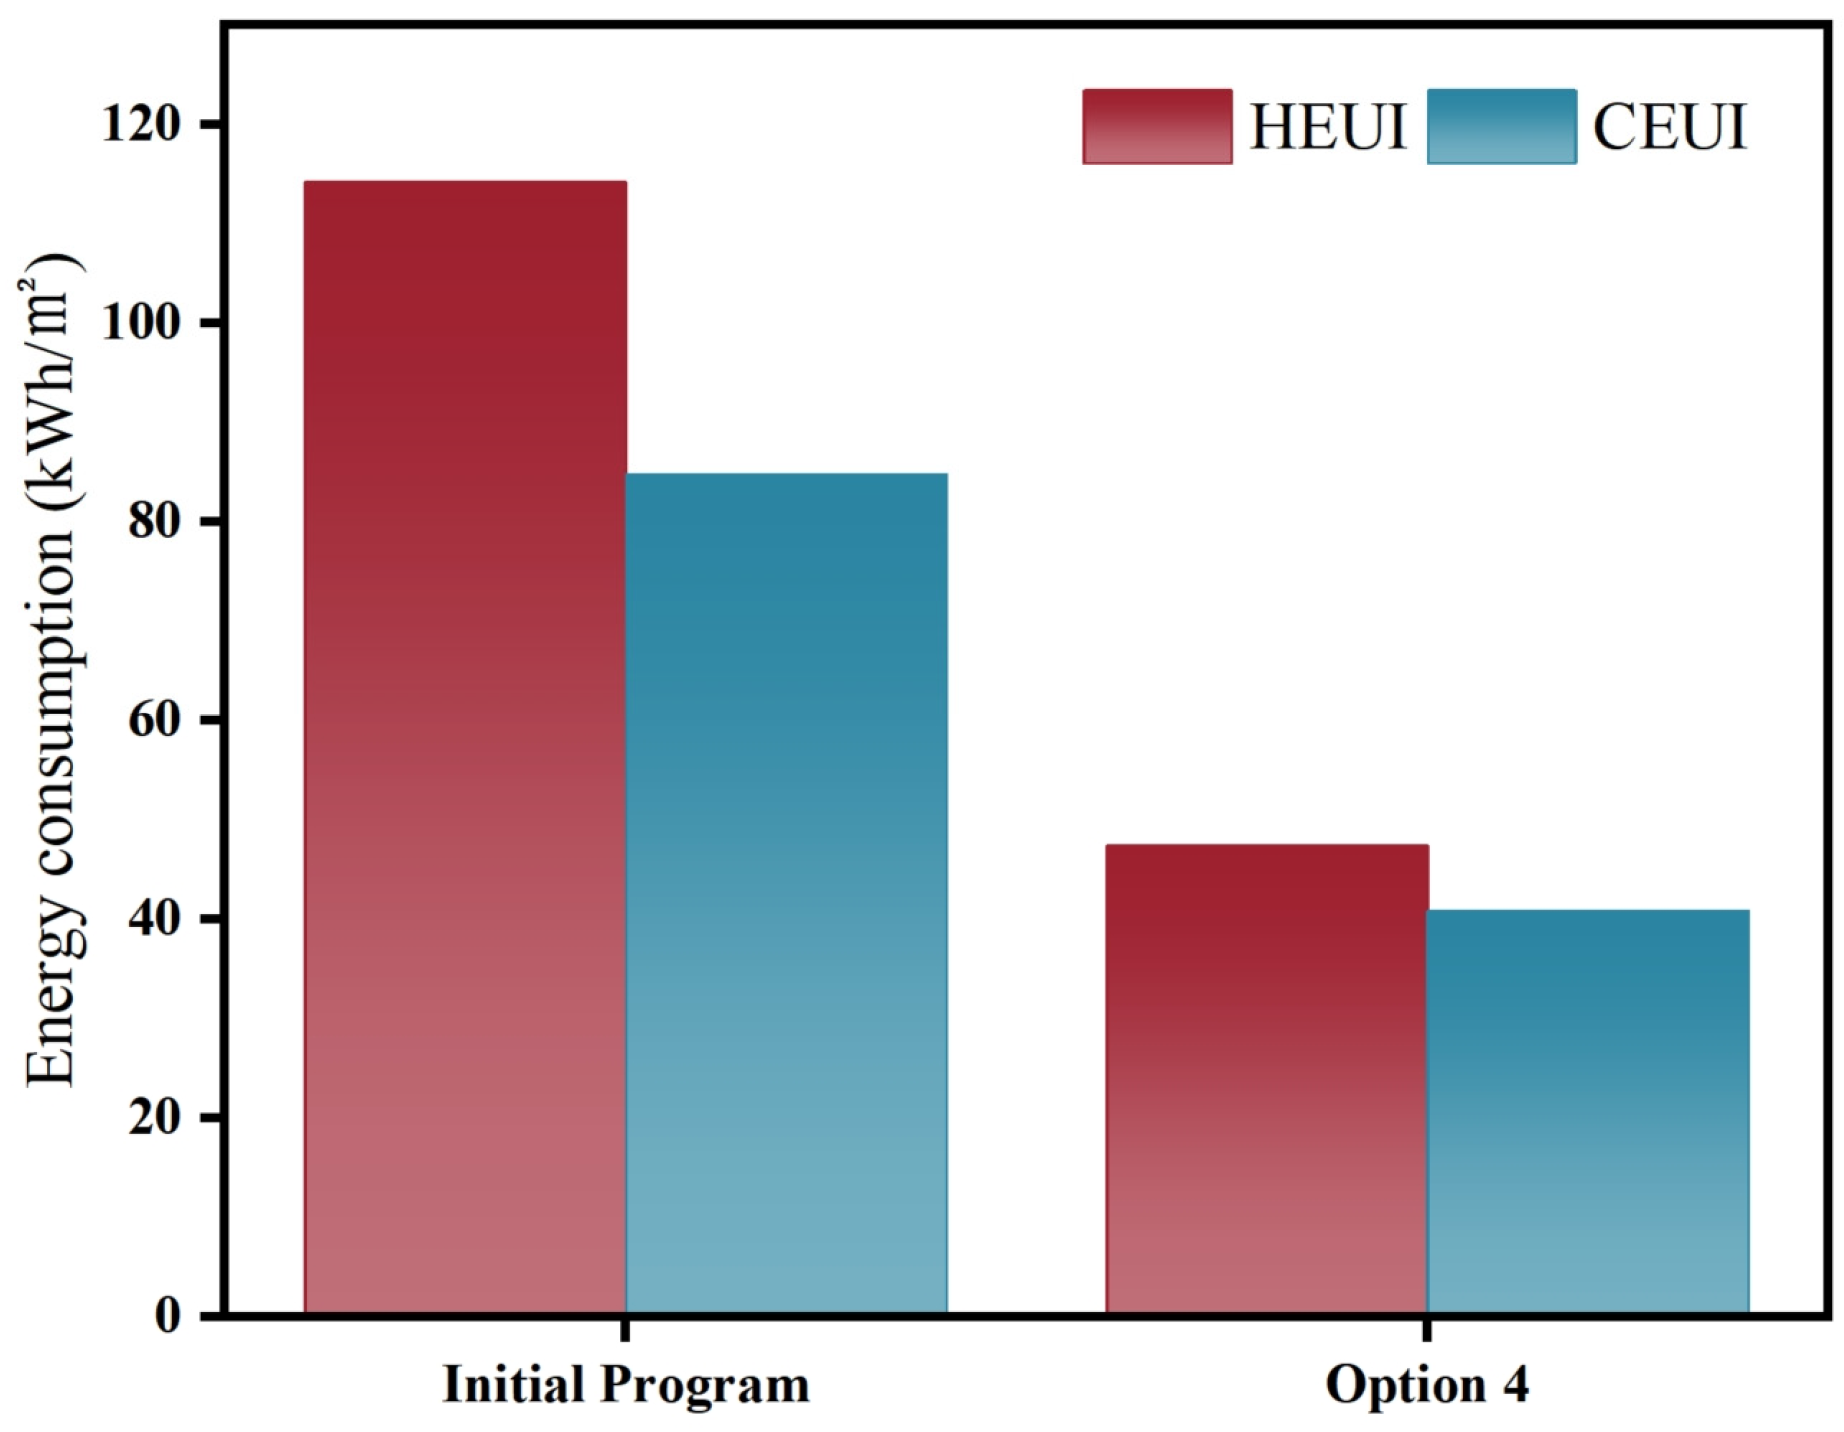
5.1.5. Option 4
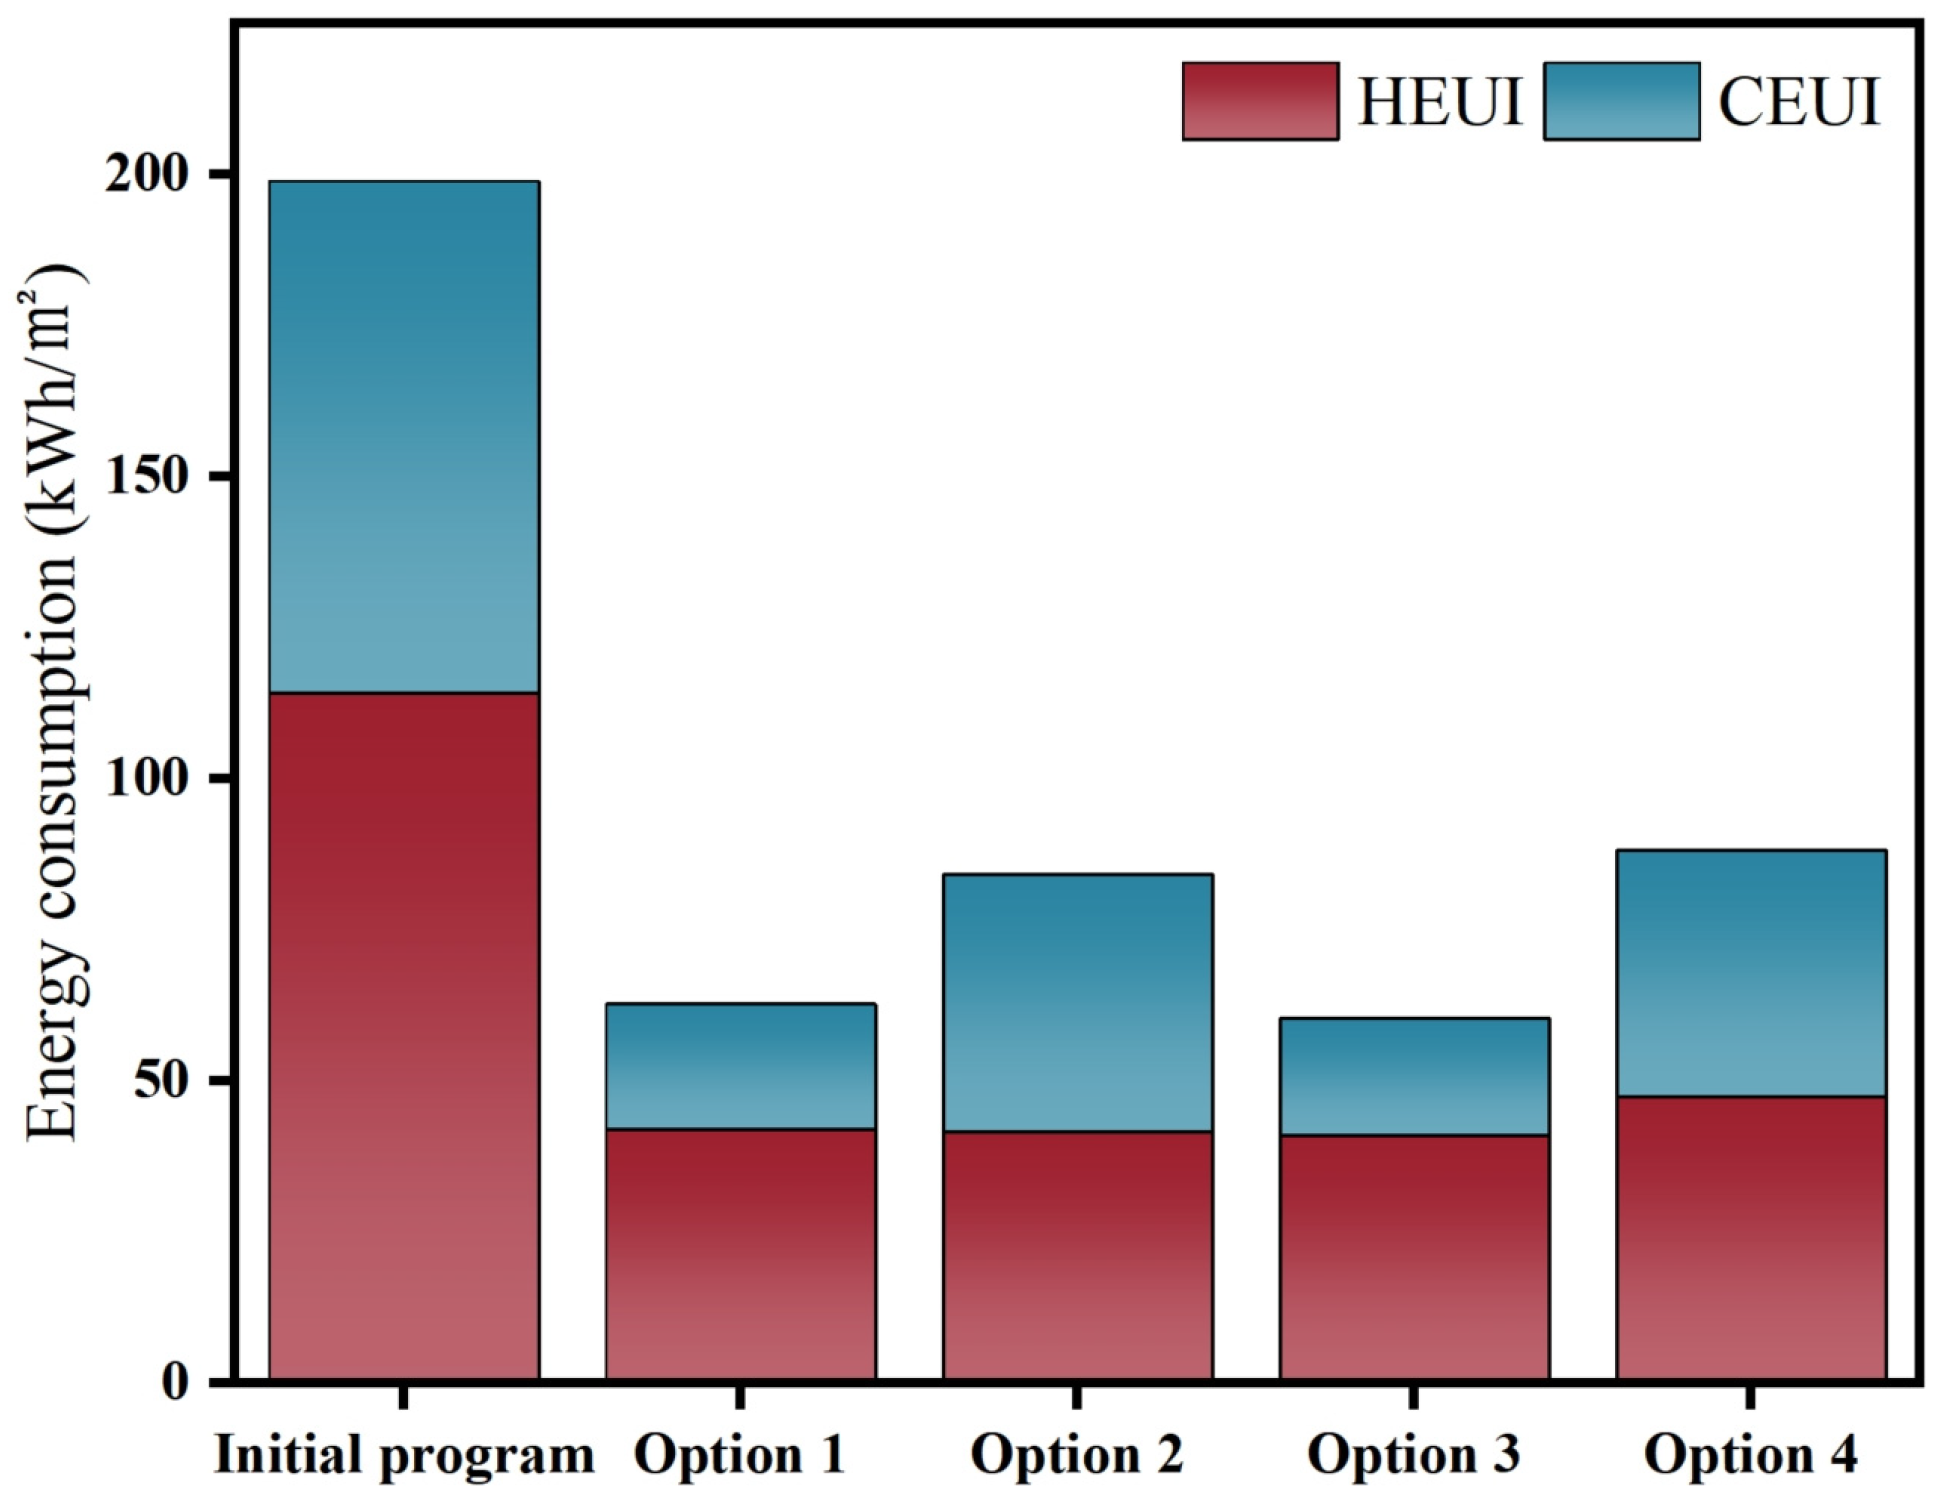
5.1.6. Summary of Four Retrofit Options
5.2. Research on Energy-Saving Retrofit Strategies for New Construction
5.2.1. New Construction Program Reference Building
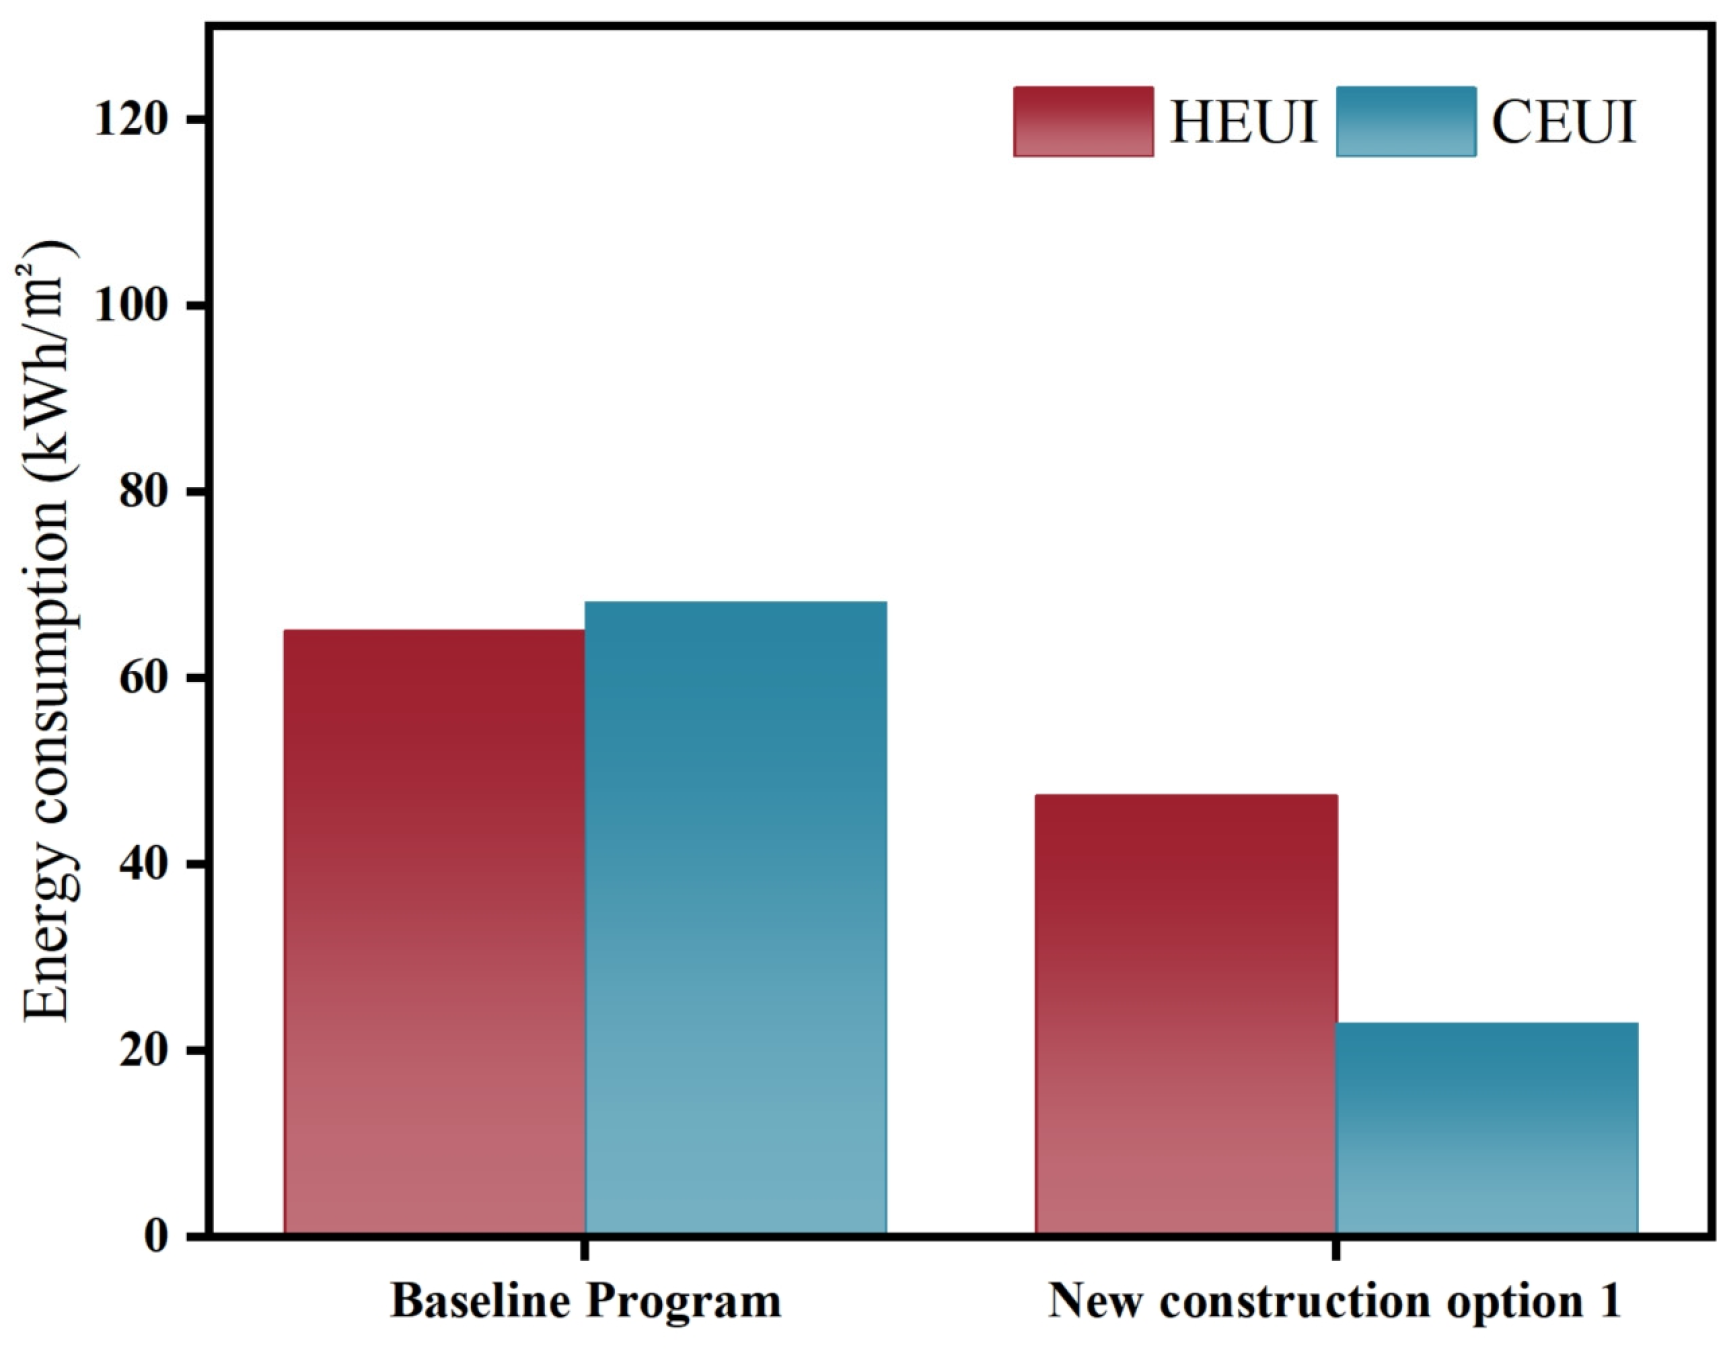
5.2.2. New Construction: Option 1
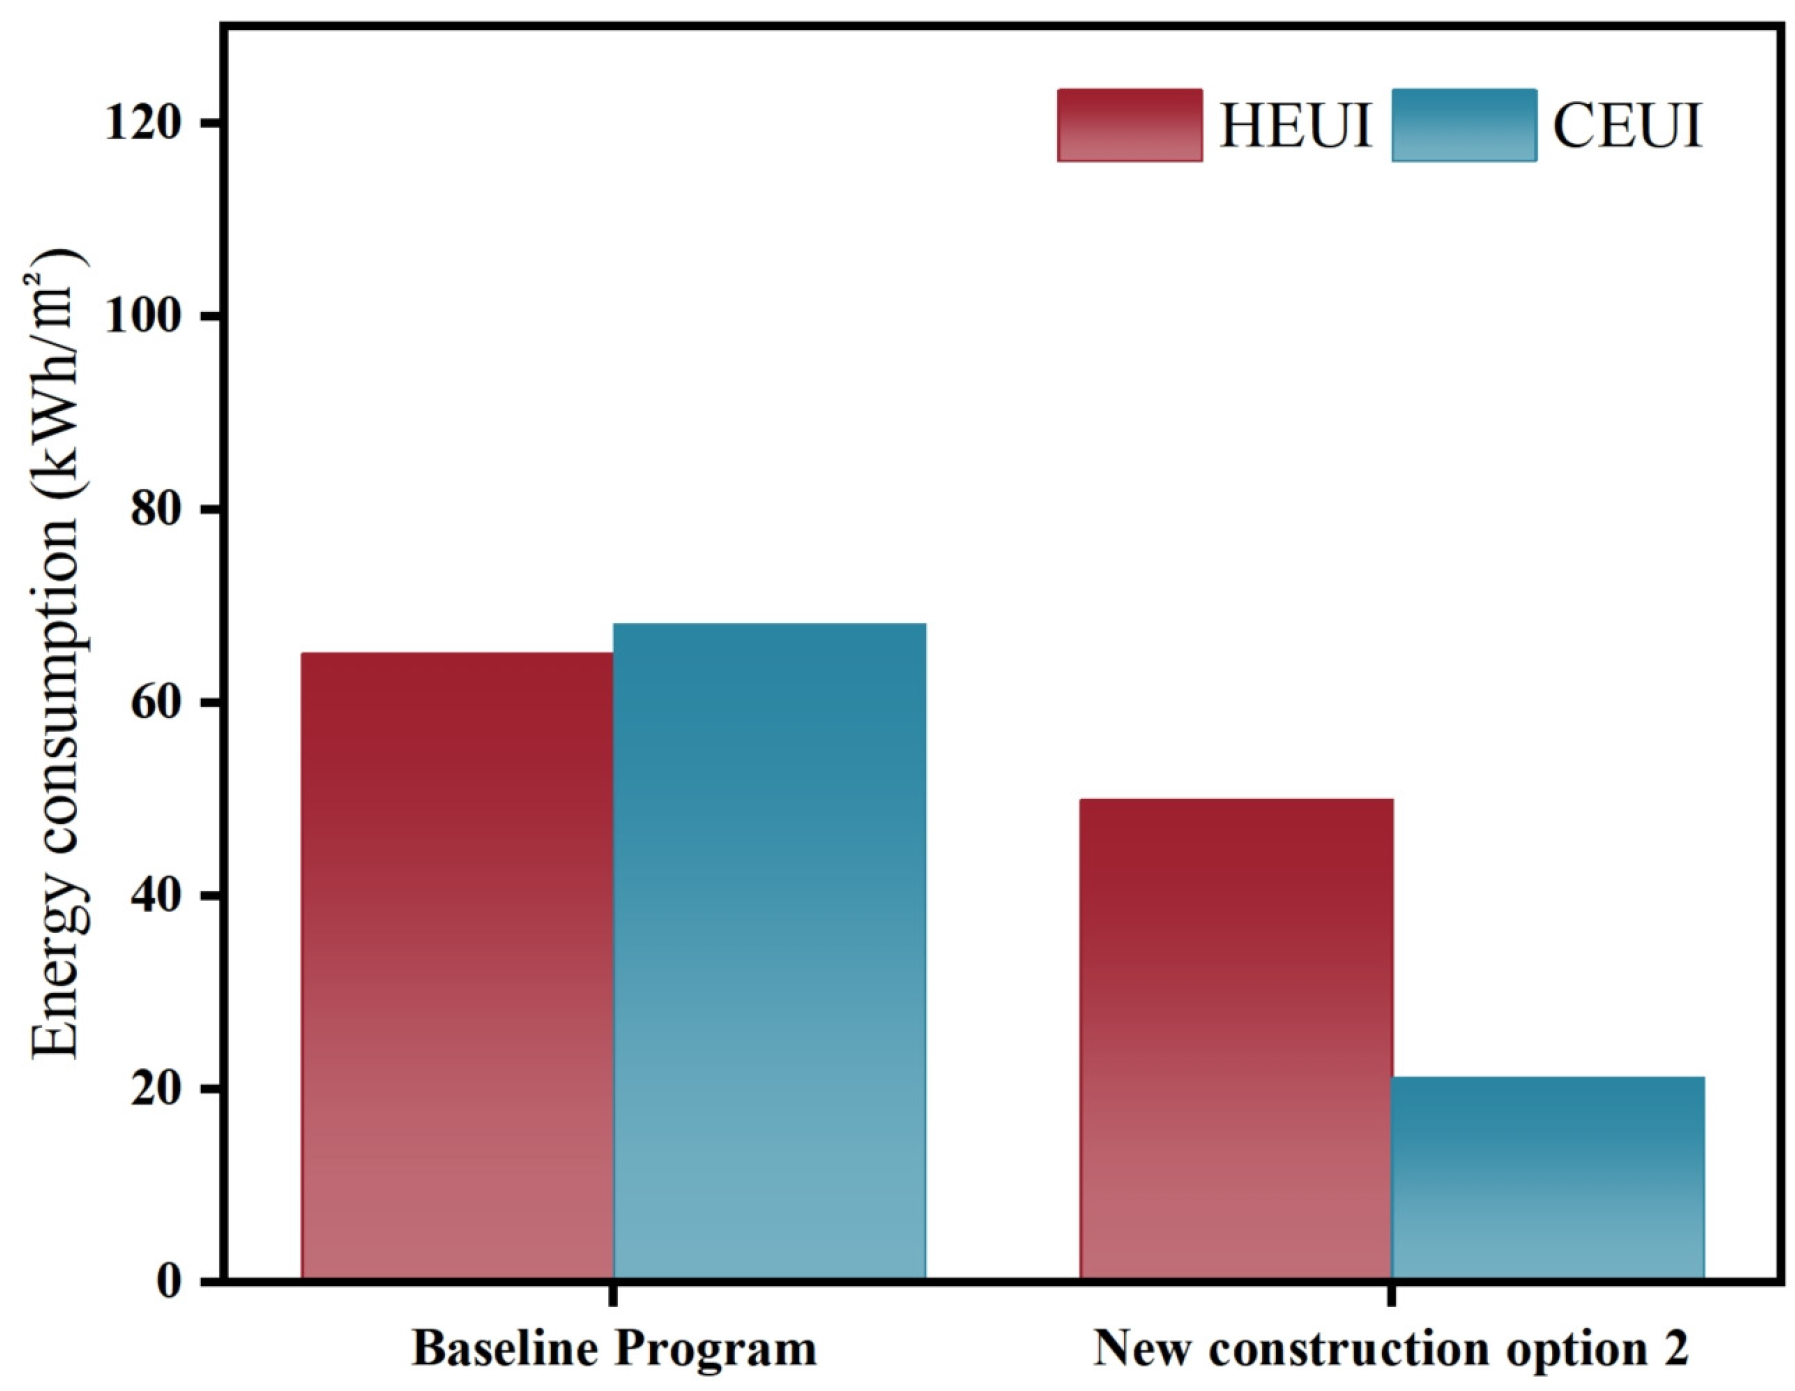
5.2.3. New Construction: Option 2
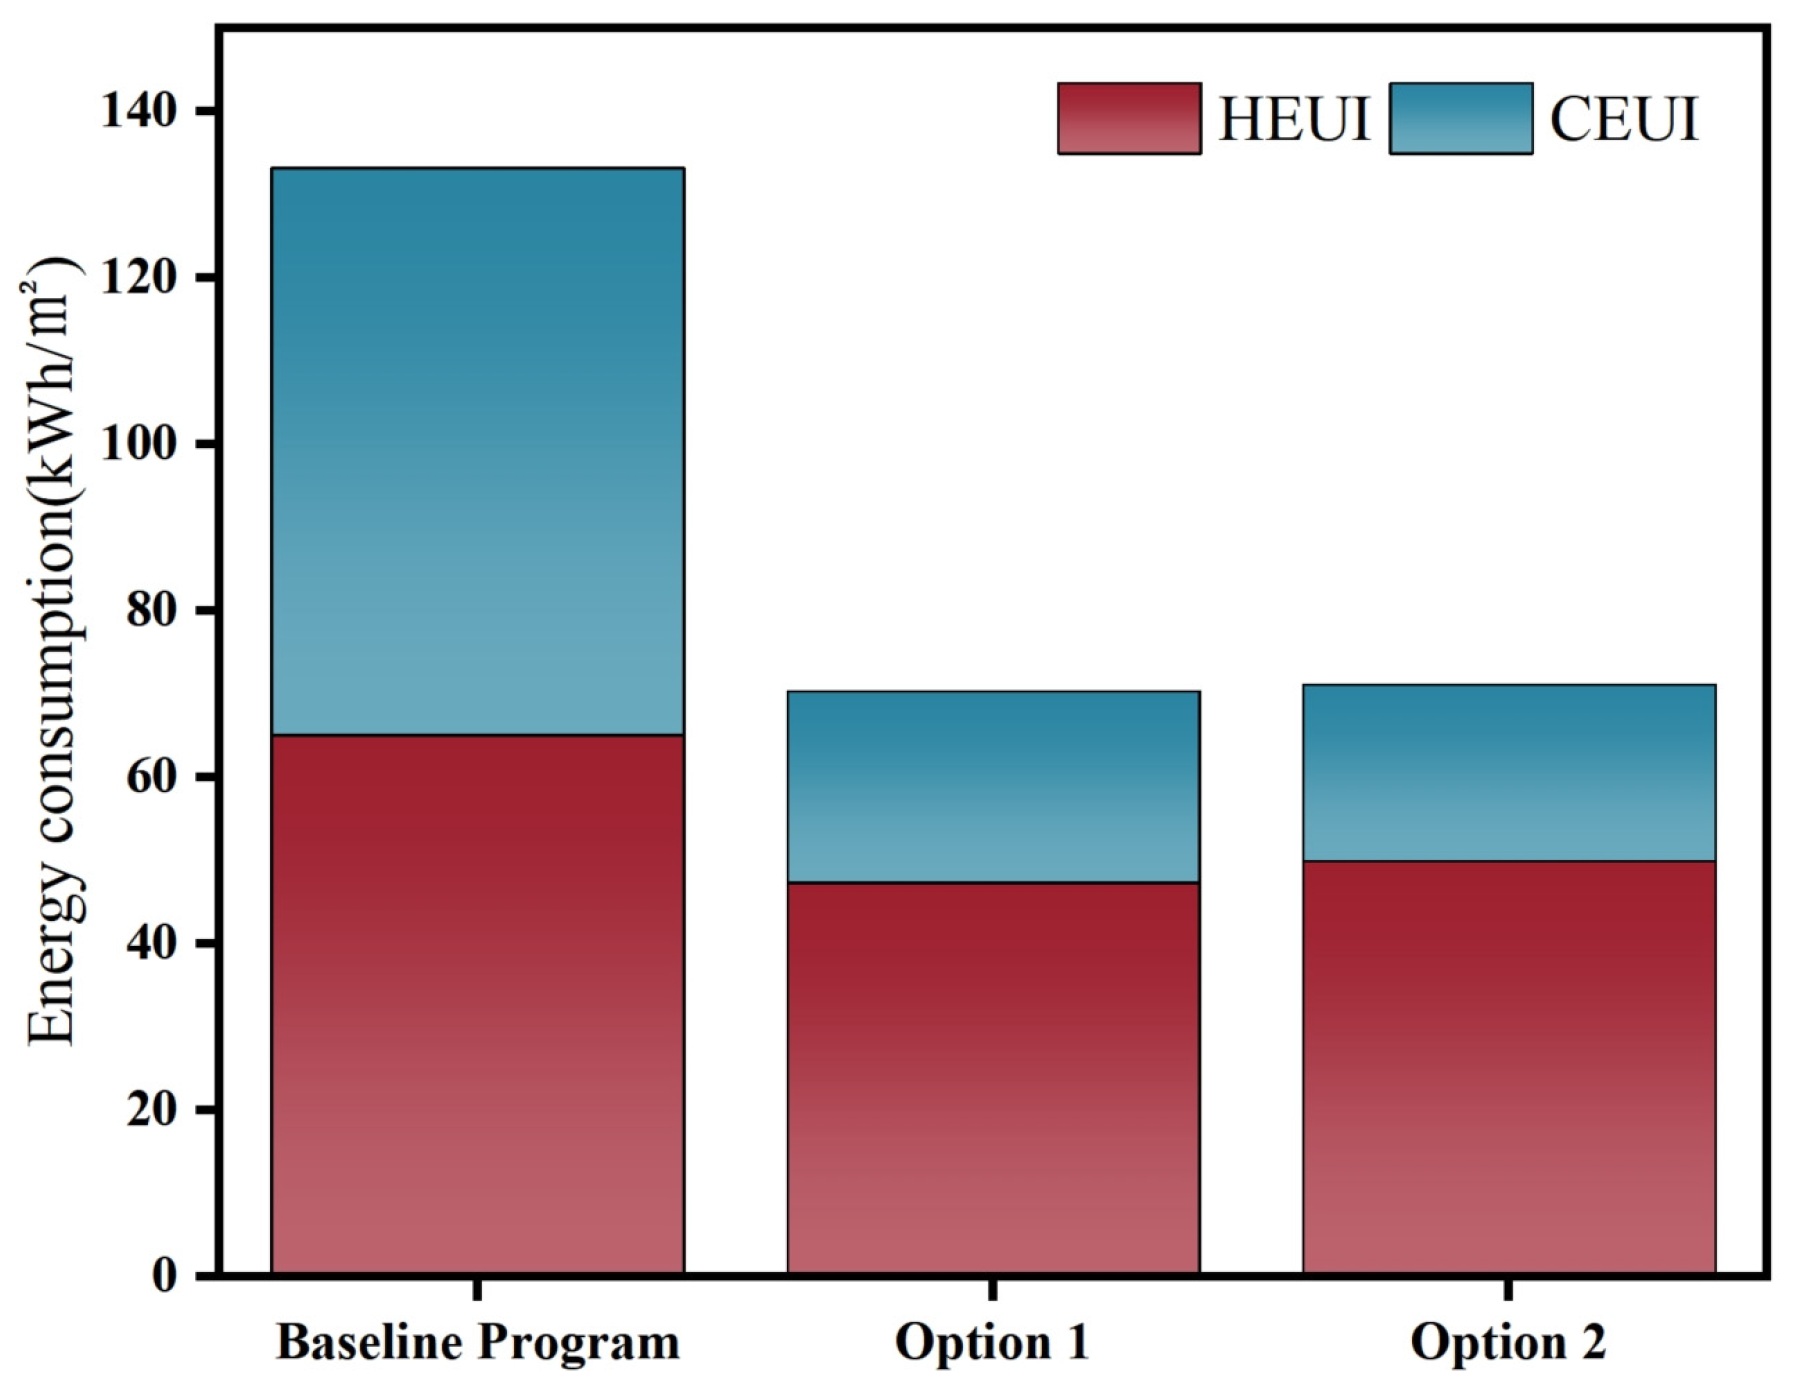
5.2.4. Summary of Two New Construction Options
6. Discussion
6.1. Entropy-Based TOPSIS Method Evaluation Model Creation
- (1)
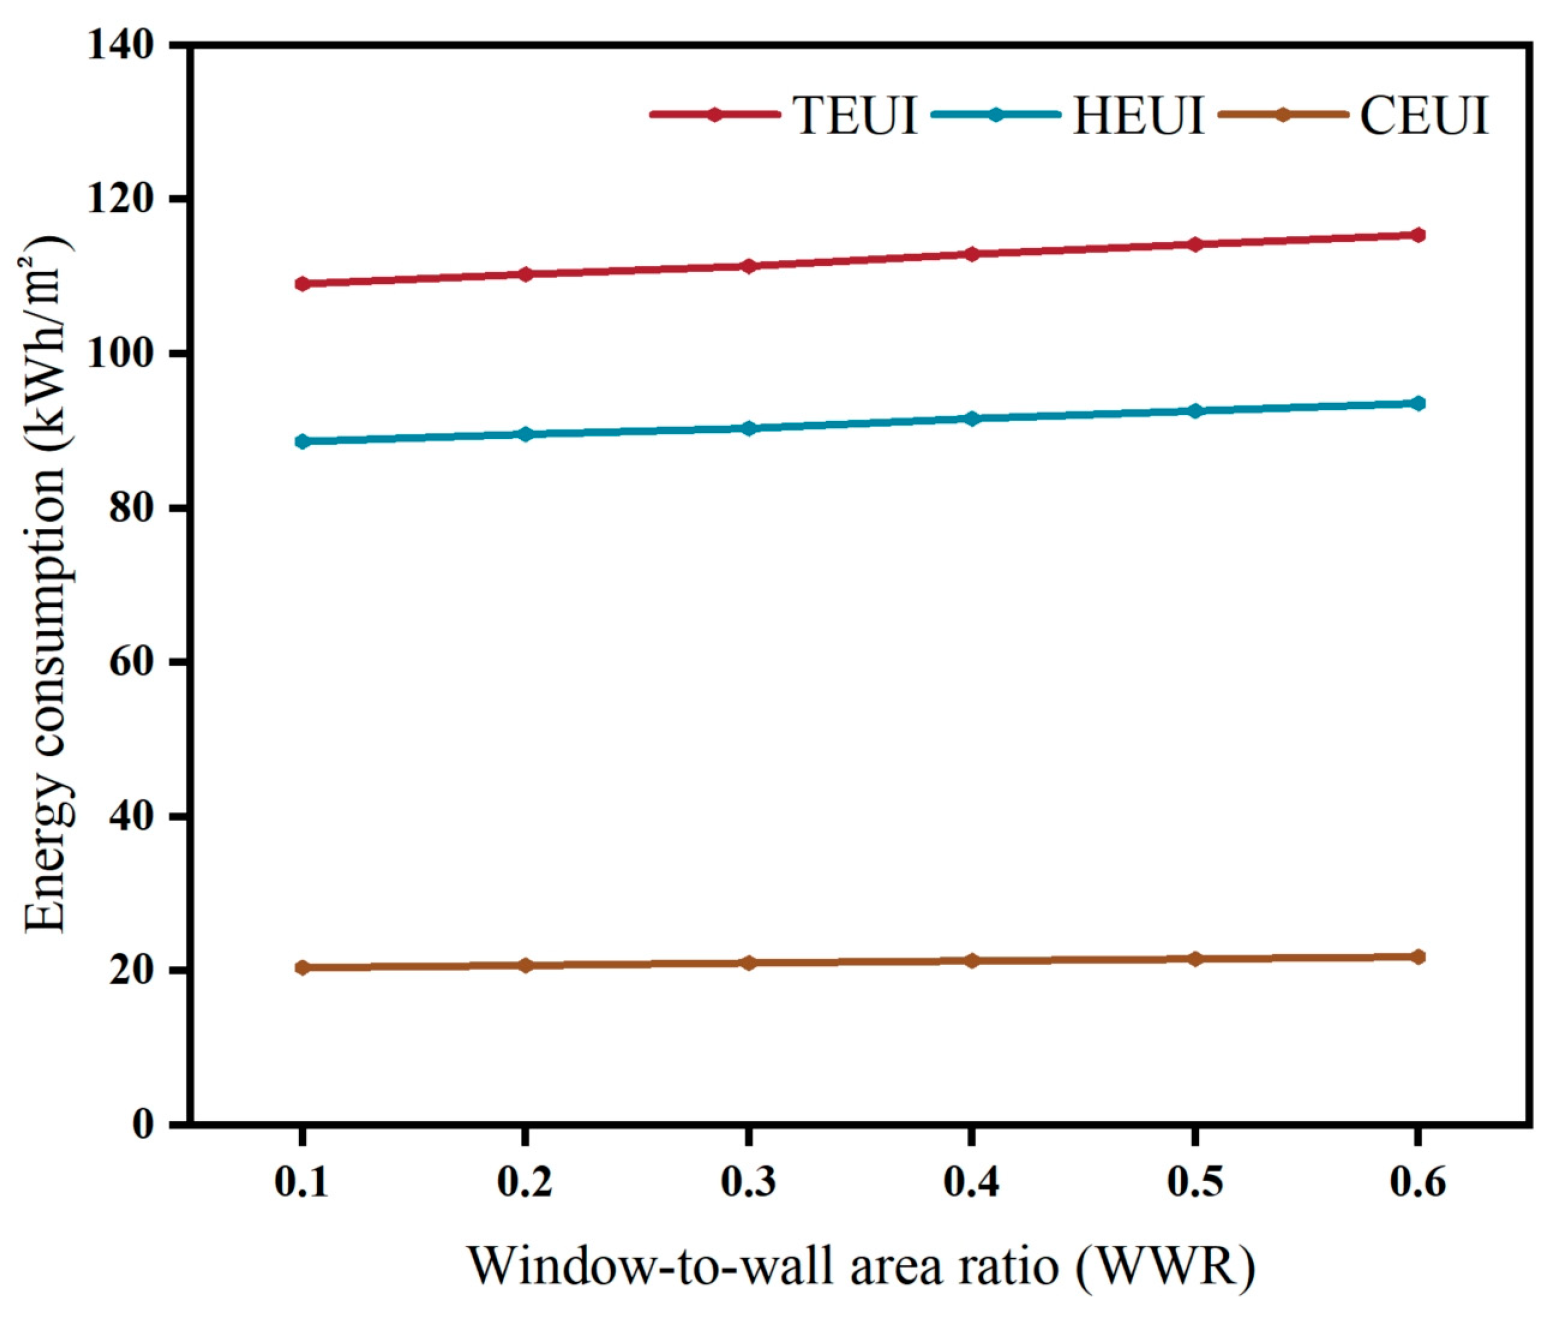
- Total energy consumption (TEUI): This is a very small indicator and the lower (smaller) the value of the indicator, the better.
- (2)
- Heating energy consumption (HEUI): This is a very small indicator and the lower (smaller) the value of the indicator, the better.
- (3)
- Cooling energy consumption (CEUI): This is a very small indicator and the lower (smaller) the value of the indicator, the better.
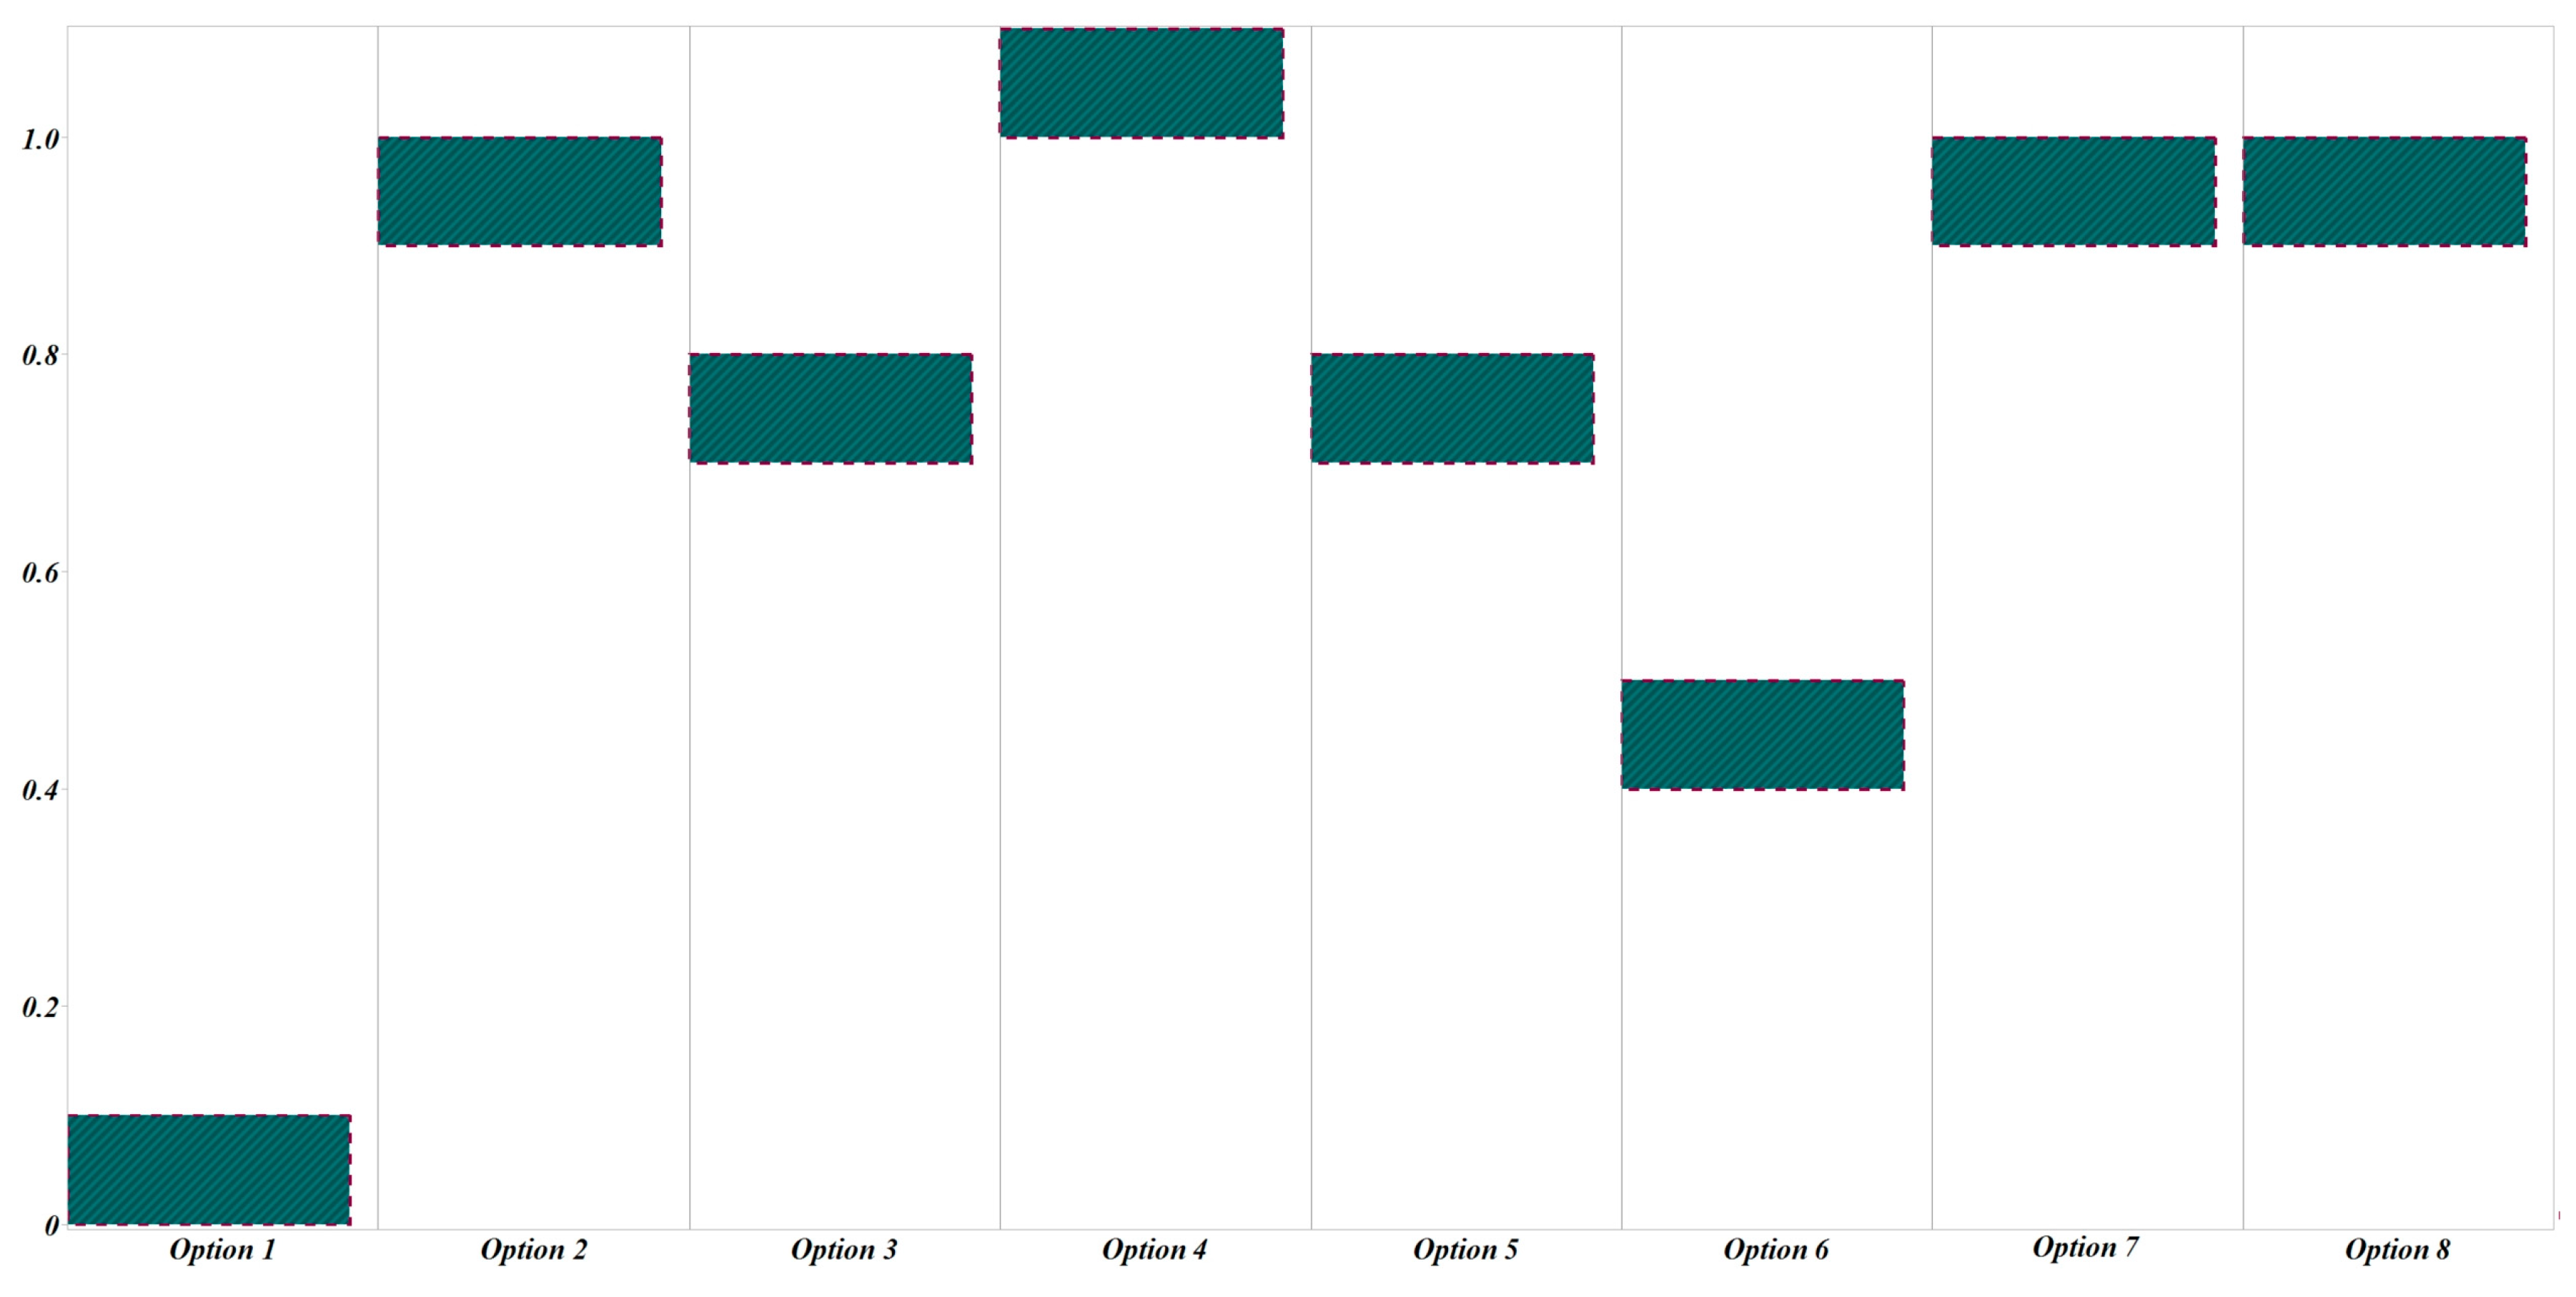
6.2. Evaluation Model Visualization
6.3. Model Creation of TOPSIS Method Based on Different Weighting Coefficients
6.3.1. The First Scheme of Different Weighting Coefficients
6.3.2. The Second Scheme of Different Weighting Coefficients
7. Conclusions
7.1. Limitations of the Article Study
7.2. Article Conclusions
Author Contributions
Funding
Institutional Review Board Statement
Informed Consent Statement
Data Availability Statement
Conflicts of Interest
References
- Li, R.; Yu, Y.; Cai, W.; Liu, Q.; Liu, Y.; Zhou, H. Interprovincial Differences in the Historical Peak Situation of Building Carbon Emissions in China: Causes and Enlightenments. J. Environ. Manag. 2023, 332, 117347. [Google Scholar] [CrossRef] [PubMed]
- Jiang, Y.; Yan, D.; Guo, S.; Hu, S. China Building Energy Use 2018; China Architecture Publishing & Media Co., Ltd.: Beijing, China, 2018; p. 42. [Google Scholar]
- Shaeri, J.; Yaghoubi, M.; Habibi, A. Effects of External Louvers on Solar Heat Gain and Energy Consumption of an Office Building in Different Climates of Iran. Iran. J. Sci. Technol.-Trans. Mech. Eng. 2022, 46, 311–326. [Google Scholar] [CrossRef]
- Huo, H.; Xu, W.; Li, A.; Lv, Y.; Liu, C. Analysis and Optimization of External Venetian Blind Shading for Nearly Zero-Energy Buildings in Different Climate Regions of China. Sol. Energy 2021, 223, 54–71. [Google Scholar] [CrossRef]
- Hashemi, A. Daylighting and Solar Shading Performances of an Innovative Automated Reflective Louvre System. Energy Build. 2014, 82, 607–620. [Google Scholar] [CrossRef]
- Hammad, F.; Abu-Hijleh, B. The Energy Savings Potential of Using Dynamic External Louvers in an Office Building. Energy Build. 2010, 42, 1888–1895. [Google Scholar] [CrossRef]
- Palmero-Marrero, A.I.; Oliveira, A.C. Effect of Louver Shading Devices on Building Energy Requirements. Appl. Energy 2010, 87, 2040–2049. [Google Scholar] [CrossRef]
- Singh, R.; Lazarus, I.J.; Kishore, V.V.N. Uncertainty and Sensitivity Analyses of Energy and Visual Performances of Office Building with External Venetian Blind Shading in Hot-Dry Climate. Appl. Energy 2016, 184, 155–170. [Google Scholar] [CrossRef]
- Khabir, S.; Vakilinezhad, R. Energy and Thermal Analysis of DSF in the Retrofit Design of Office Buildings in Hot Climates. Archit. Eng. Des. Manag. 2022, 19, 642–664. [Google Scholar] [CrossRef]
- Roberts, F.; Yang, S.; Du, H.; Yang, R. Effect of Semi-Transparent a-Si PV Glazing within Double-Skin Façades on Visual and Energy Performances under the UK Climate Condition. Renew. Energy 2023, 207, 601–610. [Google Scholar] [CrossRef]
- Al-Tamimi, N. Building Envelope Retrofitting Strategies for Energy-Efficient Office Buildings in Saudi Arabia. Buildings 2022, 12, 1900. [Google Scholar] [CrossRef]
- Heidarzadeh, S.; Mahdavinejad, M.; Habib, F. External Shading and Its Effect on the Energy Efficiency of Tehran’s Office Buildings. Environ. Prog. Sustain. Energy 2023, 42, e14185. [Google Scholar] [CrossRef]
- Koç, S.G.; Maçka Kalfa, S. The Effects of Shading Devices on Office Building Energy Performance in Mediterranean Climate Regions. J. Build. Eng. 2021, 44, 102653. [Google Scholar] [CrossRef]
- Krarti, M. Evaluation of Energy Performance of Dynamic Overhang Systems for US Residential Buildings. Energy Build. 2021, 234, 110699. [Google Scholar] [CrossRef]
- Sun, N.; Cui, Y.; Jiang, Y.; Li, S. Lighting and Ventilation-Based Building Sun-Shading Design and Simulation Case in Cold Regions. Energy Procedia 2018, 152, 462–469. [Google Scholar] [CrossRef]
- Kunwar, N.; Cetin, K.S.; Passe, U. Dynamic Shading in Buildings: A Review of Testing Methods and Recent Research Findings. Curr. Sustain. Energy Rep. 2018, 5, 93–100. [Google Scholar] [CrossRef]
- Al Dakheel, J.; Tabet Aoul, K. Building Applications, Opportunities and Challenges of Active Shading Systems: A State-of-the-Art Review. Energies 2017, 10, 1672. [Google Scholar] [CrossRef]
- Cho, J.; Yoo, C.; Kim, Y. Viability of Exterior Shading Devices for High-Rise Residential Buildings: Case Study for Cooling Energy Saving and Economic Feasibility Analysis. Energy Build. 2014, 82, 771–785. [Google Scholar] [CrossRef]
- Grynning, S.; Time, B.; Matusiak, B. Solar Shading Control Strategies in Cold Climates—Heating, Cooling Demand and Daylight Availability in Office Spaces. Sol. Energy 2014, 107, 182–194. [Google Scholar] [CrossRef]
- Moretti, E.; Belloni, E. Evaluation of Energy, Thermal, and Daylighting Performance of Solar Control Films for a Case Study in Moderate Climate. Build. Environ. 2015, 94, 183–195. [Google Scholar] [CrossRef]
- Fathi, S.; Kavoosi, A. Effect of Electrochromic Windows on Energy Consumption of High-Rise Office Buildings in Different Climate Regions of Iran. Sol. Energy 2021, 223, 132–149. [Google Scholar] [CrossRef]
- Attia, S.; Bertrand, S.; Cuchet, M.; Yang, S.; Tabadkani, A. Comparison of Thermal Energy Saving Potential and Overheating Risk of Four Adaptive Façade Technologies in Office Buildings. Sustainability 2022, 14, 6106. [Google Scholar] [CrossRef]
- Cannavale, A.; Ayr, U.; Fiorito, F.; Martellotta, F. Smart Electrochromic Windows to Enhance Building Energy Efficiency and Visual Comfort. Energies 2020, 13, 1449. [Google Scholar] [CrossRef]
- Casini, M. Active Dynamic Windows for Buildings: A Review. Renew. Energy 2018, 119, 923–934. [Google Scholar] [CrossRef]
- Skarning, G.C.J.; Hviid, C.A.; Svendsen, S. The Effect of Dynamic Solar Shading on Energy, Daylighting and Thermal Comfort in a Nearly Zero-Energy Loft Room in Rome and Copenhagen. Energy Build. 2017, 135, 302–311. [Google Scholar] [CrossRef]
- Singh, R.; Lazarus, I.J.; Kishore, V.V.N. Effect of Internal Woven Roller Shade and Glazing on the Energy and Daylighting Performances of an Office Building in the Cold Climate of Shillong. Appl. Energy 2015, 159, 317–333. [Google Scholar] [CrossRef]
- DeForest, N.; Shehabi, A.; O’Donnell, J.; Garcia, G.; Greenblatt, J.; Lee, E.S.; Selkowitz, S.; Milliron, D.J. United States Energy and CO2 Savings Potential from Deployment of Near-Infrared Electrochromic Window Glazings. Build. Environ. 2015, 89, 107–117. [Google Scholar] [CrossRef]
- Liao, W.; Xu, S. Energy Performance Comparison among See-through Amorphous-Silicon PV (Photovoltaic) Glazings and Traditional Glazings under Different Architectural Conditions in China. Energy 2015, 83, 267–275. [Google Scholar] [CrossRef]
- Valladares-Rendón, L.G.; Lo, S.-L. Passive Shading Strategies to Reduce Outdoor Insolation and Indoor Cooling Loads by Using Overhang Devices on a Building. Build. Simul. 2014, 7, 671–681. [Google Scholar] [CrossRef]
- Oh, M.; Lee, C.; Park, J.; Lee, K.; Tae, S. Evaluation of Energy and Daylight Performance of Old Office Buildings in South Korea with Curtain Walls Remodeled Using Polymer Dispersed Liquid Crystal (PDLC) Films. Energies 2019, 12, 3679. [Google Scholar] [CrossRef]
- Menyhart, K.; Krarti, M. Potential Energy Savings from Deployment of Dynamic Insulation Materials for US Residential Buildings. Build. Environ. 2017, 114, 203–218. [Google Scholar] [CrossRef]
- Cuce, E. Toward Multi-Functional PV Glazing Technologies in Low/Zero Carbon Buildings: Heat Insulation Solar Glass—Latest Developments and Future Prospects. Renew. Sustain. Energy Rev. 2016, 60, 1286–1301. [Google Scholar] [CrossRef]
- Yao, J.; Zhu, N. Evaluation of Indoor Thermal Environmental, Energy and Daylighting Performance of Thermotropic Windows. Build. Environ. 2012, 49, 283–290. [Google Scholar] [CrossRef]
- Rezaei, S.D.; Shannigrahi, S.; Ramakrishna, S. A Review of Conventional, Advanced, and Smart Glazing Technologies and Materials for Improving Indoor Environment. Sol. Energy Mater. Sol. Cells 2017, 159, 26–51. [Google Scholar] [CrossRef]
- Dussault, J.-M.; Sourbron, M.; Gosselin, L. Reduced Energy Consumption and Enhanced Comfort with Smart Windows: Comparison between Quasi-Optimal, Predictive and Rule-Based Control Strategies. Energy Build. 2016, 127, 680–691. [Google Scholar] [CrossRef]
- Fasi, M.A.; Budaiwi, I.M. Energy Performance of Windows in Office Buildings Considering Daylight Integration and Visual Comfort in Hot Climates. Energy Build. 2015, 108, 307–316. [Google Scholar] [CrossRef]
- Ihara, T.; Gustavsen, A.; Jelle, B.P. Effect of Facade Components on Energy Efficiency in Office Buildings. Appl. Energy 2015, 158, 422–432. [Google Scholar] [CrossRef]
- Zhu, S.; Liu, J.; Tang, G.; Sun, T.; Jia, H.; Zhao, H.; Zhang, Y.; Lin, L.; Xu, W. Evaluating the Application Potential of Acid-Modified Cotton Straw Biochars in Alkaline Soils Based on Entropy Weight TOPSIS. Agronomy 2023, 13, 2807. [Google Scholar] [CrossRef]
- Moridi, S.S.; Moosavirad, S.H.; Mirhosseini, M.; Nikpour, H.; Mokhtari, A. Prioritizing Power Outages Causes in Different Scenarios of the Global Business Network Matrix by Using Bwm and Topsis. Decis. Mak. Appl. Manag. Eng. 2023, 6, 321–340. [Google Scholar] [CrossRef]
- Liu, X.; Wang, W.; Wang, Z.; Song, J.; Li, K. Simulation Study on Outdoor Wind Environment of Residential Complexes in Hot-Summer and Cold-Winter Climate Zones Based on Entropy-Based TOPSIS Method. Sustainability 2023, 15, 12480. [Google Scholar] [CrossRef]
- Zhao, C.; Chen, J.; Yang, X.; Yuan, J. Social and Economic Impact Assessment of Coal Power Phase-Down at the Provincial Level: An Entropy-Based TOPSIS Approach. Sustainability 2023, 15, 16175. [Google Scholar] [CrossRef]
- Yuan, X.; Song, W. Evaluating Technology Innovation Capabilities of Companies Based on Entropy—TOPSIS: The Case of Solar Cell Companies. Inf. Technol. Manag. 2022, 23, 65–76. [Google Scholar] [CrossRef]
- Xu, X.; Zhang, Z.; Long, T.; Sun, S.; Gao, J. Mega-City Region Sustainability Assessment and Obstacles Identification with GIS–Entropy–TOPSIS Model: A Case in Yangtze River Delta Urban Agglomeration, China. J. Clean. Prod. 2021, 294, 126147. [Google Scholar] [CrossRef]
- Ding, S.; Li, R.; Guo, J. An Entropy-Based TOPSIS and Optimized Grey Prediction Model for Spatiotemporal Analysis in Strategic Emerging Industry. Expert Syst. Appl. 2023, 213, 119169. [Google Scholar] [CrossRef]
- Sun, J.; Miao, J.; Mu, H.; Xu, J.; Zhai, N. Sustainable Development in Marine Economy: Assessing Carrying Capacity of Shandong Province in China. Ocean Coast. Manag. 2022, 216, 105981. [Google Scholar] [CrossRef]
- Cao, J.; Xu, F. Entropy-Based Fuzzy TOPSIS Method for Investment Decision Optimization of Large-Scale Projects. Comput. Intell. Neurosci. 2022, 2022, e4381293. [Google Scholar] [CrossRef]
- Luan, D.; Liu, A.; Wang, X.; Xie, Y.; Wu, Z. Robust Two-Stage Location Allocation for Emergency Temporary Blood Supply in Postdisaster. Discrete Dyn. Nat. Soc. 2022, 2022, 6184170. [Google Scholar] [CrossRef]
- Nayak, P.P.; Datta, A.K. An Entropy-Based TOPSIS Approach for Selecting Best Suitable Rice Husk for Potential Energy Applications: Pyrolysis Kinetics and Characterization of Rice Husk and Rice Husk Ash. Biomass Convers. Biorefinery 2022. [Google Scholar] [CrossRef]
- GB55015-2021; General Specification for Energy Efficiency and Renewable Energy Utilization in Buildings. Chinese Standard: Beijing, China, 2021.


| Representing the City | Annual Precipitation (mm) | Annual Evaporation (mm) | Average Temperature of the Coldest Month (°C) | Average Temperature of the Hottest Month (°C) | Hottest Monthly Temperature Extremes (°C) | Coldest Month Temperature Extremes (°C) | Annual Hours of Sunshine (h) | Annual Solar Radiation (Wh/m2) | Air-Conditioning Degree Days (°C·d) | Heating Degree Days (°C·d) |
|---|---|---|---|---|---|---|---|---|---|---|
| Turpan | 16.4 | 2839 | −7.2 | 32.7 | 49.6 | −28 | 3056 | 2229.3 | 579 | 2758 |
| Model Parameters | Input information |
|---|---|
| Weather data | Location, longitude, latitude, temperature, humidity, solar radiation |
| Building type | Office buildings |
| Architectural Geometry | Building form, building orientation, gross floor area, main building functions |
| Envelope | Window–wall area ratio, glazing (SHGC, U-value, VT), wall construction and roof construction information |
| Internal loads | Occupancy rate, power density of electronic equipment, building fresh air operation schedule, fresh air volume per capita, area per capita |
| Type | Total Energy Consumption (TUI) | Heating Energy Consumption (TUI) | Cooling Energy Consumption (TUI) |
|---|---|---|---|
| Information entropy values (e) | 0.92 | 0.93 | 0.90 |
| Information utility value (d) | 0.07 | 0.06 | 0.09 |
| Weights (%) | 31.45 | 28.50 | 40.03 |
| Type | Positive Ideal Solution (D+) | Negative Ideal Solution (D−) | Composite Score | Sort |
|---|---|---|---|---|
| Option 1 | 0.999997 | 0.000000 | 0.000000 | 8 |
| Option 2 | 0.018312 | 0.981921 | 0.981691 | 2 |
| Option 3 | 0.244821 | 0.813673 | 0.768707 | 5 |
| Option 4 | 0.000000 | 0.999997 | 1.000000 | 1 |
| Option 5 | 0.240183 | 0.787174 | 0.766212 | 6 |
| Option 6 | 0.583462 | 0.474277 | 0.448387 | 7 |
| Option 7 | 0.070855 | 0.930557 | 0.929244 | 3 |
| Option 8 | 0.080622 | 0.930394 | 0.920256 | 4 |
| Type | Positive Ideal Solution (D+) | Negative Ideal Solution (D−) | Composite Score | Sort |
|---|---|---|---|---|
| Option 1 | 0.999998 | 0.000000 | 0.000000 | 8 |
| Option 2 | 0.017534 | 0.982463 | 0.982465 | 2 |
| Option 3 | 0.172174 | 0.827823 | 0.827825 | 5 |
| Option 4 | 0.000000 | 0.999998 | 1.000000 | 1 |
| Option 5 | 0.200533 | 0.799464 | 0.799466 | 6 |
| Option 6 | 0.525616 | 0.474382 | 0.474383 | 7 |
| Option 7 | 0.072088 | 0.927910 | 0.927911 | 3 |
| Option 8 | 0.077788 | 0.922209 | 0.922211 | 4 |
| Type | Positive Ideal Solution (D+) | Negative Ideal Solution (D−) | Composite Score | Sort |
|---|---|---|---|---|
| Option 1 | 0.999997 | 0.000000 | 0.000000 | 8 |
| Option 2 | 0.014201 | 0.985795 | 0.985798 | 3 |
| Option 3 | 0.008603 | 0.991394 | 0.991396 | 2 |
| Option 4 | 0.000000 | 0.999997 | 1.000000 | 1 |
| Option 5 | 0.087532 | 0.912465 | 0.912467 | 4 |
| Option 6 | 0.329235 | 0.670761 | 0.670763 | 7 |
| Option 7 | 0.087668 | 0.912328 | 0.912331 | 5 |
| Option 8 | 0.122763 | 0.877233 | 0.877236 | 6 |
| Type | Positive Ideal Solution (D+) | Negative Ideal Solution (D−) | Composite Score | Sort |
|---|---|---|---|---|
| Option 1 | 0.999996 | 0.000000 | 0.000000 | 8 |
| Option 2 | 0.021270 | 0.978726 | 0.978729 | 2 |
| Option 3 | 0.355469 | 0.644527 | 0.644529 | 6 |
| Option 4 | 0.000000 | 0.999996 | 1.000000 | 1 |
| Option 5 | 0.327160 | 0.672836 | 0.672838 | 5 |
| Option 6 | 0.745674 | 0.254322 | 0.254322 | 7 |
| Option 7 | 0.054628 | 0.945368 | 0.945371 | 4 |
| Option 8 | 0.027390 | 0.972606 | 0.972609 | 3 |
| Type | Positive Ideal Solution (D+) | Negative Ideal Solution (D−) | Composite Score | Sort |
|---|---|---|---|---|
| Option 1 | 0.999997 | 0.000000 | 0.000000 | 8 |
| Option 2 | 0.017903 | 0.982332 | 0.982100 | 2 |
| Option 3 | 0.228091 | 0.833380 | 0.785118 | 5 |
| Option 4 | 0.000000 | 0.999997 | 1.000000 | 1 |
| Option 5 | 0.227236 | 0.800925 | 0.778987 | 6 |
| Option 6 | 0.559970 | 0.496534 | 0.469978 | 7 |
| Option 7 | 0.072725 | 0.928633 | 0.927373 | 3 |
| Option 8 | 0.085385 | 0.924837 | 0.915478 | 4 |
Disclaimer/Publisher’s Note: The statements, opinions and data contained in all publications are solely those of the individual author(s) and contributor(s) and not of MDPI and/or the editor(s). MDPI and/or the editor(s) disclaim responsibility for any injury to people or property resulting from any ideas, methods, instructions or products referred to in the content. |
© 2024 by the authors. Licensee MDPI, Basel, Switzerland. This article is an open access article distributed under the terms and conditions of the Creative Commons Attribution (CC BY) license (https://creativecommons.org/licenses/by/4.0/).
Share and Cite
Liu, Y.; Wang, W.; Huang, Y.; Song, J.; Zhou, Z. Energy Performance Analysis and Study of an Office Building in an Extremely Hot and Cold Region. Sustainability 2024, 16, 572. https://doi.org/10.3390/su16020572
Liu Y, Wang W, Huang Y, Song J, Zhou Z. Energy Performance Analysis and Study of an Office Building in an Extremely Hot and Cold Region. Sustainability. 2024; 16(2):572. https://doi.org/10.3390/su16020572
Chicago/Turabian StyleLiu, Yunbo, Wanjiang Wang, Yumeng Huang, Junkang Song, and Zhenan Zhou. 2024. "Energy Performance Analysis and Study of an Office Building in an Extremely Hot and Cold Region" Sustainability 16, no. 2: 572. https://doi.org/10.3390/su16020572
APA StyleLiu, Y., Wang, W., Huang, Y., Song, J., & Zhou, Z. (2024). Energy Performance Analysis and Study of an Office Building in an Extremely Hot and Cold Region. Sustainability, 16(2), 572. https://doi.org/10.3390/su16020572