Article

What Is the Connection? Understanding Shared Micromobility Links to Rail Public Transit Systems in Major California Cities

1
Civil and Environmental Engineering, University of California, Berkeley, 109 McLaughlin Hall, Berkeley, CA 94720, USA
2
Transportation Sustainability Research Center, University of California, Berkeley, 2150 Allston Way, Berkeley, CA 94704, USA
3
Civil and Environmental Engineering and Transportation Sustainability Research Center, University of California, Berkeley, 408 McLaughlin Hall, Berkeley, CA 94720, USA
*
Author to whom correspondence should be addressed.
Sustainability 2024, 16(2), 555; https://doi.org/10.3390/su16020555
Submission received: 16 November 2023 / Revised: 30 December 2023 / Accepted: 1 January 2024 / Published: 9 January 2024
(This article belongs to the Special Issue Innovative and Sustainable Development of Transportation)

Abstract

:
As shared micromobility (bikes and scooters) has proliferated throughout urban areas, there has been growing interest in how it facilitates connections with rail transit systems. This study explores the magnitude of interactions between shared micromobility and rail public transit systems using shared micromobility trip data and rail transit schedule data. We evaluate over one million trips from October 2019 to February 2020 in four California cities (San Francisco, Los Angeles, Sacramento, and San Jose) and develop criteria to identify trips connecting to rail transit. These include spatial and temporal rules, such as whether a trip starts/terminates close to public transit stations and whether a trip takes place when transit systems are operating. The criteria are examined via sensitivity analyses. The results indicate the degree of interaction between rail public transit and shared micromobility varies across cities and systems (i.e., docked/dockless). Most connections take place in the downtown or around public transit hubs. About 5–20% of all shared micromobility trips are identified as accessing or egressing from rail transit. These connecting trips exhibit commute-driven patterns and greater measured velocities. We conclude by examining the applicability of incorporating schedule information into the identification process of shared micromobility trips connecting to rail transit systems.

1. Introduction

As shared micromobility has expanded to most regions served by rail transit, there has been growing interest in understanding the multimodal interactions between the two modes. Beginning as bikesharing, shared micromobility has evolved from the “White Bikes” in Amsterdam to a technology-based and demand-responsive system prevailing worldwide [1,2]. Dockless scooter sharing has more recently gained popularity. Since the first launch in California over the past decade, dockless scooter sharing has attracted over six times the dockless bikesharing trips in the U.S. [3,4,5]. Overall shared micromobility ridership in the U.S. grew to a pre-pandemic high of 136 million in 2019 [5,6].
The flexibility of shared micromobility can supplement gaps and provide first- and last-mile coverage for rail transit. At the same time, rail transit can extend the travel distances that are achievable with shared micromobility modes. When integrated together, shared micromobility and rail transit can offer enhanced competition with personal automobiles and increased accessibility throughout an urban area. This phenomenon is termed by researchers as a hybrid, sustainable, and distinctive mode of transport due to the additional benefits it provides beyond those of a single mode by itself [7]. Such integration can reduce parking and traffic congestion, as well as energy use. It can also increase transportation and job accessibility for low-income or underserved households at an affordable cost [8]. While such integration can take a variety of forms, early research has found the role of shared micromobility to be both complementary (where shared micromobility links with public transit as a supporting first- and last-mile connector) and substitutive (where the trip could have been made by public transit) [9,10]. This paper is focused on identifying these complementary and substitutive effects of the integration between shared micromobility and rail transit systems in California.
As shared micromobility systems have established a strong presence within transit-rich environments, it has become increasingly important to measure the degree to which connections between the two modes are made. The effectiveness of such measurements relies on the availability of subjective and objective data [11]. Several approaches are possible. For example, to identify connecting trips, researchers can collect survey data to see if travelers report using shared micromobility as a rail public transit connector [12]. The accuracy of such data can be obscured by biases, limited survey sample sizes, and the degree to which respondents can accurately report their previous activity in a survey format. Shared micromobility activity data, where the bike or scooter trip is measured rather than the user, can be effective as well. However, heuristics identifying measurable criteria must be applied through analytical techniques to appropriately determine which trips are likely connecting to or from public transit. In fact, researchers have found that activity-data-driven methodologies are relatively limited in characterizing shared micromobility trips that connect to public transit [13]. To advance the methodologies of this latter approach (i.e., heuristic design), this study develops spatial and temporal criteria for evaluating shared micromobility activity data within four cities of California (San Francisco, Los Angeles, Sacramento, and San Jose). Spatial criteria determine if a shared micromobility trip starts or ends near a public transit station. This can be achieved by defining a buffer around each station, while the buffer can either be density-based (e.g., standard deviation ellipse) or in a fixed shape (e.g., circle) [14,15]. Temporal criteria validate the connection by verifying public transit operations at the connecting moment.
In the sections below, we first provide a review of previous literature. Second, we introduce the data employed in our analysis. Next, we present our methodological approach for identifying shared micromobility connections and substitutions. This is followed by our results and conclusions.

2. Literature Review

Researchers have been investigating the interactions between shared micromobility and public transit from various perspectives. Much of this literature has focused on bikesharing, as shared scooters are a more recent phenomenon. In 2011, Martin and Shaheen conducted surveys of bikesharing members in Washington, D.C. (n = 5428), and Minneapolis (n = 1238) [9]. The authors found that bikesharing enabled relatively more public transit access and egress trips in lower-density areas relative to high-density areas. Ma et al. modeled the Washington, D.C., Metrorail ridership data in 2013 with several environment characteristics (e.g., bikesharing ridership) using ordinary least squares [16]. They found that public transit and bikesharing ridership were positively correlated. Griffin and Sener plotted the ridership of bikesharing and rail transit systems in Austin, Texas, and Chicago, Illinois, during 2013 and 2014 [17]. They found the relationship between the two systems was weak and suggested using collaborative planning to encourage more integrated use. In European countries with earlier adoption of bike travel, researchers examined several pilot projects and emphasized investing in bike parking facilities near train stations to enhance the integration of bike and rail public transit [18]. These studies used aggregate ridership data or survey data, which necessitate a closer look at the dynamics around specific public transit stations.
Several studies developed approaches to identifying first- and last-mile trips using data from local bikesharing operators. Gu et al. analyzed the bikesharing usage data provided by the urban management bureau of Suzhou, China, and found that bikesharing ridership sharply increased after the introduction of a new public transit line [19]. In Shenzhen, China, researchers defined a “parking ring” around each public transit station using density-based classification, within which the connecting bikesharing trips were detected [20,21]. They found that stations that attract connecting trips were generally closer to the urban core or had more shared bikes available nearby. In Nanjing, China, several studies were empowered by smartcard data logging both bikesharing and rail transit trips. Ma et al. defined a maximum transfer distance of 300 m and observed that connecting trips generally occurred less than six times per three weeks [15]. They further computed the bikesharing activity space at each station and concluded that the space was smaller in the downtown, which reinforced the results of other studies showing that connecting trips were shorter in the urban core [22,23]. These studies also found that the connecting activity exhibited a two-peak pattern on weekdays and was attracted by mixed land uses with better job accessibility [15,20]. While buses are not considered relevant to the literature search in this paper, a few studies incorporated bus hubs as part of their explorations. For example, a similar parking ring or catchment area of several hundred meters was applied to each bus hub to categorize trip connections [24,25].
In addition to trip activity, the inclusion of public transit schedules could further enhance the identification approach. For example, Ma et al. applied a maximum transfer time of ten minutes [15]. In Montreal, Canada, researchers evaluated the trips using bikesharing as both an access and egress mode in a single public transit trip [26]. These trips were identified only if they occurred during public transit operating hours. Pritchard et al. studied public transit trips accessed by personal bicycle (not bikesharing), but they proposed that transit schedule information from the General Transit Feed Specification (GTFS) could potentially be efficient in incorporating temporal variability [27]. In Boston; Chicago; Washington, D.C.; and New York City, Kong et al. used GTFS data to identify docked bikesharing and public transit integration, where only the transfers within ten minutes of a train arrival or departure and within 100 m of a station were included [28]. In addition to integration (where bikesharing was an access or egress mode), they also studied substitution (where a bikesharing trip substituted for public transit) and complementarity (where bikesharing served less transit-rich areas). The results indicated a higher frequency of integrated use on weekdays versus weekends, and such integration was mostly observed among subscribers (versus regular customers) for weekday commute trips.
Fewer studies included scooters in the analyses. In Oslo, Norway, Fearnley et al. performed a survey among users of scooter sharing and found that 26% of them used scooters in combination with metro, tram, or train in their last trip [29]. In the U.S., Azimi et al. conducted an on-board survey in Orlando, Florida. Micromobility (e.g., personal and shared bikes, scooters) accounted for a non-trivial share (2.2% to 2.6%) of connecting trips [30]. In European countries, Esztergár-Kiss and Lopez Lizarraga concluded from a survey that scooters may present a substitution effect and pull users from public transit [31].
Given that most studies focus solely on spatial identification, this paper aims to enhance classification accuracy by incorporating temporal criteria to identify shared micromobility and rail public transit connections. This is a seemingly similar method to that of Kong et al. but with considerable variations [28]. For example, as opposed to using docked bikesharing data from two days, this study evaluates both docked and dockless shared micromobility data from both bike and scooter systems over several months in West Coast cities. This study is aimed at developing and justifying the methodological approach that identifies connections and substitutions. In addition to analyzing data from OpenStreetMap and data derived from the General Bikeshare Feed Specification (GBFS), we evaluate the further incorporation of GTFS information to refine the identification process. Next, we present our methodology and results, which are followed by a discussion of spatial and temporal patterns associated with shared micromobility and rail public transit connections.

3. Methodological Overview

In this study, we evaluate the interaction between shared micromobility and rail transit primarily by computing the percentage of trips serving as rail connections. We develop a method for identifying such connections using shared micromobility activity data. This method can assist in monitoring and assessing the extent to which shared micromobility systems facilitate connections across systems over time.

3.1. Data Description and Preprocessing

The primary data source for this study was extracted from the GBFS, a standardized shared micromobility trip data structure [32]. This structure allows for the extraction of basic activity details such as trip start and end locations, timestamps, and vehicle (bike or scooter) IDs. For this study, we evaluate data rendered from the GBFS structure for systems within four California cities (San Francisco, Los Angeles, Sacramento, and San Jose) with rail public transit systems.
In addition, this study uses information derived from the GTFS, another data structure reporting public transit information [33]. This data structure contains train arrival and departure times, locations of public transit stations, and service start and end dates of transit routes. We use the GTFS schedule information to check if a potential connecting trip occurs during public transit operations. In this analysis, the GTFS structures that we applied were from the following public transit agencies:
  • San Francisco: Caltrain, Bay Area Rapid Transit (BART) District, San Francisco Municipal Railway (Muni);
  • Sacramento: Sacramento Regional Transit District (SACRT);
  • Los Angeles: Metrolink, LA Metro Rail;
  • San Jose: Valley Transportation Authority (VTA).
The road network files with OpenStreetMap were used to define the routes and distances traveled between the origins and destinations of the micromobility trips. Before the analysis, we removed trips faster than 30 km/h and those longer than 60 min. Our assumption about the upper bound of speed is supported by Road Bike Rider, which reported that most cyclists ride between 16 and 29 km/h [34]. Furthermore, a California law in 2019 prohibited scooters from going beyond 24 km/h [35]. Regarding the trip duration, Martens found that most bike trips accessing public transit were less than 6 km in the Netherlands, Germany, and the UK [36]. Fearnley et al. found that last-mile trips by shared scooters were on average one kilometer long in Oslo, Norway [29]. While the biking and scootering environment in Europe differs from California, these conservatively inform an upper bound of trip duration at 60 min, considering that shared micromobility trips are oftentimes not continuous.

3.2. Categorizing Rail Transit Connection Trips

The shared micromobility activity data enable the possibility to identify trips likely connecting to rail transit. We apply our methodology to rail (versus bus) systems in metropolitan regions, as bus stations are too densely distributed in the urban landscape for connecting trips to be attributed to. Although connections to buses occur, those trips might be less frequent than rail transit connections because rail travel adds to longer distances and greater velocities. Despite this potential caveat, some existing studies have attempted to apply spatial identification methods to regional bus hubs, signaling the potential generalizability of this study to a broader range of public transit providers in the future [25].
The application of activity data for this purpose relies on establishing a collection of reasonable criteria to identify the connecting trips. The logic and parametrization of these criteria are discussed in the following subsections.

3.2.1. Trip Origin/Destination Distance from a Nearby Rail Transit Station

The methodology implements a circular zone (an access/egress zone) centered at each public transit station. Selecting an appropriate radius for this circle often presents a notable challenge. This is primarily because the surrounding land use context of each rail transit station tends to differ from that of the others, and some stations may inherently draw more connections when situated in densely populated areas. Nevertheless, this radius is also adaptable and can be customized to suit the specific circumstances of various settings, such as suburban or rural environments.
With substantiated backing from the literature, the radius of this circle is established at 100 m [26,28]. The distance is chosen so as to select trips that are near enough to the station to be likely connecting to a transit location. A buffer too large would include the consideration of trips that are destined for other locations, while a buffer too small would exclude trips that are legitimately connecting to the station. While there is no fixed buffer radius that would perfectly contain all transit-connecting trips and exclude all non-connecting trips, recent research supports the assumption that this buffer would serve as a lower bound to identify connections [26,28]. A radius-based sensitivity analysis is further conducted to depict the general number of spatially connecting trips under different sizes of these access/egress circles, where:
  • Egress trips are likely to start within this circle;
  • Access trips are likely to terminate within this circle;
  • A trip is likely connecting to the closer station if its origin or destination falls within multiple circles.

3.2.2. Identifying Substitution Trips for Rail Public Transit

The way in which a shared micromobility trip trajectory aligns with rail transit systems informs whether the trip could have been served by the rail network instead. Such a trip is categorized as a substitution for (versus connection to) rail transit if both of its start and end points are located within the access zone or egress zone of two different stations.
Similarly, a radius-based sensitivity analysis is employed to examine the number of potential substitution trips in greater detail.

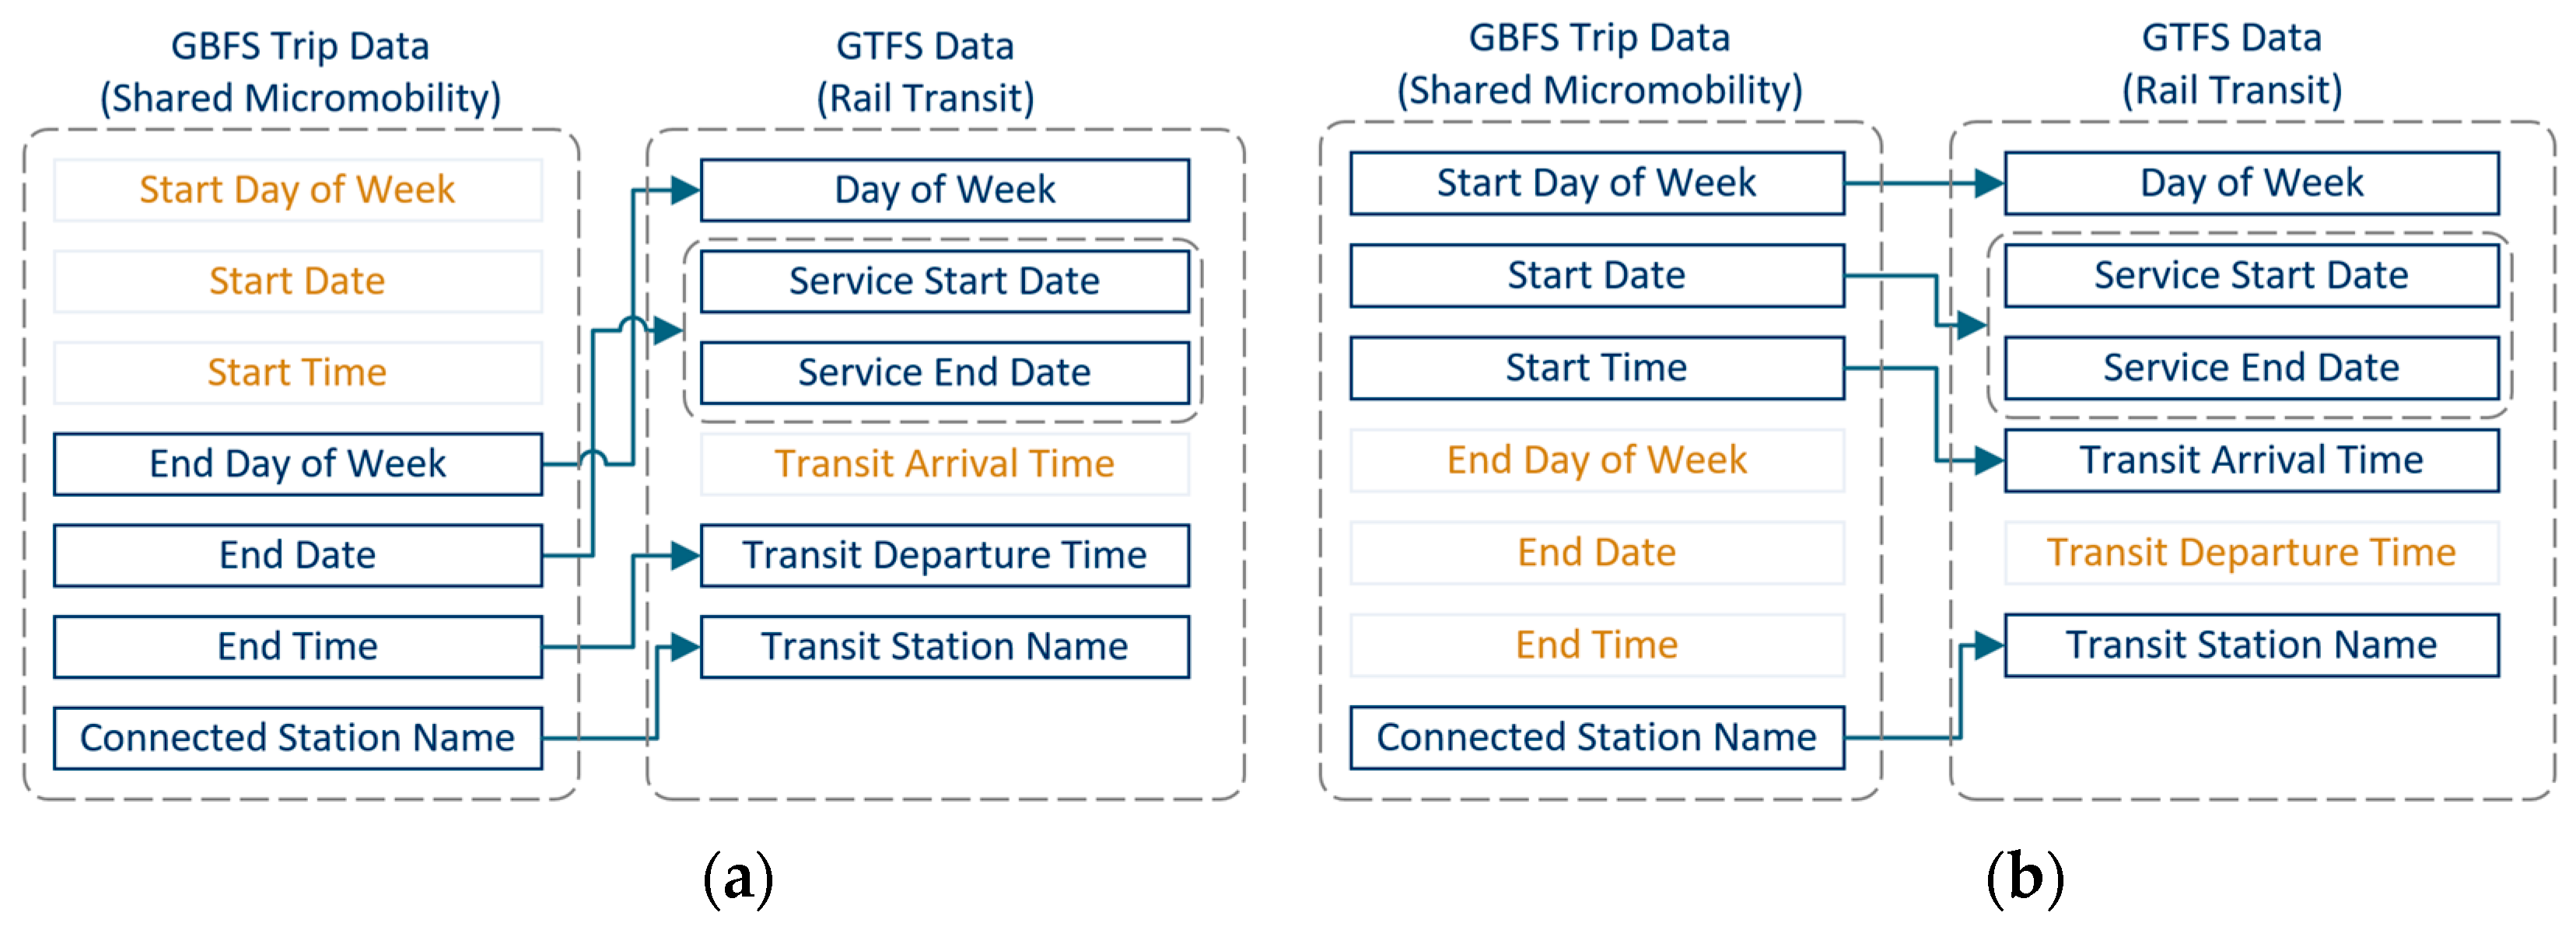
3.2.3. Identifying Trips Occurring during Transit Schedules

Trips identified through the specified spatial criteria will undergo additional evaluation to determine if they further satisfy the temporal criteria. Using the schedule information from GTFS, we define a ten-minute time interval. That is, access trips should terminate within ten minutes before the departure of a train, while egress trips should start within ten minutes after the arrival of a train. This excludes trips occurring beyond transit operating hours or during the dead space between train headways. The threshold of ten minutes matches that of Kong et al. and can be adjusted as needed [28]. Furthermore, the selection of the ten-minute threshold has been scrutinized via a time-based sensitivity analysis that simulates the potential number of remaining connecting trips that also fall within a range of time thresholds.
This study evaluates the impacts of these additional temporal criteria on the identification process versus just using spatial criteria. Figure 1 demonstrates the integration of rail transit schedules (GTFS) with shared micromobility activity data (GBFS), which enhances the process of identification.
In summary, rail public transit connecting trips are defined as those that (1) are not faster than 30 km/h, (2) take no longer than 60 min, (3) start or end within a spatial bound of the station, (4) are not substituting for transit, and (5) meet the temporal criteria of aligning with GTFS activity.
While data do not presently exist to definitively distinguish the connecting trips, those that do connect would generally align with this heuristic. That is, absent a definitive indicator of which trips are indeed connections, this method provides an opportunity to estimate the scale of interaction between shared micromobility and rail transit systems even with limited data availability. We normalize trips meeting these criteria as a percentage of total shared micromobility trips, providing a quantifiable measure of the extent to which potential connections to rail transit occur across systems over time. In the following section, we present the computation results and measurements of the trips.

4. Results and Discussion

San Francisco and Los Angeles were the only cities among the four with both docked and dockless systems in the dataset. In Sacramento, all systems were dockless, while San Jose had only one docked system. Overall, about 1,180,960 trips were assessed between October 2019 and February 2020, preceding the onset of the COVID-19 pandemic and the announcement of the California Stay Home Order [37]. Table 1 presents the basic information of the shared micromobility systems.

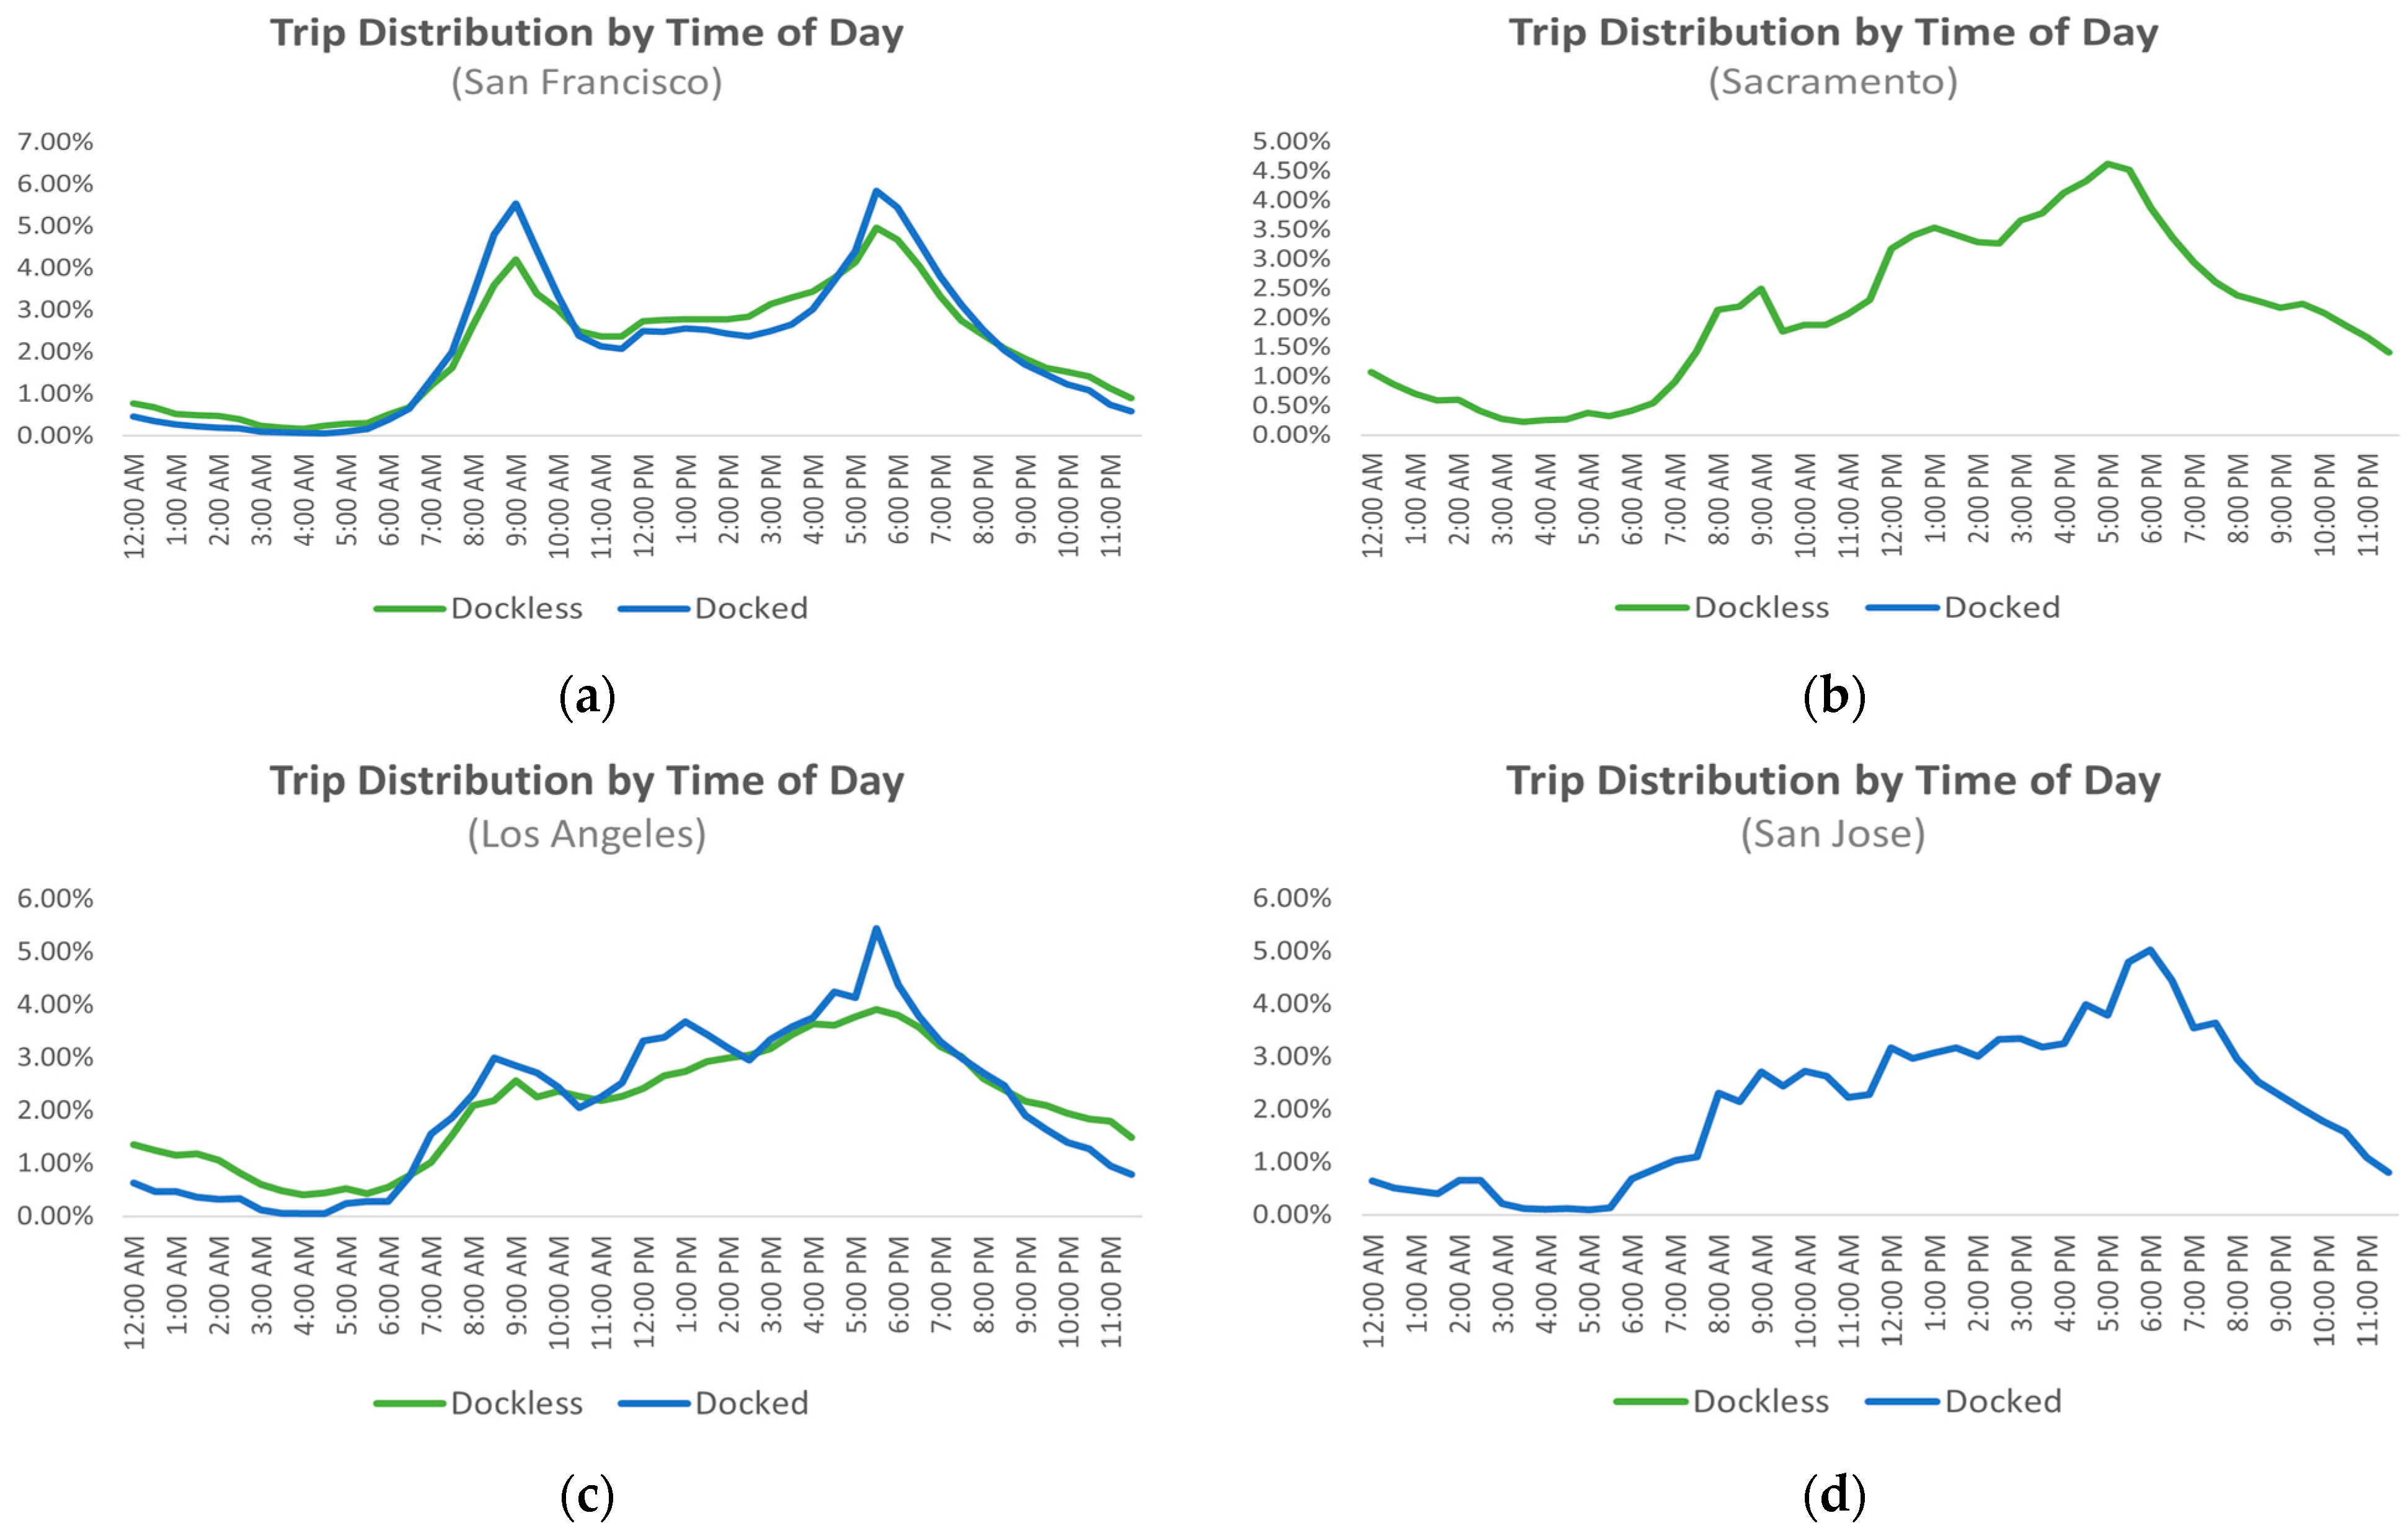
4.1. Characteristics of All Trips

Prior to analyzing the connecting trips, we examined the weekly and diurnal patterns of all trips, distinguishing between docked and dockless systems. We present the results as percentages within each city and system.
Monday through Wednesday witnessed a higher percentage of dockless (versus docked) trips in San Francisco, with the trend reversing as the week progressed. In Los Angeles, docked systems served more trips from Tuesday through Friday, with the overall usage being consistently high between Wednesday and Friday.
From weekdays to weekends, docked systems presented a sharp drop in trips. No similar patterns were observed in dockless trips, except for in San Francisco where trips in both systems dropped on weekends. One explanation is that docked devices were preferred for commute trips with fixed origins and destinations, while dockless systems remained popular for weekend recreational use.
Figure 2 presents the diurnal patterns of trip activity in 30-min intervals.
Overall, trip activities were inactive between 3:00 AM and 6:00 AM. During the morning (9:00 AM) and afternoon (5:30 PM) rush hours, systems in San Francisco reveal spikes that are likely driven by commuting. In contrast, activities in other cities presented no obvious peaks and predominantly occurred during the daytime (8:00 AM–6:00 PM), following an ascending trend. Nonetheless, dockless Sacramento trips and docked Los Angeles trips exhibit marginal increases during morning (8:00 AM–9:00 AM), noon (12:00 PM–1:00 PM), and evening (5:00 PM–6:00 PM) hours. Dockless service appeared to be more popular at late night or in the early morning (9:00 PM–5:00 AM). This could be attributed to the recreational nature of this mode. For instance, the percentages of dockless trips surpassed those of docked trips during this period in cities with both docked and dockless systems.
As we explained in the methodological discussion, the imputation of trip distances using the shortest street-network-based distance was conducted. These distances present a distribution skewing to the right. Users of shared micromobility systems traveled with a shared bike or scooter for 1890 m on average, which is greater than the median distance (1552 m). Notably longer docked trip distances were observed in both San Francisco (2296 m vs. 1818 m) and Los Angeles (1602 m vs. 1125 m). One contributing factor may be the absence of the obligation to return a dockless bike or scooter to a fixed dock, providing the freedom for more trips with shorter ranges. On average, trips in San Francisco were the longest (2198 m), followed by San Jose (1630 m), Sacramento (1440 m), and Los Angeles (1229 m). The distribution of trip duration also skews to the right, with an average of 11 min and median of 9 min. The velocity of trips generally follows a symmetric distribution and on average is 11 km/h.
Comparisons were also made between dockless bikes and scooters. Generally, trips completed with dockless bikes appear to be longer than those with scooters in distance (1974 vs. 1172 m) and duration (15 min vs. 8 min). This finding remains consistent across all cities where both dockless bike and scooter systems are present. In terms of the velocity of dockless trips, however, no clear distinction is observed (i.e., on average, bikes are at 9.4 km/h and scooters are at 9.8 km/h) (Figure 3).

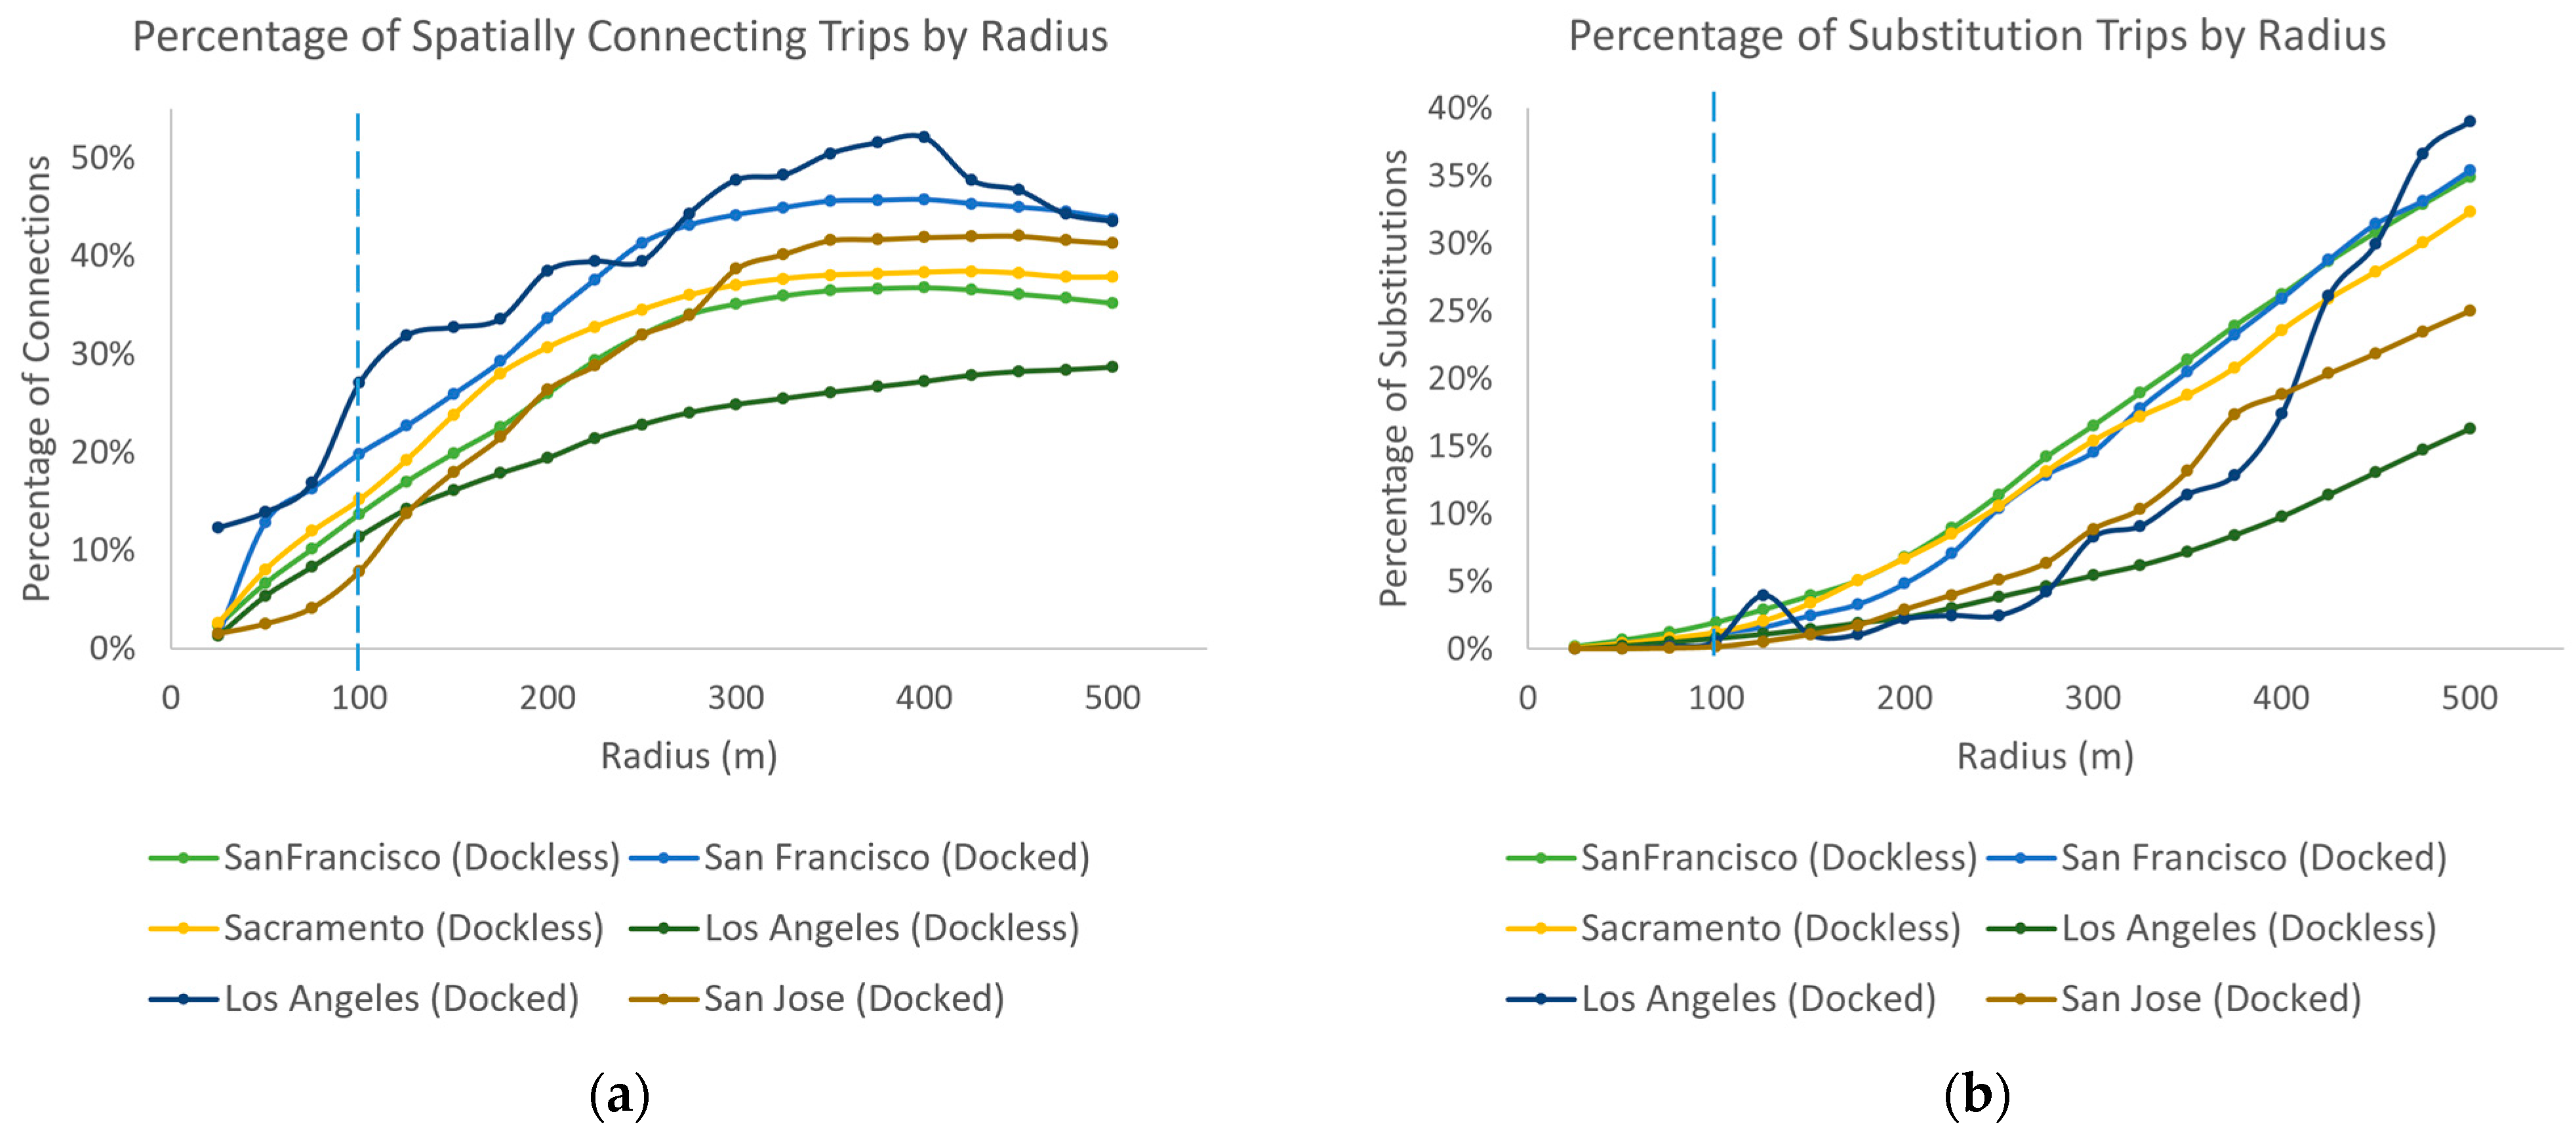
4.2. Sensitivity Analysis of Trips Connecting to Public Transit

This study employs both spatial and temporal criteria to categorize shared micromobility trips that are connecting to rail public transit. In this process, it is essential to establish a properly sized access/egress zone and a time threshold that can effectively narrow the trips down within the transit operating hours. We conduct radius-based and time-based sensitivity analyses to further evaluate these criteria.
As observed from Figure 4a, the proportion of spatially transit-connecting shared micromobility trips rises to 10–30% when the radius is set at 100 m. However, this percentage starts to decrease as the radius exceeds around 400 m. The primary reason for this decline is that transit-substituting trips increase at a more rapid rate as the radius expands (Figure 4b). These substitution trips are not categorized as transit connections in this study and are thus excluded from the subset. Meanwhile, the access/egress zones will start overlapping with one another when the radius is greater than half the spacing between stations, and thus, this is not considered a reasonable radius either.
Assuming the spatial bound is fixed at 100 m, we further evaluate the time sensitivity by varying the temporal threshold from 2 to 45 min (Figure 5). That is, we evaluate the time elapsed from the termination of a transit-accessing shared micromobility trip to a transit train departure, or from a transit train arrival to the origination of a transit-egressing shared micromobility trip. The results are presented as the percentage of spatially connecting trips that are further classified as transit-connecting given the GTFS schedule.
When the temporal threshold is fairly small (e.g., 2 min), there is already a considerable number (e.g., about 20–60%) of spatially connecting trips that fall under the operating hours of rail public transit systems. These might include situations where an individual exits a train and then picks up a shared bike or scooter right next to the transit station, or when they lock a bike/scooter close to the station only two minutes before boarding a departing train. This percentage increases with the increase in the temporal threshold and stops increasing when the threshold reaches the train headway, which is usually 10 to 30 min. In Sacramento, for example, SACRT trains are dispatched at both 15- and 30-min headways, and thus a tipping point is observed at both the 15- and 30-min thresholds in Figure 5 [38]. This implies that it is impractical to extend the temporal threshold beyond 30 min. In such circumstances, an accessing trip technically has the potential to connect to both the current and the next train, but it would most possibly only connect to the train that departs sooner.
Another finding is that these percentages do not always converge to 100% even when the thresholds are increased to the maximum. Several factors could account for this observation. Some of these spatially connecting trips take place between 1:00 AM and 5:00 AM when rail public transit systems only offer limited operations. Another possibility is that the currently available GTFS data do not cover the day of the week or the date on which the shared micromobility trip occurred. In fact, bikesharing and scooter sharing activities are rarely observed between 1:00 AM and 5:00 AM (see Figure 2), meaning that the latter reason is the predominant cause. This suggests that GTFS information is incomplete in cities such as San Francisco and San Jose, where the percentage of temporally connecting trips over spatially connecting trips only converges to 70–90%. This time-based sensitivity analysis can therefore also serve as a means of evaluation for GTFS data completeness.

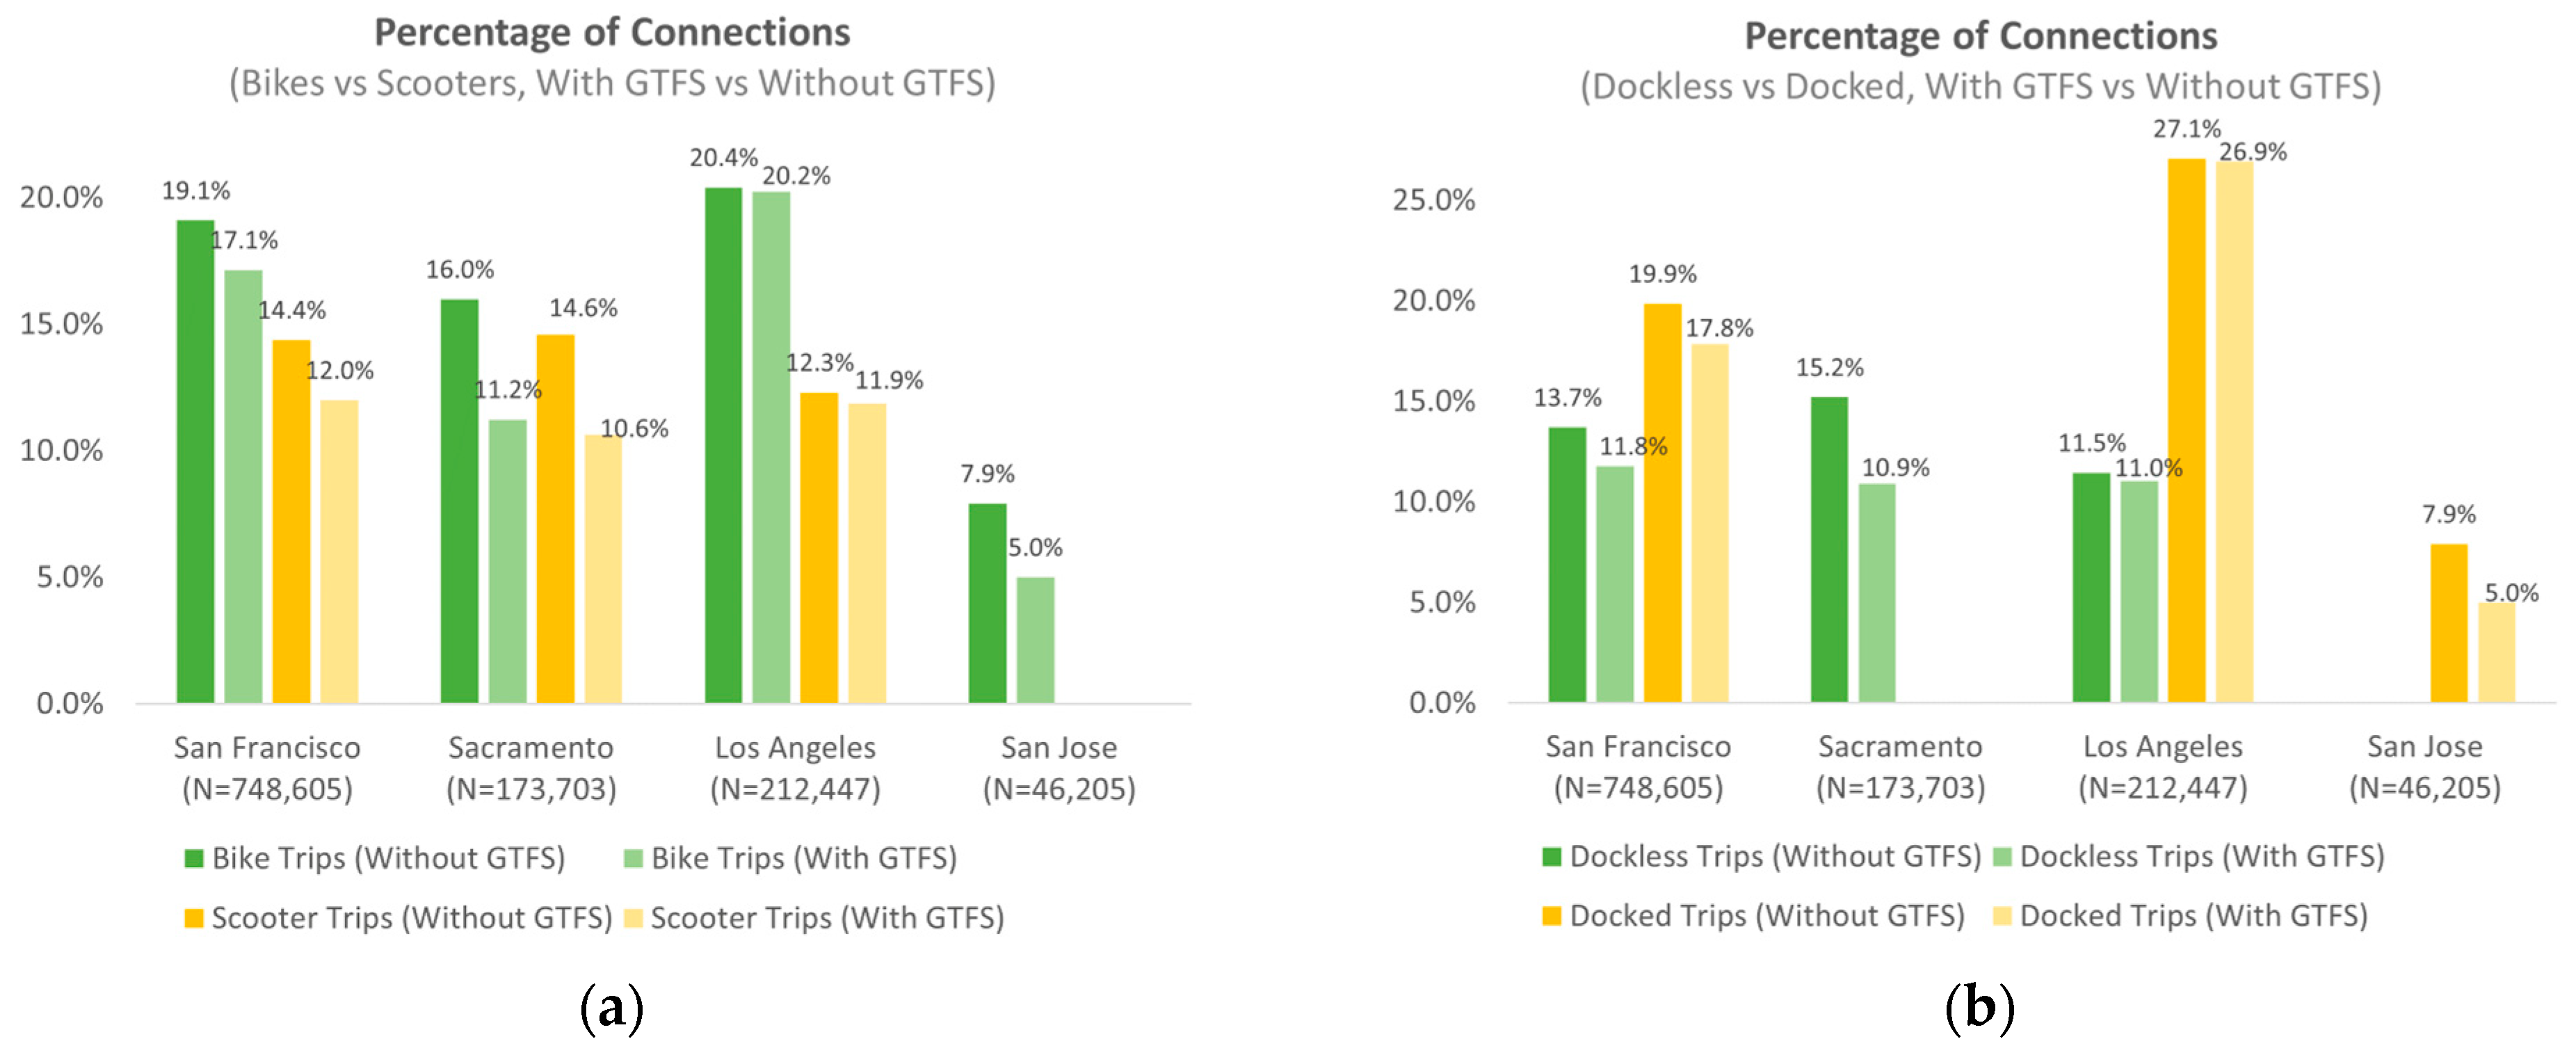
4.3. Percentage of Shared Micromobility Trips Connecting to Public Transit

Each city underwent an evaluation using two identification procedures. The first one implements all criteria outlined in the methodology where the GTFS schedule data were excluded. These trips are categorized as spatially connecting to rail public transit (see darker colors in Figure 6). The second approach incorporates GTFS, which further considers trips that fall within the connection-associated ten-minute windows (see lighter colors in Figure 6). Using the first methodology, access and egress trips respectively comprised 8.7% and 8.3% of all trips, whereas the second methodology identified 7.7% access and 7.3% egress trips. Generally, when all connections were summed up across cities, it was found that more bike trips were identified as connections than scooter trips. For example, when GTFS information was not considered, 18% of all bike trips were found to be connections versus 13% of all scooter trips. With GTFS information considered, both of these aggregate percentages dropped by 2%.
Absent the application of GTFS information, San Francisco exhibited the highest percentage of trips that are spatially connecting to public transit (e.g., 18.6%, averaged across bikes and scooters). San Jose, likely due to its lower population density and the predominant auto-oriented nature of the surrounding land use, recorded the lowest percentage (e.g., 7.9%, exclusively bikes). In San Francisco and Los Angeles, a much greater percentage of docked (versus dockless) trips seemed to connect to public transit, especially in Los Angeles (27% versus 11%). However, this does not necessarily imply a common inclination toward using docked services for connecting trips. For instance, the docked system in Los Angeles is integrated by the local transit agency into the public transit system [39]. The docks are therefore likely to be sited close to public transit stations.
When GTFS-based information was applied to the methodology, the percentages became smaller given that the temporal criteria added a tighter constraint. Yet, the extent of reduction in these percentages varies from city to city. Los Angeles preserved nearly all (96%) connections identified by the spatial criteria, while San Francisco reflected 85%. In contrast, more significant reductions were observed in environments with less rail transit richness, where only 72% and 63% of spatially defined trips were retained in Sacramento and San Jose under the GTFS constraints. As observed in the sensitivity analysis, we should note, however, that we encountered some missing train arrival/departure times and missing schedules on certain days of the week in several cities (e.g., primarily San Jose), which led to lower reliability in those estimates. This raises a caveat regarding the utilization of GTFS information in this methodology. As GTFS data were sometimes incomplete in certain environments, a more generic methodology might have to depend more exclusively on spatial rules in these areas.

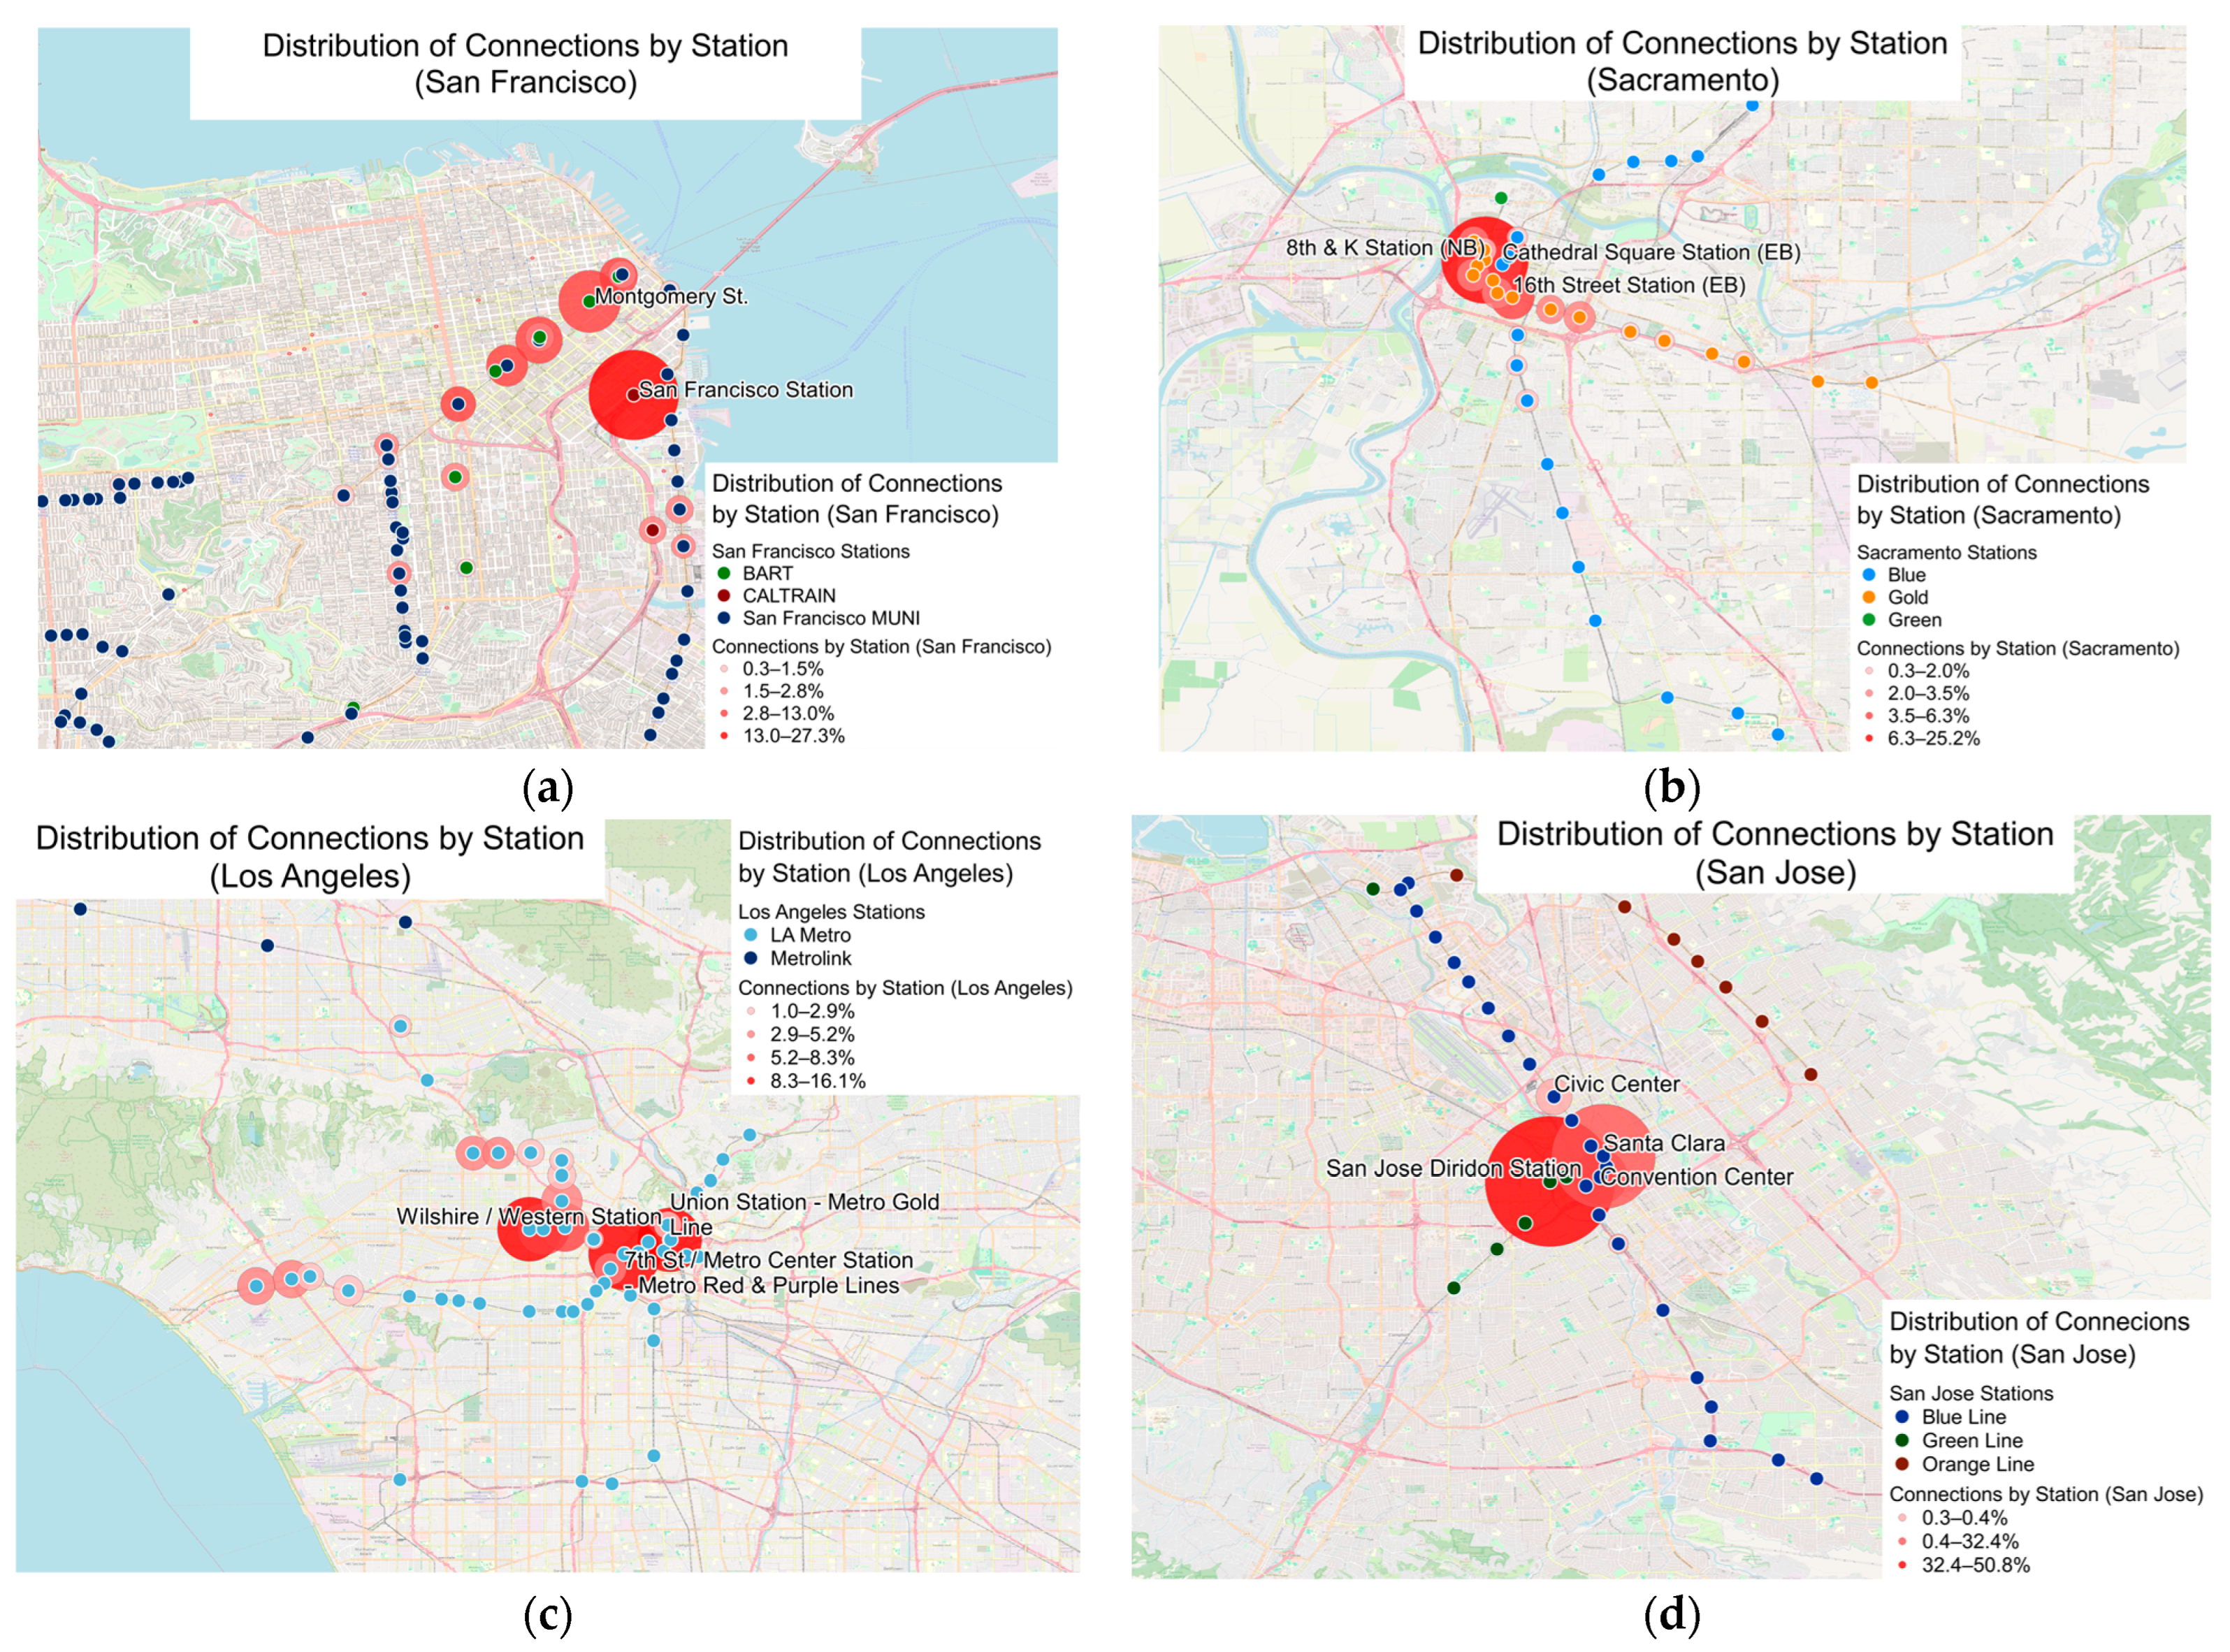
4.4. Spatial Distribution of Identified Connecting Trips

Examining a subset of identified public transit connecting trips, we further explored the dynamics by visualizing the geographic distribution in each of the four cities (Figure 7). Nearly every station recorded at least one trip, while a few captured a more substantial share. As expected, stations with the highest proportion of connecting trips were typically located in downtown regions or around crucial public transit hubs (e.g., San Francisco Station of Caltrain). In Sacramento, connecting trips were also identified along the city’s Gold Line.
In Figure 7, the dots represent the rail transit stations, while the red bubbles denote the number of trips that connect to a given station as a percentage of the total connecting trips (rather than the percentage of all trips as discussed in previous sections) in each city. Due to significant variations in percentages among stations (e.g., from 0.3% to 50.8% in San Jose), we applied a square root operation to ensure the visibility of smaller bubbles.
Nearly 30% of the connections were concentrated around San Francisco Station of Caltrain. Along Market Street, BART stations (e.g., Montgomery Station (13.0%)) also attracted a great portion of connecting trips. Only a few trips were identified as connecting to Muni stations, primarily those in proximity to Caltrain or BART lines.
In Sacramento, approximately 25% of all connections were identified at 8th & K Station in the downtown area. Notably, nine out of the ten stations with the most connections were along the Gold Line which extends along Highway 50, with one of those connections leading to the Amtrak Sacramento Valley Station, attracting 3.0% of all connecting trips.
In Los Angeles, the 7th St/Metro Center Station (16.1%) was the most popular and also located in the downtown. Other stations around the downtown area, such as Union Station (12.7%), were favored as well. However, with the exception of Union Station, we did not observe connections to Metrolink. This discrepancy might be due to the fact that Metrolink primarily serves longer-distance travels as a commuter rail service, whereas LA Metro includes light rail and rapid transit. Additionally, Metrolink stations are less ubiquitous in the city center and are situated farther from areas where shared micromobility systems operate. In contrast to other cities, a significant portion of connecting trips took place close to the termini of a few transit lines. For example, to the west, approximately 4.3% of connections were around Expo/Bundy Station, the nearest station to Santa Monica. In the northwest, the Hollywood/Highland Station adjacent to West Hollywood contributed 3.6% of the connecting trips. This pattern was partly influenced by the distinctive multi-hub nature of the metropolitan region of Los Angeles.
The identified connecting trips were highly concentrated in San Jose, with San Jose Diridon Station contributing 50.8% of all connections. As a central passenger depot serving Caltrain, Altamont Corridor Express, VTA, and Amtrak, it plays a crucial role in transporting passengers to the downtown. Likewise, 32.4% of the connections were identified at Santa Clara Station. Both stations are integral components of the Silicon Valley BART extension program [40]. Moreover, Convention Center Station (8.8%) and Civic Center Station (3.9%) also contributed a considerable share of transit connecting trips.
As discussed in the methodology, trips that substituted for rail transit were not categorized as connections. Nonetheless, it is worth noting the characteristics of those trips. Table 2 presents the pairs of stations where most substitutions took place.
Rail trip substitutions accounted for about 1.3% of all trips in San Francisco and Sacramento, while percentages in Los Angeles and San Jose were lower (e.g., below 0.8%). This differs from the patterns of connections (Figure 6) where Los Angeles outperformed Sacramento, which might indicate that people in Los Angeles were more inclined to use rail transit for a trip that could be completed with shared micromobility. In San Jose, the network topology of rail transit lines was simpler (and more spread out within the operating region) compared to other cities, which might contribute to a limited percentage of substitutions.
In San Francisco, four out of the five pairs of stations where most substitutions occurred involved the San Francisco Station of Caltrain. A radial pattern was observed between this station and surrounding ones such as Montgomery Station of BART and Van Ness Station of Muni (these are connected across systems). These four pairs accounted for 24% of all substitutions. The trips along Market Street also played a significant role. A similar pattern was found in Sacramento where 8th & K Station, the terminal station of the Gold Line, attracted a combined 36% of all substitutions.
In Los Angeles, docked trips mostly substituted for rail transit in the downtown (e.g., between 7th Street/Metro Center Station and Pico Station), while dockless substitution trips usually occurred around West Hollywood (e.g., between Hollywood/Highland Station and Hollywood/Vine Station).
The passenger depots in San Jose identified in Figure 7 (e.g., Diridon Station) were found to attract the most substitutions as well. The most popular pair was between Diridon Station and Race Station, contributing to 20% of the substitutions. The average substitution distance of the top five pairs was the longest in San Francisco (2.2 km), with San Jose at 1.8 km, Los Angeles at 1.4 km, and Sacramento at 0.8 km.

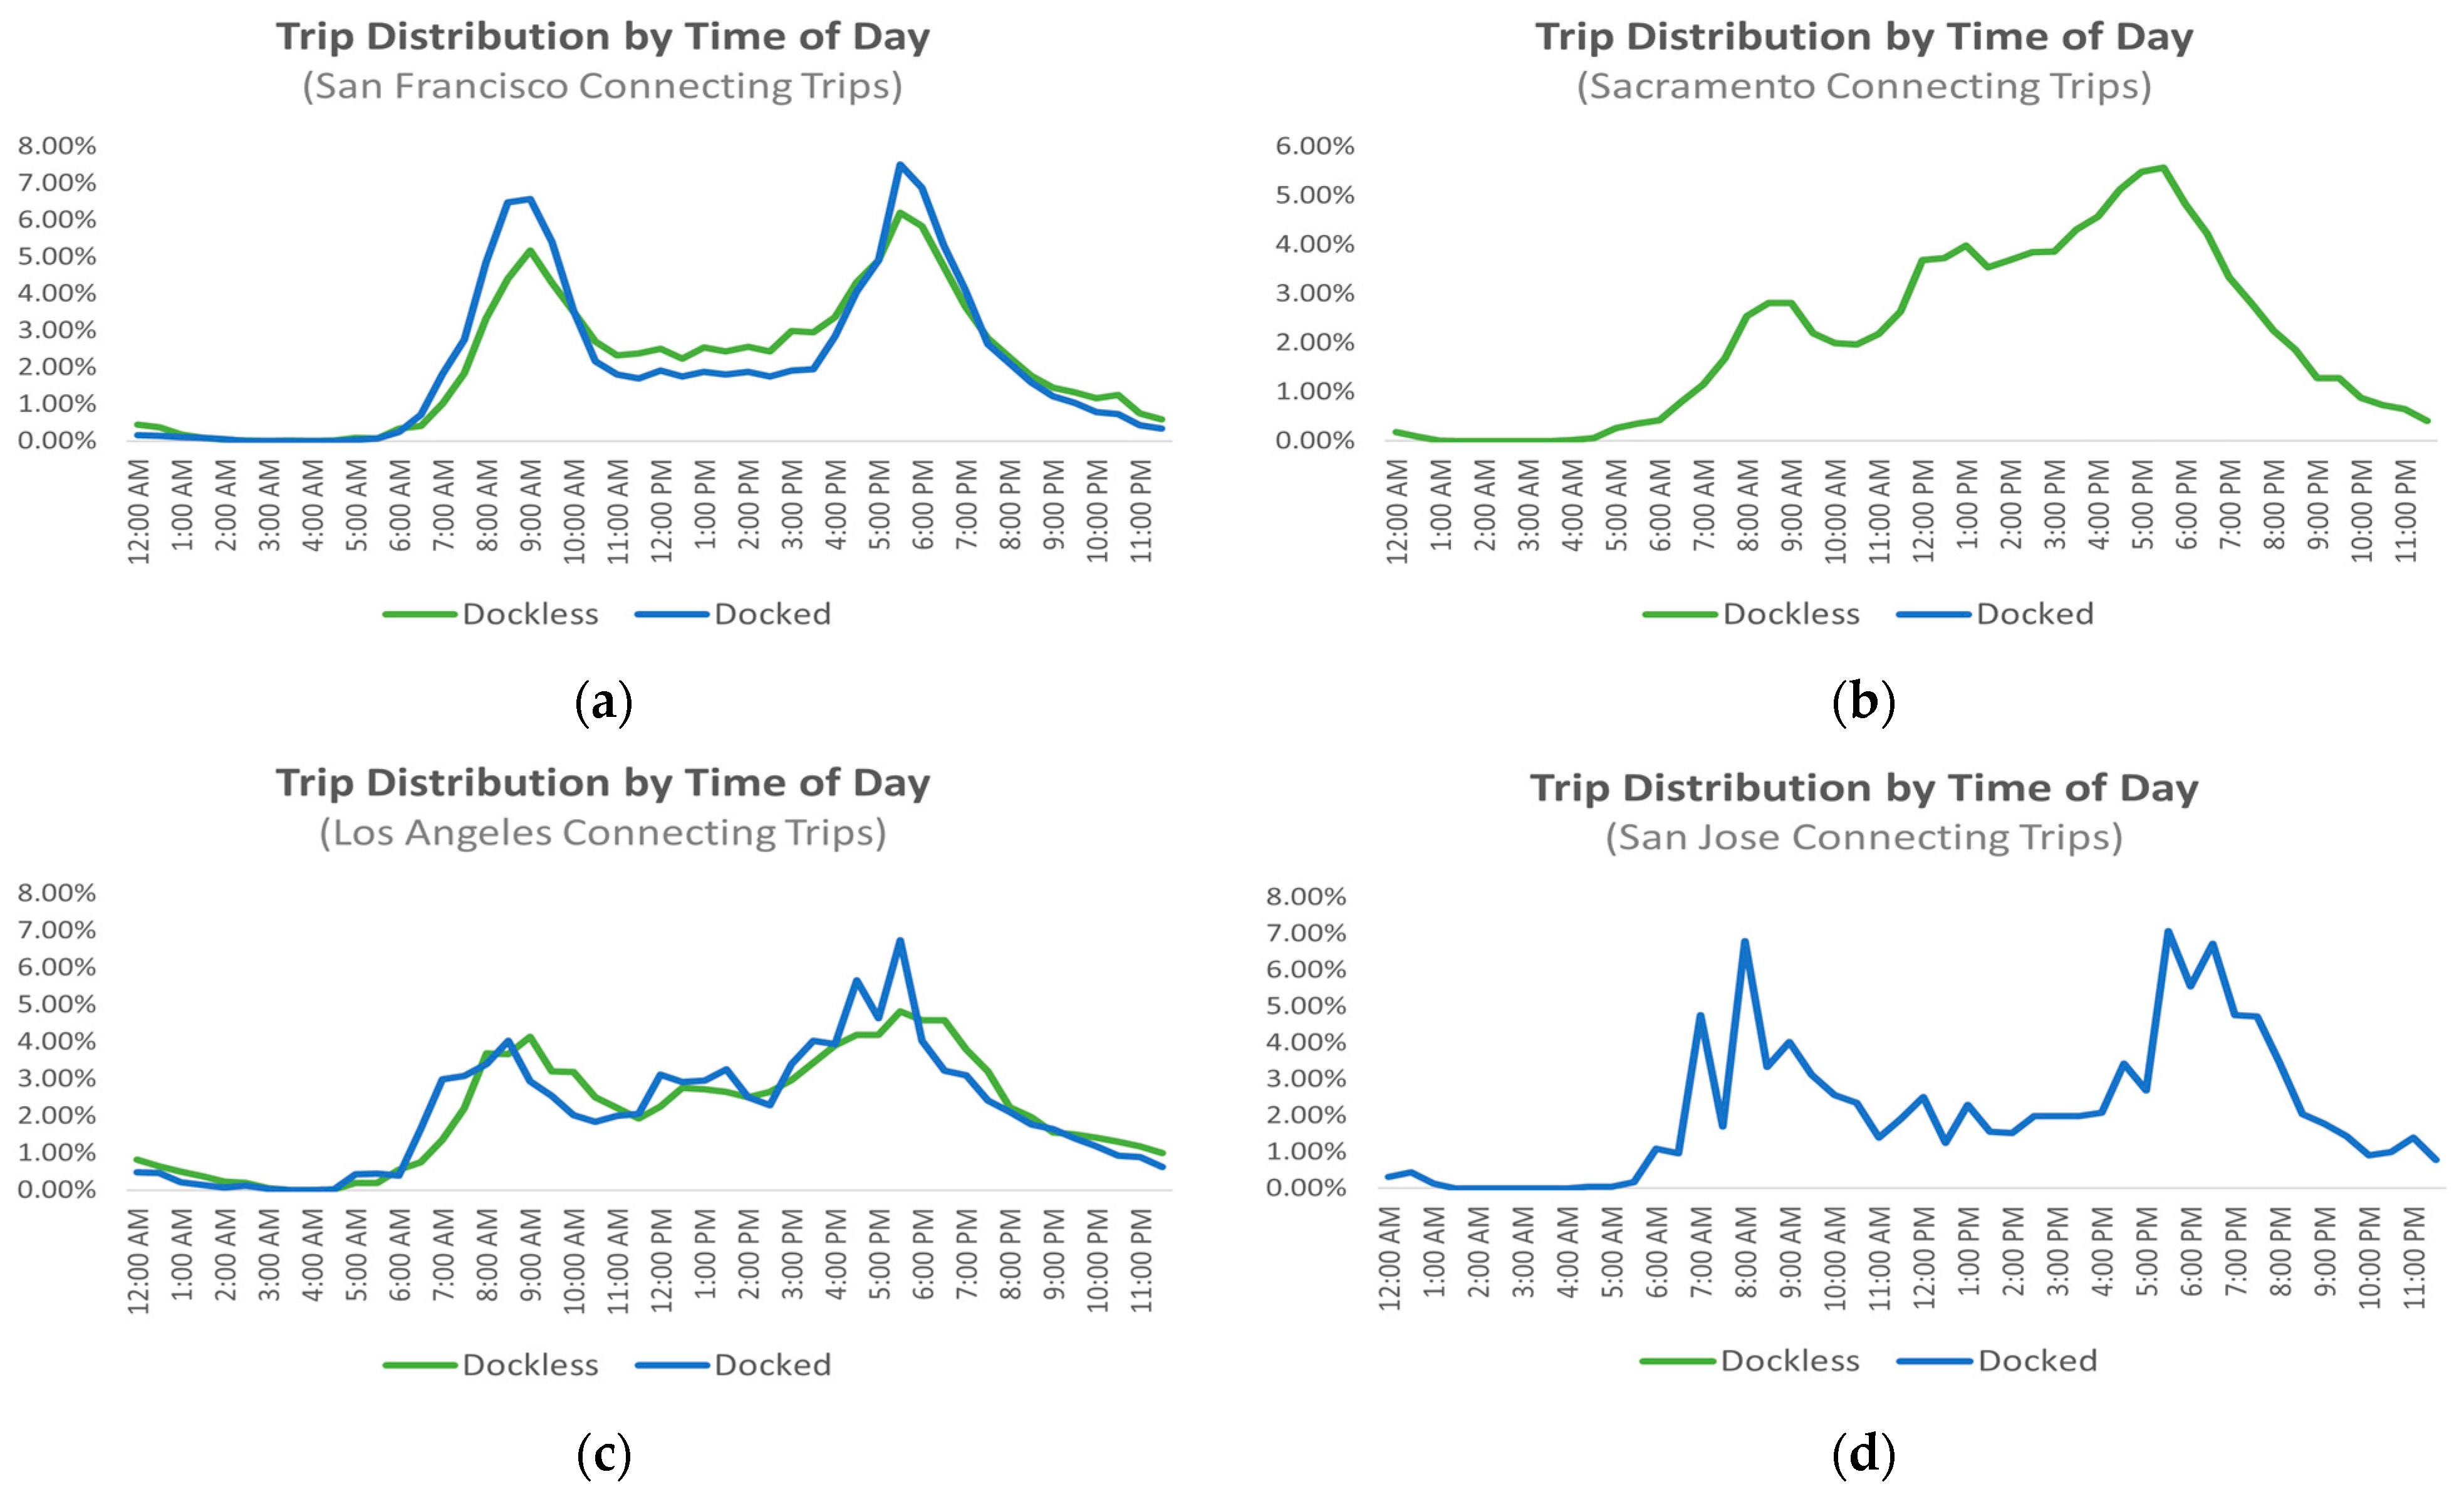
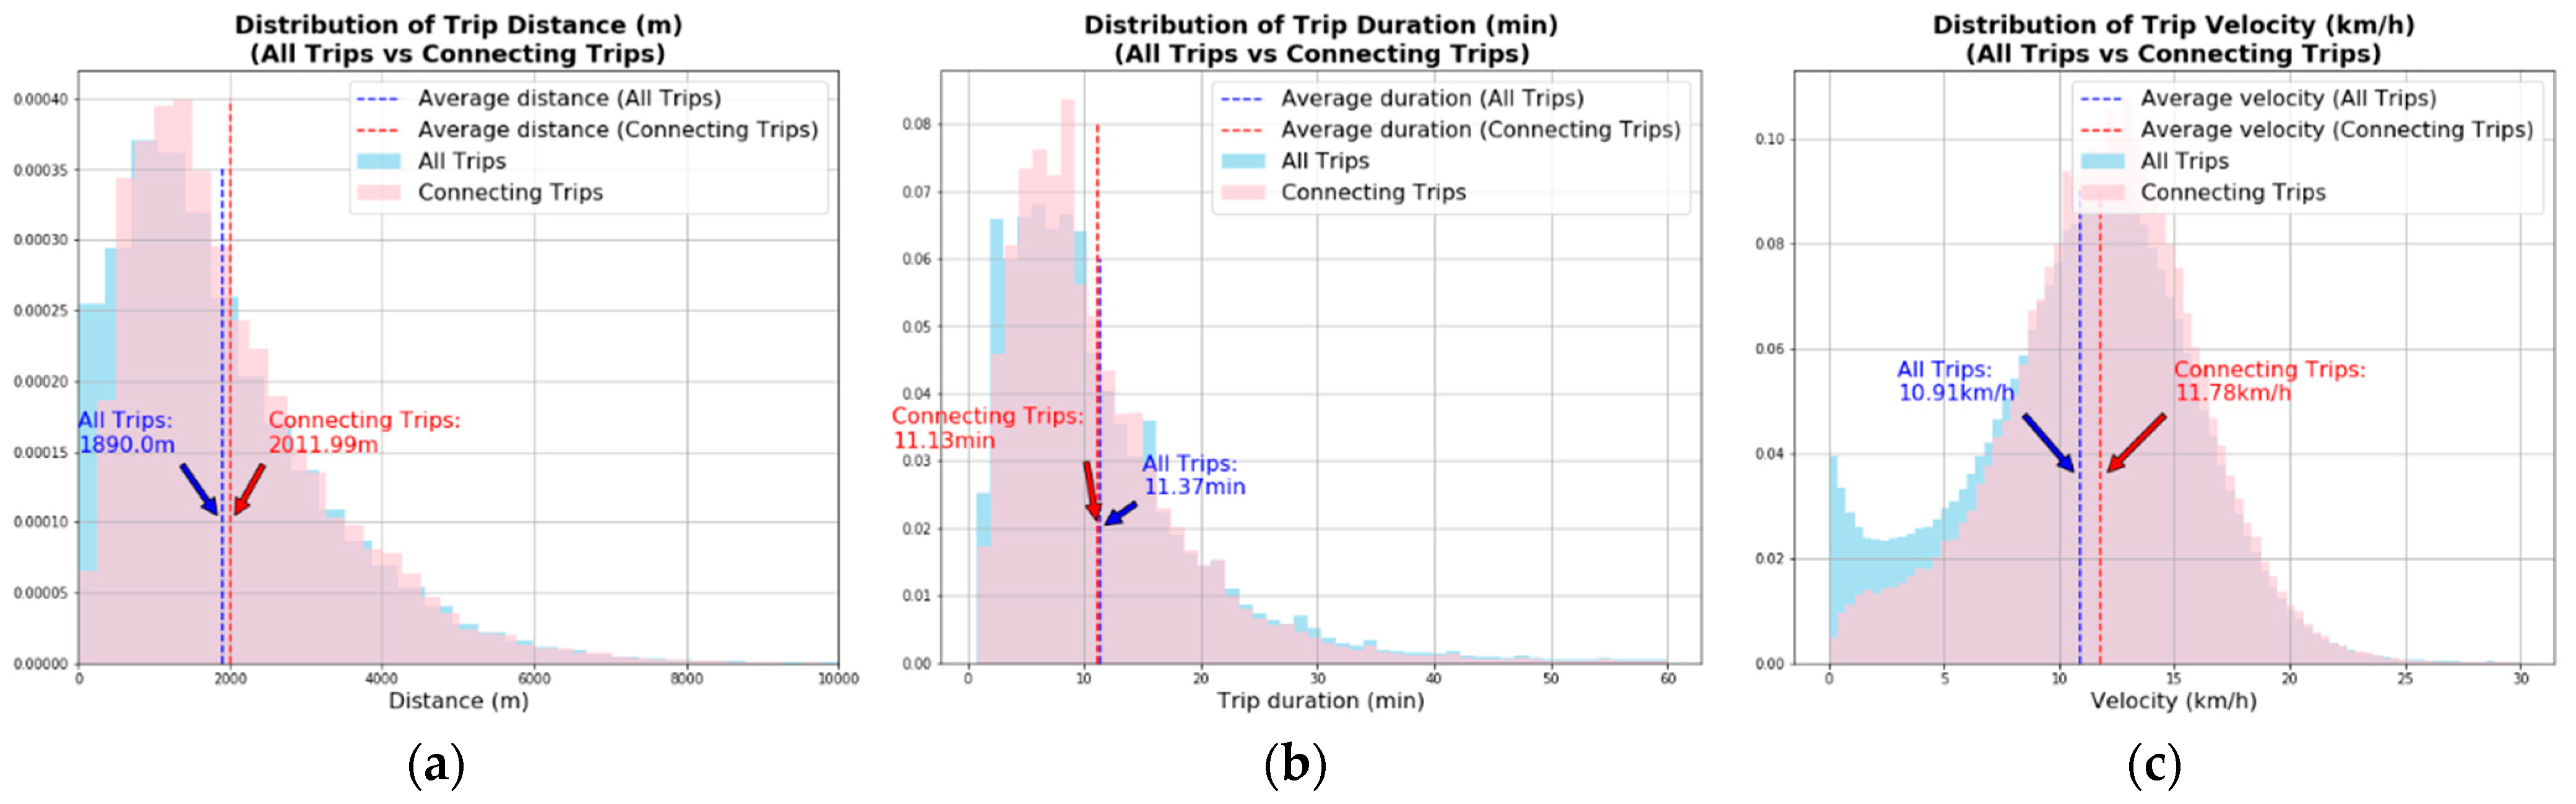
4.5. Characteristics of Public Transit Connecting Trips

This paper further examines the characteristics of the spatially and temporally identified connecting trips. The weekly distribution of connecting trips mirrors the overall pattern as observed in all trips, thus primarily occurring on weekdays. However, in contrast to all trips where dockless and docked trips peaked on different days, connecting trips presented no significant distinctions between the two systems.
An additional comparison of the diurnal trip occurrence is performed between all trips (Figure 2) and connecting trips (Figure 8).
Figure 8 reveals patterns that closely resemble those in Figure 2. Yet, the connecting trips exhibit more distinct patterns indicative of commute-driven trends. Given that the inclusion of GTFS data excluded trips that took place far from any transit arrivals or departures, particularly during low transit activity periods such as 1:00 AM and 5:00 AM, the peaks in Figure 8 were boosted higher. For instance, in San Francisco, docked trips during the afternoon rush hour (5:30 PM) accounted for 5.83% of all shared micromobility trips, while the connecting trips represented 7.51% for the same time period.
In San Jose, the identified connections display a two-peak trend that is absent in the broader activity patterns depicted in Figure 2. This divergence might be influenced by the fact that the key rail passenger depots, attracting about 80% of connecting trips in this city, are the most popular stations that primarily serve commute trips in San Jose.
Compared to the broader distribution of all trips, connecting trips were on average longer in distance (2012 m vs. 1890 m), shorter in trip duration (11.1 min vs. 11.4 min), and faster in trip velocity (12 km/h vs. 11 km/h) (Table 3). On average, docked trips were longer (2208 m, 12 min) than dockless trips (1583 m, 10 min), both in terms of distance and time spent.
Notably, the difference in distance and duration between all trips and connecting trips is relatively more subtle and nuanced, while the velocity of connecting trips is generally and observably larger (Figure 9). To look for underlying contextual factors that might be obscured in these aggregated analyses, we also performed the same steps within each of the four cities. Not surprisingly, the distinction between all trips and connecting trips in distance and trip duration varies across cities. In contrast, the same exact conclusion is always reached as to velocity (i.e., connecting trips are generally measured faster).
To further understand such distinctions, we performed a two-sample Kolmogorov–Smirnov (KS) test for distance, duration, and velocity. This is a non-parametric test for unknown distributions. Given the varying size of activity data between datasets of all trips and connecting trips, we randomly drew 1000 numbers from each dataset and repeatedly conducted KS tests 1000 times. Table 3 summarizes the statistics of those experiments. As expected, the distributions of velocity are the least similar with a closest-to-zero average p-value, while the differences in distance and duration are less significant.
One possible explanation is that the imputed trip distances represent a relatively conservative estimate (the shortest path between origins and destinations), while the trip duration is measured in real time exactly as it occurred. Therefore, while other trips may be more circuitous and end up with closer distances between start and end locations than their actual winding trajectories, the connecting trips, due to their tendency to serve commute needs, are more likely to follow shortest paths. Consequently, the velocities computed for other trips can be slightly slower than what they were in reality.

5. Conclusions

This activity data analysis paper offers insights into the scale of rail transit connections facilitated by shared micromobility considering spatial and temporal criteria. About 5% (San Jose) to 20% (San Francisco and Los Angeles) of shared micromobility trips can be categorized as public transit connections, and the incorporation of GTFS information reduces this percentage by 2–3%. These trips generally exhibit greater velocities compared to other shared micromobility trips, often attributed to the potential commuting trip purposes.
The method developed in this study can help to identify potential connecting trips and thus monitor the interaction between the two systems over time. This method can benefit stakeholders including policymakers and shared micromobility providers. Urban planners and policymakers may use this information to identify areas and timeframes associated with higher rail-transit-connecting shared micromobility activities and thus enhance infrastructure (e.g., bike lanes) accordingly. Shared micromobility providers can also leverage this method to pinpoint public transit stations requiring an increased distribution of bikes and scooters during rebalancing adjustments.
It is important to note that this study only briefly touches on cross-city comparisons of the relationship between trip connection activities and city characteristics like urban layout and population density. While this could be an informative next step, the focus of this study is to develop an identification method that is generalizable to various urban contexts, where commonalities are prioritized over individualities.
In this exercise, it is the bike or scooter, versus the user of these services, that is evaluated. Hence, it is likely that some identified connecting trips did not actually originate from or terminate at the rail station. Likewise, certain excluded trips could indeed be connections, where the user walked a longer distance to reach or leave the rail station. Absent the ability to comprehensively track users or user-identified payments across systems, this limitation is likely to be encountered by other analyses that measure connections using vehicle data that are often more available. Therefore, this study proposes an identification heuristic that captures the fundamental patterns of rail transit connecting trips across systems over time. These trips should originate or end reasonably close to the station and must take place during the transit operating hours. Through sensitivity analyses on spatial and temporal bounds, it is evident that this method is applicable to various built environments where an alternate radius and time threshold might be more suitable.
The ten-minute window defined with GTFS may be similarly restrictive since some users could arrive exceptionally early or late relative to a train arrival or departure. Meanwhile, although GTFS logically restricts and excludes trips outside public transit operating hours, the added impact it has on the spatial approach is to some extent obscured. This insight is useful as it suggests the applicability of GTFS incorporation. While generally more accurate, the inclusion of temporal criteria is occasionally hindered by incomplete information and is not essential for a comprehensive understanding of connection activity. This may vary by system, but this effect was consistently observed within this exercise.
Another limitation of this method is its limited applicability to buses as it might only work reasonably with rail transit systems. This is because in urban environments, bus stations are too ubiquitous for a nearby shared micromobility trip to be properly attributed to. In addition, while this metric (i.e., the percentage of trips identified as connections) is easy to interpret, it depends on how the two systems geographically align. For example, if the shared micromobility system expands to less public-transit-rich areas, the percentage of connections will decrease, yet the number of connecting trips will present no aggregate change. To better interpret connection activities over time, it might be useful to develop additional metrics such as the count of connecting trips. Meanwhile, percentages remain insightful in providing a relative measure that can be compared across cities.
In conclusion, this study proposes an approach to identify shared micromobility trips that are likely to be rail public transit connections by considering proximity, time, alignment with public transit lines, and transit schedules. With potential enhancements, this method can assist in estimating the extent of interaction across systems over time. The findings suggest that shared micromobility connecting trips are a relatively minor activity and can vary across land uses. The majority of the trips facilitate point-to-point travel or may act as substitutes for public transit. Nevertheless, shared micromobility is found to play a significant role in bolstering rail transit within a diverse set of urban environments in California. The magnitude of these systems results in thousands of connections within a relatively brief timeframe. Future research may evaluate ways in which data can explore connections to bus transit and how metrics may be able to normalize measurements to changes in the size and scope of shared micromobility operations.

Author Contributions

Conceptualization, M.J., E.M. and S.S.; methodology, M.J., E.M. and S.S.; validation, M.J., E.M. and S.S.; formal analysis, M.J., E.M. and S.S.; investigation, M.J., E.M. and S.S.; resources, M.J., E.M. and S.S.; data curation, M.J. and E.M.; writing—original draft preparation, M.J. and E.M.; writing—review and editing, M.J., E.M. and S.S.; visualization, M.J.; supervision, S.S.; project administration, E.M. and S.S.; funding acquisition, S.S. and E.M. All authors have read and agreed to the published version of the manuscript.

Funding

This research was funded by the California Department of Transportation, Caltrans Award #65A0727.

Institutional Review Board Statement

Not applicable.

Informed Consent Statement

Not applicable.

Data Availability Statement

GBFS data employed in this study are available on request. More information can be found at https://nabsa.net/resources/gbfs/ (accessed on 4 October 2020). GTFS data presented in this study are openly available online. These data can be found at https://nabsa.net/resources/gbfs/ (accessed on 4 October 2020) and https://gtfs.org/ (accessed on 4 October 2020).

Acknowledgments

The authors thank the California Department of Transportation for supporting the research at the University of California, Berkeley, via the Transportation Sustainability Research Center.

Conflicts of Interest

The authors declare no conflicts of interest.

References

  1. Moon, C.; Sharpin, A.B.; De La Lanza, I.; Khan, A.; Re, L.L.; Maassen, A. The Evolution of Bike Sharing: 10 Questions on the Emergence of New Technologies, Opportunities, and Risks; World Resources Institute: Washington, DC, USA, 2019. [Google Scholar]
  2. Shaheen, S.; Guzman, S.; Zhang, H. Bikesharing in Europe, the Americas, and Asia: Past, Present, and Future. J. Transp. Res. Board 2010, 2143, 159–167. [Google Scholar] [CrossRef]
  3. Joyride. A Look Back at the History of Mobility Share. Joyride. Available online: https://joyride.city/history-of-mobility-share-html/ (accessed on 8 July 2021).
  4. National Association of City Transportation Officials [NACTO]. Shared Micromobility in the U.S.: 2018; National Association of City Transportation Officials: New York, NY, USA, 2018; Available online: https://nacto.org/shared-micromobility-2018 (accessed on 8 July 2021).
  5. NACTO. Shared Micromobility in the U.S.: 2019; National Association of City Transportation Officials: New York, NY, USA, 2019; Available online: https://nacto.org/shared-micromobility-2019 (accessed on 5 July 2021).
  6. NACTO. Bike Share in the US: 2010–2016; National Association of City Transportation Officials: New York, NY, USA, 2017; Available online: https://nacto.org/bike-share-statistics-2016/ (accessed on 5 July 2021).
  7. Kager, R.; Bertolini, L.; Te Brömmelstroet, M. Characterisation of and Reflections on the Synergy of Bicycles and Public Transport. Transp. Res. Part A Policy Pract. 2016, 85, 208–219. [Google Scholar] [CrossRef]
  8. Zuo, T.; Wei, H.; Chen, N.; Zhang, C. First-and-Last Mile Solution via Bicycling to Improving Transit Accessibility and Advancing Transportation Equity. Cities 2020, 99, 102614. [Google Scholar] [CrossRef]
  9. Martin, E.W.; Shaheen, S.A. Evaluating Public Transit Modal Shift Dynamics in Response to Bikesharing: A Tale of Two U.S. Cities. J. Transp. Geogr. 2014, 41, 315–324. [Google Scholar] [CrossRef]
  10. Shaheen, S.A.; Zhang, H.; Martin, E.; Guzman, S. China’s Hangzhou Public Bicycle: Understanding Early Adoption and Behavioral Response to Bikesharing. Transp. Res. Rec. 2011, 2247, 33–41. [Google Scholar] [CrossRef]
  11. Tempelaar, D.; Rienties, B.; Nguyen, Q. Subjective Data, Objective Data and the Role of Bias in Predictive Modelling: Lessons from a Dispositional Learning Analytics Application. PLoS ONE 2020, 15, e0233977. [Google Scholar] [CrossRef]
  12. Tobias, M.S.G.; Maia, M.L.A.; Pinto, I.M.D. Challenges for Integrating Bicycles and Public Transport in Brazilian Metropolitan Regions. In Proceedings of the 18th International Conference on Urban Transport and the Environment, A Coruna, Spain, 15–17 May 2012; pp. 229–239. [Google Scholar] [CrossRef]
  13. Oeschger, G.; Carroll, P.; Caulfield, B. Micromobility and Public Transport Integration: The Current State of Knowledge. Transp. Res. Part D Transp. Environ. 2020, 89, 102628. [Google Scholar] [CrossRef]
  14. Ma, X.; Ji, Y.; Jin, Y.; Wang, J.; He, M. Modeling the Factors Influencing the Activity Spaces of Bikeshare around Metro Stations: A Spatial Regression Model. Sustainability 2018, 10, 3949. [Google Scholar] [CrossRef]
  15. Ma, X.; Ji, Y.; Yang, M.; Jin, Y.; Tan, X. Understanding Bikeshare Mode as a Feeder to Metro by Isolating Metro-Bikeshare Transfers from Smart Card Data. Transp. Policy 2018, 71, 57–69. [Google Scholar] [CrossRef]
  16. Ma, T.; Liu, C.; Erdoğan, S. Bicycle Sharing and Public Transit: Does Capital Bikeshare Affect Metrorail Ridership in Washington, D.C.? Transp. Res. Rec. 2015, 2534, 1–9. [Google Scholar] [CrossRef]
  17. Griffin, G.P.; Sener, I.N. Planning for Bike Share Connectivity to Rail Transit. J. Public Trans. 2016, 19, 1–22. [Google Scholar] [CrossRef] [PubMed]
  18. Martens, K. Promoting Bike-and-Ride: The Dutch Experience. Transp. Res. Part A Policy Pract. 2007, 41, 326–338. [Google Scholar] [CrossRef]
  19. Gu, T.; Kim, I.; Currie, G. Measuring Immediate Impacts of a New Mass Transit System on an Existing Bike-Share System in China. Transp. Res. Part A Policy Pract. 2019, 124, 20–39. [Google Scholar] [CrossRef]
  20. Guo, Y.; He, S.Y. Built Environment Effects on the Integration of Dockless Bike-Sharing and the Metro. Transp. Res. Part D Transp. Environ. 2020, 83, 102335. [Google Scholar] [CrossRef]
  21. Guo, Y.; Yang, L.; Lu, Y.; Zhao, R. Dockless Bike-Sharing as a Feeder Mode of Metro Commute? The Role of the Feeder-Related Built Environment: Analytical Framework and Empirical Evidence. Sustain. Cities Soc. 2021, 65, 102594. [Google Scholar] [CrossRef]
  22. Ma, X.; Jin, Y.; He, M. Measuring Bikeshare Access/Egress Transferring Distance and Catchment Area around Metro Stations from Smartcard Data. Information 2018, 9, 289. [Google Scholar] [CrossRef]
  23. Ji, Y.; Ma, X.; Yang, M.; Jin, Y.; Gao, L. Exploring Spatially Varying Influences on Metro-Bikeshare Transfer: A Geographically Weighted Poisson Regression Approach. Sustainability 2018, 10, 1526. [Google Scholar] [CrossRef]
  24. Miramontes, M.; Pfertner, M.; Rayaprolu, H.S.; Schreiner, M.; Wulfhorst, G. Impacts of a Multimodal Mobility Service on Travel Behavior and Preferences: User Insights from Munich’s First Mobility Station. Transportation 2017, 44, 1325–1342. [Google Scholar] [CrossRef]
  25. Hamidi, Z.; Camporeale, R.; Caggiani, L. Inequalities in Access to Bike-and-Ride Opportunities: Findings for the City of Malmö. Transp. Res. Part A Policy Pract. 2019, 130, 673–688. [Google Scholar] [CrossRef]
  26. Tarpin-Pitre, L.; Morency, C. Typology of Bikeshare Users Combining Bikeshare and Transit. Transp. Res. Rec. 2020, 2674, 475–483. [Google Scholar] [CrossRef]
  27. Pritchard, J.P.; Stępniak, M.; Geurs, K.T. 5-Equity Analysis of Dynamic Bike-and-Ride Accessibility in the Netherlands. In Measuring Transport Equity; Lucas, K., Martens, K., Di Ciommo, F., Dupont-Kieffer, A., Eds.; Elsevier: Amsterdam, The Netherlands, 2019; pp. 73–83. [Google Scholar] [CrossRef]
  28. Kong, H.; Jin, S.T.; Sui, D.Z. Deciphering the Relationship between Bikesharing and Public Transit: Modal Substitution, Integration, and Complementation. Transp. Res. Part D Transp. Environ. 2020, 85, 102392. [Google Scholar] [CrossRef]
  29. Fearnley, N.; Johnsson, E.; Berge, S.H. Patterns of E-Scooter Use in Combination with Public Transport. Findings 2020, 13707. [Google Scholar] [CrossRef]
  30. Azimi, G.; Rahimi, A.; Lee, M.; Jin, X. Mode Choice Behavior for Access and Egress Connection to Transit Services. Int. J. Transp. Sci. Technol. 2021, 10, 136–155. [Google Scholar] [CrossRef]
  31. Esztergár-Kiss, D.; Lopez Lizarraga, J.C. Exploring User Requirements and Service Features of E-Micromobility in Five European Cities. Case Stud. Transp. Policy 2021, 9, 1531–1541. [Google Scholar] [CrossRef]
  32. North American Bikeshare Association [NABSA]. GBFS & Open Data. North American Bikeshare Association. Available online: https://nabsa.net/resources/gbfs/ (accessed on 3 October 2020).
  33. GTFS. General Transit Feed Specification. Available online: https://gtfs.org/ (accessed on 3 October 2020).
  34. Road Bike Rider. What’s the Average Speed of a Beginner Cyclist? Road Bike Rider Cycling Site. Available online: https://www.roadbikerider.com/whats-the-average-speed-of-a-beginner-cyclist/ (accessed on 24 November 2020).
  35. Gonzales, R. A Bicyclist Hit-and-Run on a Bike Path Is Now a Crime, as New Laws Come into Play. San Bernardino Sun. Available online: https://www.sgvtribune.com/2018/12/31/a-bicyclist-hit-and-run-on-a-bike-path-is-now-a-crime-as-new-laws-come-into-play/ (accessed on 12 July 2021).
  36. Martens, K. The Bicycle as a Feedering Mode: Experiences from Three European Countries. Transp. Res. Part D Transp. Environ. 2004, 9, 281–294. [Google Scholar] [CrossRef]
  37. State of California. About COVID-19 Restrictions. Available online: https://covid19.ca.gov/stay-home-except-for-essential-needs/ (accessed on 7 December 2020).
  38. Sacramento Regional Transit. Final Network Integration Plan. 2021. Available online: http://www.sacrt.com/aboutrt/documents/SacRT-Network-Plan-Approved_20211025.pdf (accessed on 26 October 2023).
  39. Zipper, D. Why Don’t Transit Agencies Do Bikeshare? Bloomberg.com. 15 April 2021. Available online: https://www.bloomberg.com/news/articles/2021-04-15/transit-agencies-can-make-bikeshare-work-better (accessed on 7 July 2021).
  40. VTA. VTA’s BART Silicon Valley Extension Program. Available online: https://www.vta.org/projects/bart-sv (accessed on 2 April 2021).
Figure 1. Incorporating rail transit schedule for (a) access trips and (b) egress trips.
Sustainability 16 00555 g001
Figure 2. Trip distribution by time of day in (a) San Francisco, (b) Sacramento, (c) Los Angeles, and (d) San Jose.
Sustainability 16 00555 g002
Figure 3. Distribution of trip velocity by city (bike vs. scooters, dockless trips) in (a) San Francisco, (b) Sacramento, and (c) Los Angeles.
Sustainability 16 00555 g003
Figure 4. Radius-based sensitivity analysis for (a) spatially connecting trips and (b) transit-substitution trips.
Sustainability 16 00555 g004
Figure 5. Time-based sensitivity analysis with GTFS incorporated.
Sustainability 16 00555 g005
Figure 6. Percentage of connecting trips by city with GTFS: (a) bikes vs. scooters; (b) dockless trips vs. docked trips.
Sustainability 16 00555 g006
Figure 7. Spatial distribution of connection in (a) San Francisco, (b) Sacramento, (c) Los Angeles, and (d) San Jose.
Sustainability 16 00555 g007
Figure 8. Trip distribution by time and day with GTFS measures (connecting trips) in (a) San Francisco, (b) Sacramento, (c) Los Angeles, and (d) San Jose.
Sustainability 16 00555 g008
Figure 9. Distribution of (a) trip distance, (b) duration, and (c) velocity (all trips vs. connecting trips).
Sustainability 16 00555 g009
Table 1. Shared micromobility systems in four cities.
San FranciscoSacramentoLos AngelesSan Jose
Trips by SystemDockless scooter sharing78,77097,332145,449--
Dockless E-bikesharing74,31176,37120,732--
Docked bikesharing595,524--46,26646,205
Total Trips 748,605173,703212,44746,205
First Trip1 January 20206 January 20203 October 20191 January 2020
Last Trip29 February 202028 February 202029 February 202029 February 2020
Table 2. Substitution trips and station pairs by city.
CityNumber of SubstitutionsPercentage of TripsStation 1Station 2Number of TripsDistance (m)
San Francisco99401.33%San FranciscoMontgomery11741931
San FranciscoPowell Street4811609
San FranciscoEmbarcadero3893219
San Francisco Van Ness3343541
Powell StreetMontgomery1891127
Sacramento21681.25%8th & KCathedral Square169483
8th & K13th Street541287
8th & K23rd Street482736
8th & K7th & I/County Center47483
8th & K16th Street431770
Los Angeles16190.76%Wilshire/WesternWilshire/Normandie113805
7th Street/Metro CenterPico Station741287
ChinatownUnion Station701127
Hollywood/HighlandHollywood/Vine341287
7th Street/Metro CenterUnion Station284989
San Jose750.16%Diridon StationRace Station152414
Santa ClaraConvention Center7805
Diridon StationJapantown/Ayer42575
Santa ClaraJapantown/Ayer61127
Diridon StationSanta Clara31448
Table 3. Comparison of all trips and connecting trips.
StatisticsTwo-Sample Test
(Sample Size = 1000)
MeanMedianD-Valuep-Value
Distance (m)
All Trips189015520.0820.013 (*)
Connecting Trips20121672
Duration (min)
All Trips11.379.020.0530.190 (-)
Connecting Trips11.139.02
Velocity (km/h)
All Trips10.9111.370.0950.006 (**)
Connecting Trips11.7812.03
* Significant at the 0.05 level. ** Significant at the 0.01 level. - Not significant.
Disclaimer/Publisher’s Note: The statements, opinions and data contained in all publications are solely those of the individual author(s) and contributor(s) and not of MDPI and/or the editor(s). MDPI and/or the editor(s) disclaim responsibility for any injury to people or property resulting from any ideas, methods, instructions or products referred to in the content.

