1. Introduction
In recent years, shared mobility has been increasingly favored in public transport due to its advantages over traditional systems, which can often suffer from inefficiencies to some extent. Inefficient bus routes and limited options in remote areas lead to higher car usage, which contradicts the efforts of the European Union (EU) to promote sustainable and eco-friendly transportation alternatives [
1,
2].
Demand-responsive transport (DRT) systems, with the development of mobile devices, appear to be gaining interest as a suitable transportation system in areas where traditional systems fall short. DRT has the capability to offer customers convenient, swift, and cost-effective mobility services [
3]. The decreasing usage of public transport in Slovakia, especially in rural areas, is also raising questions about the current transport system and compelling policymakers to explore alternative transportation solutions. DRT, a dynamic transportation system characterized by on-demand operations that enable passenger pickups at self-designated points and subsequent delivery to chosen endpoints, has emerged as a prospective solution aimed at addressing the challenges posed by traditional fixed-route transportation systems [
4]. DRT involves a transport fee for individual journeys, often incurring greater expenses compared to fixed-route systems. The higher costs associated with DRT, as well as its complexity, which requires online upfront booking, can be significant barriers to its utilization.
In this paper, a willingness-to-pay analysis has been conducted on an inhabitant’s sample of seven rural settlements in eastern Slovakia. The objective is to analyze the main differences in the willingness to pay among the respondents and compare the results with previous studies. This study provides insights into the economic preferences of the community, offering decision-makers valuable information for shaping transportation policies and plans for transitioning to the application of DRT within the fixed-route bus system. The data aid in efficient resource allocation, enabling prioritized investments in DRT infrastructure and services based on perceived value. By aligning development initiatives with the specific needs and preferences of the Košice region, this study contributes to economic efficiency, sustainable transportation systems, and an improved quality of life for residents. Methodologically, this study provides a reference point for future research endeavors, offering guidance on effective approaches and potential challenges encountered in DRT planning. Also, comparative analyses of willingness-to-pay (WTP) assessments in diverse regions can foster a more nuanced understanding of economic preferences.
This analysis is based on previous cost analyses and experiments [
5] as well as project results, the objective of which was to investigate the possibility of replacing some inefficient fixed-route bus lines with on-demand transport solutions. As can be seen in the
Table 1, the costs and especially subsidies from regional budgets are rising very rapidly, although the number of passengers decreases.
Alternative transport solutions often offer additional functionalities and benefits compared to existing ones. Demand-responsive transport is no exception, as it can be categorized somewhere between a taxi service and a bus transportation service, featuring unique capabilities like multiple customized pickup and drop-off locations and times based on customer needs. In this paper, DRT is generally understood as being defined by [
6] as a door-to-door transportation service provided to the general public without a fixed time schedule, operating solely on-demand through prior booking, and using low-capacity vehicles such as minibuses or vans.
DRT services are claimed to be economically beneficial, serving as a cost-effective alternative to regular lines [
5] or taxis [
7]. While DRT acceptance may be slower and lower [
8,
9], even under these conditions, DRT could still be a more cost-effective option compared to regular lines [
10].
They also address societal needs by providing transportation for passengers with special requirements, such as the elderly [
11,
12,
13] and disabled individuals [
14,
15], as well as specific target groups [
16]. Social implications can also be identified in the enhancement in accessibility in areas with weak demand areas, including peripheral or rural regions and areas with reduced connections due to the pandemic [
17,
18].
Furthermore, they offer environmentally friendly transportation [
8,
19,
20]. DRT has been identified as a way to reduce environmental effects compared to buses [
21], particularly in situations of lower demand [
5,
18]. Moreover, DRT possesses the flexibility to utilize different routes. As highlighted in [
17], the environmentally conscious routing of DRT has the potential to decrease energy consumption and emissions by as much as 37%, with negligible effects on the overall travel time and distance traveled.
When identifying the factors that most studies suggest affect DRT utilization, they generally propose two categories: personal factors, which are related to individuals as service users, and technical factors, which are typically connected to DRT as a service.
Among the personal determinants, respondents’ age, gender, access to personal vehicles, education, income, employment, household size, trip purpose, and previous experience with the service can be included [
13,
16,
22,
23].
The most frequently mentioned technical determinants include the number of access points, booking methods, trip cost, payment scheme, provided information, waiting time, travel duration, distance between stops, operating hours, and others [
11,
12,
23,
24,
25].
Very few studies focus on complex factors or factors related to settlement types or regional population specifications, and even fewer do so in connection with the contingent valuation method, especially in terms of the willingness to pay.
The analysis conducted was based on an on-demand request from the Košice self-governing region, which arose during a collaborative workshop. The self-governing region was exploring whether a demand-responsive transportation system could be feasible in its remote and rural areas and was interested in understanding its potential value for the inhabitants. Additionally, the self-governing region sought information on the anticipated pricing and potential pricing models that could be proposed for DRT. To address these issues, this paper adopts a hybrid approach, combining exploratory research and field research design. This integration leverages the strengths of both methodologies, contributing to a more comprehensive and nuanced investigation.
The primary research question of this paper is what is the actual WTP value for a door-to-door DRT service intended to replace specific fixed-route bus lines in rural and remote areas of the Košice self-governing region? Additionally, this study aims to explore how the WTP value varies across different potential user groups based on their demographic data, aiming to enhance our understanding of the potential DRT user base.
The paper is structured as follows: Firstly, the introduction provides the necessary background for the research topic. It is followed by a literature review that establishes the current state of knowledge on DRT services. The data collection and methodology section outlines the research design and analysis techniques, with a focus on the use of contingent valuation. The results and discussion section presents the findings, facilitating a comprehensive understanding of the key results and their broader significance. This leads to the chapter on implications, where the paper discusses the practical and theoretical implications of the research findings.
2. Materials and Methods
This analysis is part of a larger research project that focused on identifying the value of a DRT system to be implemented in the regional fixed-route bus transportation system in the Košice self-governing region. The analysis covered 7 rural settlements in the region, encompassing an area of 6753 km2 with a population of over 780,000. This area consists of 11 municipal centers, 17 cities, and 423 smaller settlements.
The methodology and selection of these settlements were the subject of a previous study, currently in the publishing process. Its methodology was based on preliminary analysis carried out in [
4]. The selection process had to meet several criteria, including the presence of inefficient fixed-route bus lines, being either on main transit bus lines with an average number of bus lines passing through, or being a “dead-end” settlement with very few bus lines and a detour for the main bus line. Additionally, the selected settlements needed to be within 30 km of the regional capital and have more than 100 households. Seven settlements were chosen in the area, and a total of 168 responses were collected.
In the project, a closed-end bidding with predetermined payment amounts was chosen for the WTP valuation. The price in the WTP questionnaire represented the amount in euros that the respondent was willing to pay per person per trip for a proposed DRT service that would provide transportation from the settlement to the regional administrative center. The prices were determined based on previous testing [
26] and were randomly selected from a range of 0.10 to 1 euro per 1 km of the trip. This price was presented to the respondents as the total sum for the trip to simplify the decision-making problem. Information about the distance covered by the original bus trip was also provided (the proposed DRT solution would utilize the same road network, resulting in the same trip distance).
The questionnaire was divided into three parts. The first part presented a hypothetical scenario of a DRT service replacing an existing bus line to the regional administrative center and captured the respondents’ willingness to pay (WTP). The second part was dedicated to the respondents’ usage of the current transportation system. The third part aimed to gather socio-demographic data, including gender, age, educational background, employment status, marital status, income level, household size, disability status, and the need for an accompanying person when traveling.
This study was conducted in seven selected settlements (Závadka, Jablonov nad Turňov, Nižná Hutka, Hažín, Jasov, Mlynky, Spiššské Vlachy) and 168 responses were collected.
2.1. Sample Characteristics
Table 2 and
Table 3 present an overview of the fundamental descriptive characteristics of the sample utilized in this study. The age distribution within the sample demonstrated a relatively uniform pattern, except for individuals under the age of 20. The vast majority of respondents (87.77%) had achieved a level of education equivalent to high school graduation. Furthermore, nearly 80% of respondents reported earning wages below the national average in Slovakia.
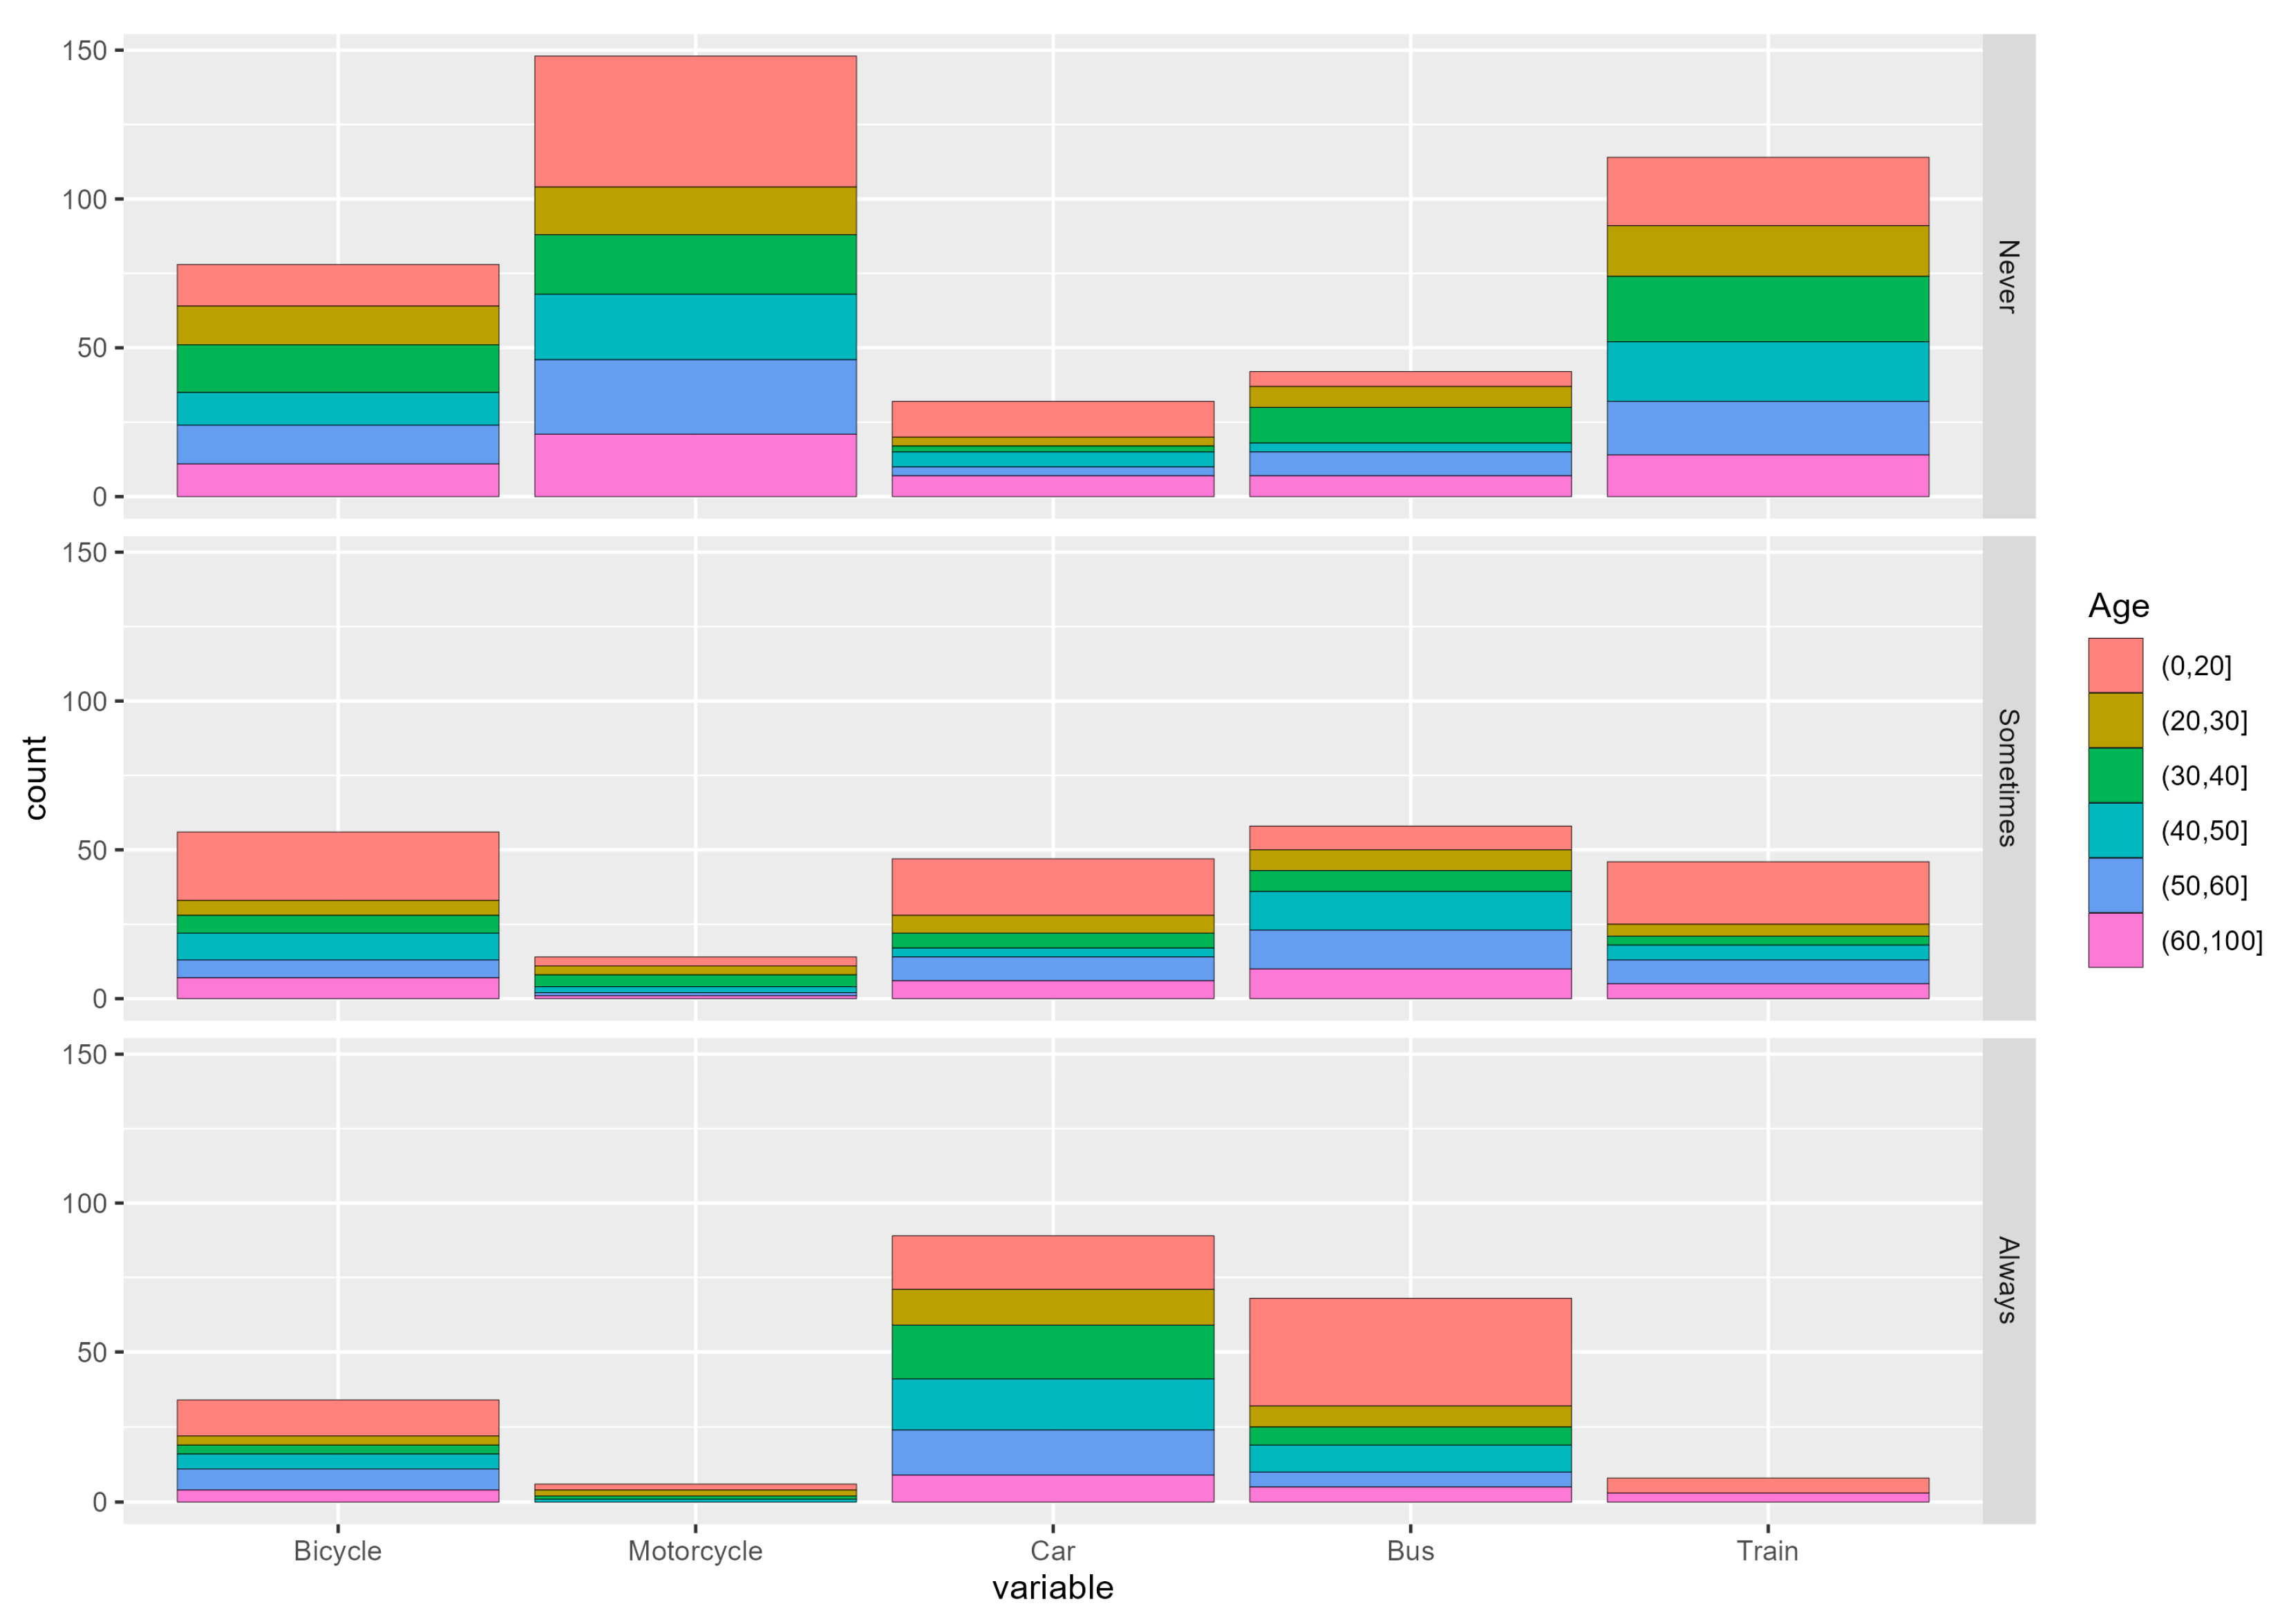
Regarding the primary modes of transportation identified by respondents, cars and buses emerged as the predominant choices, both readily available options. While bicycles were also recognized as a viable mode of transportation, trains and motorcycles were less frequently employed among the respondents.
Of the total sample, 61.87% of respondents expressed their willingness to pay more for the DRT service. On the other hand, 35.97% of respondents did not report encountering any serious transportation issues. However, this group of respondents were less likely to express a willingness to pay more for the DRT service compared to the overall sample.
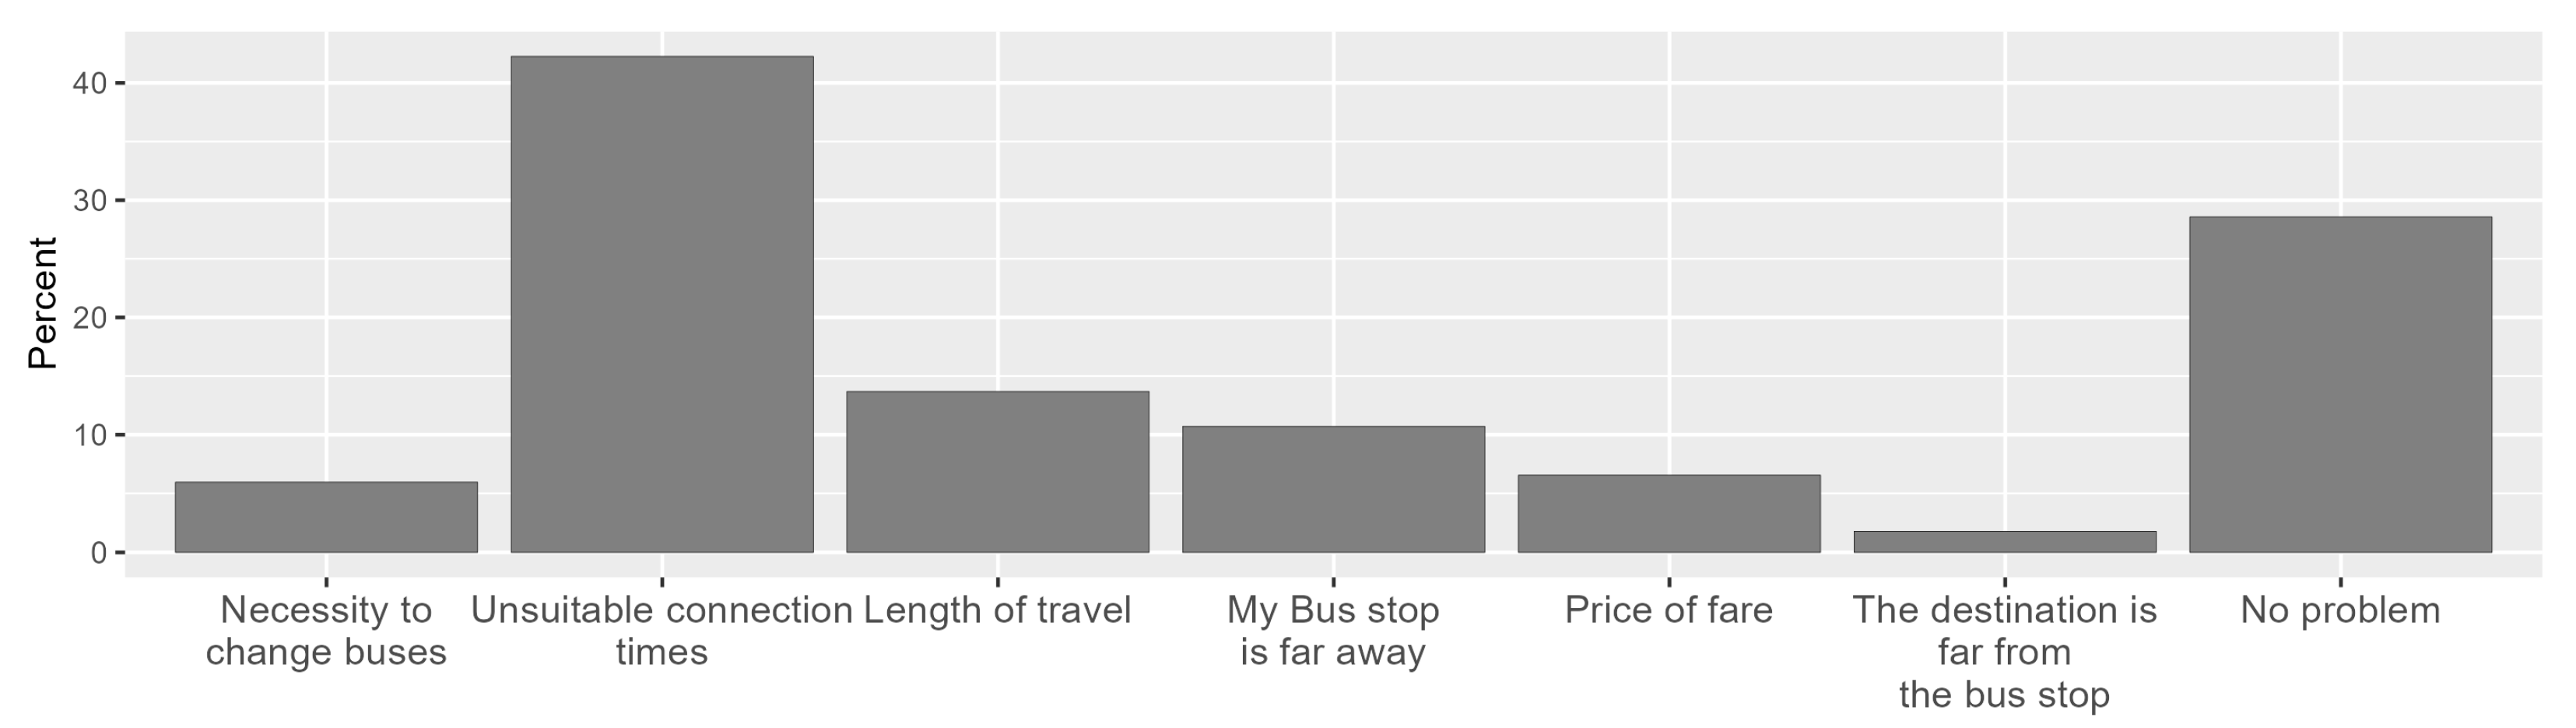
From the second part of the questionnaire, which was dedicated to users’ experiences with the current transportation system, several issues were identified by the respondents. As depicted in
Figure 1, the current fixed-route bus system was found to have inadequate schedules, which was identified as the primary problem. This was followed by long travel times and the distance that passengers had to cover to reach the bus station for the first leg of their trip.
Another interesting piece of information from the sample was the distribution of respondents according to the availability of cars, motorcycles, buses, trains, and bicycles for their trips, categorized by age, as depicted in
Figure 2.
2.2. Model
Utilizing the data obtained from the questionnaire, a logit model was constructed to analyze the respondents’ acceptance of the proposed payment amounts. It is important to note that individuals who indicated no intention of using the DRT service were excluded from the analysis. All available variables from the questionnaire described in
Table 3 were considered when constructing the logit model, with the final model best describing the probability of accepting the proposed sum by respondents and containing all statistically significant variables having the following form:
where
where
-
is the amount proposed;
-
is the dummy variable for Jasov;
-
is the number of household members;
-
is the bus user variable;
-
is the perceived bus quality;
-
is the age of the subject;
-
is the dummy car utilization variable for moderate usage;
-
is the dummy train utilization variable for moderate usage;
-
is the dummy train utilization variable for no usage.
Coefficients for the statistically significant variables affecting the probability of accepting the proposed sum by respondents for the demand-responsive transport obtained from the model are detailed in the
Table 4. Other variables from
Table 3 proved to have no statistically significant effect.
Out of all the variables considered, only the variables presented in
Table 4 were found to have a statistically significant effect on the acceptance of the proposed amount.
The following relationship was used to obtain the cumulative distribution function of the willingness to pay
:
which helped to identify the median willingness to pay and was calculated at the level of 37 cents per km.
Subsequently, the average willingness to pay was calculated as follows:
The average willingness to pay was calculated by obtaining the probability density function (5) and integrating the function (6). This resulted in a quantification of 36.35 cents per kilometer as the determined level.
These WTP figures fall below the tariff range of taxis (€0.67–1/km), indicating a probable lower usage rate of taxis among the sample group. Conversely, it significantly surpasses the fixed fare of €0.066 per kilometer for bus tickets (though this amount is averaged for a full day and adjusts based on distance traveled). Increased WTP for DRT can be attributed not only to an elevated quality of services but also to a perception of DRT as a more environmentally friendly mode of transport [
27].
After the model validation, its formula was used to recalculate at ceteris paribus the WTP values for each variable and category. Using this approach, the individual differences in the WTP value can be captured for different variable adjustments or category changes.
3. Results and Discussion
Subsequently, the willingness-to-pay outcomes were computed for distinct groups based on the variables subjected to analysis, with the aim of capturing variations within these groups. These variations can serve a dual purpose: firstly, they can assist in pinpointing specific target groups for the DRT service; secondly, they can provide valuable insights for devising pricing strategies tailored to the distinct needs and preferences of these diverse groups. This part analyzes whether there are any and, if so, how distinct the differences are in the WTP values according to settlement types, household size, distance from administrative regional center, age of the respondent, marital status, employment type, education, income, and availability of other transportation means especially cars.
To calculate these results and WTP values, the previous model was utilized to recalculate the WTP values by altering the corresponding variables in the model while keeping the other variables constant.
When analyzing the environmental aspects of such an implementation, it becomes essential to deliberate upon both environmental and economic sustainability. The empirical data provided by fixed-route bus transport reveal that an average 12 m long diesel bus, employed on the specified bus routes in this study, exhibits a mean fuel consumption of 32 L per 100 km, accommodating a maximum of 55 sitting passengers. Conversely, contemplating a minivan with an eight-passenger capacity entails an average fuel consumption of 9 L per 100 km.
On average, the efficacy of DRT surpasses that of a fixed-route bus until the bus occupancy rate reaches 30%, a threshold significantly surpassing the norm in the analyzed cases–bus lines. The findings present an even more sanguine perspective when considering route optimizations for DRT. Notably, the methodology employed here and in this study highlights that the DRT vehicle consistently undertakes two trips, in contrast to the fixed-route bus’s single journey, which makes DRT even more efficient.
3.1. Settlements
In relation to various settlements, significant disparities in outcomes are evident in
Table 5, primarily influenced by the demographic composition of their populations. Specifically, the settlement of Mlynky stands out with the highest Aging Index, recording figures that are twice as high as those observed in other settlements. Conversely, Jasov presents a contrasting scenario, with its Aging Index logging notably lower values. Furthermore, Jasov and Závadka stand out due to their elevated prevalence of marginalized families, a factor that could potentially impact the willingness to pay. Jasov has a notably lower median age that might explain the lower WTP, possibly due to a student population with limited disposable income. However, Závadka shows a closer resemblance to other settlements in age structure, with its aging coefficient closer to the average values. Hažín, with a high percentage of individuals in the productive age, demonstrates a relatively balanced age distribution, possibly contributing to a moderate WTP.
This study provides empirical evidence supporting the assertion that the geographic distribution of passengers significantly influences the WTP within the context of demand-responsive transportation. Additionally, it suggests that distinctive economic characteristics have a major impact on DRT acceptance, which should be considered by policymakers.
3.2. Household Size
When analyzing the influence of household size, a negative correlation was found between the household size and WTP, while concurrently, a positive correlation was observed between the household size and the acceptance of a new mode of transportation. A weak and not significant negative correlation between the WTP and distance of the settlement from the district city was identified in the data. Surprisingly, a much lower WTP value was identified for single households than for households with more members. As can be seen in the
Table 6 the WTP median value is decreasing with the increasing number of household members, which can be connected to higher transportation costs.
Although the reduced acceptance of DRT observed among single households contradicts the findings of [
19], who reported a 30.2% higher acceptance rate for DRT among single households compared to other household types, this discrepancy could be attributed to the fact that all expenses fall on a single individual, thereby magnifying the financial burden similarly as in the case of a bigger family, poorer analyzed region, and also by easier share riding for a single person. On the other side, share riding with a larger number of family members in a single vehicle becomes more challenging; therefore, families are more likely to use other forms of transport. At the same time, an increase in passenger numbers leads to proportionally higher costs for DRT, which makes other forms of transportation much more affordable (especially taxi prices for the whole vehicle) and which drives the decrease in the WTP for a higher number of household members.
3.3. Employment
As depicted in the provided
Table 7, individuals employed in varying shift arrangements exhibit a notably higher acceptance and WTP for DRT services compared to the average. This inclination can be attributed to their need for enhanced flexibility, which leads them to utilize and invest more in these services compared to other groups. Similarly, a marked level of acceptance is observed among disabled individuals, who rely heavily on external assistance. Despite potentially facing challenging social circumstances that could contribute to their lower WTP compared to other groups, their dependence on these services results in a higher value compared to retired individuals. It is worth noting that the responses from disabled individuals in the questionnaire were relatively low.
Elderly and retired individuals exhibited the lowest acceptance rate but a considerably high WTP value. A low acceptance level can be the reason for several mentioned factors like resistance to adopting novel technologies and a preference for familiar transportation modes.
The trust established in their current means of transportation could also play a role in their reservations. These findings are partially substantiated by [
16], which established a correlation between life stage and DRT usage, indicating that elderly users tend to engage with DRT services less frequently.
Notably high levels of acceptance and WTP were also recorded among students, who generally possess an openness to embracing new technologies. This elevated acceptance among students aligns with previous studies by [
28,
29,
30].
However, the research observations diverge from [
29,
31], where a substantial portion of users were retired. This discrepancy could be attributed to retired individuals often relying on parental income and, consequently, displaying a greater willingness to pay for these services. Additionally, questions emerged concerning unemployed individuals, who exhibited notably high levels of acceptance and willingness-to-pay values.
In light of these findings, it is crucial to acknowledge the demographic disparities in acceptance and WTP when designing DRT services. Tailoring these services to specific user groups can significantly enhance their adoption and success.
Additional analysis was conducted to compare employment and age categories with the WTP values. The results confirmed that respondents in the productive age range (18–60) who were employed in shifts tended to exhibit higher WTP values than the average within the sample. However, their WTP values were lower than those of the unemployed individuals or entrepreneurs. It is important to note that the sample size is relatively small, which may limit the reliability of the results.
3.4. Age
Given that age has already been linked to the preceding variables, it can be summarized that a higher age correlates with a diminished acceptance of DRT and a lower willingness to pay, barring the exceptional case of disabled individuals mentioned in this chapter.
Table 8 presents the results for all the age groups used in the analysis.
It can be simplified that, as individuals grow older, their acceptance and willingness to pay for DRT services tend to decrease. This phenomenon is often associated with a greater sense of risk aversion among older age groups, a tendency to favor the comfort of established routines over exploring new offerings, and generational differences in technology adoption and adaptation.
On the other side, the younger population is more often comprised of early adopters, and they are more willing to pay more for DRT services. Therefore, the viability and success of DRT may hinge on the integration of smart technologies, convenient booking, real-time tracking, and seamless payment options. Additionally, marketing strategies should be crafted with the unique preferences of this demographic in mind.
3.5. Marital Status
In the case of marital status, results in
Table 9 indicate that the DRT acceptance percentage is similar for every category with a 60% acceptance on average, except for the category of Widow/er. Singles/divorced were willing to pay a higher fare compared to the married respondents (in average 0.43 to 0.30 €/Km).
The identified differences in the WTP value between singles and married could be supported by [
16], who identified young individuals as the most-frequent users of a DRT service. Moreover, the higher disposable income among singles, particularly if they do not have family financial responsibilities, contributes to their increased willingness to pay for premium services. This insight implies that, for DRT to thrive, tailored strategies should be implemented to cater to the specific needs and preferences of both singles and married individuals. While singles may value flexibility and efficiency, married individuals may prioritize family friendly features.
3.6. Education Level
The WTP values in
Table 10 are very similar according to all the educational degrees. The difference is in the acceptance rate, where the apprenticeship degree has a higher DRT acceptance rate than respondents with university degrees. Surprisingly, in the sample, the respondents with primary education tend to have one of the highest DRT acceptance rates and WTP values.
Nyga et al. [
19] have identified that a complete apprenticeship affects the WTP positively while a university degree reduces it.
In this paper, the results could not confirm the previous study as the WTP values are very similar according to all the educational degrees. The differences are in the WTP value, where the individuals w ith a complete apprenticeship tend to have higher WTP values than respondents with university degrees.
Surprisingly, in the sample, the respondents with a primary education tend to have one of the highest DRT acceptance rates and WTP values. These results conflict with a study that analyzed the DRT acceptance among university students [
32], where the university students tend to have higher acceptance rates and also higher WTP values and choosing DRT over traditional transportation services for their campus commuting. It is worth noting that the results from that study may be biased due to the fact that the majority of the respondents were exclusively university students.
3.7. Income
Respondents with the lowest income levels exhibited a more pronounced inclination to accept DRT services and displayed higher willingness-to-pay (WTP) values when compared to the middle-income group. Notably, our results in
Table 11 also indicate that individuals in the highest income bracket also show elevated levels of acceptance and WTP in comparison to the middle-income group.
Wang et al. [
13] have identified that the demand for DRT services was higher in areas with a low population density and high levels of social deprivation, represented by the level of income, employment, education, housing and services, health and disability, and living environment. Similar conclusions can be drawn from the outcomes as elucidated by [
19,
25], which reveal that respondents with lower incomes tend to exhibit some of the highest WTP values.
Our study aligns with these trends, revealing that respondents with the lowest income levels demonstrated a higher degree of acceptance of DRT and exhibited higher WTP values compared to the middle-income group. Notably, our data also indicate that individuals in the highest income bracket exhibit elevated levels of acceptance and WTP compared to the middle-income group.
3.8. Sex
Concerning sex, our observations presented in
Table 12 indicate that males show a greater acceptance of DRT services and also demonstrate higher willingness-to-pay (WTP) values. However, these findings contradict those of [
25], who discovered that males had a lower WTP than others.
Men have been consistently identified as early adopters of new transport services, a trend underscored by the research of [
33,
34]. Our study aligns with these findings, demonstrating that men are not only more inclined to embrace demand-responsive transportation (DRT) but also exhibit a greater willingness to pay for the service. Recognizing and leveraging the tendency of men to be early adopters can inform targeted approaches to engage this demographic, contributing to the growth and sustainability of DRT services in the broader transportation landscape.
3.9. Other Transportation Options
3.9.1. Bus
In this paper, bus commuters exhibit a higher acceptance of DRT services and, at the same time, a reduced willingness to pay. The variations were perceptible, though not excessively substantial, which could be potentially affected by the overall satisfaction with bus services with an average value slightly above the midpoint of the Likert scale. Also, buses frequently stand out as the most economical means of transportation among the available options and so individuals require a mode of transportation, but they might not be inclined to pay higher fees.
Our findings also uncover a correlation between perceptions of bus quality and the WTP: individuals who assess bus quality as above average tend to express a lower WTP, whereas those who regard bus quality as below average tend to demonstrate a higher WTP. These commuters expect a higher quality of DRT services and therefore are willing to pay more, which is in line with [
25].
3.9.2. Train
Other transportation options, such as own car or train stations, may influence an individual’s willingness to use DRT. We have found that train station availability has a positive effect on the WTP for DRT services. Although we could not confirm this finding via the other literature, [
35] and [
11] have found that the better accessibility of a train station resulted in a lower susceptibility to use demand-responsive transport. These findings are contrary to this analysis’ results, where with the availability of the train in the settlement, the WTP has increased. Therefore, it can be assumed that the train transport service has features that are not optimal for the respondents, and that the DRT service is providing a better value and utility for them.
3.9.3. Car
Several studies, including those by [
13,
36,
37], have demonstrated a negative relationship between car ownership and the number of demand-responsive transport trips, as the passengers are not dependent on other transport options. Furthermore, in the case of the WTP, our findings indicate that the availability of a car is associated with a lower stated WTP for DRT services. This outcome is in contrast with the findings of [
19], who reported that car ownership does not diminish the willingness to pay for DRT services. In this case, it can be expected that the lower WTP is associated with the existence of other transport options.
Furthermore, the data have uncovered variations in WTP values based on household size and car availability. Households without access to a car tend to exhibit a lower acceptance of DRT services but show similar WTP values as the average within the sample.
4. Conclusions
The findings of this analysis shed light on the important factors influencing individuals’ willingness to pay (WTP) for demand-responsive transport (DRT) services in rural Slovak settlements. As shared mobility and innovative transportation solutions become increasingly important in the modern world, understanding the dynamics of DRT adoption becomes essential for policymakers and transportation authorities.
Understanding the WTP for DRT empowers policymakers to craft a more effective framework for adoption. This, in turn, leads to the establishment of a transport system that is not only environmentally conscious and cost-efficient but also carries significant social implications. All these advantages contribute to the promotion of sustainable mobility, a goal further bolstered by the possible integration of electric vehicles or even autonomous transit [
38]. DRT can also serve as an effective feeder for other transportation services, addressing the crucial first- or last-mile connectivity challenges [
39].
As stated in [
16], this study confirms that the frequency of DRT use is strongly correlated with the age and lifecycle stage: young individuals who are employed full-time are likely to use DRT most frequently; older adults who have retired from the workforce and whose children have left home are likely to be infrequent users. Overall, our analysis indicates that DRT services have the ability to both increase public transport use among existing public transport customers, and to draw new customers to public transport services.
Contrary to some prior research, single households displayed reduced DRT acceptance, possibly due to financial constraints and the convenience of shared riding for larger families. The WTP value exhibited nonlinear growth with an increasing household size, reflecting higher costs for accommodating more passengers. The relationship between income and DRT adoption aligns with broader trends. Lower-income individuals show a greater acceptance and higher WTP, while the highest income bracket also exhibits an elevated acceptance and WTP. Education level does not significantly impact the WTP in contrast to prior findings. Respondents with primary education exhibit a high DRT acceptance, conflicting with studies primarily focused on university students. Age and employment status significantly influence DRT adoption. Retired individuals, despite low acceptance, demonstrate a high WTP, likely driven by fixed incomes and a preference for DRT convenience. Conversely, students exhibit a notable acceptance and high WTP. Unemployed individuals also show intriguingly high acceptance levels.
These findings emphasize the need for tailored DRT strategies accounting for household size, employment, marital status, education, income, and local transportation options in potentially suitable areas. Further research could be aimed at creating a more generalized model of DRT feasibility given the demographic and social specifics of target areas. Policymakers should leverage these insights to promote sustainable and efficient transportation solutions in underserved regions, with particular attention to aid groups with a lower WTP to use DRT services.
This study identifies significant disparities in the WTP across different settlements, emphasizing the importance of considering local demographics when designing DRT systems, as passengers’ preferences are heterogeneous. It is imperative to comprehend the target demographic and existing transportation alternatives. The results reveal that preferences are dynamic and contingent on the context and imply also that preferences evolve over the course of one’s life.
Several implications can be taken from the research results. The analysis of potential DRT service users’ demands and their factors influencing DRT acceptance requires further detailed examination. The complexity and design of DRT services will be pivotal for their sustainability, considering both performance and economic perspectives. This matter is currently under investigation in the ongoing research conducted by the authors, utilizing conjoint analysis. This study contributes valuable insights into the heterogeneity of preferences and demand for DRT. These insights have the potential to extend theoretical and simulation models of DRT demand or models of consumer behavior in flexible transport, thereby enhancing their precision and representativeness.
This study was conducted at the request of the Košice self-governing region, and the outcomes will be put into practice by regional policymakers. Integrating these results into decision-making processes will not only improve the efficiency of the transportation network but also contribute significantly to the broader goal of promoting environmental sustainability within the region. Also, interaction with existing transportation services should be considered, as they could be complementary but also substitute services.
Based on the conducted research and the literature review, it is advisable that future DRT service operators develop their systems with a clear mission. They should strive to align with performance objectives, such as optimizing routes to maximize vehicle utilization and occupancy rates, which would subsequently contribute to economic and environmental considerations. Additionally, these systems should address the social dimension by accommodating individual routes for elderly individuals and those with disabilities.
As elucidated in the literature review, the successful implementation of demand-responsive transport within a public transportation framework appears to be more feasible in nations where DRT has been introduced into an environment characterized by regulated transportation providers or in regions dominated by a limited number of transport system providers. This situation precisely mirrors the context of the research area upon which this study is predicated.
Considering the challenge of ensuring cost-effectiveness in DRT services, we advocate for the integration of DRT as an indispensable component within the regional or national public transportation network. This strategic integration would require the establishment of subsidy mechanisms similar to those underpinning traditional transport systems, thereby ensuring its sustainability.
Furthermore, a more comprehensive analysis of the features and configuration of DRT services must be undertaken to ascertain that the implemented DRT model remains appealing to its users and evolves into a sustainable transportation solution for the serviced area.


