Abstract
Recently, removing dyes from wastewater by photocatalysis has been extensively studied by several researchers. However, there exists a research gap in optimizing the photocatalytic process parameters using artificial intelligence to maintain the associated techno-economic feasibility. Hence, this investigation attempts to optimize the photocatalytic degradation of methylene blue (MB) dye using an artificial neural network (ANN) model to minimize the capital and running costs, which is beneficial for industrial applications. A ZnO/MgO photocatalyst was synthesized, showing an energy band gap of 2.96 eV, crystallinity index of 71.92%, pore volume of 0.529 cm3/g, surface area of 30.536 m2/g, and multiple surface functional groups. An ANN model, with a 4-8-1 topology, trainlm training function, and feed-forward back-propagation algorithm, succeeded in predicting the MB removal efficiency (R2 = 0.946 and mean squared error = 11.2). The ANN-based optimized condition depicted that over 99% of MB could be removed under C0 = 16.42 mg/L, pH = 9.95, and catalyst dosage = 905 mg/L within 174 min. This optimum condition corresponded to a treatment cost of USD 8.52/m3 cheaper than the price estimated from the unoptimized photocatalytic system by ≈7%. The study outputs revealed positive correlations with the sustainable development goals accompanied by pollution reduction, human health protection, and aquatic species conservation.
1. Introduction
Discharging methylene blue (MB)-laden wastewater into the aquatic environment without proper treatment can impose several negative impacts on the health status of water bodies [1]. For instance, the MB dye can form a colored layer on the water surface [2], preventing light penetration into the marine environment that contains plant and aquatic species [3]. The sunlight absorption and scattering problems could also delay the photosynthetic processes of aquatic plants and reduce the dissolved oxygen availability for marine life [4]. Moreover, exposure of humans to high concentrations of MB can cause serious health problems and dangerous injuries, such as increased heart rate, shock, jaundice, tissue necrosis, vomiting, and cyanosis [5]. As a result of these negative impacts, MB-containing effluents must be efficiently treated before their release into the environmental dimensions.
MB has a complex and recalcitrant molecular structure, allowing it to persist in the environment for long periods and hindering its removal from wastewater by conventional treatment techniques [6]. For instance, the biological degradation of MB requires an extended retention time and certain enzymatic reactions to ensure the microbial breakdown scheme. Moreover, removing MB from wastewater by its adsorption into a certain material creates secondary pollution via disposal of the exhausted adsorbent [7]. Alternatively, various researchers have employed advanced oxidation processes (AOPs) to eliminate MB from aqueous solutions via decomposition and mineralization [3,8,9].
Heterogeneous photocatalysis (semiconductor photocatalysis) is a widely used AOP, having a great potential to degrade multiple pollutants under low energy conditions such as visible light and sunlight irradiation [10,11]. In this process, the photocatalyst material absorbs photon energy equal or greater in magnitude to the energy band gap of the semiconductor material [12]. This absorbed energy excites an electron (e−) from the valence to the conduction band of the photocatalyst material across the energy band gap [13]. This e− excitation scheme leaves a hole (h+) behind in the valence band, where the electron–hole pairs interact with H2O to form ●OH (H2O + h+ → ●OH + H+) and O2 to create ●O2− (O2 + e− → ●O2−) [14]. These generated highly reactive oxygen species (ROS) participate in a series of REDOX reactions to degrade pollutants (e.g., dyes) into simpler compounds such as CO2 and H2O [15].
Zinc oxide (ZnO) and magnesium oxide (MgO) are two semiconductors that have been involved in the photocatalytic degradation of various pollutants. However, these materials suffer from wide band gap energies, as well as rapid e−—h+ recombination [16]. These drawbacks could be mitigated by combining the ZnO and MgO pure semiconductor materials to form a ZnO/MgO nanocomposite material, which should be investigated for MB photocatalytic degradation.
Optimizing the photocatalytic process is an essential step to maintain a feasible (reduced cost and time) wastewater treatment scheme [17]. Regression models could be used to predict the treatment system performance and optimize the operational factors. However, by increasing the system complexity and non-linearity (by adding more independent variables), the least squares optimization process could not deliver accurate outputs [3]. Moreover, the regression equations sometimes fail to yield the anticipated preciseness ability and predictability for describing the interactions among the input/output variables [18]. Alternatively, artificial neural network (ANN) has found successful applications in simulating the treatment of various wastewater sources using photocatalytic technology. An ANN is a non-linear prediction model that has a structure consisting of several interconnected processing elements, known as neurons [19]. The elements of this computational (black box) model are also recognized as units or nodes, and they are arranged in layers. Each neuron receives a number of weighted signals from the formerly linked nodes that are further combined and summed up to derive a certain response. This output represents either the last projected finding or an input attribute to the consequent phase, according to the layer ordering in the network topology [20]. A comparison between the product and the actual (target) values is then employed to adjust the network parameters (e.g., weights and biases), enhancing the prediction preciseness. The ANN models could be employed to capture inter-relationships among input and output data pairs that are unclear, nonlinear, or too hard to designate.
While several studies have focused on removing dyes from wastewater by photocatalytic degradation [6,8,21], there is still a research gap in optimizing the associated operational factors to maintain a techno-economically feasible process. Much effort should be exerted on employing artificial intelligence techniques to optimize the photocatalytic degradation process, aiming at minimizing the unit treatment costs. Hence, the current study focuses on creating and characterizing a smart ZnO/MgO nanocomposite material for MB photocatalytic degradation, followed by optimizing the photocatalytic process using ANN. This optimum condition is used to minimize the photocatalytic degradation price expressed by the capital and operational costs. This study’s outputs could provide essential steps to find environmental and economic solutions for endorsing photocatalytic wastewater treatment under sustainable industrial-scale implementations.
2. Materials and Methods
2.1. Material Preparation
The ZnO and MgO nanoparticles were synthesized using a co-precipitation method, as previously reported (Figure 1; ref. [22]). The chemicals utilized throughout the study are tabulated in Supplementary Table S1. ZnSO4·7H2O and MgCl2·6H2O were used as precursors for ZnO and MgO. The 0.5 M solutions of the precursors were prepared in separate beakers. Under continuous stirring at 500 rpm, a 1 M solution of NaOH was added dropwise to each beaker until a white precipitate started to form. NaOH was added to maintain a pH of 12. Thereafter, stirring proceeded for about 15 min, allowing a complete precipitate formation. The ZnO and MgO precipitates were separated from the solution by filtration and washed multiple times with distilled water. The washed precipitates were then dried overnight at 105 °C. The dry material was crushed into fine powders, followed by calcination in a muffle furnace at 350 °C and 800 °C to achieve the ZnO and MgO nanopowders, respectively.
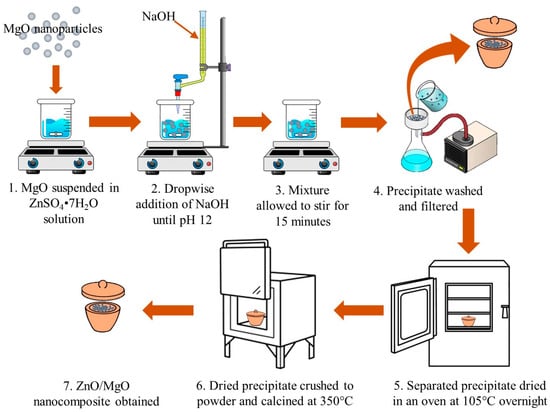
Figure 1.
Synthesized technique of ZnO/MgO nanocomposite used for photodegradation of MB dye.
To synthesize the ZnO/MgO nanocomposite, an amount of already synthesized MgO was dispersed into a solution of ZnSO4·7H2O (100 mL) and mixed continuously for 5 min. Thereafter, a solution of 1 M NaOH was supplemented to the suspension dropwise until the final pH condition reached 12. The formed precipitate was then processed in the same way as ZnO, yielding the ZnO/MgO nanocomposite.
2.2. Experimental Setup and Design
The test was conducted in a rectangular reactor with a 1 m3 internal volume. The reactor had two metal halide lamps (light intensity 25,000 lx, 400 W), emitting 510 nm UV-vis light. In each experimental run, 100 mL of dye solution was inserted into a 250 mL beaker. A 2 mL sample was withdrawn, transferred through a 0.22 μm nylon syringe filter, and analyzed to obtain the MB concentration. The dye solution’s pH was adjusted to the desired level using either H2SO4 or NaOH. The required amount of photocatalyst material was then supplemented to the aqueous medium. The beakers were inserted into the reactor and maintained under the dark condition (with mixing) to reach adsorption–desorption equilibrium. Once the equilibrium was observed, another 2 mL sample was withdrawn, and the lamps were turned on and the photocatalytic reaction proceeded for the required period of time. After finishing each experimental run, 2 mL of the sample was again collected and filtered to discard the catalyst material before analysis.
Experimental design and parameter optimization were conducted using Design Expert Trial version 9 software, where a Box–Behnken design (BBD) represented the influence of four independent variables (i.e., catalyst dose, dye level, pH, and duration) on the MB removal efficiency (R%) as the response. Three levels of the input variables (−1, 0, +1) with four factors (Table 1) were used to generate the BBD matrix, giving a total of 29 experimental runs. The assigned ranges were selected based on primary results for MB photocatalytic degradation (see Supplementary Figure S1).

Table 1.
Independent variable ranges used in the Box–Behnken design (BBD) experimental design to optimize methylene blue (MB) photocatalytic degradation by the as-prepared ZnO/MgO nanocomposite.
After finishing the experimental runs, the photocatalysts were subjected to distilled water several times (washing) and then dried at 105 °C overnight to determine the regeneration and recyclability performance [23].
2.3. Analytical Analysis
The MB dye concentrations were detected using a UV spectrophotometer (Jasco V-630 spectrophotometer, Tokyo, Japan) adjusted at a wavelength of 664 nm. The medium pH was monitored using a pH meter (Model Lutron YK-2001 PH). X-ray diffraction (XRD) analysis (Shimadzu XRD-6100, Kyoto, Japan) with a Cu-Kα radiation beam (λ = 0.154 nm) was carried out to obtain the crystallographic data of the synthesized photocatalysts before and after MB photodegradation. Fourier transform infrared spectroscopy (FTIR 8400s, Shimadzu, Kyoto, Japan) was applied to observe the photocatalyst’s surface functional groups. The nanocrystalline nature, elemental composition, and surface morphology of the synthesized photocatalysts were given by a transmission electron microscope (TEM) equipped with energy dispersive X-ray spectrometer (EDS) (JEOL, JEM-2100F, Tokyo, Japan) and a scanning electron microscope (SEM) (JEOL, JSM-6360LA, Tokyo, Japan). The Brunauer–Emmett–Teller (BET) N2 adsorption–desorption method was employed to identify the photocatalyst surface area and associated pore size and volume. The catalyst’s optical band gap energy was determined using UV-Vis diffuse reflectance spectrum (UV-Vis DRS, Jasco v-570 spectrometer, Tokyo, Japan) analysis.
2.4. Mathematical and Computational Models
2.4.1. Quadratic Regression Equation
A second-order polynomial model (Equation (1)) was employed to study the correlation between the four variables and the MB R%:
where y is the response (dye removal efficiency, R%); n represents the number of independent (input) parameters; βo is the model intercept; βi, βij, and βii represent the first-order (linear) constant, squared, and interaction effects, respectively; and x is the associated independent variables
The model adequacy and significance were assessed via an analysis of variables (ANOVA). Moreover, the impact of each of the four independent variables on the generated model outputs was also assessed using ANOVA under a significance level of 0.05. The adequacy of the generated model (goodness-of-fit) was further validated using the coefficient of determination (R2) value.
2.4.2. Artificial Neural Network (ANN) Schematic Description
In this investigation, a feed-forward ANN model was applied to estimate and forecast the MB R% using four inputs of photocatalysis experimental factors, i.e., initial MB concentration (C0), catalyst dosage, pH, and time (Figure 2). Feed-forward was chosen due to its simplicity and widely known network type able to calculate the response directly through single propagation (a forward path) [19]. Furthermore, back-propagation is recognized as a well-organized and promising supervised learning algorithm applied to optimize the network weights. Multiple epoch numbers (iterations) are run to minimize the mean squared error (MSE) between the predicted output and desired vector, further adapting the network architecture. The number of observations (records) used to simulate the ANN model was distributed as 70% (training), 15% (verification), and 15% (testing). MSE was used as the objective function (i.e., the stopping criteria) to describe the magnitude of the gradient of performance for validation. The ANN-related calculations were carried out using MATLAB (R2015a) software.
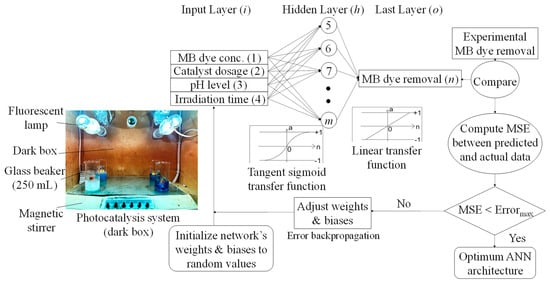
Figure 2.
Schematic flowchart of ANN feed−forward back−propagation used to predict methylene blue (MB) removal efficiency under a photocatalytic degradation process.
3. Results and Discussion
3.1. Photocatalyst Characterization
The XRD, FTIR, SEM/EDS, TEM, BET, and UV-vis DRS characterization techniques were applied to the synthesized ZnO and MgO nanopowders, and the results were compared to those obtained from the ZnO/MgO nanocomposite.
3.1.1. XRD Characterization
Figure 3a shows the XRD diffraction profile of pure ZnO, defining peaks at 2θ of 31.6°, 34.3°, 36.1°, 47.5°, 56.5°, 62.7°, 66.2°, 67.8°, and 68.9°. These peaks could correspond to the crystal plane values of hexagonal pure ZnO (JCPDS ref. code 01-079-0207) given by (100), (002), (101), (102), (110), (103), (200), (112), and (201). These XRD peaks complied with those obtained for zinc oxide hollow spheres [24]. The XRD pattern (Figure 3a) also showed characteristic peaks of the cubic structure of pure MgO (JCPDS Ref code 01-074-1225). These peaks were observed at 2θ of 36.8°, 42.8°, 62.2°, 74.5°, and 78.5°, corresponding to the crystal plane values of pure cubic MgO given by (111), (200), (220), (311), and (222), respectively. The diffraction pattern generated complied with those obtained for periclase MgO in an AC-ZnO/MgO nanocomposite [9].
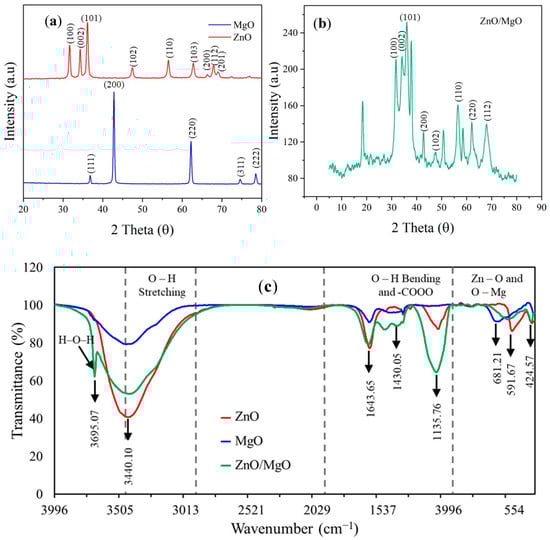
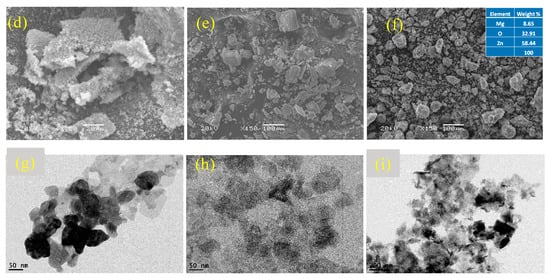
Figure 3.
Characterization of synthesized nanocomposites. (a) XRD peaks of ZnO and MgO, (b) XRD peaks of ZnO/MgO, (c) FTIR spectra, (d) SEM of ZnO, (e) SEM of MgO, (f) SEM of ZnO/MgO, (g) TEM of ZnO, (h) TEM of MgO, and (i) TEM of ZnO/MgO.
The diffraction pattern of the ZnO/MgO nanocomposite (Figure 3b) showed a combination of the characteristic peaks of hexagonal ZnO and cubic MgO structures. These peaks were denoted by 2θ at 31.8°, 34.1°, 36.1°, 37.8°, 42.6°, 47.5°, 56.4°, 62.1°, and 68.0°. This combination of peaks was indicative of a synergistic effect between ZnO and MgO to obtain the nanocomposite. The presence of extra peaks at 20.2°, 50.7°, and 58.5° could be due to some of the MgO being converted into Mg(OH)2 as a result of moisture adsorption during the synthesis process. These extra peaks corresponded to the (001), (102), and (110) crystal planes of Mg(OH)2 nanosheets [25].
The CIs of nanoparticles were calculated by Equation (2):
where Ac is the area under the crystalline peaks of the XRD pattern and At is the total area under the entire XRD pattern of a respective material
The CIs of ZnO and MgO were 67.04% and 60.83%, respectively. The core–shell nanocomposite had a higher CI of 71.92%. The crystalline size (D) of the synthesized catalyst materials was also calculated following the Debye–Scherrer equation (Equation (3)):
where K is the Scherrer constant representing the shape factor (assumed as 0.9), λ is the X-ray beam wavelength (1.541874 Å), β is the full-width half-maximum value of a peak, and Ɵ is the diffraction angle of each peak.
The crystalline size of ZnO was 22.99 nm, complying within the 11.84–24.82 nm range for ZnO synthesized under different pH conditions [26]. The estimated crystalline size of MgO (32.72 nm) obeyed that of MgO synthesized using a 1 M solution of precipitator [27]. Finally, the crystalline size was reduced to 17.24 nm for the synthesized nanocomposite material.
3.1.2. FTIR Characterization
The FTIR peaks observed at 3440.10 cm−1 in the three materials (Figure 3c) could correspond to the O–H stretching mode of the hydroxyl functional group [28]. The H–O–H stretching of H2O could reflect the high affinity of MgO to adsorb water molecules. The peaks detected at 1643.65 cm−1 and 1135.76 cm−1 were attributed to the O–H stretch vibration [29]. A peak at 1430.05 cm−1 was also noticed, indicating the bending vibrations of H2O adsorbed onto the catalyst material surface [30]. The peaks in the region below 700 cm−1 could identify the metal–oxygen bonds [31], e.g., the peaks at 681.21 cm−1 and 591.67 cm−1 represented the Mg–O bond, and the peak at 424.57 cm−1 denoted the Zn–O bond. The presence of these peaks further verified the successful combination of ZnO and MgO.
3.1.3. SEM/EDS Characterization
The SEM micrograph of pure ZnO (Figure 3d) showed a spongy appearance of agglomerated particles. This result was similar to that obtained for ZnO synthesized via the precipitation technique [32]. The SEM micrograph of pure MgO displayed flat plate-like structures (Figure 3e) of varying sizes. A similar structure was obtained for MgO by employing the co-precipitation method [33]. The SEM micrograph of the ZnO/MgO nanocomposite (Figure 3f) showed a rough external surface that appeared to be a coating of ZnO over MgO. This surface roughness might be due to the gathering and building up of numerous small clusters of ZnO that coated the MgO core nanoparticles. The EDS results showed that Zn had the highest percentage weight followed by Mg and O. This result further verified the successful synthesis of the nanocomposite material, where the ZnO nanoparticles were deposited on MgO (the support material).
3.1.4. TEM Characterization
The TEM image showed that the ZnO particles were irregularly shaped and mildly varied in size (Figure 3g). The agglomeration of ZnO could occur due to the exclusion of capping agents during the particle synthesis process. The TEM image of MgO depicted the existence of roughly circular plate-like structures of a relatively uniform size (Figure 3h). Finally, the TEM image of the ZnO/MgO nanocomposite showed a mixed matrix of the plate-like MgO particles surrounded by the spongy appearance of the ZnO particles (Figure 3i). This result further confirmed that the ZnO/MgO nanocomposite was successfully synthesized, complying with the SEM observations. The particle sizes were measured using Image J free version 1.53t software, revealing 62.96 nm for ZnO, 77.27 nm for MgO, and 114.5 nm for ZnO/MgO.
3.1.5. BET Characterization
The BET analysis exhibited the material N2 adsorption–desorption isotherms, complying with the existence of mesoporous surfaces (see Supplementary Figure S2a–c). The isotherm shapes of MgO and ZnO fit the type IVb isotherm, whereas the ZnO/MgO nanocomposite shape matched the type IVa isotherm. This finding revealed the presence of a type H3 hysteresis loop, probably depicting the existence of ≥4 nm diameter pores. Further, the BET analysis indicated a substantial decrease in the MgO surface area from 80.756 to 30.536 m2/g after combination with ZnO (Table 2). This finding could be ascribed to the formation of more pores on the ZnO/MgO surface, where interparticle spaces were formed due to the growth of ZnO particles on the MgO surface, as previously reported [34]. This result was further confirmed by the significant increase in the pore diameter from 4.942 nm for MgO to 26.617 nm for ZnO/MgO (Table 2). The pore volumes were also measured; it was observed that the ZnO/MgO nanocomposite possessed the largest pore volume of 0.529 cm3/g.
Table 2.
Summary of BET analysis results for ZnO, MgO, and ZnO/MgO catalyst materials.
3.1.6. UV-Vis DRS Characterization
Figure 4a–c shows the indirect Tauc plots and absorbance curves of the synthesized nanomaterial. The indirect Tauc plots were generated by Equation (4) [35]:
where F(R) is the Kubelka–Munk function, A is a proportionality constant, hν is the incident photon energy, n = ½, and Eg is the band-gap energy
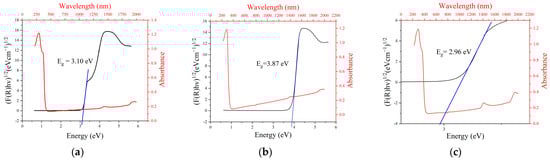
Figure 4.
Energy band gaps of (a) ZnO, (b) MgO, and (c) ZnO/MgO nanocomposites.
The linear section of the Tauc plot was extrapolated, cutting the x-axis at the energy band gap value. The UV-vis DRS results showed that the optical band gap energies of ZnO, MgO, and ZnO/MgO nanomaterials were 3.10, 3.87, and 2.96 eV, respectively. This implies that the energy band gap was successfully reduced following the combination of ZnO and MgO. This reduced energy band gap of the nanocomposite could facilitate photocatalytic activity under UV light with a wavelength of ≈419 nm, obeying the visible light range.
3.2. Regression Model Application for Predicting MB Removal
The second-order polynomial regression model, governing the R% due to the interactions of the four independent variables, was generated (Equation (5)):
where R% is the MB removal efficiency (%); and the variables A, B, C, and D represent the dye level (ppm), catalyst dosage (mg/L), solution pH, and period (min), respectively.
An ANOVA test was performed to assess the accuracy and adequacy of the model generated (Table 3). The quadratic model exhibited an F-value and a p-value of 70.33 and <0.0001, respectively. The derived F-value was greater than the recognized F-value of 2.352 (at 95% significance) [18], signifying the model’s appropriateness to forecast the R% observations. Moreover, these statistical results verified that the model was significant, where the p-value was below the alpha significance level. The model’s prediction accuracy was also demonstrated by the predicted and adjusted R2 values (0.9195 and 0.9720, respectively). These R2 values were relatively high and the difference between them was less than 0.2, denoting that the data and the model were appropriately chosen and suitable for estimating the R% values [17]. Moreover, the R2 value of the model was relatively high, presenting a value of 0.9860. Based on these statistical indicators, the generated quadratic equation could give acceptable predictions of the R% values, i.e., the predicted removal efficiencies were in agreement with the actual measurements (see Supplementary Figure S3). The significance of the variables was also analyzed, giving a p-value for each of A, B, C, and D below 0.05.
Table 3.
Analysis of variables (ANOVA) for prediction of photocatalytic methylene blue (MB) removal by ZnO/MgO nanocomposite using four independent variables, namely initial MB concentration (A), catalyst dosage (B), aqueous solution pH (C), and time (D). The model accuracy is given by R2 0.9860; adjusted R2 0.9720; predicted R2 0.9195; Adeq precision 31.8040.
3.3. Artificial Neural Network (ANN) Application for Predicting MB Removal
3.3.1. Determining the Optimum ANN Architecture
The neurons’ number in the hidden layer (N) was altered to examine the ANN prediction performance, evaluating the R2 values and MSE of each ANN architecture (see Supplementary Table S2). It was noticed that increasing N enhanced the model prediction criterion during and after training. As such, the deficient N caused premature convergence or early termination of the training algorithm, hindering the network learning capability. The N = 8 established the best-hidden neuron arrangement, giving the smallest MSE of 11.20 and the highest R2 of 0.9464 (see Supplementary Table S2). However, a further increase in N raised the model MSE, resulting in poor network generalization. An excessive N prolonged the calculation period (causing extra fitted functions due to the complex structure), and the training phase became probably accompanied by local minima or over-fitting. Over-fit (or over-learn) represented the network condition that maintained a smaller MSE (e.g., better R2) for the training procedure, but the test procedure suffered from lower R2 performances. This optimum N was accompanied by choosing Levenberg–Marquardt (trainlm) as the training function. As such, the Levenberg–Marquardt algorithm was highly efficient in simulating complex relationships among input variables within reasonable computation times. Moreover, this learning function is suitable for training moderate-sized feed-forward ANN models and solving nonlinear least squares problems. Hence, a three-layer feed-forward back-propagation ANN, with a “trainlm” training function and a “4–8–1” topology to forecast the MB R(%), was selected.
3.3.2. Training and Validation Performances
The MSE values were plotted against the epoch numbers (Figure 5a). In this diagram, the simulation procedure was completed by either achieving the highest number of training trials (e.g., training termination after six epochs) or reaching the smallest MSE (e.g., MSE = 10−6 as a performance goal), whichever initially ensued [36]. The training phase MSE (performance function) considerably dropped with iteration counts, reflecting the network’s capability to modify its weights and biases until reaching the third epoch. After that point, the training curve MSE remained approximately unchanged, depicting the ANN model’s ability to learn the relationships between the input and output data pairs. The validation set showed a different behavior, where its MSE curve increased until the first epoch and then remained almost constant. For instance, the best validation profile was monitored at epoch 0 with an MSE of 11.2, after which the ANN model initiated to overfit the data and lose its generalization power (Figure 5b). The MSE of the testing step increased, approximately similar to that of validation, employing that the learning step generated excess parameters. Hence, the zero epoch was used to terminate the training process, ensuring that the network model could precisely forecast R% using unseen input data.
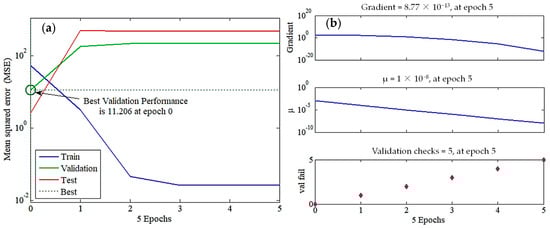
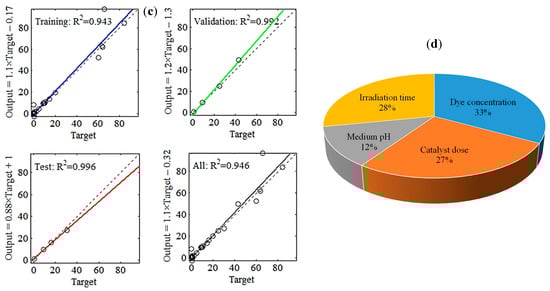
Figure 5.
ANN (4-8-1) model employed to predict methylene blue (MB) removal efficiency using four inputs, namely MB concentration, catalyst dosage, pH, and time. (a) Training state, (b) validation performance, (c) regression data, and (d) sensitivity analysis.
3.3.3. Optimum Weights and Biases
At epoch = 0, the ANN model was well-learned and the network parameters (i.e., weights and biases) were adequately adapted (see Supplementary Table S3). The values of the linking weights (W8×4 and W1×8) and bias levels (B8×1 and B1×1) were determined based on the trainlm optimization algorithm. The layer outputs used to predict R% that matched the target (the best cross-validation performance) were calculated as follows:
Each parameter (independent variables) in the four-dimension input layer (P4×1 vector) was multiplied by its corresponding record in the weight matrix, W8×4, and then cumulated. Then, an eight-dimension bias, B8×1, was included, and a hyperbolic tangent sigmoid “tansig” activation function was used to transform the net input into a response signal (z8×1) (Equation (6)):
The products of the eight-dimension middle layer, z8×1, were weighted and integrated into the matrix, W1×8, and, further, a one-dimension bias (B1×1) was included. The last output was introduced to a linear “purelin” activation function, yielding the last layer correlation (Equation (7)):
3.3.4. Regression Plot
Figure 5c displays the schemes of the simulated MB (R%) by ANN against their associated experimental data, along with R2 values of training, validation, and testing. In each regression sub-plot, the solid line denotes the best match of the ANN model. The dashed line represents the model outputs that fit precisely the actual observations (i.e., the theoretical fitting condition with R2 = 1.000). An overall R2 of 0.946 designated that the developed ANN (4–8–1) model could explain up to ≈95% of the variability in the MB removal data.
3.3.5. Relative Importance
The obtained weights and biases (see Supplementary Table S3) were involved in computing the relative importance (RI) of the experimental parameters, following Garson’s formula [37]. Figure 5d shows that the RI for the dye concentration reached its maximum value at 33%, followed by irradiation time (28%), catalyst dosage (27%), and finally the medium pH (12%). Moreover, the RI values depicted that the investigated independent variables were important for improving the MB photocatalytic degradation performance.
3.4. Photocatalysis Operating Factors Optimization
The created ANN model was considered as the fitness function and combined with a genetic algorithm (GA) to optimize the photocatalytic experimental factors. The assigned GA had 100 iteration numbers, 10 population size, 0.4 crossover probability, and 0.2 mutation probability, and was required to maintain R(%) greater than 90%. This procedure depicted that, at C0 = 16.42 mg/L and pH = 9.95, the catalyst dosage and time could be 905 mg/L and 174 min, respectively. These values were estimated as 907.35 mg/L and 178 min, respectively, using the quadratic model optimization procedure (see Supplementary Figure S4). Operating the photocatalytic reactor under the ANN-based optimized factors maintained a shorter reaction time and a lower oxidant level compared with the quadratic model-based optimized factors.
According to the verification experiment conducted under the optimum condition, the absolute relative deviation between the ANN model outputs and experimental data was 1.70%, which was smaller than 4.54% for the quadratic model prediction performance. A better predictive accuracy of ANN could be assigned to its universal ability to capture and approximate the non-linearity of the photocatalytic system, whereas the regression model is only limited to second-order polynomial.
3.5. Effect of Independent Variables on MB Degradation
The MB removal efficiencies (R%) were highly influenced by varying the independent variables within the experimental range (Figure 6):
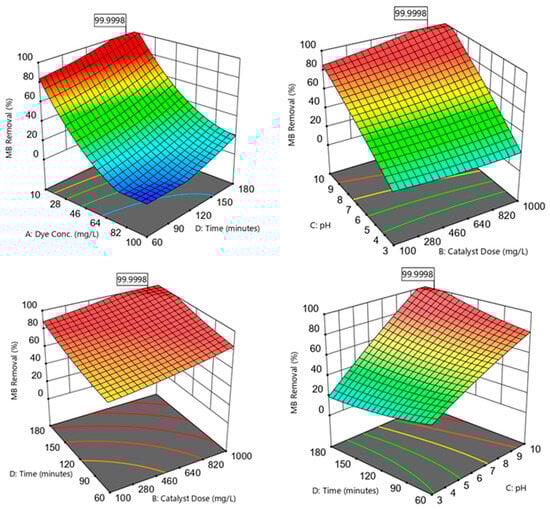
Figure 6.
Three-dimensional plots showing the correlations between the MB removal efficiencies and the independent variables; dye concentration, catalyst dose, pH, and photodegradation time.
3.5.1. Effect of Initial MB Concentration
Increasing the C0 within the 10–100 mg/L range was noticed to reduce the R% observations (Figure 6). This decrease in R% could be because of the blocking of active sites available on the nanomaterial surface by a surplus of MB molecules [21]. This pattern was associated with an ineffective photon–catalyst interaction, where a portion of photon energy could be absorbed by the MB molecules rather than by the catalyst phase. This action reduced ROS generation (higher MB:ROS ratios); i.e., there would be an insufficient ROS amount to degrade the MB in the aqueous solution. Another reason for R% reduction at higher C0 could be the hindering of light penetration through the dye solution and to the photocatalyst surface [12].
3.5.2. Effect of Catalyst Dose
The analysis showed that the MB R% was gradually improved by increasing the photocatalyst dosage within the 100–1000 mg/L range (Figure 6). This enhanced performance could be ascribed to an increase in the active site amounts when a high catalyst dosage was introduced to the medium [38]. These active locations could absorb more photons for maintaining the photocatalytic reactions. Increasing the available active sites facilitated the active site–photon interactions, yielding surplus ROS to degrade the MB dye [21].
3.5.3. Effect of pH
The results revealed an improved photocatalytic performance by increasing the solution pH within the 3–10 range (Figure 6). Varying the medium pH directly influenced the photocatalyst surface charge and the associated attraction and repulsion forces between the catalyst and the dye. The catalyst surface could acquire more negative charges as the medium pH became greater than the point of zero charge (pH pzc). Accordingly, as the medium pH became closer to the pH pzc of ≈10.24, the negatively charged sites tended to form strong attraction forces with the cationic MB molecules. When the catalyst was supplemented with the MB solution, it was recognized that the pH would increase to values greater than the initial pH. Increased attraction of the MB onto the photocatalyst surface resulted in better MB–ROS interactions and higher MB degradation efficiencies. Moreover, higher pH values implied the presence of more OH− present in the solution, resulting in the formation of more •OH radicals to degrade MB [2]. The medium pH could also affect the MB dye dissociation pathway. For instance, the MB dye tended to be ionized and possessed a predominantly cationic species (positive charge) at a solution pH over 3.8 (i.e., the MB dissociation constant, pKa) [39].
3.5.4. Effect of Irradiation Time
The proportional relationship between the irradiation time (60–180 min; Figure 6) and MB R% could be denoted by the prolonged interactions between the dye molecules and the ROS available on the photocatalyst surface [40]. The adsorption of MB onto the material surface could be designated as a function of time until active sites’ occupation and saturation, restricting the diffusion mobility of photocatalytic electrons [6].
3.6. Recyclability of the Photocatalyst Material
A recyclability test was performed to investigate the photocatalytic performance of the as-prepared materials for multiple regeneration and reuse cycles (see Supplementary Figure S5). After six successive cycles, the ZnO/MgO nanocomposite exhibited a minor drop in MB removal of about 6.14% compared with 10.56% for ZnO and 13.39% for MgO. It was supposed that ZnO/MgO exhibited higher stability and regeneration capacity than ZnO and MgO individually. However, this photocatalytic efficiency became insufficient in increasing the number of cycles above six. This reduction in performance could be ascribed to the photocatalyst mass loss after repeated use and/or the blocking of active sites by dye traces. This stability was better than B–N–TiO2/EP photocatalyst material, which showed a reduction in performance >10% for dye degradation after five cycles [41].
3.7. Photocatalytic Degradation Rates and Suggested Degradation Mechanisms
The data in Figure 7a denoted that the MB photocatalytic degradation data fit the pseudo-first order kinetic model [42] with a high R2 range of 0.957–0.992. The study also depicted that the degradation rate constant was 0.025 min−1 for ZnO/MgO. This rate constant was considerably greater than that observed for ZnO (0.003 min−1) and MgO (0.0014 min−1). In particular, this degradation kinetic investigation verified the superiority of the ZnO/MgO nanocomposite for the photocatalytic degradation of MB.
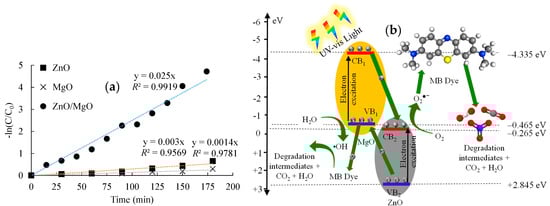
Figure 7.
Photocatalytic degradation of MB dye. (a) Pseudo−first order fitting and (b) suggested degradation mechanisms.
Figure 7b shows the photocatalytic degradation mechanism related to the ZnO/MgO nanocomposite. The conduction and valence band energies of ZnO and MgO were calculated using the equations given by Equations (8) and (9) [43]:
where ECB = conduction band energy; EVB = valence band energy; X = electronegativity value; E = electron energy on the hydrogen scale; Eg = band gap energy.
The ECB and EVB of ZnO were determined as −0.265 eV and +2.845 eV, respectively, whereas the ECB and EVB of MgO were calculated as −4.335 eV and −0.465 eV, respectively. The CB and VB values were then used to derive the proposed MB degradation mechanism (Figure 7b). When the ZnO/MgO nanocomposite was exposed to light irradiation, the photocatalytic reaction governed by Equation (10) would occur to generate e− and h+:
where e−(CB) = electrons in the conduction band; h+(VB) = the electron vacancy in the valence band.
The VB electrons would absorb photon energy and jump into the CBs. The band energy of the ZnO CB possessed a more positive potential than the VB of MgO. Consequently, the photogenerated e− in the CB of MgO would have a stronger affinity to migrate and accumulate in the CB of ZnO instead of recombining with the holes in the MgO VB. Simultaneously, the h+ left in the VB of ZnO would migrate and accumulate in the more negative VB of MgO. This charge transfer tended to reduce the e−/h+ recombination, resulting in enhanced photocatalytic activity of the ZnO/MgO nanocomposite.
Following the charge transfer process, the e− and h+ accumulated in the ZnO CB and MgO VB, respectively, would be free to interact with molecules in the surrounding MB solution. Electrons would reduce molecular oxygen (O2) to create superoxide radicals (O2•−), following Equation (11):
This reduction of O2 could occur because the CB of ZnO possessed a sufficient reduction energy potential (more positive) to facilitate its conversion into O2•−, requiring a reduction energy potential of −0.33 eV [44]. Simultaneously, the h+ accumulated in the MgO VB would oxidize H2O molecules present in the MB solution to form hydroxyl radicals (•OH), following Equation (12):
This reaction could occur because the VB of MgO possessed a sufficient oxidation potential (more negative) to facilitate the conversion of H2O to •OH, which required a reduction potential of about +1.9 eV [45]. The ROS generated (O2•− and •OH) would easily interact with MB molecules (Equation (13)), breaking it down into less toxic and simpler intermediates and eventually CO2 and H2O. Moreover, the photogenerated h+ and e− accumulated on MgO VB and ZnO CB, respectively, could directly interact with MB molecules:
3.8. Photocatalytic Degradation of MB Reported in the Literature
The effectiveness of the ZnO/MgO nanomaterial was compared with other ZnO- and MgO-based photocatalyst materials for MB dye removal (Table 4). Other photocatalysts have exhibited greater degradation performances at lower MB levels [24,31,46,47] and/or longer degradation times [48]. Most studies integrated ZnO and MgO into a third material, resulting in ternary photocatalysts [9,48] for improved performance. In our investigation, the photocatalyst material comprised ZnO and MgO, and the operational factors were optimized to obtain high degradation efficiencies for relatively higher dye concentrations. The results obtained in our study showed that the synthesized nanocomposite material could be successfully utilized for MB degradation.
Table 4.
Comparison of the performance of the ZnO/MgO nanocomposite with other photocatalysts toward methylene blue (MB) removal.
3.9. Economic Feasibility of the ZnO/MgO Nanocomposite Photocatalysis System
A cost-benefit analysis was performed to evaluate the economic feasibility of applying the ZnO/MgO nanocomposite for treating dye-polluted water. The optimum conditions obtained from the optimization of independent variables were utilized to design the photocatalytic system used in the analysis. The photocatalytic system was designed to treat a daily influent volume of 10 m3. This flow rate is suitable for a compact-sized wastewater treatment facility with simple equipment. The breakdown of the economic analysis comprised estimates of the capital/investment costs and operational/running costs (Table 5). These calculations were derived using a precision of ±20% [49], because cost estimation from the real-world application of photocatalysis could vary among countries based on the fluctuations in the currency exchange rates, assumptions applied, feed-in tariffs, and electricity demand. The preciseness and uncertainty of this economic estimation were also assessed by developing sensitivity analysis, varying the photocatalytic reactor cost, chemical prices, and electrical and water consumption costs between −30% and 30% [50] (see Supplementary Figure S6).
Table 5.
Cost estimates for the photocatalytic degradation of MB dye-laden wastewater (10 m3/day) using the ZnO/MgO nanocomposite under unoptimized and ANN-optimized conditions (using a precision of ±20%).
3.9.1. Capital Costs
The one-time expenses incurred to implement the photocatalysis system were represented by the capital costs. About 11.69% of these capital costs accounted for the photocatalytic reactor and tank installations, where the volume (Vc) could be estimated by Equation (14) [20]:
where Q represents the average volume of wastewater treated annually (m3/yr), D is the number of working days per year (assuming 300 days per year), tt is the optimum reaction time (e.g., 90 min), and tw is the number of plant operation hours per day (e.g., 1440 min/d represents a 24 h daily plant operation time).
The obtained tank volume was then applied to calculate the construction cost by Equation (15) [51]:
where Cp represents the price per m3 of a photoreactor unit derived from subcontractor and supplier quotes.
The cost of water collection tanks was also added to the initial investment. Moreover, the prices of mechanical equipment, comprising UV lamps (light source), a stirrer motor, pumps, and a rotary calcination furnace for catalyst synthesis, were also included, as previously reported [52].
3.9.2. Operational Costs
The daily expenses incurred to run the photocatalysis system were represented by the operational costs. These costs included several items related to consumables, electricity consumption, salaries and wages, overheads, and plant maintenance [53]. The costs of chemicals needed to synthesize and apply the ZnO/MgO nanocomposite were estimated by Equation (16):
where Costchemicals is the monthly cost of chemicals incurred (USD/month), Ci is the quantity of chemicals supplied (kg/month), and Pi is the chemical price per unit weight (USD/kg)
The electricity utilization costs comprised the power consumption to operate an electronic overhead stirrer (69 W), pumps (55 W), and UV lamps (46 W) [54]. This amount of energy was used to estimate the electrical energy per order (EEO) by Equation (17) [55]:
where P is the power of all electrical equipment (using 170 W), V is the volume of treated water per day (L), and k is the reaction rate constant (ln (C/Co)).
The consumption per m3 (EEO) was used to estimate the annual consumption for the plant receiving 10 m3/day. The annual consumption in KWh and the electricity feed-in tariff (USD 0.13/kWh) were then used to estimate the electricity consumption cost per year.
The costs of water required for photocatalyst synthesis and regeneration were also considered. This estimate was derived from the lab-scale preparation procedures, where ≈1 L of water was required to synthesize and regenerate 1 g of the ZnO/MgO nanocomposite. The water tariff was set at USD 0.24/m3.
The costs associated with the repair and maintenance of the treatment system were estimated at 1.5% of all capital costs [51]. An employee salary rate of USD 120/month was utilized to determine the labor costs associated with water sampling (three samples/week), cleaning and repair of equipment, and operation of the photocatalysis system. Statutory obligations (taxes) were also considered as 1% of the total capital costs. These operational prices resulted in a total running treatment cost of USD 5.48/m3.
3.10. Meeting the Sustainability Dimensions from the Photocatalytic Degradation of Dyes
The current study’s outputs maintain several benefits that could fulfill the sustainability dimensions. For example, removing dye pollutants (e.g., MB) from the textile industrial effluents before final disposal tends to protect the aquatic environment. This aim has a positive correlation with SDG14 “Life Below Water” by protecting and conserving the aquatic species from marine pollution because dyes negatively affect the fish organs, such as the liver and gills, and reduce sunlight penetration and the related photosynthetic activities [6]. Moreover, this treatment facility could meet the targets of SDG3 “Good Health and Well-being” because textile dyes can enter the food chain through biomagnification and biotransformation [2]. Also, the study demonstrates that ANN is an innovative tool that could optimize the photocatalytic treatment facility and reduce the operational costs, meeting SDG9 “Industry, Innovation, and Infrastructure”. Furthermore, using sunlight as an irradiation source (cleaner energy) and reusing the synthesized ZnO/MgO photocatalyst under six consecutive cycles complies with the targets of SDG12 “Responsible Consumption and Production”. This SDG could also be improved by conducting essential research on the management and/or disposal of exhausted ZnO/MgO photocatalysts. For Instance, Razzaghian Ghadikolaee et al. [56] found that the photocatalyst material after exhaustion could be managed by using it as an attractive additive to maintain better 3D-printed concrete properties.
Despite the aforementioned benefits provided by photocatalytic dye degradation, some aspects related to the synthesis of the catalyst materials and their disposal after reuse should be addressed for enhancing the process’s sustainability. Regarding the manufacturing methods, plant extracts [57] and microorganisms [58] have attracted much attention as reducing agents in the photocatalyst green synthesis process. Applying these eco-friendly and cleaner techniques to synthesize the ZnO/MgO could reduce the chemical costs and minimize exposure to possible material toxicity. Where the recyclability of the spent catalyst material is concerned, the ZnO/MgO nanocomposite should be tested for applications as an additive in the construction industry, following previous research [56]. This benefit would avoid the unrestricted disposal of solid waste to the terrestrial and inland freshwater ecosystems and the related services, meeting the targets of SDG15 “Life on Land”. Assuming that the nanocomposite can neither be applied in construction nor in soil amendment, the spent ZnO and MgO can be treated by thorough washing to remove any adsorbed pollutants before disposal into well-designed and properly operated landfills.
4. Conclusions
This study succeeded in providing a promising artificial neural network (ANN) model that could cost-effectively optimize the photocatalytic dye degradation system. Operating the photocatalytic degradation process under the determined optimum conditions enhanced the methylene blue (MB) removal efficiency by ≈12%, while the treatment cost was reduced by about 7% compared with the unoptimized condition. The study outcomes also included the successful synthesis of a ZnO/MgO photocatalyst that had a narrower optical band gap and better surface morphology, functional groups, and crystal structure than ZnO and MgO individually. Hence, the proposed artificial intelligence technique can be beneficial for generating more accurate predictions of the photodegradation process in wastewater treatment while maintaining better operational conditions that provide higher economic benefits. Further studies are required to determine the degradation pathway and by-products generated, identify the ROS responsible for the photocatalytic degradation process, use green routes for ZnO/MgO synthesis, and enlarge the data set size for a more accurate ANN training process.
Supplementary Materials
The following supporting information can be downloaded at: https://www.mdpi.com/article/10.3390/su16020529/s1, Figure S1. Initial photocatalysis experiments under light irradiation; Figure S2. N2 adsorption–desorption isotherms of (a) ZnO, (b) MgO, and (c) ZnO/MgO; Figure S3. Plot of actual versus predicted MB removal efficiencies; Figure S4. Optimization of photocatalysis independent variables using the response surface methodology (RSM) based on the quadratic regression model; Figure S5. Recyclability of the photocatalyst material; Figure S6. Effect of variation from −30% to 30% on the total treatment cost; Table S1. Chemicals and reagents used for experimental procedures. All chemicals were utilized in the experiments without further purification; Table S2. Selection of best number of neurons in the hidden layer (N) and transfer function based on the smallest MSE of different ANN models for predicting MB removal efficiencies. Here, trainoss: one step secant; traincgb: conjugate gradient with Powell–Beale restart; trainbfg: Broyden–Fletcher– Goldfarb–Shanno (BFGS) quasi-Newton; trainlm: Levenberg–Marquardt; trainscg: scaled conjugate gradient; traincgf: Fletcher–Powell conjugate gradient; traingd: gradient descent back-propagation; Table S3. Optimum weights and biases of the feed-forward back-propagation ANN (4–8–1) with trainlm training function used to predict the MB R(%). Reference [59] is cited in the supplementary materials.
Author Contributions
Conceptualization, A.A., M.F. and M.N.; methodology, K.F.N.; formal analysis, K.F.N.; writing—original draft preparation, K.F.N.; writing—review and editing, A.A., M.F. and M.N.; visualization, A.A., M.F. and M.N.; supervision, A.A., M.F. and M.N. All authors have read and agreed to the published version of the manuscript.
Funding
This research was funded by funds that were partially supported by TICAD7, Egypt-Japan University of Science and Technology (E-JUST), and Japan International Cooperation Agency (JICA).
Institutional Review Board Statement
Not applicable.
Informed Consent Statement
Not applicable.
Data Availability Statement
The data that support the findings of this study are available within the article (and/or) its Supplementary Materials.
Acknowledgments
The first author is very grateful to TICAD7 for providing financial support in the form of an MSc. scholarship. Also, thanks to JICA-Japan International Cooperation Agency for providing all facilities and equipment to accomplish this study.
Conflicts of Interest
The authors declare no conflicts of interest.
References
- Wang, B.; Suen, H.; Zhang, B. Hydrodynamic cavitation as a promising route for wastewater treatment—A Review. Chem. Eng. J. 2022, 412, 128685. [Google Scholar] [CrossRef]
- Vasiljevic, Z.Z.; Dojcinovic, M.P.; Vujancevic, J.D.; Jankovic-Castvan, I.; Ognjanovic, M.; Tadic, N.B.; Stojadinovic, S.; Nikolic, M.V.; Brankovic, G.O. Photocatalytic degradation of methylene blue under natural sunlight using iron titanate nanoparticles prepared by a modified sol-gel method: Methylene blue degradation with Fe2TiO5. R. Soc. Open Sci. 2020, 7, 200708. [Google Scholar] [CrossRef] [PubMed]
- Yang, L.; Zhao, Z.; Wang, H.; Cai, Z. Synthesis of ZnO/ZnS core/shell microsphere and its photocatalytic activity for methylene blue and eosin dyes degradation. J. Dispers. Sci. Technol. 2020, 41, 2152–2158. [Google Scholar] [CrossRef]
- Moorthy, K.; Rathi, B.G.; Shukla, S.P.; Kumar, K.; Bharti, V.S. Acute toxicity of textile dye Methylene blue on growth and metabolism of selected freshwater microalgae. Environ. Toxicol. Pharmacol. 2021, 82, 103552. [Google Scholar] [CrossRef] [PubMed]
- Khan, I.; Saeed, K.; Zekker, I.; Zhang, B.; Hendi, A.H.; Ahmad, A.; Ahmad, S.; Zada, N.; Ahmad, H.; Shah, L.A.; et al. Review on Methylene Blue: Its Properties, Uses, Toxicity and Photodegradation. Water 2022, 14, 242. [Google Scholar] [CrossRef]
- Alkaykh, S.; Mbarek, A.; Ali-Shattle, E.E. Photocatalytic degradation of methylene blue dye in aqueous solution by MnTiO3 nanoparticles under sunlight irradiation. Heliyon 2020, 6, e03663. [Google Scholar] [CrossRef] [PubMed]
- Karim, M.A.; Aziz, K.H.; Omer, K.M.; Salih, Y.M.; Mustafa, F.; Rahman, K.O.; Mohammad, Y. Degradation of aqueous organic dye pollutants by heterogeneous photo-assisted Fenton-like process using natural mineral activator: Parameter optimization and degradation kinetics. In Proceedings of the 7th International Conference on Water Resource and Environment (WRE 2021), Xi’an, China, 1–4 November 2021; Volume 958. [Google Scholar]
- Mendis, A.; Thambiliyagodage, C.; Ekanayake, G.; Liyanaarachchi, H.; Jayanetti, M.; Vigneswaran, S. Fabrication of Naturally Derived Chitosan and Ilmenite Sand-Based TiO2/Fe2O3/Fe-N-Doped Graphitic Carbon Composite for Photocatalytic Degradation of Methylene Blue under Sunlight. Molecules 2023, 28, 3154. [Google Scholar] [CrossRef]
- Karimi, M.A.; Hatefi-Mehrjardi, A.; Askarpour Kabir, A.; Zaydabadi, M. Synthesis, characterization, and application of MgO/ZnO nanocomposite supported on activated carbon for photocatalytic degradation of methylene blue. Res. Chem. Intermed. 2014, 41, 6157–6168. [Google Scholar] [CrossRef]
- Hama Aziz, K.H.; Omer, K.M.; Mahyar, A.; Miessner, H.; Mueller, S.; Moeller, D. Application of Photocatalytic Falling Film Reactor to Elucidate the Degradation Pathways of Pharmaceutical Diclofenac and Ibuprofen in Aqueous Solutions. Coatings 2019, 9, 465. [Google Scholar] [CrossRef]
- Wen, L.; Wang, D.; Xi, J.; Tian, F.; Liu, P.; Bai, Z.W. Heterometal modified Fe3O4 hollow nanospheres as efficient catalysts for organic transformations. J. Catal. 2022, 413, 779–785. [Google Scholar] [CrossRef]
- Akpan, U.G.; Hameed, B.H. Parameters affecting the photocatalytic degradation of dyes using TiO2-based photocatalysts: A review. J. Hazard. Mater. 2009, 170, 520–529. [Google Scholar] [CrossRef] [PubMed]
- Ren, G.; Han, H.; Wang, Y.; Liu, S.; Zhao, J.; Meng, X.; Li, Z. Recent Advances of Photocatalytic Application in Water Treatment: A Review. Nanomaterials 2021, 11, 1804. [Google Scholar] [CrossRef] [PubMed]
- Liyanaarachchi, H.; Thambiliyagodage, C.; Liyanaarachchi, C.; Samarakoon, U. Efficient photocatalysis of Cu doped TiO2/g-C3N4 for the photodegradation of methylene blue. Arab. J. Chem. 2023, 16, 104749. [Google Scholar] [CrossRef]
- Gracien, E.B.; Jérémie, M.L.; Joseph, L.K.-K.; Omer, M.M.; Antoine, M.K.; Hercule, K.M.; Gerard, M.N. Role of hydroxyl radical scavenger agents in preparing silver nanoparticles under γ-irradiation. SN Appl. Sci. 2019, 1, 961. [Google Scholar] [CrossRef]
- Wu, H.; Gao, C.; Ma, L.; Wang, L. Controllable microemulsion method for the synthesis of Mg(OH)2/PS core–shell structures. Micro Nano Lett. 2021, 16, 413–418. [Google Scholar] [CrossRef]
- Mohamed, O.A.; Masood, S.H.; Bhowmik, J.L. Optimization of fused deposition modeling process parameters for dimensional accuracy using I-optimality criterion. Meas. J. Int. Meas. Confed. 2016, 81, 174–196. [Google Scholar] [CrossRef]
- Amani-Ghadim, A.R.; Aber, S.; Olad, A.; Ashassi-Sorkhabi, H. Optimization of electrocoagulation process for removal of an azo dye using response surface methodology and investigation on the occurrence of destructive side reactions. Chem. Eng. Process. Process Intensif. 2013, 64, 68–78. [Google Scholar] [CrossRef]
- Bakr, M.; Nasr, M.; Ashmawy, M.; Tawfik, A. Predictive performance of auto-aerated immobilized biomass reactor treating anaerobic effluent of cardboard wastewater enriched with bronopol (2-bromo-2-nitropropan-1,3-diol) via artificial neural network. Environ. Technol. Innov. 2021, 21, 101327. [Google Scholar] [CrossRef]
- Alalm, M.G.; Nasr, M. Artificial intelligence, regression model, and cost estimation for removal of chlorothalonil pesticide by activated carbon prepared from casuarina charcoal. Sustain. Environ. Res. 2018, 28, 101–110. [Google Scholar] [CrossRef]
- Sadeghi, M.; Heydari, M.; Javanbakht, V. Photocatalytic and photo-fenton processes by magnetic nanophotocatalysts for efficient dye removal. J. Mater. Sci. Mater. Electron. 2021, 32, 5065–5081. [Google Scholar] [CrossRef]
- Meenakshi, S.; Rajarajan, M.; Rajendran, S.; Kennedy, Z.R.; Brindha, G. Synthesis and characterization of magnesium oxide nanoparticles. Chem. Mater. Sci. 2012, 50, 10618–10620. [Google Scholar]
- Subalakshmi, A.; Kavitha, B.; Srinivasan, N.; Rajarajan, M.; Suganthi, A. An affordable efficient SrWO4 decorated Bi2O3 nanocomposite: Photocatalytic activity for the degradation of methylene blue under visible light irradiation. Mater. Today Proc. 2022, 48, 409–419. [Google Scholar] [CrossRef]
- Vishwanathan, S.; Das, S. Glucose-mediated one-pot hydrothermal synthesis of hollow magnesium oxide-zinc oxide (MgO-ZnO) microspheres with enhanced natural sunlight photocatalytic activity. Environ. Sci. Pollut. Res. 2023, 30, 8512–8525. [Google Scholar] [CrossRef] [PubMed]
- Saoud, K.M.; Saeed, S.; Al-Soubaihi, R.; Bertino, M. Microwave Assisted Preparation of Magnesium Hydroxide Nano-sheets. Am. J. Nanomater. 2014, 2, 21–25. [Google Scholar]
- Mustapha, S.; Ndamitso, M.; Abdulkareem, A.; Tijani, J.; Shuaib, D.; Mohammed, A.; Sumaila, A. Comparative study of crystallite size using Williamson-Hall and Debye-Scherrer plots for ZnO nanoparticles. Adv. Nat. Sci. Nanosci. Nanotechnol. 2019, 10, 045013. [Google Scholar] [CrossRef]
- Yousefi, S.; Ghasemi, B. Precipitator concentration-dependent opto-structural properties of MgO nanoparticles fabricated using natural brine. SN Appl. Sci. 2020, 2, 852. [Google Scholar] [CrossRef]
- Sangeeta, M.; Karthik, K.V.; Ravishankar, R.; Anantharaju, K.S.; Nagabhushana, H.; Jeetendra, K.; Vidya, Y.S.; Renuka, L. Synthesis of ZnO, MgO and ZnO/MgO by Solution Combustion Method: Characterization and Photocatalytic Studies. Mater. Today Proc. 2017, 4, 11791–11798. [Google Scholar] [CrossRef]
- Ansari, A.; Ali, A.; Asif, M.; Shamsuzzaman, A. Microwave-assisted MgO NP catalyzed one-pot multicomponent synthesis of polysubstituted steroidal pyridines. New J. Chem. 2018, 42, 184–197. [Google Scholar] [CrossRef]
- Mensah, K.; Samy, M.; Ezz, H.; Elkady, M.; Shokry, H. Utilization of iron waste from steel industries in persulfate activation for effective degradation of dye solutions. J. Environ. Manag. 2022, 314, 7. [Google Scholar] [CrossRef]
- Munawar, T.; Mukhtar, F.; Yasmeen, S.; Naveed-ur-Rehman, M.; Nadeem, M.S.; Riaz, M.; Mansoor, M.; Iqbal, F. Sunlight-induced photocatalytic degradation of various dyes and bacterial inactivation using CuO–MgO–ZnO nanocomposite. Environ. Sci. Pollut. Res. 2021, 28, 42243–42260. [Google Scholar] [CrossRef]
- Arora, A.K.; Devi, S.; Jaswal, V.S.; Singh, J.; Kinger, M.; Gupta, V.D. Synthesis and characterization of ZnO nanoparticles. Orient. J. Chem. 2014, 30, 1671–1679. [Google Scholar] [CrossRef]
- Ajeesha, T.; Ashwini, A.; George, M.; Manikandan, A.; Mary, J.; Slimani, Y.; Almessiere, M.; Baykal, A. Nickel substituted MgFe2O4 nanoparticles via co-precipitation method for photocatalytic applications. Phys. B Condens. Matter 2021, 606, 412660. [Google Scholar] [CrossRef]
- Yang, X.-H.; Sun, S.-Y.; Fu, H.-T.; Li, W.-F.; An, X.-Z. Two-Step Fabrication of Porous α-Fe2O3@δTiO2 core-shell Nanostructures with Enhanced Photocatalytic Activity. In Proceedings of the 3rd Annual International Conference on Advanced Material Engineering (AME 2017), Shanghai, China, 14–16 April 2017. [Google Scholar]
- Makuła, P.; Pacia, M.; Macyk, W. How To Correctly Determine the Band Gap Energy of Modified Semiconductor Photocatalysts Based on UV–Vis Spectra. J. Phys. Chem. Lett. 2018, 9, 6814–6817. [Google Scholar] [CrossRef] [PubMed]
- Azadi, S.; Karimi-Jashni, A.; Javadpour, S. Modeling and optimization of photocatalytic treatment of landfill leachate using tungsten-doped TiO2 nano-photocatalysts: Application of artificial neural network and genetic algorithm. Process Saf. Environ. Prot. 2018, 117, 267–277. [Google Scholar] [CrossRef]
- Garson, G. Interpreting neural-network connection weights. AI Expert 1991, 6, 46–51. [Google Scholar]
- Kalaycıoğlu, Z.; Uysal, Ö.; Pekcan, Ö.; Erim, F.B. Efficient Photocatalytic Degradation of Methylene Blue Dye from Aqueous Solution with Cerium Oxide Nanoparticles and Graphene Oxide-Doped Polyacrylamide. ASC Omega J. 2023, 8, 13004–13015. [Google Scholar] [CrossRef] [PubMed]
- Sousa, H.R.; Silva, L.S.; Sousa, P.A.A.; Sousa, R.R.M.; Fonseca, M.G.; Osajima, J.A.; Silva-Filho, E.C. Evaluation of methylene blue removal by plasma activated palygorskites. J. Mater. Res. Technol. 2019, 8, 5432–5442. [Google Scholar] [CrossRef]
- Kumar, A.; Pandey, G. The photocatalytic degradation of Methyl Green in presence of Visible light with photoactive Ni0.10:La0.05:TiO2 nanocomposites. IOSR J. Appl. Chem. 2017, 10, 31–44. [Google Scholar]
- Xue, H.; Jiang, Y.; Yuan, K.; Yang, T.; Hou, J.; Cao, C.; Feng, K.; Wang, X. Floating photocatalyst of B-N-TiO2/expanded perlite: A sol-gel synthesis with optimized mesoporous and high photocatalytic activity. Sci. Rep. 2016, 6, 29902. [Google Scholar] [CrossRef]
- Lagergren, S. Zur Theorie der sogenannten Adsorption gelöster Stoffe. K. Sven. Vetenskapsakad. Handl. 1898, 24, 1–39. [Google Scholar]
- Habibi, M.; Habibi-Yangjeh, A.; Pouran, S.R.; Chand, H.; Krishnan, V.; Xu, X.; Wang, C. Visible-light-triggered persulfate activation by CuCo2S4 modified ZnO photocatalyst for degradation of tetracycline hydrochloride. Colloids Surf. A Physicochem. Eng. Asp. 2022, 642, 128640. [Google Scholar] [CrossRef]
- Zhu, F.; Ma, J.; Ji, Q.; Cheng, H.; Komarneni, S. Visible-light-driven activation of sodium persulfate for accelerating orange II degradation using ZnMn2O4 photocatalyst. Chemosphere 2021, 278, 130404. [Google Scholar] [CrossRef] [PubMed]
- Zhou, X.; Zhu, Y.; Niu, Q.; Zeng, G.; Lai, C.; Liu, S.; Huang, D.; Qin, L.; Liu, X.; Li, B.; et al. New notion of biochar: A review on the mechanism of biochar applications in advannced oxidation processes. Chem. Eng. J. 2021, 416, 129027. [Google Scholar] [CrossRef]
- Revathi, V.; Karthik, K. Microwave assisted CdO–ZnO–MgO nanocomposite and its photocatalytic and antibacterial studies. J. Mater. Sci. Mater. Electron. 2018, 29, 18519–18530. [Google Scholar] [CrossRef]
- Panchal, P.; Paul, D.R.; Malik, R.; Sharma, A.; Meena, P.; Patidar, D.; Nehra, S. Phytoextract Mediated ZnO/MgO Nanocomposites for Photocatalytic and Antibacterial Activities. J. Photochem. Photobiol. A Chem. 2019, 385, 112049. [Google Scholar] [CrossRef]
- Xiang, X.; Xie, L.; Li, Z.; Li, F. Ternary MgO/ZnO/In2O3 heterostructured photocatalysts derived from a layered precursor and visible-light-induced photocatalytic activity. Chem. Eng. J. 2013, 221, 222–229. [Google Scholar] [CrossRef]
- Ansari, F.; Nasr, M.; Rawat, I.; Bux, F. Artificial neural network and techno-economic estimation with algae-based tertiary wastewater treatment. J. Water Process Eng. 2021, 40, 101761. [Google Scholar] [CrossRef]
- León, M.; Silva, J.; Carrasco, S.; Barrientos, N. Design, Cost Estimation and Sensitivity Analysis for a Production Process of Activated Carbon from Waste Nutshells by Physical Activation. Processes 2020, 8, 945. [Google Scholar] [CrossRef]
- Ansari, F.A.; Ravindran, B.; Gupta, S.K.; Nasr, M.; Rawat, I.; Bux, F. Techno-economic estimation of wastewater phycoremediation and environmental benefits using Scenedesmus obliquus microalgae. J. Environ. Manag. 2019, 240, 293–302. [Google Scholar] [CrossRef]
- Mahamuni, N.N.; Adewuyi, Y.G. Advanced oxidation processes (AOPs) involving ultrasound for waste water treatment: A review with emphasis on cost estimation. Ultrason. Sonochem. 2010, 17, 990–1003. [Google Scholar] [CrossRef]
- Hamdy, A.; Mostafa, M.K.; Nasr, M. Zero-valent iron nanoparticles for methylene blue removal from aqueous solutions and textile wastewater treatment, with cost estimation. Water Sci. Technol. 2018, 78, 367–378. [Google Scholar] [CrossRef] [PubMed]
- Vishnuganth, M.; Remya, N.; Kumar, M.; Selvaraju, N. Photocatalytic degradation of carbofuran by TiO2-coated activated carbon: Model for kinetic, electrical energy per order and economic analysis. J. Environ. Manag. 2016, 181, 201–207. [Google Scholar] [CrossRef] [PubMed]
- Olya, M.E.; Akhi, Y.; Marandi, R. Improvement of efficiency and electrical energy consumption of AB74 degradation process using a novel cylindrical batch photochemical reactor. Orient. J. Chem. 2016, 32, 1295–1303. [Google Scholar] [CrossRef][Green Version]
- Ghadikolaee, M.R.; Cerro-Prada, E.; Pan, Z.; Korayem, A.H. Nanomaterials as Promising Additives for High-Performance 3D-Printed Concrete: A Critical Review. Nanomaterials 2023, 13, 1440. [Google Scholar] [CrossRef]
- Tesfaye, M.; Gonfa, Y.; Tadesse, G.; Temesgen, T.; Periyasamy, S. Green synthesis of silver nanoparticles using Vernonia amygdalina plant extract and its antimicrobial activities. Heliyon 2023, 9, e17356. [Google Scholar] [CrossRef]
- Lobregas, M.; Camacho, D. Green synthesis of copper-based nanoparticles using microbes. Copp. Nanostructures Next-Gener. Agrochem. Sustain. Agroecosyst. 2022, 2022, 17–44. [Google Scholar] [CrossRef]
- Ajmal, A.; Majeed, I.; Malik, R.N.; Idriss, H.; Nadeem, M.A. Principles and mechanisms of photocatalytic dye degradation on TiO2 based photocatalysts: A comparative overview. RSC Adv. 2014, 4, 37003–37026. [Google Scholar] [CrossRef]


Disclaimer/Publisher’s Note: The statements, opinions and data contained in all publications are solely those of the individual author(s) and contributor(s) and not of MDPI and/or the editor(s). MDPI and/or the editor(s) disclaim responsibility for any injury to people or property resulting from any ideas, methods, instructions or products referred to in the content. |
© 2024 by the authors. Licensee MDPI, Basel, Switzerland. This article is an open access article distributed under the terms and conditions of the Creative Commons Attribution (CC BY) license (https://creativecommons.org/licenses/by/4.0/).