Abstract
Resources and environment are essential elements of social and economic development. Whether the current resources and environment can sufficiently support economic and social development is an important scientific issue. Existing studies have not reached a consensus on the definition, assessment, and forewarning methods of resource and environmental carrying capacity (RECC). Therefore, this study puts forward a ternary theoretical system of RECC from the perspective of pressure, support, and adjustment, constructs a novel evaluation indices system of RECC, introduces a ternary evaluation model, and proposes a hierarchical forewarning method of RECC with a threshold of 1. Furthermore, an empirical demonstration of 31 provinces in China is presented. The results show that: (1) the average RECC index of 31 areas revealed a downward trend from 2012 to 2021, indicating the gradually improving RECC; (2) the RECC indices of central areas were always high, which manifests the poor RECC; (3) the number of provinces with RECC at Alert Level III decreased from 18 to 7, and the number of provinces at Non-Alert Level increased from 6 to 8.
1. Introduction
RECC represents the maximum guaranteed capacity that the natural ecological environment can provide for human production and living activities. This universal and comprehensive concept measures the regional RECC and sustainable development [1]. The study of RECC can be traced back to Malthus’ population theory, where resources are finite and will eventually exert limiting impacts on population growth. This perspective has had a broad and profound impact on subsequent research [2,3]. With rapid socio-economic development, the conflicts between human activities exacerbated by population growth and the resource environment have become increasingly pronounced. The book of “The Limits to Growth” explored the interactions between increasing population, material society, and limited carrying capacity of the Earth, which sparked extensive discussion [4]. In recent years, environmental resource constraints have become a significant challenge for many countries, particularly developing nations that maintain notable economic growth rates [5]. As the largest developing country in the world, China has achieved tremendous economic success since the reform and opening-up policy was implemented. However, the contradiction between economic development and the protection of the environment and resources has intensified and constrained the sustainable development of China [6,7,8]. The 14th Five-Year Plan for China emphasized the need to determine the scale and spatial structure of cities in accordance with the RECC, and to coordinate urban construction, industrial development, ecological conservation, infrastructure, and public services. How to scientifically evaluate the RECC and make reasonable judgments on the carrying status of regional resources and environment to promote sustainable development has become a key issue.
Over the past century, active research areas under the theme of RECC have primarily undergone three stages of evolution. Initially, the focus was on exploring the population carrying capacity and the existence of surplus under certain resource and environmental conditions [9,10,11]. This focus evolved to an emphasis on the high-level protection of resources and the ecological environment [12,13,14] and subsequently shifted toward sustainable development, which highlights the synergy between high-level protection and high-quality development [15,16,17]. In terms of research content, many studies have concentrated on the assessment of RECC. Regarding the objects of assessment, the attention of researchers has transitioned from individual elements to comprehensive systems. The individual elements include forest resources, water resources, land resources, and atmospheric environment, whereas comprehensive systems mainly include ecosystems, natural resource systems, and environmental systems [8,18,19,20,21,22,23,24,25]. From the perspective of assessment methods, earlier studies often featured qualitative assessments of RECC, whereas recent research has placed greater emphasis on quantitative evaluations, which involve static assessments based on historical panel data and dynamic forecasts [26,27,28,29]. The static assessments of RECC typically employed the comprehensive indices method according to various models, including PSR, DPSIR, etc. [30,31]. The dynamic forecasts of RECC usually adopted methods such as system dynamics and machine learning [32,33]. Different indicator systems were constructed based on various definitions and connotations of RECC to provide multiple perspectives of the assessments of RECC [31,34,35,36,37]. Bibliometric keyword analysis results show that terms related to government management and sustainable development, such as management, impact, and sustainable development are the high-frequency keywords. Thus, the main purpose of conducting RECC research is to provide a theoretical basis for the government to formulate management policies that promote sustainable socio-economic development. However, the RECC evaluation values from existing studies are insufficient to reflect whether the carrying capacity has been exceeded, and it is clearly insufficient to achieve the main purpose of RECC research [38]. The role of RECC in guiding and optimizing land spatial development modes and productivity allocation should be fully utilized. Identifying that RECC is not within a reasonable range and providing reference for decision-making is known as forewarning [20,39]. Considering the significant role of thresholds in forewarning, the RECC index calculated by the comprehensive indices method is ineffective in forewarning due to the lack of consensus on RECC thresholds. Based on the spring model, Huang et al. regarded RECC as the resultant force of natural driving forces, social and economic pressures, and the health of the original ecology; then, they assessed the carrying status of the environmental resource system [40]. Shen et al. defined urban RECC as the degree to which the urban carrier can support the load and proposed that urban RECC can be represented by the ratio of urban load to urban carrier, laying the foundation for the establishment of urban RECC threshold [41]. The aforementioned studies introduced new forewarning methods from the perspective of force balance in physics. However, manifestations of social economic development, such as economic growth, industrial structure optimization, technological progress, and enhancement of management capabilities, are often integrated into other aspects rather than being recognized as an independent system that positively regulates RECC. In general, the existing research on RECC evaluation is insufficient in the following three ways: first, the setting of evaluation systems and the selection of indicators of RECC cannot fully demonstrate its deep connotation and logical correlation; second, a practical forewarning method of RECC is lacking; third, the social economic progress factors that play a positive role in improving RECC are not considered as a single object in the existing evaluation systems.
How to establish a scientific, reasonable, and practical evaluation and forewarning system for RECC? How to provide effective recommendations for regional policymakers and stakeholders based on the RECC evaluation and forewarning results? This study selected 31 provinces in China as the research subjects, excluding Hong Kong, Macao, and Taiwan due to the lack of data. The main objectives of this study are: (1) to elucidate the interaction logic and relationships among the pressure on resources and environment brought by socio-economic development, the support provided by resources and environmental endowments, and the adjustment brought by progress in technology, industry, economy, and management; (2) to construct an evaluation index system based on a pressure–support–adjustment ternary system, and to quantify the regional RECC using a ternary evaluation model; (3) to investigate a hierarchical forewarning method with a threshold value of 1; and (4) to enrich the methodologies for RECC research and provide potential insights to formulate differentiated economic development and ecological and environmental protection plans for various types of provinces.
2. Materials and Methods
2.1. Theoretical Framework and Evaluation Index System
2.1.1. Theoretical Framework of RECC
There is no consensus on the evaluation index system of RECC, which results in the great differences in evaluation results from different studies. It is essential to construct a scientific and reasonable evaluation index system based on a good understanding of the components of the RECC system and their interactions. The RECC is reflected by the relationship between the carrier and the load [42]. Urban resource subsystems and natural environment subsystems resist the pressure of human activities and determine the balance state of the urban RECC [41]. The relationship between pressure and support is the basis of the RECC. Changes in natural resources, environment, and human production and living activities may lead to the fluctuations on carrying capacity, whereas progress in the fields of science, technology, and management can increase the support and ultimately improve the carrying capacity. Therefore, the resource endowments, environmental quality, ecosystem service, and the progress in science and technology, industry, economy, and management capacity can resist the pressure from human production and living activities. In general, the RECC can be considered as a pressure–support–adjustment ternary system, which is determined by the relationship between the pressure caused by economic and social development; the support from resources, environment, and ecological endowments; and the adjustment created by science, technology, and economy development.
In this study, the pressure due to socioeconomic development refers to a series of negative effects on local resources and the environment caused by regional urban construction, agricultural production activities [43,44], industrial production activities [45], population agglomeration, and urbanization growth [46]. These impacts include resource consumption, environmental pollution, and ecological damage. The support reflects the supporting capacity of regional resources endowments, the environmental quality, and the self-purification capacity of the environment, which is mainly determined by the inherent characteristics and service of the regional natural ecosystem [38]. The adjustment indicates the adjustment effect of regional scientific and technological progress, industrial adjustment, economic growth, and improved management capacity on the environmental resource system, reflecting the increase in resources and environmental support in a certain period of socioeconomic development. For example, scientific and technological progress may break through the constraints of existing resources, improve the efficiency of resource output, and improve the environmental governance capacity. Specifically, advanced and innovative irrigation technologies and management strategies such as drip irrigation systems, precision irrigation methods, and improved water delivery systems are being adopted to improve the efficiency of agricultural water resource utilization [47]. Industrial restructuring can reduce the emission of pollutants from the source and promote the recycling of resources. Economic growth will enhance investments in environmental governance and the initiative of the entire society to participate in ecological and environmental protection. Strengthening the management capacity can improve the environmental infrastructure construction as well as the efficiency of environmental governance. Specifically, Chinese government is vigorously promoting the action plan for water pollution prevention and control, continuously improving sewage treatment infrastructure, and focusing on enhancing sewage treatment capacity [48]. The theoretical framework of RECC based on a pressure–support–adjustment ternary system is shown in Figure 1.
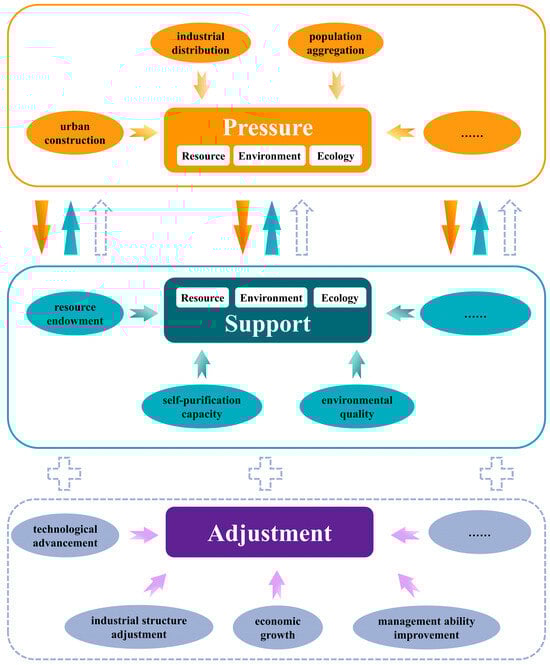
Figure 1.
Theoretical framework of RECC based on a pressure–support–adjustment ternary system.
In summary, RECC is determined by the combined effects of regional pressure, support and adjustment. Specifically, when the support and adjustment index remain constant, the larger the pressure index, the greater the RECC will be, indicating that the situation of resource and environmental carrying capacity tends to deteriorate. Conversely, the lower the pressure index, the lower the RECC will be, indicating that the situation will improve. When the pressure index increases, as well as the support and adjustment indices, especially if their changes exceed the pressure index, the RECC value will decrease and the situation will be improved. On the contrary, if the increase in support and adjustment index is smaller than the increase in pressure index, the RECC value will increase and the situation will deteriorate.
2.1.2. Evaluation Index System of RECC
Based on the connotations of different subsystems, an evaluation index system of RECC was constructed as shown in Table 1. The pressure and support subsystems are corresponding, both of which were set with specific indicators from the perspectives of resources, environment, and ecology. The pressure subsystem comprised a total of 10 indicators, among which, the resource pressure indicators, totaling 3, primarily reflected the pressures on regional water [41], land [38], and grain [22] resources due to regional development and population aggregation; the environmental pressure indicators, totaling 5, covered urban and rural areas, mainly reflecting the pressures from waste generation and emissions caused by industrial and agricultural production [3,49,50,51,52]; the ecological pressure indicators, totaling 2, mainly reflected the pressures on ecosystem elements such as land [5] and natural landscapes [50] caused by human production and development activities. The support subsystem comprised a total of 8 indicators, of which the resource support indicators, totaling 3, reflected the main natural resources such as water [53], soil [54], and grain [55] that a region could be provided for the development of productivity; the environmental support indicators, totaling 3, reflected the environment’s capacity to absorb and purify pollution [37,38,55]; the ecological support indicators, totaling 2, reflected the service capabilities of ecosystems such as forests and water [46].
The adjustment subsystem included adjustments in the areas of science and technology, industry, economy, and management, totaling 12 indicators. Of these, the scientific and technological adjustment indicators, totaling 3, mainly reflected the level of input in scientific and technological innovation personnel and funding [56], as well as the level of innovative output [16]; the industrial adjustment indicators, totaling 2, mainly reflected the industrial structure and the level of advancement [37,49]; the economic adjustment indicators, totaling 4, mainly reflected the economic development level of various regions [49,50,57] and the level of investment in energy-saving and environmental protection funds [54]; the management adjustment indicators, totaling 3, mainly reflected the regional capabilities in sewage [35] and domestic garbage [58] treatment, as well as the comprehensive utilization of general industrial solid waste [8].

Table 1.
RECC evaluation index system based on a pressure–support–adjustment ternary system.
Table 1.
RECC evaluation index system based on a pressure–support–adjustment ternary system.
| System Layer | Dimension Layer | Indicator Layer | Indicator Explanation | Attribute |
|---|---|---|---|---|
| Pressure | Resource | P1 Total water consumption (108 m3) | Reflects the consumption of water resources. | Positive |
| P2 Impervious surface area (km2) | Reflects the degree of change in the nature of existing land resources. | Positive | ||
| P3 Grain consumption (104 tons) | Reflects the pressure on food resource security. | Positive | ||
| Environment | P4 Volume of discharged industrial waste gas (104 tons) | Reflects the impact of industrial development on air quality. | Positive | |
| P5 Volume of discharged industrial wastewater (104 tons) | Reflects the impact of industrial devel-opment on water environment. | Positive | ||
| P6 Volume of generated common indus-trial solid wastes (104 tons) | Reflects the impact of industrial solid waste on the ecological environment. | Positive | ||
| P7 Consumption of chemical fertilizers (tons) | Reflects the impact of agricultural de-velopment on the ecological environment. | Positive | ||
| P8 Carbon emissions (104 tons) | Reflects the degree of negative impact on the regional climate environment, quantified according to the calculation method in the relevant literature [59] based on nighttime light re-mote-sensing data. | Positive | ||
| Ecology | P9 Land stress index | Reflects the degree of damage to the ecosystem, calculated based on the ratio of soil erosion area to national land area. | Positive | |
| P10 Landscape fragmentation | Reflects the impact on ecosystem integrity, calculated by Fragstats4.2 based on the land cover data. | Positive | ||
| Support | Resource | S1 Total amount of water resources (108 m3) | Reflects the supply capacity of water resource. | Positive |
| S2 Theoretical available land area (km2) | Reflects the supply capacity of land resource, calculated by deducting the ecological protection red line area from the regional land area. | Positive | ||
| S3 Total grain production (104 tons) | Reflects the ability to ensure food security. | Positive | ||
| Environment | S4 Concentration of PM2.5 (μg/m3) | Reflects the carrying capacity of air quality for economic and social development. | Negative | |
| S5 Concentration of O3 (μg/m3) | Reflects the carrying capacity of air quality for economic and social development. | Negative | ||
| S6 Carbon sink (tons) | Reflects the ability of absorbing carbon emissions, calculated according to the IPCC carbon accounting coefficient method. | Positive | ||
| Ecology | S7 Vegetation cover index | Reflects the level of vegetation coverage and indicating the support capacity of the ecosystem, represented by NDVI. | Positive | |
| S8 Water network density index | Reflects the service capacity of aquatic ecosystems, calculated by the ratio of regional water area to national land area. | Positive | ||
| Adjustment | Science and technology | A1 R&D personnel of industrial enterprises above a designated size (person) | Reflects the investment of innovative talents. | Positive |
| A2 Internal expenditure on R&D of industrial enterprises above a designated size (104 CNY) | Reflects R&D funding investment. | Positive | ||
| A3 Number of patent grants (unit) | Reflects the level of technological innovation. | Positive | ||
| Industry | A4 Industrial upgrading index | Reflects the regional economic structure, calculated by the ratio of the added value of the tertiary industry to the added value of the secondary industry. | Positive | |
| A5 Proportion of the value added by the tertiary industry to GDP (%) | Reflects the contribution of the tertiary industry to the economy. | Positive | ||
| Economy | A6 Per capita GDP (CNY) | Reflects the level of economic development. | Positive | |
| A7 Per capita disposable income of permanent urban residents (CNY) | Reflects the income level of urban residents. | Positive | ||
| A8 Per capita disposable income of permanent rural residents (CNY) | Reflects the income level of rural residents. | Positive | ||
| A9 Expenditures in local general public budgets for energy conservation and environmental protection (108 CNY) | Reflects the ability of regional investment in promoting energy conservation and environmental protection. | Positive | ||
| Management | A10 Sewage treatment capacity of regional sewage treatment plant (104 tons/day) | Reflects the level of sewage treatment. | Positive | |
| A11 Domestic garbage harmless treatment capacity (ton/day) | Reflects the level of garbage disposal. | Positive | ||
| A12 Volume of integrated reuse of common industrial solid wastes (104 tons) | Reflects the comprehensive utilization capacity of industrial solid wastes. | Positive |
2.2. Research Methodology
2.2.1. Entropy Weight Method (EWM)
In terms of common methods for determining the weight of evaluation indicators, the Analytic Hierarchy Process (AHP) is based on expert scoring and involves a high level of subjectivity, relying heavily on the decision-makers’ thoughts [60]; the Principal Components Analysis (PCA) is used to selecting the representative of each principal component separately, but it does not consider the status of the indicator in other principal components and is prone to losing important information when the load coefficients are approximate to each other [61]; however, the EWM determines the weight considering the degree of indicator variability and allows index data to reflect information objectively and comprehensively [30]. Thus, this study used EWM to determine the weights of evaluation indicators. The main steps of this method are as follows:
Firstly, the indicator values should be standardized to eliminate the influence of differences in scale and range of values between indicators and make different indicators can be compared and analyzed on the same scale. The positive and negative indices used Equation (1) and Equation (2) for standardization, respectively.
where represents the standardized value of the jth indicator in the ith region, xij represents the original value, is the maximum value of the jth item, and is the minimum.
Secondly, the weights of evaluation indicators should be calculated and determined by the equations below:
In Equations (3)–(6), m is the number of evaluation regions, n is the number of evaluation indicator, pij represents the weight of the jth indicator in the ith region, ej represents the information entropy of the jth indicator, gj represents the information utility value, and represents the weight of each indicator.
2.2.2. Linear Weighted Method
The comprehensive index of each evaluation region, namely Ui was calculated by Equation (7):
2.2.3. RECC Ternary Evaluation Model
The RECC index was calculated based on the ternary evaluation model as shown in Equation (8):
In Equation (8), RECC was calculated based on the ternary evaluation model, which reflects the relative state of the regional RECC; P is the pressure index; S is the support index; and A is the adjustment index.
2.2.4. Hierarchical Forewarning Method
The relationship between the fractional value and 1 reflects the size relationship between the numerator and denominator. Therefore, 1 was first set as the critical state value of RECC hierarchical forewarning. Subsequently, 0.5 was determined as the threshold for distinguishing RECC forewarning and non-forewarning levels based on equal division method. Further, 0.75 was identified as the threshold for distinguishing the severity of forewarning using the equal division method [62]. In detail, when RECC ≤ 0.5, the pressure is significantly less than the sum of support and adjustment, this indicates that the resource and environmental pressure caused by regional development is completely within the tolerable range and the regional development is completely sustainable, which is marked in green; when 0.5 < RECC ≤ 0.75, it represents that the support and adjustment withstand the pressure relatively well, but there is a risk of approaching the critical state, which is marked in yellow; when 0.75 < RECC ≤ 1, it demonstrates that the carrying capacity is about to reach or have reached the critical state, indicating that the pressure is large or the support and adjustment is small, and it is necessary to make adjustments according to the obstacle factors to avoid breaking through the critical value, which is marked in orange; and when RECC > 1, this indicates that the regional development is in an unsustainable state and needs to be adjusted rapidly, marked in red. The forewarning levels, color signs, development status, and local government regulation suggestions are shown in Table 2.
Table 2.
RECC forewarning levels and signs.
2.2.5. Obstacle Model
The obstacle model has been widely used to diagnose the main obstacle factors of evaluation index systems [63]. Therefore, in order to identify the main obstacle factors of each subsystem, the obstacle model was used in this paper.
In Equation (9), Oj represents the obstacle degree of each indicator and rij represents the deviation degree of the jth indicator in the ith region.
2.3. Data Sources
The socioeconomic data were sourced from the China Statistical Yearbook and Economic Prediction System (EPS) data platform. The resource and environment data were obtained from the China Water Resources Bulletin, China Environmental Statistics Yearbook, China Soil and Water Conservation Bulletin, China Rural Statistics Yearbook, and Provincial Bulletins on the State of the Ecology and Environment. The land cover data and nighttime light remote-sensing data were derived from the datasets of related studies [64,65]. A small amount of missing data was completed by interpolation, moving average or trend prediction methods.
3. Results
3.1. Pressure Subsystem
Over the period from 2012 to 2021, the national average pressure index demonstrated a gradual decline from 0.2970 to 0.2860, reflecting a 3.72% overall reduction in resource and environmental pressure. From the perspective of 31 provinces, the pressure index of 10 regions (Anhui, Hubei, Jiangxi, Ningxia, Guizhou, Qinghai, Gansu, Xinjiang, Inner Mongolia, Xizang) displayed upward trends, of which Xizang illustrated the largest increase of 75.26%. This may be due to the fact that Xizang faces the least resource and environmental pressure, and an increase in relatively small pressure values could lead to a significant increase. Meanwhile, the other 21 regions showed downward trends, among which Beijing had the most significant decline of 29.88% from 0.0951 in 2012 to 0.0667 in 2021. The significant reduction in resource and environmental pressure in Beijing is mainly attributed to the intensified efforts in resource management, environmental governance, ecological protection and restoration. Moreover, the alleviation of non-capital functions in Beijing (adjustments in economic and spatial structures) has also played a beneficial role.
In terms of the spatial distribution of resource and environmental pressure, in 2012, the regions with high pressure index were mainly concentrated in the Beijing–Tianjin–Hebei region, Liaoning, Shandong, Henan, Jiangsu, and Guangdong, which was similar to the spatial distribution characteristics of the economic development level. Therefore, provinces with relatively high levels of economic development also faced higher resource and environmental pressure. In 2015 and 2018, the national spatial pattern of the pressure index remained relatively stable. In 2021, regions with high pressure index expanded to regions such as Xinjiang and Guizhou, which is accordance with their gradually rapid economic and social development. The pressure index showed a significant spatial difference with central, northeast, eastern, and western regions in descending order. The pressure index of the central region (0.3683) was 1.30 times higher than that in the western region (0.2201). Shandong had the highest average pressure index with a value of 0.6386, which was 26.62 times that of the Xizang (0.0240). Furthermore, the difference in pressure values among the regions was narrowing, and the ratio between the highest and the lowest values of the provincial pressure index decreased from 37.92 in 2012 to 19.42 in 2021, indicating a 48.79% decrease.
3.2. Support Subsystem
From 2012 to 2021, the average support index value increased from 0.1846 to 0.1863, with an increase of 0.92%, which indicates an overall upward trend in the resource and environmental support. The main reason was that the country had increased expenditures in ecological environment, energy conservation, and environmental protection; had vigorously promoted pollution prevention and control; had continued to promote green and low-carbon development; and had comprehensively performed national greening actions since the 18th National Congress of the Communist Party of China. From the temporal change of the support index in each province, there was a general trend of fluctuating change in all regions. The support index values of 17 regions (Beijing, Hebei, Shanxi, Inner Mongolia, Liaoning, Jilin, Heilongjiang, Anhui, Shandong, Henan, Hubei, Chongqing, Sichuan, Guizhou, Yunnan, Shaanxi, and Gansu) showed an overall upward trend. Among them, the support index value of Beijing had the largest increase of 20% from 0.0504 in 2012 to 0.0604 in 2021; the support index value of Yunnan had the smallest increase of 0.95% from 0.2539 in 2012 to 0.2563 in 2021. However, the support index values of 14 regions (Tianjin, Shanghai, Jiangsu, Zhejiang, Fujian, Jiangxi, Hunan, Guangdong, Guangxi, Hainan, Xizang, Qinghai, Ningxia, and Xinjiang) showed an overall downward trend. Among them, the support index value of Guangdong had the largest decline of 16.45%, and Xizang had the smallest decline of 0.3%.
From the perspective of spatial distribution characteristics, the spatial distribution pattern of the national support index remained highly stable from 2012 to 2021. Qinghai, Xizang and Sichuan in the western region and Heilongjiang in the northeast region always had high support index values; 15 provinces (cities, autonomous regions) including Xinjiang, Inner Mongolia Autonomous Region, Jilin, Shandong, Henan, Anhui, Jiangsu, Hubei, Shanghai, Zhejiang, Jiangxi, Hunan, Yunnan, Guangxi and Guangdong were middle-value areas; the remaining 12 provinces (cities, autonomous regions) were low-value areas. The average support index values in descending order belonged to the northeast, western, central and eastern regions. In addition, there were significant regional differences in support index among different provinces, and the differences showed a widening trend. In 2021, Qinghai had the highest support index value of 0.5059, whereas Ningxia had the lowest support index value of 0.04. From the perspective of regional relative differences, from 2012 to 2021, the ratio between the highest and lowest values of the support index increased from 11.65 to 12.66, which indicates an expanding trend in the provincial support level gaps.
3.3. Adjustment Subsystem
From the perspective of temporal variation characteristics, over the period from 2012 to 2021, the average value of the national adjustment index showed an overall upward trend from 0.1050 to 0.2392, indicating a 127.81% improvement in the resource and environmental adjustment capacity of the country. From the perspective of the change trend of each province, the adjustment index values of 31 regions across the country increased. The growth rates of 24 regions (Jiangxi, Qinghai, Hainan, Chongqing, Shaanxi, Ningxia, Sichuan, Guizhou, Anhui, Xizang, Guangdong, Gansu, Hubei, Xinjiang, Fujian, Hunan, Henan, Yunnan, Zhejiang, Jilin, Guangxi, Hebei, Shanghai and Jiangsu) exceeded 100%. Among them, Jiangxi actively facilitated the transformation of scientific and technological innovation momentum into the maximum increment of development, with the adjustment index value experiencing the highest growth rate, rising from 0.0552 in 2012 to 0.1841 in 2021, marking an increase of 233.74%.
From the perspective of spatial distribution characteristics, the eastern region had a higher adjustment index value than the western region. In particular, Zhejiang, Jiangsu, Shandong, and Guangdong were high-value areas in terms of the adjustment index; most of the western regions and northeastern provinces such as Heilongjiang and Liaoning were low-value areas; the provinces of central China, except for Jiangxi, were middle-value areas in 2012. In 2021, Tianjin, Inner Mongolia, and Shanxi transitioned from middle-value areas to low-value areas, and the adjustment index values of other provinces remained relatively stable. The adjustment index values in descending order belonged to the eastern, central, northeast, and western regions, which is consistent with the pattern of economic development in China. Meanwhile, influenced by the imbalance in regional socio-economic development, there were considerable differences in the adjustment indices among regions. In 2021, the adjustment index value of Guangdong was the highest (0.7845), which was 9.42 times that of Xizang. However, as the coordinated regional development strategy of China continued to advance, the overall gap in the adjustment index values among provinces showed a trend of narrowing despite fluctuations. The absolute gap reached its maximum value (11.12) in 2018, and the ratio between the highest and lowest values of the regional adjustment index values decreased from 10.32 to 9.42 from 2012 to 2021.
3.4. Evaluation and Forewarning of the RECC
From the perspective of temporal change (Figure 2), the RECC value of 31 provinces generally showed a downward trend, and the average value of RECC in all regions decreased from 1.0944 in 2012 to 0.7225 in 2021 with a decrease rate of 33.98%. The arithmetic mean of the pressure index in various regions decreased from 0.2970 in 2012 to 0.2860 in 2021 with a decrease of 3.72%; the arithmetic mean of the support index in each region increased from 0.1846 in 2012 to 0.1863 in 2021 with an increase of 0.88%; and the arithmetic mean of the adjustment index in various regions increased from 0.1050 in 2012 to 0.2392 in 2021 with an increase of 127.85%. The key to the improvement of the overall resource and environmental carrying capacity in 31 regions of China lies in the significant improvement of resource and environmental regulation capacity. For different regions, except for Xizang and Qinghai, where the RECC values increased and remained at the Non-Alert Level in the past ten years, the RECC values in other regions exhibited a downward trend, which indicates that their resource and environmental carrying capacity was gradually improving. Among them, the RECC values of Beijing, Chongqing, and Zhejiang significantly decreased and ranked in the top three with 60.25%, 54.86%, and 52.47% decreases, respectively.
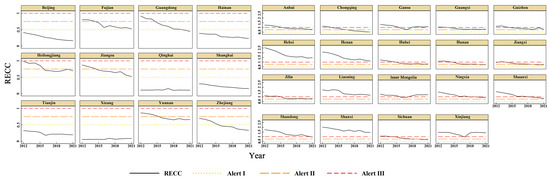
Figure 2.
Temporal changes of the RECC index of 31 provinces in China from 2012 to 2021.
From the perspective of spatial distribution characteristics (Figure 3), the RECC values of 31 regions in China showed a spatial distribution pattern of “high in the north and low in other regions” and remained relatively stable. Specifically, in 2012, Hebei, Henan, Shanxi, Shandong, Liaoning, Shaanxi, Ningxia, and Xinjiang were high-RECC-value areas; in 2021, Shandong, Shaanxi, and Ningxia ceased to be considered as high-RECC-value areas, whereas Gansu and Inner Mongolia emerged as new areas of high value. The high RECC values in high-value areas are mainly due to their relatively high-pressure index values and the relatively low support or adjustment index values. In 2012 and 2021, Hainan, Tianjin, Beijing, Shanghai, Qinghai, and Xizang consistently remained in the low-RECC-value area. At the same time, Guangdong entered the low-value range in 2021. In 2012, the highest RECC value in Hebei (2.5253) was 45.50 times that of the lowest value in Xizang (0.0555). By 2021, this ratio decreased to 17.34, which indicates a notable decline in RECC values for the high-value regions and an overall positive trend in the resource and environmental carrying capacity across the country. There was a significant disparity in RECC values among regions, but this gap showed a trend of narrowing.
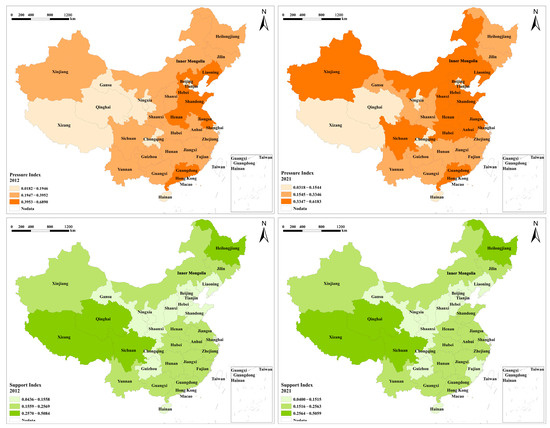
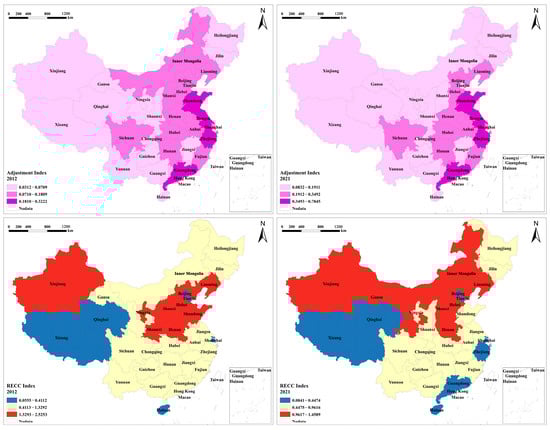
Figure 3.
Spatial distribution of pressure, support, adjustment, and RECC index of 31 provinces in 2012 and 2021.
From the perspective of changes in forewarning levels, the average RECC value of 31 provinces was at Alert Level III from 2012 to 2014, remained at Alert Level II from 2015 to 2019, and remained at Alert Level I from 2020 to 2021, which indicates a stable and improving national resource and environmental carrying capacity status. From 2012 to 2021, the number of areas at Alert Level III in China decreased from 18 to 7; the number of areas at Alert Level II increased from 6 to 8; and the number of areas at Alert Level I increased from 1 to 8; the number of areas at Non-Alert Level increased from 6 to 8. In 2021, except for Hebei, Shanxi, Inner Mongolia, Liaoning, Henan, Gansu, and Xinjiang, the RECC values of 24 evaluated regions in China were below the limit of Alert Level III, which indicates that the pressure on resources and environment remained controlled within the tolerable range and provided more room for economic development. In addition, from 2012 to 2021, the frequency of Hebei, Shanxi, Liaoning, Henan, Shandong, Xinjiang, Inner Mongolia, Gansu, Shaanxi, and Ningxia entering Alert Level III was more than 5, which were 10, 10, 10, 10, 9, 9, 8, 8, 7, and 6, respectively. These areas should be given special attention. Using RECC = 1 as the threshold for critical status, the RECC alert level change types across the 31 provinces in the country could be roughly divided into three categories: relatively stable, gradually improving, and fluctuating. The relatively stable category included six regions: Beijing, Tianjin, Shanghai, Hainan, Xizang, and Qinghai. The gradually improving category included 20 regions: Jilin, Heilongjiang, Jiangsu, Zhejiang, Anhui, Fujian, Shandong, Hubei, Hunan, Guangdong, Guangxi, Chongqing, Guizhou, Yunnan, Shaanxi, Ningxia, Hebei, Shanxi, Liaoning, and Henan. The fluctuating category included five regions: Inner Mongolia, Jiangxi, Sichuan, Gansu, and Xinjiang (Figure 4).
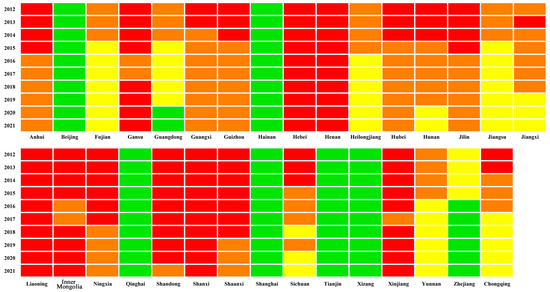
Figure 4.
RECC forewarning levels of 31 provinces in China.
3.5. Obstacle Factor Analysis
To identify the main obstacle factors in each subsystem, this study introduced the obstacle model to calculate the obstacle degree of all indices of all regions from 2012 to 2021. The factors with the top three obstacle degrees were selected as major obstacle factors. Then, according to the occurrence frequency of these major obstacle factors, the top three indicators were selected as the main obstacle factors of different regions. If some indicators had identical frequencies, further screening was conducted according to the average obstacle degree of each indicator in different years. The results are shown in Table 3.
Table 3.
Main obstacle factors and frequencies in 31 provincial administrative regions.
- Areas with “unchanged forewarning levels”
Areas with “unchanged forewarning levels” are consistently at Non-Alert Level or consistently at Alert Level III. Among them, Beijing, Tianjin, and Shanghai were characterized by high socio-economic development levels and strong resources and environmental adjustment capabilities; Hainan was rich in natural ecological resources; and Xizang and Qinghai were endowed with abundant natural resources. Despite their fragile ecological environments, the pressure exerted by human activities on the environment were relatively low, which resulted in better environmental quality. Thus, these six regions remained consistently at Non-Alert Level. Hebei, Shanxi, Liaoning and Henan were consistently at Alert Level III, and the main obstacle factors of their pressure subsystems were P1, P2, P6, and P7. Specifically, the foremost obstacle factor of Hebei was P1, which showed a gradual decreasing trend; the foremost obstacle factor of Shanxi was P2 with a decreasing trend in obstacle degree; the foremost obstacle factor of Liaoning shifted from P2 to P1; and the foremost obstacle factor of Henan shifted from P6 to P4. Hebei and Shanxi were primarily constrained by the total water consumption and impervious surface area, and this restrictive effect showed a downward trend. Meanwhile, the constraining impact of the total water consumption and volume of industrial waste gas discharged on Liaoning and Henan was becoming increasingly prominent. Additionally, the primary obstacle factors in the support subsystem for the four areas included S1, S2, and S8; S2 was consistently one of the primary obstacle factors, and its obstacle degree exhibited an increasing trend and was mainly constrained by resources and ecological support capabilities. The theoretical available land area exerted the greatest restrictive effect on the four areas, and this effect was on a further strengthening trend. In the adjustment subsystem, the primary obstacle factors of these four areas included A1, A2, and A3; A3 was consistently one of the primary obstacle factors, and its obstacle degree exhibited an increasing trend. The improvement of resources and environmental adjustment capabilities in the four areas was mainly restricted by their innovation adjustment capability, among which the number of patent grants had the greatest restrictive effect on the four areas and this effect showed a further strengthening trend.
- 2.
- Areas with “gradually decreasing forewarning levels”
The reduction in the forewarning levels of Jilin, Heilongjiang, Shandong, Chongqing, Yunnan, and Shaanxi was attributed to the enhancement of resource and environmental adjustment and support capacities and the decrease in pressure levels. Among these factors, the increase rate in adjustment capability was significantly higher than the absolute value of the change rate in the latter two capabilities, which served as the main impetus for the decrease in forewarning levels. In terms of resources and environmental pressure, the primary obstacle factors for Jilin, Chongqing, Yunnan, and Shaanxi were consistently P1, P2, and P6. For Heilongjiang and Shandong, the primary obstacle factors were P6, P2, and P3 and P1, P6, and P9, respectively. Obstacle factor P6 (volume of common industrial solid wastes generated) had a universal restrictive effect across the six regions. For the first four regions, the foremost obstacle factor was consistently P2, and its obstacle degree showed a decreasing trend. This result indicates that the reduction in resources and environmental pressure in these regions was mainly constrained by the total water consumption, impervious surface area, and volume of generated common industrial solid wastes, and the impervious surface area had the most significant restrictive effect but an overall declining trend in this effect. The foremost obstacle factor of Heilongjiang remained stable as P6 with a decreasing obstacle degree, which indicates that the volume of generated common industrial solid wastes had the most significant restrictive effect on the reduction in its resources and environmental pressure but with an overall declining trend. The foremost obstacle factor of Shandong was consistently P1 with a decreasing obstacle degree, which indicates that the total water consumption had the most significant restrictive effect on the reduction in its resources and environmental pressure but with an overall declining trend. Regarding resources and environmental support capabilities, the primary obstacle factors were S1, S2, and S8 for Jilin, Heilongjiang, Shandong, Chongqing, and Shaanxi and S2, S3, and S8 for Yunnan. Obstacle factors S2 (theoretical available land area) and S8 (water network density index) had a universal restrictive effect across the six areas. S2 was the foremost obstacle factor for all six areas, and its obstacle degree showed an increasing trend, which indicates that the theoretical available land area had a significantly restrictive effect on the enhancement of resource and environmental support capabilities for the six areas with an overall increasing trend. In terms of resource and environmental adjustment capabilities, the primary obstacle factors for the six areas were A1, A2, and A3, which indicates that the improvement in the levels of resource and environmental adjustment capabilities in these areas was generally constrained by the innovation adjustment capability. A3 was consistently the foremost obstacle factor. For Shandong, the obstacle degree of A3 first increased and subsequently decreased; for the other five areas, the obstacle degree of A3 showed a significant increasing trend. This result indicates that the number of patent grants, i.e., the level of scientific and technological innovation output, had the most significant restrictive effect on the enhancement of resources and environmental adjustment capabilities for the six areas, and there was an overall increasing trend in this effect, which necessitates close attention.
The reduction in the forewarning levels of Jiangsu, Zhejiang, Fujian, Hunan, Guangdong, and Guangxi was primarily due to the significant enhancement of resources and environmental adjustment capacities and the synergistic effect of a substantial decrease in their pressure levels. In terms of resources and environmental pressure, the main obstacle factors were P2, P6, and P7 for Zhejiang, Fujian, and Guangdong; P2, P4, and P6 for Hunan and the Guangxi; and P6, P2, and P9 for Jiangsu. Obstacle factors P2 (impervious surface area) and P6 (volume of common industrial solid wastes generated) had a universal restrictive effect across the six areas. Among these, the foremost obstacle factor for the first five areas was consistently P2 with a decreasing trend. For Jiangsu, the foremost obstacle factor remained stable as P6 with a decreasing obstacle degree. The restrictive effect of the foremost obstacle factors on the reduction in resources and environmental pressure showed a significant downward trend, which indicates that the six areas should focus on the comprehensive improvement of P2 and P6. Regarding resources and environmental adjustment capacities, the primary obstacle factors for Zhejiang, Fujian, Hunan, and the Guangxi were A1, A2, and A3. The primary obstacle factors of Jiangsu were A2, A3, and A4, whereas the primary obstacle factors of Guangdong were A3, A4, and A12. The restrictive effect of A2 (internal expenditure on R&D of industrial enterprises above a designated size) and A3 (number of patent grants) was relatively universal across the six areas. The foremost obstacle factor for Zhejiang, Fujian, Hunan, and the Guangxi remained stable as A3; for Zhejiang, the obstacle degree first increased and subsequently decreased, but the other three regions showed a significant upward trend in the obstacle degree. In 2021, A4 (industrial upgrading index) replaced A3 as the foremost obstacle factor for Jiangsu, which indicates that the development of advanced industries on the enhancement of resources and environmental adjustment capacities of Jiangsu. Similarly, Guangdong adjusted its foremost obstacle factor to A4 since 2020. The number of patent grants played a major restrictive role in the enhancement of resources and environmental adjustment capacities for the first four areas. To continue reducing the forewarning levels, improving the transformation and output of scientific and technological innovation achievements should be a priority. Jiangsu and Guangdong should pay particular attention to the transformation and upgrading of the industrial structure and continuously enhance the level of industrial advancement.
The reduction in forewarning levels of Anhui, Hubei, and Guizhou was primarily due to the significant enhancement of resources and environmental support and adjustment capacities. Notably, the increase in resources and environmental adjustment capacities was significantly greater than that of the former, which constitute the primary driver for the reduction in forewarning levels. With respect to resources and environmental support capacities, the primary obstacle factors were S1, S2, and S8 for Hubei and Guizhou and S1, S2, and S6 for Anhui. The restrictive effects of S1 (total amount of water resources) and S2 (theoretical available land area) were prevalent across the three regions. Of these factors, S2 consistently remained the foremost obstacle factor in all three areas with increasing obstacle degrees. This result indicates that the restrictive effect of the primary obstacle factors on the improvement of resources and environmental support capacities exhibited a marked increase, and a comprehensive improvement of the main obstacle factors S1 and S2 should be a focal point for these areas. For resources and environmental adjustment capacities, the main obstacle factors for Anhui, Hubei, and Guizhou were A1, A2, and A3. This result indicates that the enhancement of the adjustment capacities in these areas was predominantly constrained by scientific and technological adjustment capacities. Concurrently, the foremost obstacle factor in all three regions remained stable as A3 with increasing obstacle degrees. Thus, the restrictive impact of the number of patent grants on the elevation of resources and environmental adjustment capacities in the three areas was progressively intensifying.
The decrease in the forewarning level of the Ningxia was primarily due to the enhancement of the resources and environmental adjustment capacity. Specifically, the main obstacle factors for the Ningxia were consistently A1, A2, and A3, where the improvement of the adjustment capacity was predominantly constrained by the scientific and technological adjustment capacity. The foremost obstacle factor remained stable as A3 with an increasing obstacle degree, which indicates that the number of patent grants progressively intensified its restrictive impact on the enhancement of the resources and environmental adjustment capacity in this area.
- 3.
- Areas with “fluctuated forewarning levels”
In Inner Mongolia, Jiangxi, Sichuan, Gansu, and Xinjiang, their resources and environmental pressure subsystem were primarily impeded by factors P1, P2, P3, P4, P6, and P7, and P2 was consistently the foremost obstacle factor. In this context, Inner Mongolia, Gansu, and Xinjiang showed an increasing trend in the obstacle degree of P2. Conversely, Jiangxi and Sichuan manifested a decreasing trend in the obstacle degree of their foremost obstacle factor, P2. In Sichuan, the primary obstacle factors in the resources and environmental support subsystem were S2, S3, and S8. However, in the remaining four areas (Inner Mongolia, Jiangxi, Gansu, and Xinjiang), S1, S2, and S8 were the primary obstacle factors. The foremost obstacle factor across all five areas was S2, and Inner Mongolia, Sichuan, and Gansu displayed an increasing trend in the obstacle degree of S2, while the other areas showed a decreasing trend. Additionally, the resources and environmental adjustment subsystem in all five areas were primarily impeded by factors A1, A2, and A3, and the foremost obstacle factor was consistently A3 with an increasing trend. These five areas should focus on ameliorating resource pressure, enhancing resource support and scientific and technological adjustment capacities, strengthening the conservation and intensive use of land, and improving the conversion and output levels of scientific and technological achievements.
From the above research results, in the process of policies making to improve the carrying status of regional resources and environment, firstly, the RECC ternary evaluation model can be employed to quantify the RECC values; secondly, the regional forewarning levels can be identified based on the hierarchical forewarning method; and finally, certain improvement measures should be taken in areas that are in Alert Level I-III. Policies making should focus on three aspects: reducing resource and environmental pressure, increasing resource and environmental support, and enhancing resource and environmental adjustment, on the basis of the main obstacle factors of the three subsystems. It is highly targeted and efficient in improving the carrying status of regional resources and environment according to the main obstacle factors.
4. Discussion
From the temporal variation perspective, socioeconomic development is generally accompanied by resource consumption, environmental pollution, and biodiversity losses, which exerts greater pressure on the resource and environmental systems [3,66,67,68]. The average RECC values in 31 provinces generally exhibited a downward trend, which reflects improvements in the national resource and environmental carrying capacity and is consistent with previous research findings [69]. This improvement was due to the continuous advancement of the industrial structure adjustment and technological innovation of China, the strengthening of environmental infrastructure construction, and the in-depth development of pollution prevention and control, which significantly enhances the quality of the ecological environment and adjustment capacity of the resource environment. Xizang and Qinghai, with abundant natural resources but fragile ecological environments, experienced an increase in resource and environmental pressure due to human activities from continuously increasing urbanization levels [38,50]. Their RECC values slightly increased but remained at the Non-Alert Level, and the consumption of resources and environmental damage due to economic and social development remained within the carrying capacity. Regarding other areas, the technological level has been continuously improving, the transformation and upgrading of industries have been deepening, and environmental protection concepts have been gradually promoted [8]. As a result, the pressure on resources and the environment has decreased, the ecological condition has been continuously improving, the environmental governance capacity has been gradually enhanced, and the adjustment capacity of resources and the environment has significantly increased. The RECC values in 29 provinces generally showed a downward trend and an improving overall condition. Among them, Beijing gradually resolved non-capital functions and took the path of reducing development, which significantly reduced the pressure on resources and the environment; Chongqing and Zhejiang with relatively advanced economic and technological development were at the forefront of ecological civilization construction, and their environmental governance capacity gradually strengthened, which significantly increased the adjustment capacity of resources and the environment. The condition of RECC in these three areas greatly improved, and their decreases in RECC values ranked in the top three.
In terms of spatial distribution, Xizang and Qinghai, which have lower RECC values, had fragile ecological environments but were relatively rich in natural resources and sparsely populated, which resulted in a smaller impact from human activities on the resource and environmental system and lower pressure. However, in contrast to economically advanced regions like Beijing and Zhejiang, which demonstrated improving RECC, regions like Xizang and Qinhai faced increasing pressure due to rapid urbanization. Hainan, with its abundant natural resources, had strong support for resources and the environment. Tianjin, Beijing, Shanghai, Guangdong, Zhejiang, and other areas with higher levels of technology and economic development, continuously deepened industrial transformation, industrial upgrade, and strong ecological environment governance capacity. They generally had higher levels of adjustment capacity of resources and the environment, so they had lower RECC values. Regions with higher RECC values, such as the northern arid and semi-arid areas of Xinjiang, Gansu, Inner Mongolia, Ningxia, Shaanxi, Hebei, and Liaoning, had fragile ecological environments, relatively lagging levels of technology and economic development, and weak support and adjustment capacity for resources and the environment. Henan and Shandong, which are populous provinces, experienced greater pressure on the resource and environmental system due to human production and life activities. However, with the rapid development of economy and technology and the continuous advancement of industrial transformation in the ten high-value areas, the level of adjustment capacity continuously increased from 2012 to 2021, the condition of RECC gradually improved, and the gap with the low-value areas of RECC narrowed. Other areas remained stable in the mid-value area of RECC with significant room for improvement in the RECC condition.
The regions at different RECC forewarning levels should take corresponding measures to promote regional sustainable development. As areas that consistently remain at the Non-Alert Level, Beijing, Tianjin, and Shanghai should fully utilize their advantageous resources in economy, technology, and talent to enhance the level of innovation in green technology by increasing fiscal and tax policy support and establishing and refining a market-oriented green technology innovation system and policies for the cultivation and introduction of scientific and technological talent; to promote the development and application of environmental protection technology; to enhance the efficiency of resource utilization; to improve the level of environmental management; and to vigorously develop high-tech industries and high-end services to reduce the consumption of resources and the emission of pollutants [54,70]. In comparison, Hainan should continue to strengthen the regulatory policy constraints on the protection and restoration of natural ecological resources to enhance the service capacity of ecosystems and promote the industrialization of ecology by developing eco-tourism in tropical rainforests and forest-based economies to transform ecological environmental advantages into economic development advantages. Xizang and Qinghai should focus on the comprehensive improvement of ecological environment quality, strengthen the construction of ecological protection laws and regulations, establish a coordination mechanism for ecological protection, promote the construction of national parks, implement ecological restoration projects, reinforce the control of land use for spatial purposes, and reasonably restrict human activities and developmental behaviors in ecologically sensitive areas. For areas that consistently remain at the Alert Level III, the green transformation of production and lifestyle should be promoted to reduce the alert level [71]. Among them, Hebei and Shanxi should strengthen land consolidation and ecological restoration to enhance the water and soil conservation functions of ecosystems, enhance the monitoring and assessment systems for water and soil resources, track the status of these resources in real time, and guide policy adjustments to facilitate the rational distribution and efficient utilization of water and soil resources [72]. Areas with prominent environmental pollution problems, such as Liaoning and Henan, should focus on the transformation of clean production technologies and green development of key industries concerning air pollution to reduce industrial exhaust emissions. In addition, it is necessary to increase investment in innovative funds and personnel and promote the output and transformation of scientific and technological achievements to enhance the adjustment capacity of resource and environment [20].
For regions with gradually decreasing forewarning levels, the main reason for the decrease in forewarning levels of Jilin, Heilongjiang, Shandong, Chongqing, Yunnan, and Shaanxi is the increase in level of adjustment capacity. These areas should thoroughly implement the innovation-driven development strategy, strengthen investment in scientific and technological innovation, and enhance the adjustment capacity of science and technology to reduce their Alert Levels [16]. The decrease in forewarning level of Jiangsu, Zhejiang, Fujian, Hunan, Guangdong, and Guangxi is mainly due to the significant increase in adjustment capacity and significant decrease in pressure level. These areas should rationally plan and utilize land resources and promote green circular economic development to reduce the pressure on their resources and the environment [3,73]. Simultaneously, Zhejiang, Fujian, Hunan, and Guangxi should continuously improve the output and transformation capacity of scientific and technological achievements by scientifically constructing a supporting institutional system; persisting in strengthening the deep integration of industry, academia, and research led by enterprises; and adhering to creating a full-chain service support system to enhance their adjustment capacity of science and technology. Jiangsu and Guangdong should focus on promoting the development of high-tech industries through promoting the integrated deployment of innovation chain, industrial chain, and talent chain to improve their industrial adjustment capacity. The forewarning levels of Anhui, Hubei, and Guizhou have mainly decreased due to the improvement of resource and environmental adjustment capacity and support capacity. These three areas should strengthen the guidance of soil and water conservation planning, establish and improve soil and water conservation planning at all levels, organize close soil and water conservation supervision system, improve the province’s soil and water conservation monitoring network, strengthen policy guidance for investment in science and technology, and improve the output and transformation level of innovative achievements [74]. The decrease in the forewarning level of Ningxia is mainly due to its improved adjustment capacity. Enhancing the adjustment capacity of science and technology is the top priority to reduce its early warning level [67]. Efforts should be made to increase the investment in scientific and technological innovation talents and funds and to strengthen the scientific and technological cooperation with the Eastern Region, opening up the introduction of scientific and technological achievements and transformation channels.
In the case of regions at the fluctuation forewarning levels, to continuously reduce the forewarning levels, Inner Mongolia, Jiangxi, Sichuan, Gansu, and Xinjiang must apply a comprehensive approach with focused breakthroughs. The foremost objective should be to enhance the efficiency of conserving and intensively utilizing land resources by establishing and improving the corresponding incentive and restraint mechanism to reduce the resource pressure [58]. Meanwhile, land resources must be rationally planed and used to achieve a significant breakthrough in improving resources support capacity [75]. Moreover, promoting scientific and technological adjustment capacity should be a focus with a particular emphasis on enhancing the conversion and output levels of scientific and technological achievements by adhering to government guidance; enterprise-led university collaboration; diversified investment; and results-sharing in the industrial chain deployment innovation chain and strengthening science and technology cooperation with the eastern region.
5. Conclusions
This study constructed a pressure–support–adjustment ternary system for evaluating the RECC, conducted an empirical analysis of 31 provincial-level administrative areas in China, and proposed practical recommendations to promote regional sustainable development. The main conclusions are as follows.
The findings reveal that from 2012 to 2021, the national resource and environmental pressure exhibited a fluctuating downward trend with a spatial distribution characterized by “central areas > northeast areas > eastern areas > western areas”. The resource and environmental support capacities generally showed an upward trend over time with a consistent spatial distribution of “northeast areas > western areas > central areas > eastern areas”. The national resource and environmental adjustment capacities displayed an upward trend overall with a spatial distribution of “eastern areas > central areas > northeast areas > western areas”. Moreover, the national resource and environmental carrying status progressively improved. From the perspective of forewarning levels, the number of areas at Alert Level III decreased from 18 to 7 during the study period, whereas the number of areas at the Non-Alert Level increased from 6 to 8.
This study has limitations and deficiencies, which require further in-depth research. First, due to limited data availability, some indicators had to be abandoned in the construction of the index system. For example, the current indicators of the resource and environmental pressure subsystem and the supporting subsystem cannot have a one-to-one correspondence, which limits the completeness and accuracy of the information reflected by the RECC system. Multi-source data should be considered to improve the existing evaluation index system in the future. Second, it is necessary to comprehensively consider various factors of social and economic development and explore the external driving factors of RECC. Third, the RECC were mainly evaluated based on historical data. It is essential to consider predicting the changes in regional resource and environmental pressure, support, adjustment subsystems, and carrying conditions under different scenarios of future social and economic development and to put forward more targeted optimization suggestions.
Author Contributions
Conceptualization, Y.P. and F.W.; methodology, Y.P. and F.W.; software, X.T. and Z.Z.; validation, L.X.; formal analysis, X.T., Z.Z. and L.X.; investigation, Y.P., X.T. and F.W.; resources, Y.P.; data curation, X.T., Z.Z. and J.L.; writing—original draft preparation, Y.P. and F.W.; writing—review and editing, X.T., Z.Z., J.L., L.X. and F.W.; visualization, X.T., Z.Z. and J.L.; supervision, F.W.; project administration, Y.P. and F.W.; funding acquisition, Y.P. All authors have read and agreed to the published version of the manuscript.
Funding
This research was jointly funded by the Environmental Protection Scientific Research Project of Hubei Province (2023) and the Knowledge Innovation Program of Wuhan-Basic Research, grant number 2023020201020451.
Institutional Review Board Statement
Not applicable.
Informed Consent Statement
Not applicable.
Data Availability Statement
The data presented in this study are available on request from the corresponding author.
Conflicts of Interest
The authors declare no conflicts of interest.
References
- Lein, J.K. Applying Expert Systems Technology to Carrying Capacity Assessment: A Demonstration Prototype. J. Environ. Manag. 1993, 37, 63–84. [Google Scholar] [CrossRef]
- Seidl, I.; A Tisdell, C. Carrying capacity reconsidered: From Malthus’ population theory to cultural carrying capacity. Ecol. Econ. 1999, 31, 395–408. [Google Scholar] [CrossRef]
- Zhang, M.; Liu, Y.; Wu, J.; Wang, T. Index system of urban resource and environment carrying capacity based on ecological civilization. Environ. Impact Assess. Rev. 2018, 68, 90–97. [Google Scholar] [CrossRef]
- Meadows, D.; Randers, J.; Meadows, D. Limits to Growth; The New American Library: New York, NY, USA, 1972. [Google Scholar]
- Fan, J.; Wang, Y.; Ouyang, Z.; Li, L.; Xu, Y.; Zhang, W.; Wang, C.; Xu, W.; Li, J.; Yu, J.; et al. Risk forewarning of regional development sustainability based on a natural resources and environmental carrying index in China. Earth’s Future 2017, 5, 196–213. [Google Scholar] [CrossRef]
- Peng, J.; Du, Y.; Liu, Y.; Hu, X. How to assess urban development potential in mountain areas? An approach of ecological carrying capacity in the view of coupled human and natural systems. Ecol. Indic. 2016, 60, 1017–1030. [Google Scholar] [CrossRef]
- Jia, Z.; Cai, Y.; Chen, Y.; Zeng, W. Regionalization of water environmental carrying capacity for supporting the sustainable water resources management and development in China. Resour. Conserv. Recycl. 2018, 134, 282–293. [Google Scholar] [CrossRef]
- Fu, J.; Zang, C.; Zhang, J. Economic and resource and environmental carrying capacity trade-off analysis in the Haihe River basin in China. J. Clean. Prod. 2020, 270, 122271. [Google Scholar] [CrossRef]
- Cohen, J.E. Population growth and earth’s human carrying capacity. Science 1995, 269, 341–346. [Google Scholar] [CrossRef]
- Del Monte-Luna, P.; Brook, B.W.; Zetina-Rejón, M.J.; Cruz-Escalona, V.H. The carrying capacity of ecosystems. Glob. Ecol. Biogeogr. 2004, 13, 485–495. [Google Scholar] [CrossRef]
- Yue, T.; Tian, Y.; Liu, J.; Fan, Z. Surface modeling of human carrying capacity of terrestrial ecosystems in China. Ecol. Model. 2008, 214, 168–180. [Google Scholar] [CrossRef]
- Coll, J.; Garcia-Rubies, A.; Morey, G.; Grau, A.M. The carrying capacity and the effects of protection level in three marine protected areas in the Balearic Islands (NW Mediterranean). Sci. Mar. 2011, 76, 809–826. [Google Scholar] [CrossRef]
- Zhou, J.; Chang, S.; Ma, W.; Wang, D. An unbalance-based evaluation framework on urban resources and environment car-rying capacity. Sustain. Cities. Soc. 2021, 72, 103019. [Google Scholar] [CrossRef]
- Tong, S.; Ji, X.; Chu, Y.; Liu, T.; Wang, F. Spatio-Temporal Analysis about Resource and Environmental Carrying Capacity (RECC) of Mining Cities in Coal-Concentrated Areas: A Case Study of Huaihai Economic Zone in China. Sustainability 2023, 15, 1367. [Google Scholar] [CrossRef]
- Zou, H.; Ma, X. Identifying resource and environmental carrying capacity in the Yangtze River Economic Belt, China: The perspectives of spatial differences and sustainable development. Environ. Dev. Sustain. 2021, 23, 14775–14798. [Google Scholar] [CrossRef]
- Li, Z.; Chen, Y.; Zhang, L.; Wang, W.; Wu, J. Coupling coordination and spatial-temporal characteristics of resource and en-vironmental carrying capacity and high-quality development. Front. Env. Sci. 2022, 10, 971508. [Google Scholar] [CrossRef]
- Yin, Y.; Peng, W.; Xie, X. Spatial–temporal characteristics and obstacle factors analysis of urban resources and environment carrying capacity in the Yellow River Basin cities. Environ. Dev. Sustain. 2023, 1–20. [Google Scholar] [CrossRef]
- Martire, S.; Castellani, V.; Sala, S. Carrying capacity assessment of forest resources: Enhancing environmental sustainability in energy production at local scale. Resour. Conserv. Recycl. 2015, 94, 11–20. [Google Scholar] [CrossRef]
- Wang, Y.; Wang, Y.; Su, X.; Qi, L.; Liu, M. Evaluation of the comprehensive carrying capacity of interprovincial water resources in China and the spatial effect. J. Hydrol. 2019, 575, 794–809. [Google Scholar] [CrossRef]
- Su, Y.; Yu, Y.-Q. Dynamic early warning of regional atmospheric environmental carrying capacity. Sci. Total Environ. 2020, 714, 136684. [Google Scholar] [CrossRef]
- Sun, M.; Wang, J.; He, K. Analysis on the urban land resources carrying capacity during urbanization—A case study of Chinese YRD. Appl. Geogr. 2020, 116, 102170. [Google Scholar] [CrossRef]
- Świąder, M.; Szewrański, S.; Kazak, J.K. Environmental carrying capacity assessment—The policy instrument and tool for sustainable spatial management. Front. Environ. Sci. 2020, 8, 579838. [Google Scholar] [CrossRef]
- Qin, J.; Niu, J.; Niu, W. Research on water resource carrying capacity of capital water conservation functional zone. Front. Environ. Sci. 2023, 10, 1108631. [Google Scholar] [CrossRef]
- Shan, S.; Xu, H.; Qi, X.; Chen, T.; Wang, X. Evaluation and prediction of ecological carrying capacity in the Qilian Mountain National Park, China. J. Environ. Manag. 2023, 339, 117856. [Google Scholar] [CrossRef] [PubMed]
- Wang, J.; Zhang, F.; Tan, M.; Shi, J.; Johnson, V.C.; Kung, H.T. Remote sensing evaluation of Chinese mainland’s compre-hensive natural resources carrying capacity and its spatial-temporal variation characteristics. Environ. Impact. Assess. 2023, 101, 107104. [Google Scholar] [CrossRef]
- Liu, R.Z.; Borthwick, A.G.L. Measurement and assessment of carrying capacity of the environment in Ningbo, China. J. Environ. Manag. 2011, 92, 2047–2053. [Google Scholar] [CrossRef]
- Wang, X.; Zhang, S.; Tang, X.; Gao, C. Research on water resources environmental carrying capacity (WRECC) based on support-pressure coupling theory: A case study of the Guangdong-Hong Kong-Macao Greater Bay Area. J. Environ. Manag. 2022, 320, 115805. [Google Scholar] [CrossRef]
- Huang, A.; Tian, L.; Li, Q.; Li, Y.; Yu, J.; Gao, Y.; Xia, J. Land-Use Planning Serves as a Critical Tool for Improving Resources and Environmental Carrying Capacity: A Review of Evaluation Methods and Application. Int. J. Environ. Res. Public Health 2023, 20, 2370. [Google Scholar] [CrossRef]
- Li, G.; Zhang, Y.; Wang, Y.; Wang, Y.; Tian, J. Evaluation and analysis of tourism resources and environmental carrying ca-pacity (TRECC) of 278 cities in China: A pressure-support perspective. J. Clean. Prod. 2023, 420, 138359. [Google Scholar] [CrossRef]
- Chen, J.; Huang, X.; Jing, Y.; Wen, Z.; Zang, C. Spatial and temporal variation and driving factors of ecological carrying capacity in the Pan-Pearl River Basin, China. Ecol. Indic. 2023, 151, 110318. [Google Scholar] [CrossRef]
- Wang, Z.; Fu, X. Scheme simulation and predictive analysis of water environment carrying capacity in Shanxi Province based on system dynamics and DPSIR model. Ecol. Indic. 2023, 154, 110862. [Google Scholar] [CrossRef]
- Bao, C.; Wang, H.; Sun, S. Comprehensive simulation of resources and environment carrying capacity for urban agglomera-tion: A system dynamics approach. Ecol. Indic. 2022, 138, 108874. [Google Scholar] [CrossRef]
- Morshed, S.R.; Esraz-Ul-Zannat, M.; Fattah, M.A.; Saroar, M. Assessment of the future environmental carrying capacity using machine learning algorithms. Ecol. Indic. 2024, 158, 111444. [Google Scholar] [CrossRef]
- Wang, T.; Xu, S. Dynamic successive assessment method of water environment carrying capacity and its application. Ecol. Indic. 2015, 52, 134–146. [Google Scholar] [CrossRef]
- Wei, X.; Wang, J.; Wu, S.; Xin, X.; Wang, Z.; Liu, W. Comprehensive evaluation model for water environment carrying capacity based on VPOSRM framework: A case study in Wuhan, China. Sustain. Cities Soc. 2019, 50, 101640. [Google Scholar] [CrossRef]
- Chen, Y.; Chen, A.; Zhang, D. Evaluation of resources and environmental carrying capacity and its spatial-temporal dynamic evolution: A case study in Shandong Province, China. Sustain. Cities Soc. 2022, 82, 103916. [Google Scholar] [CrossRef]
- Fan, W.; Song, X.; Liu, M.; Shan, B.; Ma, M.; Liu, Y. Spatio-temporal evolution of resources and environmental carrying capacity and its influencing factors: A case study of Shandong Peninsula urban agglomeration. Environ. Res. 2023, 234, 116469. [Google Scholar] [CrossRef]
- Zhang, F.; Wang, Y.; Ma, X.; Wang, Y.; Yang, G.; Zhu, L. Evaluation of resources and environmental carrying capacity of 36 large cities in China based on a support-pressure coupling mechanism. Sci. Total Environ. 2019, 688, 838–854. [Google Scholar] [CrossRef]
- Tian, Y.; Sun, C. A spatial differentiation study on comprehensive carrying capacity of the urban agglomeration in the Yangtze River Economic Belt. Reg. Sci. Urban Econ. 2018, 68, 11–22. [Google Scholar] [CrossRef]
- Huang, Q.S.; Zhao, Y.; Xu, X.Y.; Wang, G.Q.; Wang, H.R.; Gu, Q.W. Evaluation of resources and environmental carrying capacity based on spring model—Taking Chen Barag Banner in Inner Mongolia as an example. J. Nat. Resour. 2018, 33, 173–184. [Google Scholar] [CrossRef]
- Shen, L.; Shu, T.; Liao, X.; Yang, N.; Ren, Y.; Zhu, M.; Cheng, G.; Wang, J. A new method to evaluate urban resources envi-ronment carrying capacity from the load-and-carrier perspective. Resour. Conserv. Recycl. 2020, 154, 104616. [Google Scholar] [CrossRef]
- Wu, X.; Hu, F. Analysis of ecological carrying capacity using a fuzzy comprehensive evaluation method. Ecol. Indic. 2020, 113, 106243. [Google Scholar] [CrossRef]
- Zhou, K.; Zhou, F.; Chen, L.; Li, H.; Wang, H.; Li, J. Alleviating environmental pressure from livestock production: A “live-stock-resource environmental carrying capacity” perspective in China. Ecol. Indic. 2024, 160, 111800. [Google Scholar] [CrossRef]
- Zhang, Y.; Wang, J.; Dai, C. The adjustment of China’s grain planting structure reduced the consumption of cropland and water resources. Int. J. Environ. Res. Public Health 2021, 18, 7352. [Google Scholar] [CrossRef]
- Li, K.; Wang, J.; Zhang, Y. Heavy metal pollution risk of cultivated land from industrial production in China: Spatial pattern and its enlightenment. Sci. Total Environ. 2022, 828, 154382. [Google Scholar] [CrossRef] [PubMed]
- Liao, S.; Wu, Y.; Wong, S.W.; Shen, L. Provincial perspective analysis on the coordination between urbanization growth and resource environment carrying capacity (RECC) in China. Sci. Total Environ. 2020, 730, 138964. [Google Scholar] [CrossRef] [PubMed]
- Jing, L.; Farooq, M.; Yang, L.; Rafiq, A.; Anwar, A.; Shah, I.; Ameen, M. Optimal water-saving techniques for agricultural production under climate Change in China: A comprehensive review. Eur. Chem. Bull. 2024, 13, 52–76. [Google Scholar] [CrossRef]
- Shi, Z.; She, Z.; Chiu, Y.-H.; Qin, S.; Zhang, L. Assessment and improvement analysis of economic production, water pollution, and sewage treatment efficiency in China. Socio-Econ. Plan. Sci. 2020, 74, 100956. [Google Scholar] [CrossRef]
- Cui, Z.; Wang, Z.G.; Zhang, X.R.; Wang, Y.Y.; Zhang, M. Evaluation of regional environmental carrying capacity and its ob-stacle indicators diagnosis: Evidence from three major urban agglomerations in China. Front. Environ. Sci. 2022, 10, 1015158. [Google Scholar] [CrossRef]
- Liu, Z.; Ren, Y.; Shen, L.; Liao, X.; Wei, X.; Wang, J. Analysis on the effectiveness of indicators for evaluating urban carrying capacity: A popularity-suitability perspective. J. Clean. Prod. 2020, 246, 119019. [Google Scholar] [CrossRef]
- Hu, A.; Li, Q. A pressure-state-response-support framework for assessing regional water environmental carrying status. Front. Environ. Sci. 2022, 10, 1023180. [Google Scholar] [CrossRef]
- Zhang, L.; Nie, Q.; Chen, B.; Chai, J.; Zhao, Z. Multi-scale evaluation and multi-scenario simulation analysis of regional energy carrying capacity—Case study: China. Sci. Total. Environ. 2020, 734, 139440. [Google Scholar] [CrossRef] [PubMed]
- Wang, H.; Xu, Y.; Sulong, R.S.; Ma, H.; Wu, L. Comprehensive evaluation of water carrying capacity in Hebei province, China on principal component analysis. Front. Environ. Sci. 2021, 9, 761058. [Google Scholar] [CrossRef]
- Luo, W.; Ren, Y.; Shen, L.; Zhu, M.; Jiang, Y.; Meng, C.; Zhang, P. An evolution perspective on the urban land carrying capacity in the urbanization era of China. Sci. Total. Environ. 2020, 744, 140827. [Google Scholar] [CrossRef]
- Liu, R.; Pu, L.; Huang, S. Simulation of coastal resource and environmental carrying capacity in the Yangtze River delta coastal zone based on shared socioeconomic pathways. Front. Mar. Sci. 2023, 10, 1008231. [Google Scholar] [CrossRef]
- Xiong, J.; Wang, X.; Zhao, D.; Wang, J. Spatiotemporal evolution for early warning of ecological carrying capacity during the urbanization process in the Dongting Lake area, China. Ecol. Inform. 2023, 75, 102071. [Google Scholar] [CrossRef]
- Zhou, Y.; Liu, Z.; Zhang, B.; Yang, Q. Evaluating water resources carrying capacity of Pearl River Delta by entropy weight-TOPSIS model. Front. Environ. Sci. 2022, 10, 967775. [Google Scholar] [CrossRef]
- Tan, S.; Liu, Q.; Han, S. Spatial-temporal evolution of coupling relationship between land development intensity and resources environment carrying capacity in China. J. Environ. Manag. 2022, 301, 113778. [Google Scholar] [CrossRef]
- Zhang, Y.; Pan, J. Spatio-temporal simulation and differentiation pattern of carbon emissions in China based on DMSP/OLS nighttime light data. China Environ. Sci. 2019, 39, 1436–1446. [Google Scholar] [CrossRef]
- Lv, Y.; Wang, Y.; Zhang, X.; Zhang, D. A study on the carrying capacity of water resources utilizing the fuzzy comprehensive evaluation model—Illustrated by a case from Guantao County. Water 2023, 15, 4277. [Google Scholar] [CrossRef]
- He, L.; Du, Y.; Wu, S.; Zhang, Z. Evaluation of the agricultural water resource carrying capacity and optimization of a planting-raising structure. Agric. Water Manag. 2020, 243, 106456. [Google Scholar] [CrossRef]
- Peng, Y.; Zhu, Z.; Tan, X.; Liu, X.; Liao, J.; Xiang, L.; Wu, F. Evaluation and forewarning of the resource and environmental carrying capacity from the perspective of pressure-support-adjustment: A case study of Yichang city, China. Front. Environ. Sci. 2024, 12, 1378103. [Google Scholar] [CrossRef]
- Guo, M.; Bu, Y.; Cheng, J.; Jiang, Z. Natural gas security in China: A simulation of evolutionary trajectory and obstacle degree analysis. Sustainability 2018, 11, 96. [Google Scholar] [CrossRef]
- Yang, J.; Huang, X. The 30 m annual land cover dataset and its dynamics in China from 1990 to 2019. Earth Syst. Sci. Data 2021, 13, 3907–3925. [Google Scholar] [CrossRef]
- Wu, Y.; Shi, K.; Chen, Z.; Liu, S.; Chang, Z. Developing improved time-series DMSP-OLS-like data (1992–2019) in China by integrating DMSP-OLS and SNPP-VIIRS. IEEE Trans. Geosci. Remote Sens. 2021, 60, 1–14. [Google Scholar] [CrossRef]
- Zhou, Y.; Zhou, J. Urban atmospheric environmental capacity and atmospheric environmental carrying capacity constrained by GDP–PM2.5. Ecol. Indic. 2017, 73, 637–652. [Google Scholar] [CrossRef]
- Zhou, X.; Zheng, B.; Khu, S.T. Validation of the hypothesis on carrying capacity limits using the water environment carrying capacity. Sci. Total. Environ. 2019, 665, 774–784. [Google Scholar] [CrossRef]
- Niu, F.; Jiang, Y. Economic sustainability of China’s growth from the perspective of its resource and environmental supply system: National scale modeling and policy analysis. J. Geogr. Sci. 2021, 31, 1171–1186. [Google Scholar] [CrossRef]
- Liu, C.; Ni, T. Further exploring the driving mechanism of ecological carrying capacity changes at the urban agglomeration level. Ecol. Indic. 2023, 150, 110231. [Google Scholar] [CrossRef]
- Li, C.; Li, H.; Feng, S.; Liu, X.; Guo, S. A study on the spatiotemporal characteristics and change trend of the atmospheric environmental carrying capacity in the Jing-Jin-Ji region, China. J. Clean. Prod. 2019, 211, 27–35. [Google Scholar] [CrossRef]
- Zhu, M.; Shen, L.; Tam, V.W.; Liu, Z.; Shu, T.; Luo, W. A load-carrier perspective examination on the change of ecological environment carrying capacity during urbanization process in China. Sci. Total Environ. 2020, 714, 136843. [Google Scholar] [CrossRef]
- Li, W.; Jiang, S.; Zhao, Y.; Li, H.; Zhu, Y.; Ling, M.; Qi, T.; He, G.; Yao, Y.; Wang, H. Comprehensive evaluation and scenario simulation of water resources carrying capacity: A case study in Xiong’an New Area, China. Ecol. Indic. 2023, 150, 110253. [Google Scholar] [CrossRef]
- Zhu, W.; Jiang, Z.; Cen, L.; Wu, H. Evaluation, simulation, and optimization of land use spatial patterns for high-quality development: A case study of Zhengzhou city, China. J. Geogr. Sci. 2023, 33, 266–288. [Google Scholar] [CrossRef]
- Lyu, Y.; Dong, J.; Zhan, Y. Evaluation of regional water resources carrying capacity in China based on variable weight model and grey-markov model: A case study of Anhui province. Sci. Rep. 2023, 13, 13490. [Google Scholar] [CrossRef]
- He, Y.; Xie, H. Exploring the spatiotemporal changes of ecological carrying capacity for regional sustainable development based on GIS: A case study of Nanchang City. Technol. Forecast. Soc. Change 2019, 148, 119720. [Google Scholar] [CrossRef]


Disclaimer/Publisher’s Note: The statements, opinions and data contained in all publications are solely those of the individual author(s) and contributor(s) and not of MDPI and/or the editor(s). MDPI and/or the editor(s) disclaim responsibility for any injury to people or property resulting from any ideas, methods, instructions or products referred to in the content. |
© 2024 by the authors. Licensee MDPI, Basel, Switzerland. This article is an open access article distributed under the terms and conditions of the Creative Commons Attribution (CC BY) license (https://creativecommons.org/licenses/by/4.0/).