Article

Eco-Environmental Assessment and Trend Analysis of the Yangtze River Middle Reaches Megalopolis Based on a Modified Remote Sensing Ecological Index

1
College of Urban and Environmental Sciences, Central China Normal University, Wuhan 430079, China
2
Key Laboratory for Geographical Process Analysis and Simulation of Hubei Province, Central China Normal University, Wuhan 430079, China
3
Changjiang Spatial Information Technology Engineering Co., Ltd., Wuhan 430010, China
*
Author to whom correspondence should be addressed.
Sustainability 2024, 16(18), 8118; https://doi.org/10.3390/su16188118
Submission received: 7 August 2024 / Revised: 10 September 2024 / Accepted: 12 September 2024 / Published: 17 September 2024

Abstract

:
China’s accelerating pace of urbanization has placed severe pressure on its ecosystems. Hence, the monitoring and assessment of eco-environmental quality has significant implications for sustainable urban development. By introducing a pollution index, a modified remote sensing ecological index (MRSEI) was constructed to more comprehensively evaluate the spatiotemporal distribution of the eco-environment quality in the middle reaches of the Yangtze River where urbanization has been developing rapidly. Future trends in eco-environmental quality were analyzed using Theil–Sen trend analysis, the Mann–Kendall test, and the Hurst exponent. Environmental influencing factors were also analyzed. Our results show that: (1) The impact of pollution factors on urban agglomerations cannot be overlooked. The MRSEI model introduces a pollution indicator to better assess the eco-environmental quality of urban agglomeration areas. (2) The eco-environmental quality is high in the south and east and low in the north and west, with overall levels ranging between moderate and good. (3) The eco-environmental quality remained stable, improved, and degraded in 86.3%, 3.1%, and 10.7% of the study area, respectively. (4) The land use and land cover type are directly related to the eco-environment. Climate factors indirectly affect the eco-environment. Human activities in cities and urban peripheries lead to land use changes and industrial pollution, which significantly affect environmental quality.

1. Introduction

China’s accelerating pace of urbanization poses an increasingly severe threat to its eco-environment. The expansion of urban areas, population growth, and industrial development have collectively contributed to the emergence of numerous eco-environmental challenges. Among these are wetland shrinkage, biodiversity loss, deforestation, soil erosion, and the contamination of both freshwater and atmospheric resources, amongst others [1]. Hence, the issue of maintaining sustainable economic growth must be addressed while protecting the eco-environment and balancing socioeconomic development and eco-environmental protection [2]. The effective and comprehensive monitoring of eco-environmental quality, the determination of trends, and the analysis of influencing factors are of great significance to the formulation of eco-environmental policies and the promotion of sustainable urban development.
The recent rapid advancement in remote sensing technology has provided an additional methodology for conducting eco-environmental assessments. In comparison to conventional monitoring techniques, remote sensing technology enables the expeditious, real-time, and extensive evaluation of regional eco-environmental quality [3]. A number of particular single indices have been devised for the purpose of characterizing individual aspects of ecological status. The normalized difference vegetation index (NDVI) is a significant indicator that reflects the extent of surface vegetation coverage and is a commonly utilized metric in diverse ecological research [4,5]. The enhanced vegetation index (EVI) exhibits superior accuracy and sensitivity compared to NDVI in regions with dense vegetation, enabling more precise monitoring of vegetation growth patterns [6]. The leaf area index (LAI) is a measure of the number and density of leaves in a given area and is an important indicator for assessing vegetation growth and ecosystem productivity [7]. The land surface temperature (LST) inverted from remote sensing data in the thermal infrared band is of significant value in the study of surface energy balance, the urban heat island effect, drought monitoring, and other related fields [8]. The ratio drought index (RDI) and the standardized precipitation index (SPI) are employed for the assessment of drought intensity [9]. The Normalized Difference Water Index (NDWI) is an effective method for distinguishing water bodies from other landforms. It can be utilized for the monitoring of water resources, the detection of floods, and the observation of changes in lakes and rivers [10].
However, due to the intricate and multifaceted nature of the factors influencing the ecosystem, evaluating its status based on a single ecological indicator is inadequate. In light of these considerations, researchers have put forth an ecological index that is wholly based on remote sensing data, namely the Remote Sensing Ecological Index (RSEI) [11], which comprehensively accounts for four aspects: greenness, wetness, heat, and dryness. This composite index is constructed by extracting the first principal component (PC1) from principal component analysis (PCA), thereby avoiding interference caused by manually determining the weights of each indicator. The method has been successfully applied to eco-environmental assessment at various spatial scales, and its dependability and accuracy have been substantiated in a multitude of studies, demonstrating its ability to reflect the status of the ecosystem [12,13,14]. Furthermore, some researchers have also proposed modifications to the RSEI from different perspectives to enhance its suitability for different study areas. Zhu et al. [15] put forth a modified RSEI, founded upon a moving window model, to monitor the effect of open-pit mining on the eco-environment. Wang et al. [16] developed the arid remote sensing ecological index (ARSEI), which is an appropriate tool for examining the ecological quality of arid regions. Chen et al. [17] substituted PCA with the entropy weighting method to circumvent the possible loss of information caused by the use of PC1. Wang et al. [18] attempted to incorporate waterbodies in the calculation of the RSEI and proposed a remote sensing ecological index considering full elements (RSEIFE), which led to more realistic simulations of ecological effects. However, few studies have modified RSEI from the perspective of pollution factors. On the contrary, pollutants were always an important consideration in ecological environmental studies based on statistical data [19,20]. Therefore, finding an index that could characterize the degree of pollution and could be obtained through remote sensing data is a key issue to modified RSEI.
Although traditional software can be employed for the generation of remote sensing-based ecological indices, these indices are hampered by problems, such as complex operations and low computational efficiency, when they are deployed for the evaluation of extensive and long-term time series data sets. In recent years, Google Earth Engine (GEE) has been applied as an open platform in eco-environmental research [21,22,23]. GEE provides preprocessed data sets that have undergone the conversion of raw numbers into top-of-atmosphere or surface reflectance values, rendering them appropriate for subsequent analysis and eliminating the necessity for dedicated software for radiometric calibration and atmospheric correction. In addition, its immense computational power allows for large-scale ecological assessments based on multiple indicators, large spatial scales, and long time series [24].
The Yangtze River middle reaches megalopolis (YRMRM) represents a pivotal element of the Yangtze River Economic Belt, facilitating connectivity between the eastern and western regions, as well as the southern and northern areas. Moreover, the region serves as a pivotal area for the implementation of the Rise of Central China strategy, the intensification of comprehensive reform and opening up, and the advancement of new urbanization. Therefore, the YRMRM plays a pivotal role in China’s regional development strategy [25]. At present, maintaining the rapid and high-quality urbanization development of the YRMRM under the premise of paying attention to ecological and environmental protection while achieving the coordination of economic development and environment is a key issue that needs to be urgently solved [26]. Therefore, the objectives of the present study were as follows: (1) build a modified RSEI model based on the GEE platform and multi-source remote sensing images; (2) assess the eco-environmental quality and changes in the YRMRMR from 2000 to 2020; (3) analyze the future trend in eco-environmental quality in the YRMRM; and (4) explore the factors that influence the changes in the eco-environmental quality of the YRMRM.

2. Study Area and Data Sources

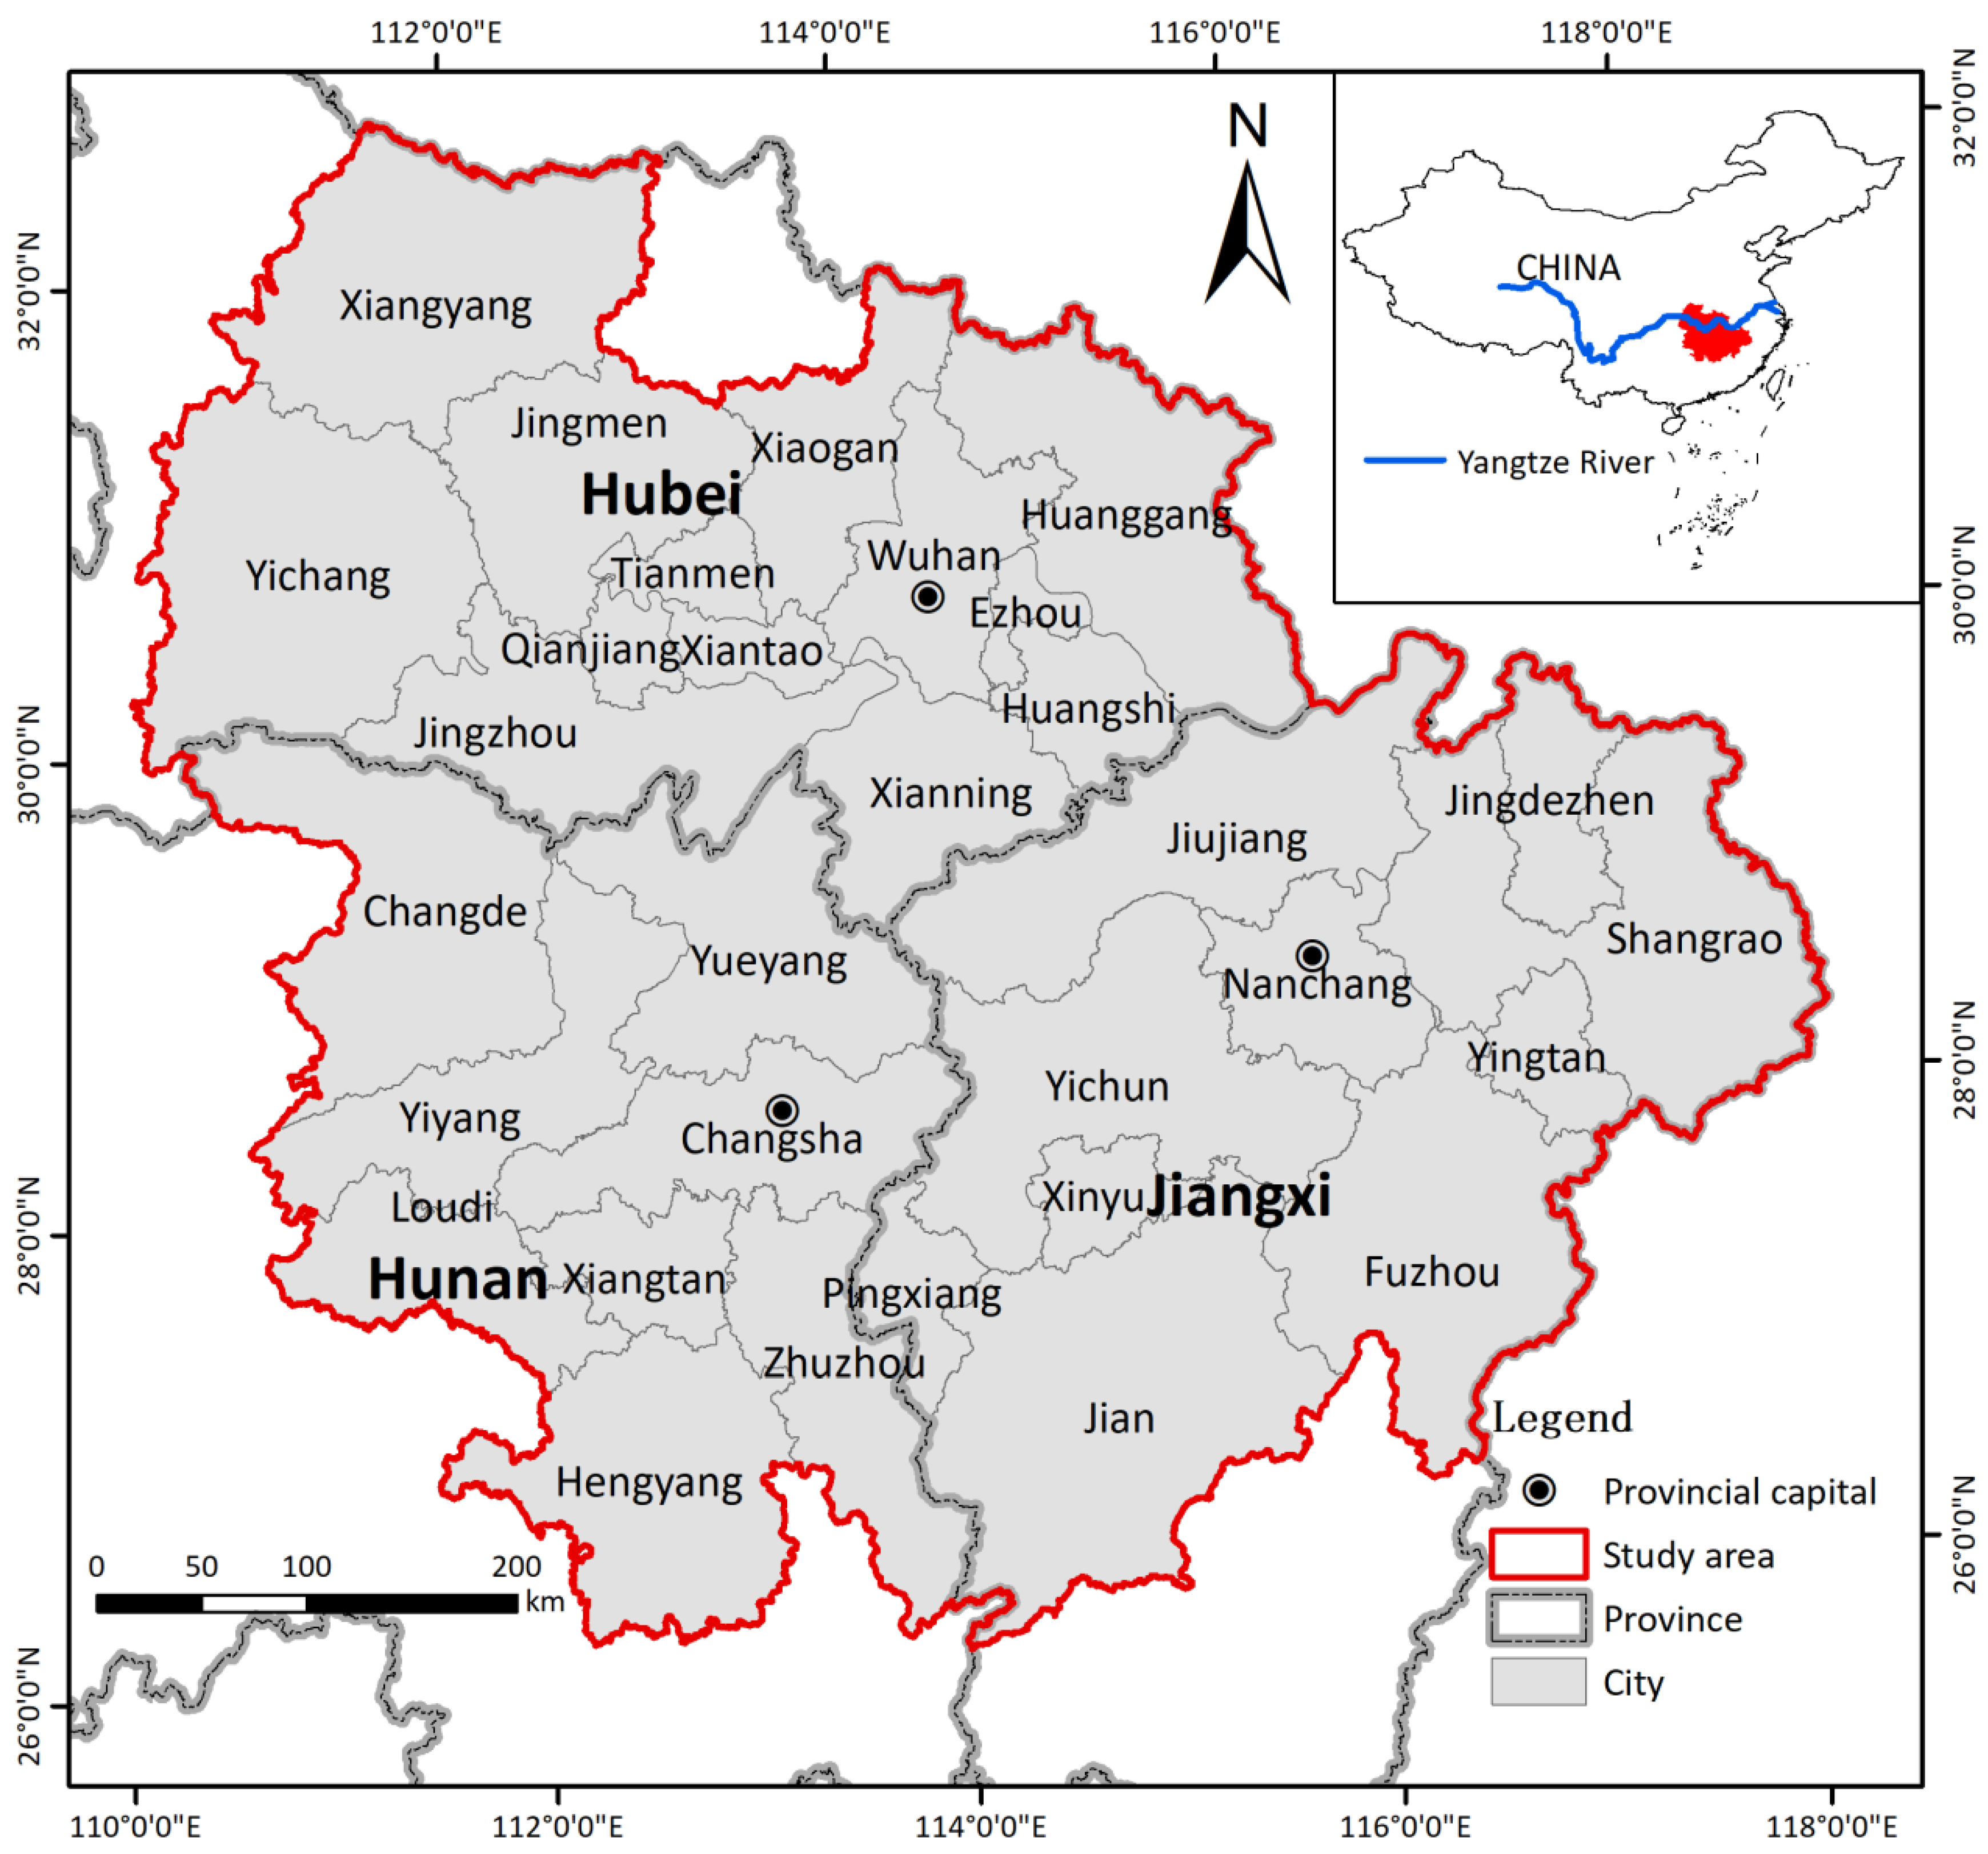
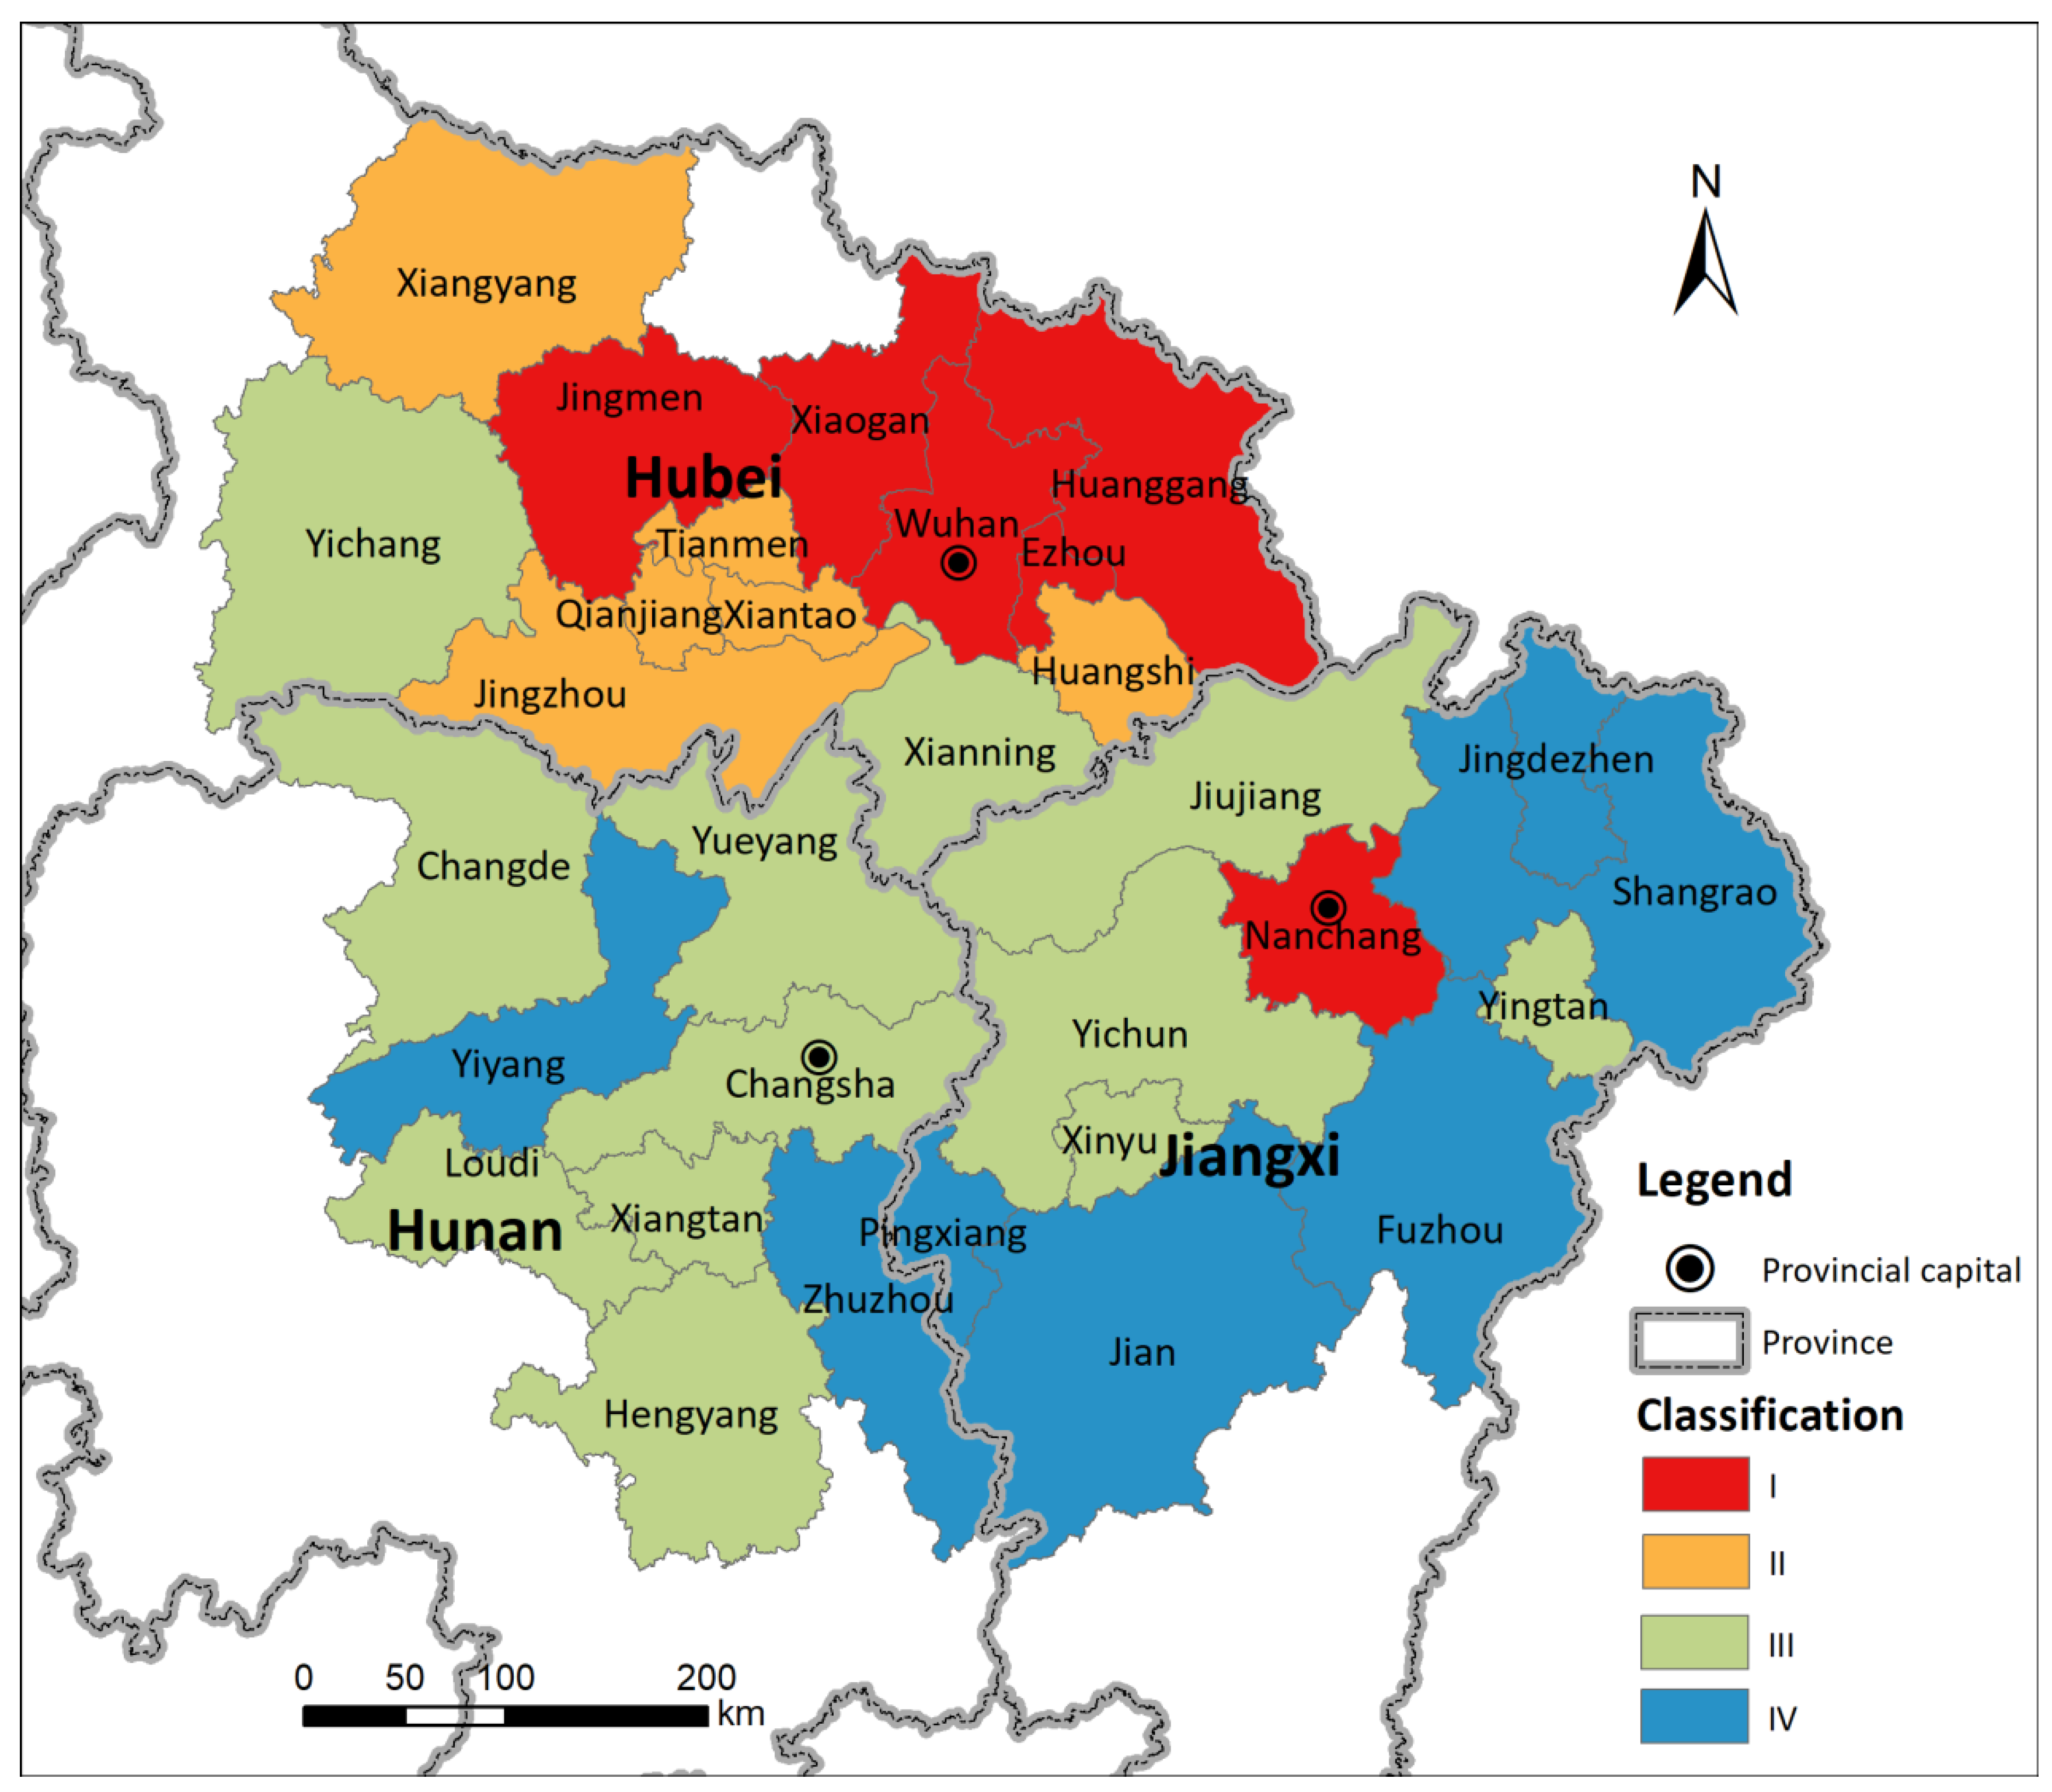
2.1. Study Area Profile

The YRMRM is located in the middle reaches of the Yangtze River (110°15′–118°29′ E, 25°58′–32°37′ N) in central China. It is a national-level mega-urban agglomeration mainly consisting of the Wuhan Metropolitan Area, Changsha–Zhuzhou–Xiangtan Urban Agglomeration, and Poyang Lake Urban Agglomeration. Its planned scope includes 13 cities in the Hubei Province, 8 cities in the Hunan Province, and 10 cities in the Jiangxi Province (Figure 1). The YRMRM spans an area of ~326,100 km2, with a total population of 125 million and gross domestic product (GDP) of ~RMB 7.9 trillion. This region is characterized by a variety of landforms including mountains, hills, and plains. The Jianghan, Dongting Lake, and Poyang Lake plains are interspersed within the region, along with a large number of lakes and water systems. The region exhibits a subtropical monsoon climate, characterized by abundant precipitation, sufficient solar radiation, and a distinct seasonal pattern. Additionally, the region boasts fertile soil, making it a significant contributor to China’s agricultural output. The YRMRM also has a strong urbanization foundation and relatively complete sectors of industrial development. With the implementation of the Rise of Central China and Yangtze Economic Belt strategies, the YRMRM has been positioned as a new growth pole for China’s economic development and pioneer area for new urbanization in central and western China. However, the rapid development of this region has also led to significant eco-environmental changes, such as vegetation loss, lake shrinkage, soil degradation, environmental pollution, and other problems.

2.2. Data Sources and Preprocessing

Landsat data consisted of Landsat 5 (TM) and Landsat 8 (OLI) surface reflectance data products, which were obtained from the United States Geological Survey (USGS; https://glovis.usgs.gov; accessed on 10 December 2023). The second version of these data products has been subjected to geometric, radiometric, and atmospheric corrections. The data are highly accurate and can be directly used for analyses and applications, without traditional preprocessing. To ensure data completeness and study comparability, we selected images that were recorded during seasons with good vegetation growth (June to September) and cloud cover < 10% for each year. Quality assessment (QA) bands were used to further remove areas with cloud cover, followed by median fusion, mosaicking, and clipping to obtain images of the study area.
MODIS data consisted of MOD11A2 and MCD19A2 data products, which were obtained from the USGS Eros Resources Observation and Science (EROS) Center (https://ladsweb.modaps.eosdis.nasa.gov; accessed on 10 December 2023). Images collected during seasons with good vegetation growth (June to September) were selected for each year and low-quality pixels were removed using QA bands, followed by median fusion, mosaicking, and clipping to obtain images of the study area.
The administrative region vector was derived from the Resources and Environmental Science Data Platform (https://www.resdc.cn/; accessed on 25 November 2023).
To facilitate subsequent computations, the data coordinate system was finally converted to the WGS_1984_Albers projected coordinate system, with a uniform precision of 500 m. All data preprocessing and index calculation operations were deployed on the GEE platform.
The statistics and analysis of the data were performed in ArcGIS 10.2, and visualization was performed using ArcGIS 10.2 and Origin 2021.

3. Methods

3.1. Modified RSEI

The RSEI is constructed using PCA based on four indicators: greenness, wetness, heat, and dryness, which, respectively, are represented by the NDVI (normalized difference vegetation index), WET (the wetness component of the tasseled cap transformation), LST (land surface temperature), and NDBSI (Normalized Difference Built-up and Soil Index). These four indicators are closely related to the natural environment and human daily life and are crucial factors for human intuitive judgment of eco-environmental quality [11]. However, the pollution load is not considered; hence, this index cannot fully reflect the eco-environmental quality of a given region, especially in densely populated urban agglomerations with rapid industrial development. Improving the RSEI by adding new indicators was an effective method that can better adapt to different research areas, such as evaluating the ecological quality of agricultural planting areas by adding salinity [27] and evaluating the ecological restoration effect of mining areas by adding black particulates [28]. Referring to these studies, adding an indicator that can characterize the degree of pollution made the modified RSEI more suitable for urban agglomeration areas. Evidence suggests that the aerosol optical depth (AOD), which can be obtained using remote sensing satellites, can be used to characterize the extent of air pollution [29]. Therefore, the AOD index was introduced in this study to modify the RSEI. In order to avoid the influence of large water area on the calculation results, the Modified Normalized Difference Water Index (MNDWI) was used to remove the water body. The various indicators can be calculated using the following equations:
N D V I = ρ n i r ρ r e d ρ n i r + ρ r e d
W E T T M = 0.0315 ρ b l u e + 0.2021 ρ g r e e n + 0.3102 ρ r e d + 0.1594 ρ n i r 0.6706 ρ s w i r 1 0.6109 ρ s w i r 2
W E T O L I = 0.1511 ρ b l u e + 0.1973 ρ g r e e n + 0.3283 ρ r e d + 0.3407 ρ n i r 0.7117 ρ s w i r 1 0.4559 ρ s w i r 2
N D B S I = I B I + S I 2
S I = ( ρ n i r + ρ r e d ) ( ρ n i r + ρ b l u e ) ( ρ n i r + ρ r e d ) + ( ρ n i r + ρ b l u e )
I B I = 2 ρ s w i r 1 ρ s w i r 1 + ρ n i r ( ρ n i r ρ n i r + ρ r e d + ρ g r e e n ρ g r e e n + ρ s w i r 1 ) 2 ρ s w i r 1 ρ s w i r 1 + ρ n i r + ( ρ n i r ρ n i r + ρ r e d + ρ g r e e n ρ g r e e n + ρ s w i r 1 )
M N D W I = ρ g r e e n ρ s w i r 1 ρ g r e e n + ρ s w i r 1
where ρ is the corresponding band designation for the Landsat data.
LST data were obtained from the “LST_Day_1km” band of the MOD11A2 data set. AOD data were obtained from the “Optical_Depth_055” band of the MCD19A2 data set.
Because the base units of the five indicators were not uniform, they were normalized. Subsequently, PCA was applied to normalized indicators to obtain PC1 as the initial MRSEI0:
M R S E I 0 = P C 1 [ F ( N D V I , W E T , L S T , N D B S I , A O D ) ]
To facilitate the measurement and comparison of indicators, normalization was also performed on the RSEI0:
M R S E I 0 = P C 1 [ F ( N D V I , W E T , L S T , N D B S I , A O D ) ]
The MRSEI is the modified RSEI constructed in this study, which takes values ranging from 0 to 1. MRSEI values closer to 1 indicate a better ecological status.

3.2. Trend Analysis

Theil–Sen trend analysis, the Mann–Kendall test, and the Hurst exponent were employed to study the change trends and sustainability characteristics of the eco-environmental quality in the YRMRM.

3.2.1. Theil–Sen Trend Analysis and Mann–Kendall Test

Theil–Sen trend analysis involves a nonparametric method used to detect trends in time series data [30]. This method does not require any data distribution assumptions and can be applied to normal and non-normal distributed data. It is not significantly affected by data outliers, has a high computation efficiency, yields results that are easily interpreted, and is suitable for the trend analysis of long-term time series data. It is calculated as follows:
β = M e d i a n ( x j x i j i ) j > I
where Median() is the median value and β > 0 indicates an increasing trend.
The Mann–Kendall test is a nonparametric method used to assess the presence or absence of a monotonic trend in time series data [31]. This method is not affected by the data distribution, is suitable for non-normal distribution and outliers, is not sensitive to missing data, and can effectively handle missing data. The test results directly indicate whether the trend is significant, without considering the size of the slope. This method is suitable for testing the trend significance of long-term time series data. The following assumptions are made for time series data H = {X1, X2, ⋯, Xn}: the data in series H0 are arranged in a random order—that is, no significant trend can be observed; series H1 shows an upward or downward trend. The test statistic S is given by the following equation:
S = i = 1 n 1 j = i + 1 n s g n ( x j x i )
where sgn() is the sign function, which can be calculated as follows:
s g n ( x j x i ) = + 1 x j x i > 0 0 x j x i = 0 1 x j x i < 0
The trend test was performed using the test statistic Z, which can be calculated as follows:
Z = S 1 V a r ( S )   S > 0 0                                 S = 0 S + 1 V a r ( S )   S < 0
where the equation for Var() is given by:
V a r ( S ) = n ( n 1 ) ( 2 n + 5 ) 18
In the two-tailed trend test, for a given confidence level (significance level) α, if |Z| ≥ Z1−α/2, then hypothesis H0 should be rejected; that is, in terms of the confidence level α (significance level), the time series data conforms to hypothesis H1 and shows a significant upward or downward trend. The method for determining the trend significance is shown in Table 1.

3.2.2. Hurst Exponent

The Hurst exponent is an effective method for quantitatively describing the long-range dependence of a time series. It has been widely used in various fields, such as hydrology, economics, climatology, geology, and geochemistry, and has recently been applied to research on vegetation cover change [32]. Its basic principle is as follows: For a given time series {X(t)}, t = 1, 2, …, n, the following calculations are performed for any positive integer τ ≥ 1:
Definition of mean series:
X ( τ ) ¯ = 1 τ t = 1 τ X ( τ ) τ = 1 , 2 , , n
Cumulative deviation:
Y ( t , τ ) = t = 1 τ ( X ( τ ) X ( τ ) ¯ ) 1 t τ
Range:
R ( τ ) = max 1 t τ Y ( t , τ ) min 1 t τ Y ( t , τ ) τ = 1 , 2 , , n
Standard deviation:
S ( τ ) = 1 τ t = 1 τ ( X ( t ) X ( τ ) ) 2 τ = 1 , 2 , , n
Hurst exponent:
R ( τ ) S ( τ ) = c τ H
The Hurst exponent H is calculated using the least squares method. If 0.5 < H ≤ 1, the time series is a persistent series, whereby the trend in future changes is consistent with that of past changes. The closer H is to 1, the stronger the persistence. If H = 0.5, the time series is a random series, without any long-term correlation. If 0 ≤ H < 0.5, the time series shows anti-persistence; that is, the trend in future changes is opposite to that of past changes. The closer H is to 0, the stronger the anti-persistence.

4. Results

4.1. PCA

According to the PCA results (Table 2), the eigenvalue contribution rate of PC1 for each year is > 75%, indicating that PC1 has consolidated the vast majority of the features of the five indicators. In addition, the eigenvectors of the five indicators show the same positive or negative distribution on PC1. The eigenvectors of the greenness (NDVI) and wetness (WET) indicators are positive, whereas those of the dryness (NDBSI), heat (LST), and pollution (AOD) indicators are negative. This suggests that the greenness and wetness indicators are beneficial for the eco-environment, whereas the dryness, heat, and pollution indicators have adverse effects on the eco-environment, which conforms to the objective laws of ecology. Therefore, PC1 has consolidated the original information contained in each single indicator while realistically and rationally reflecting the status of the eco-environment. Hence, it can be used to construct the MRSEI.

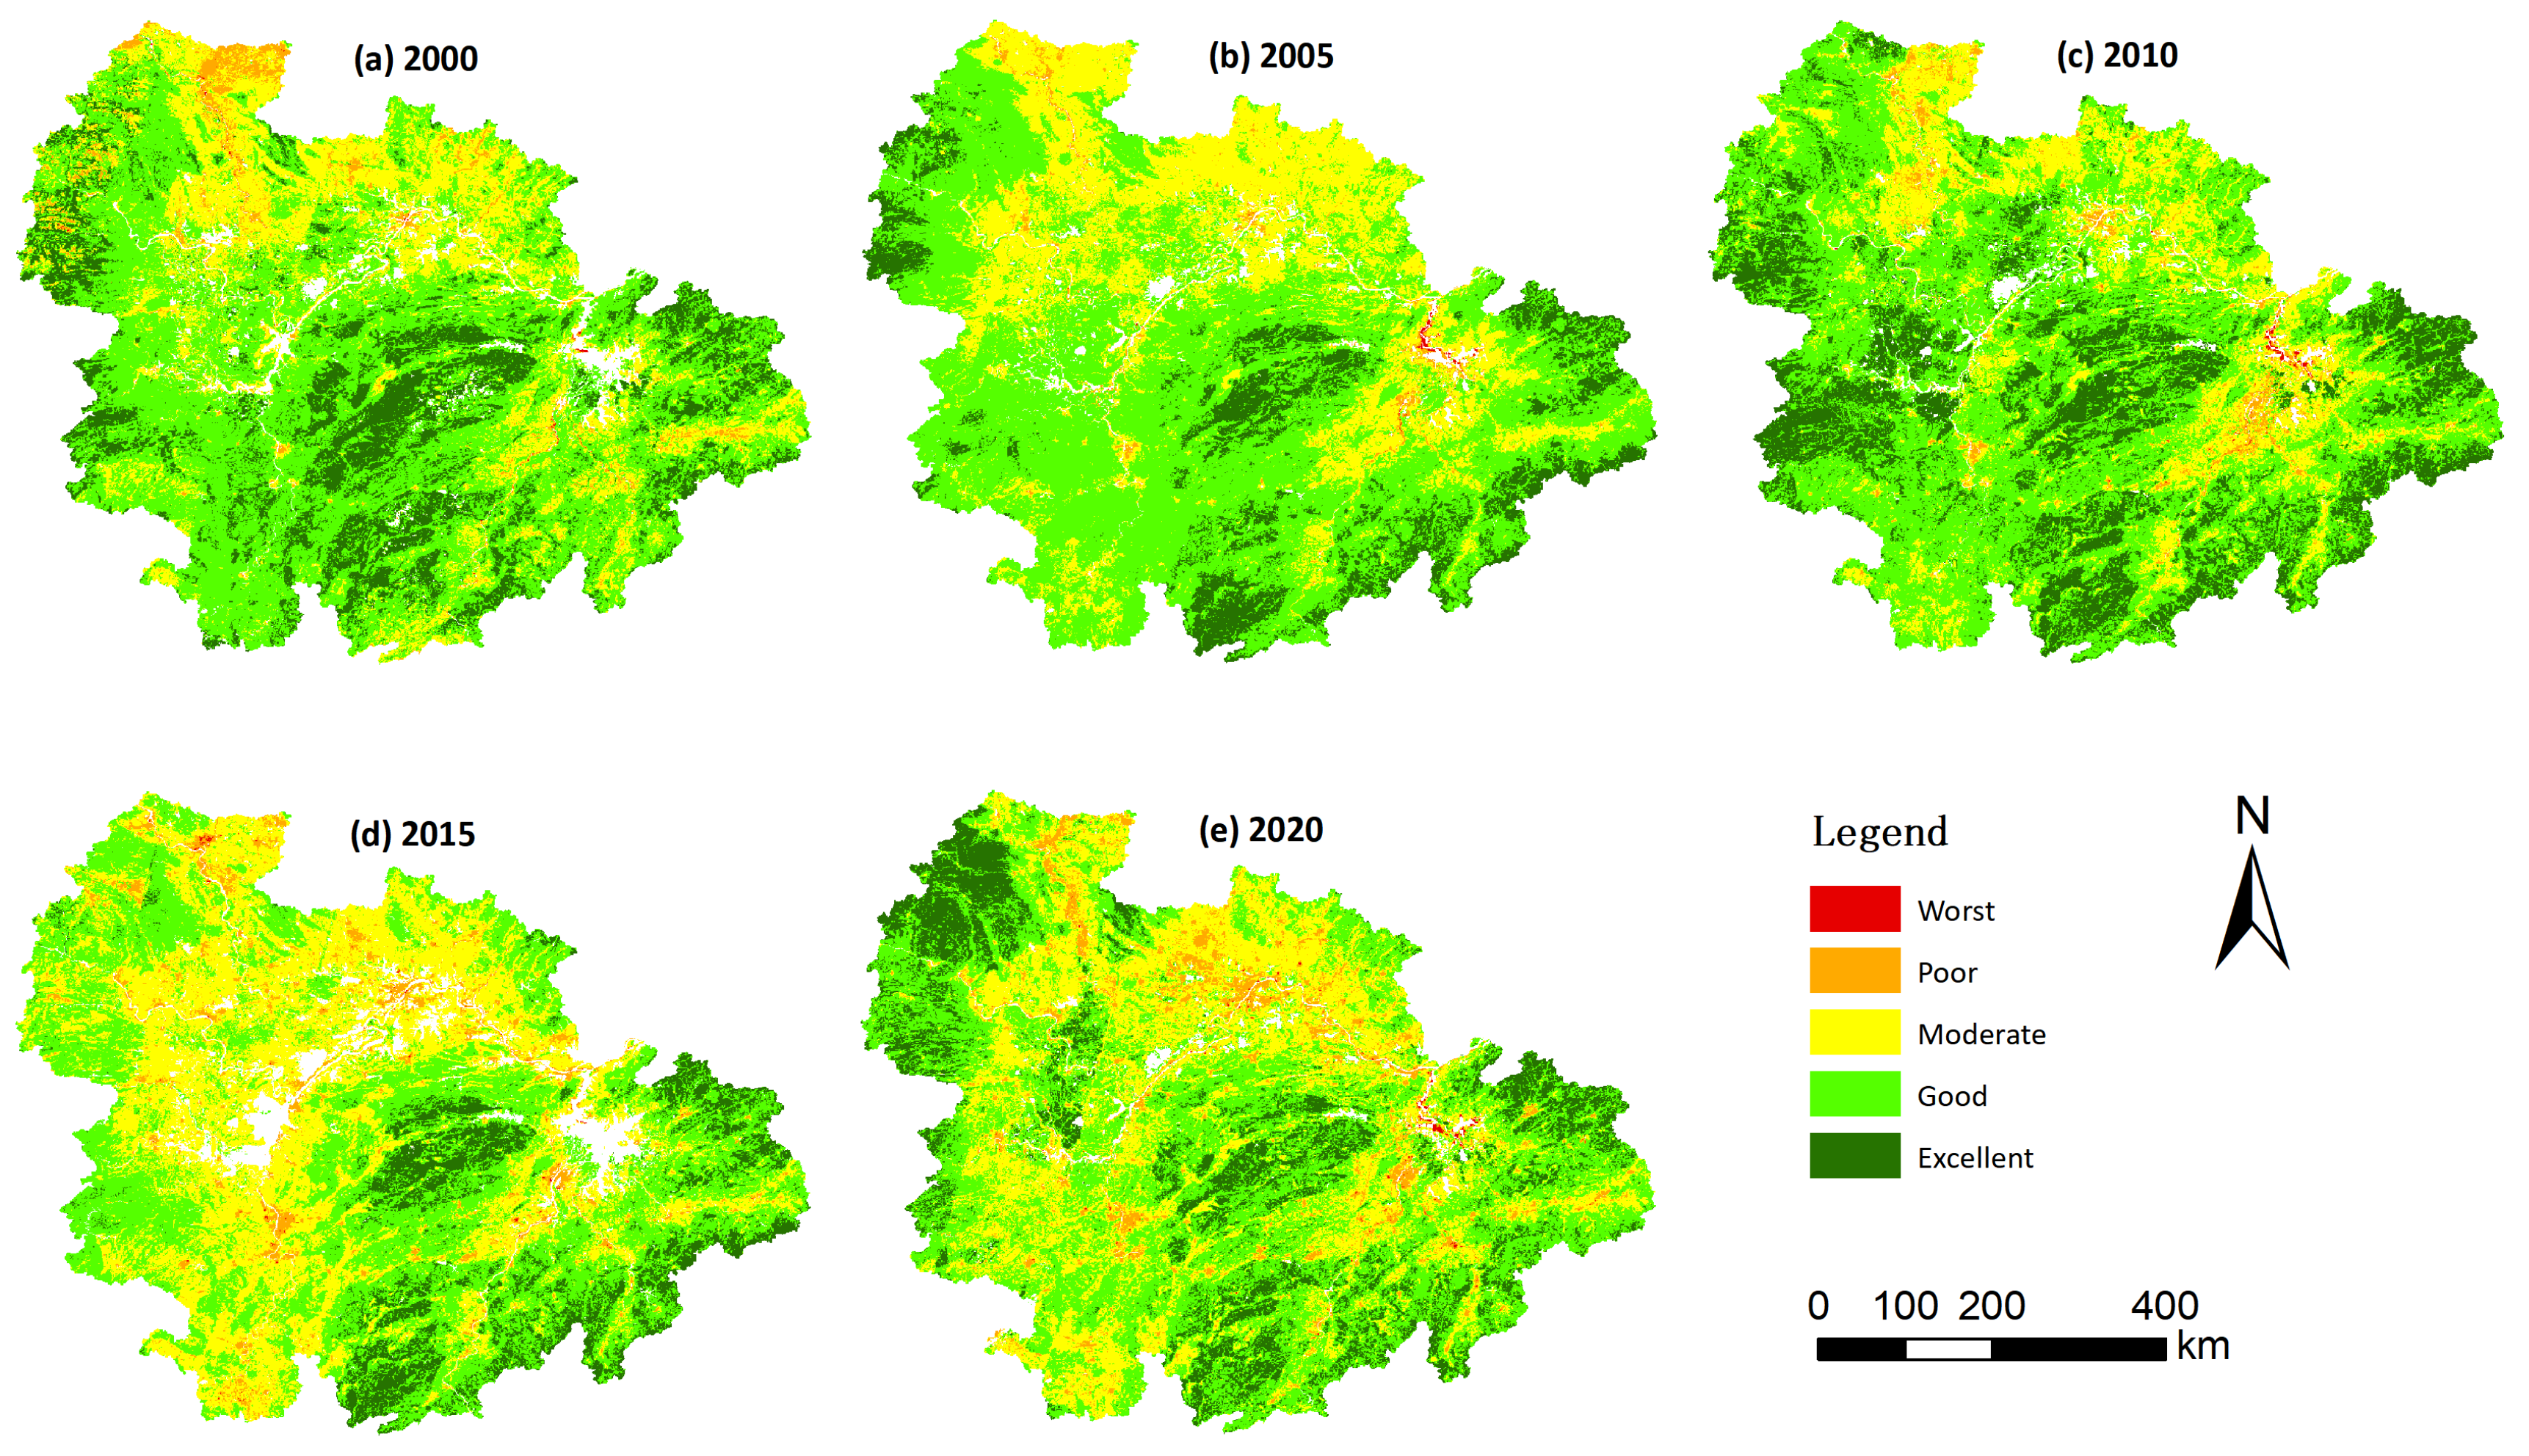
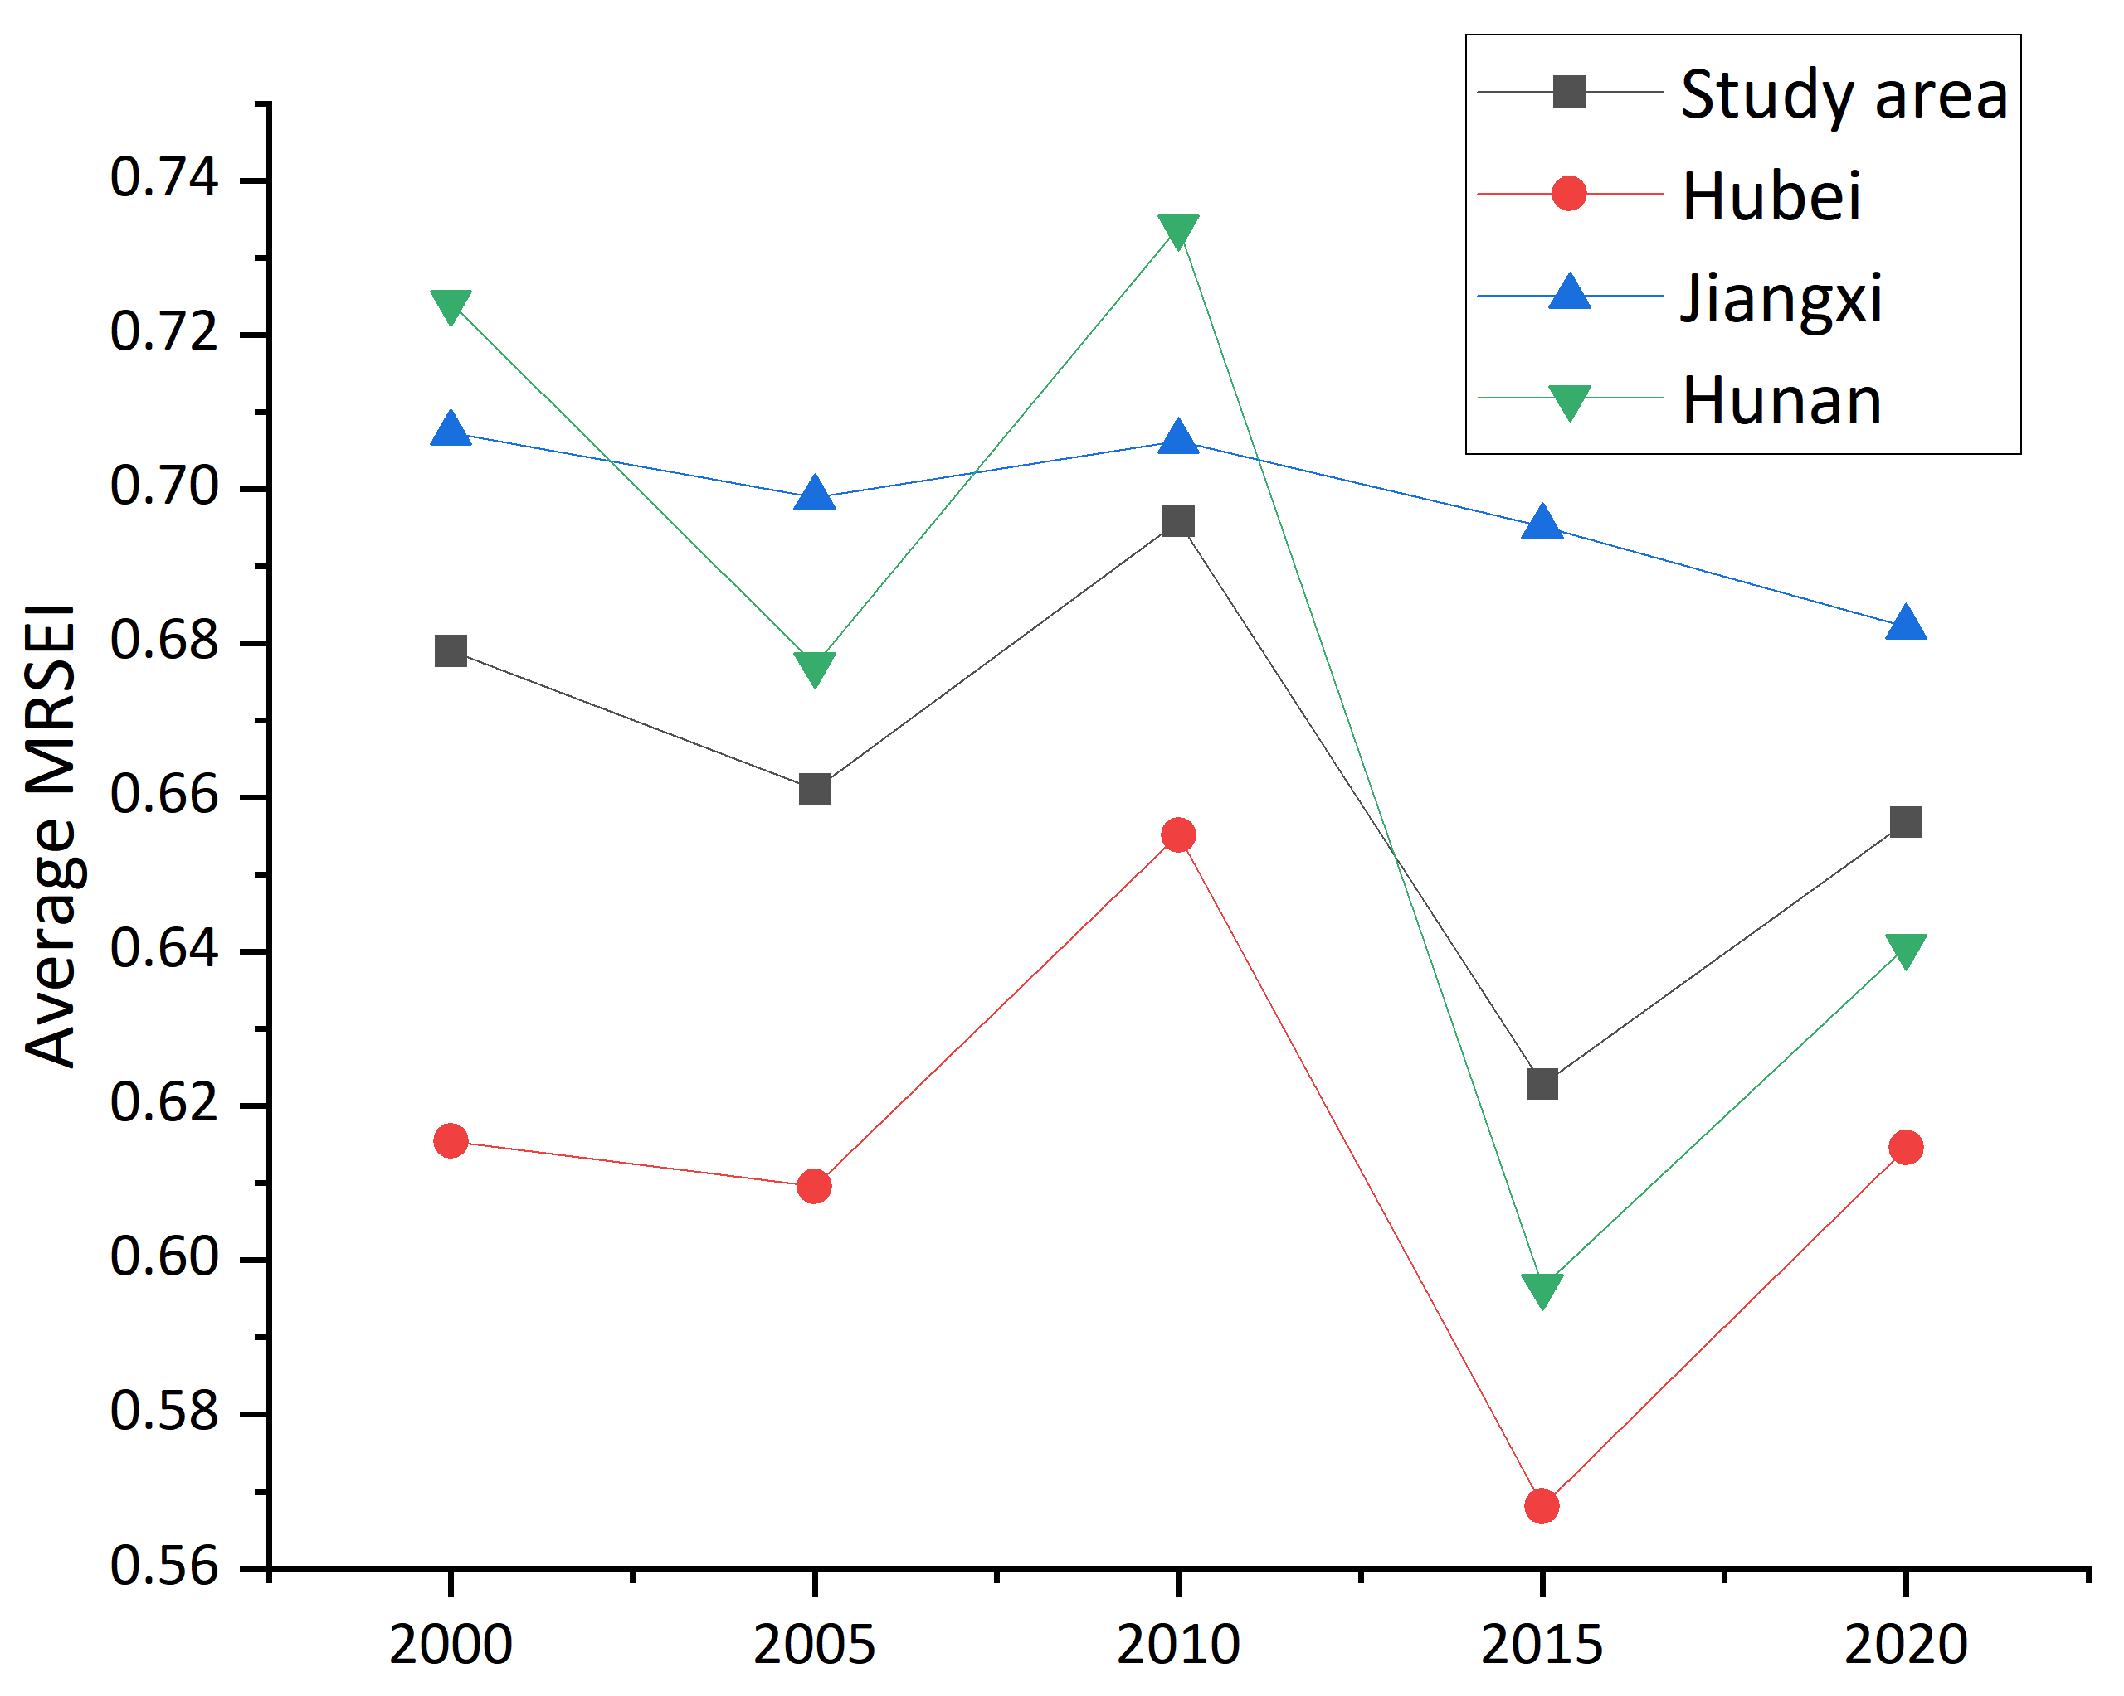
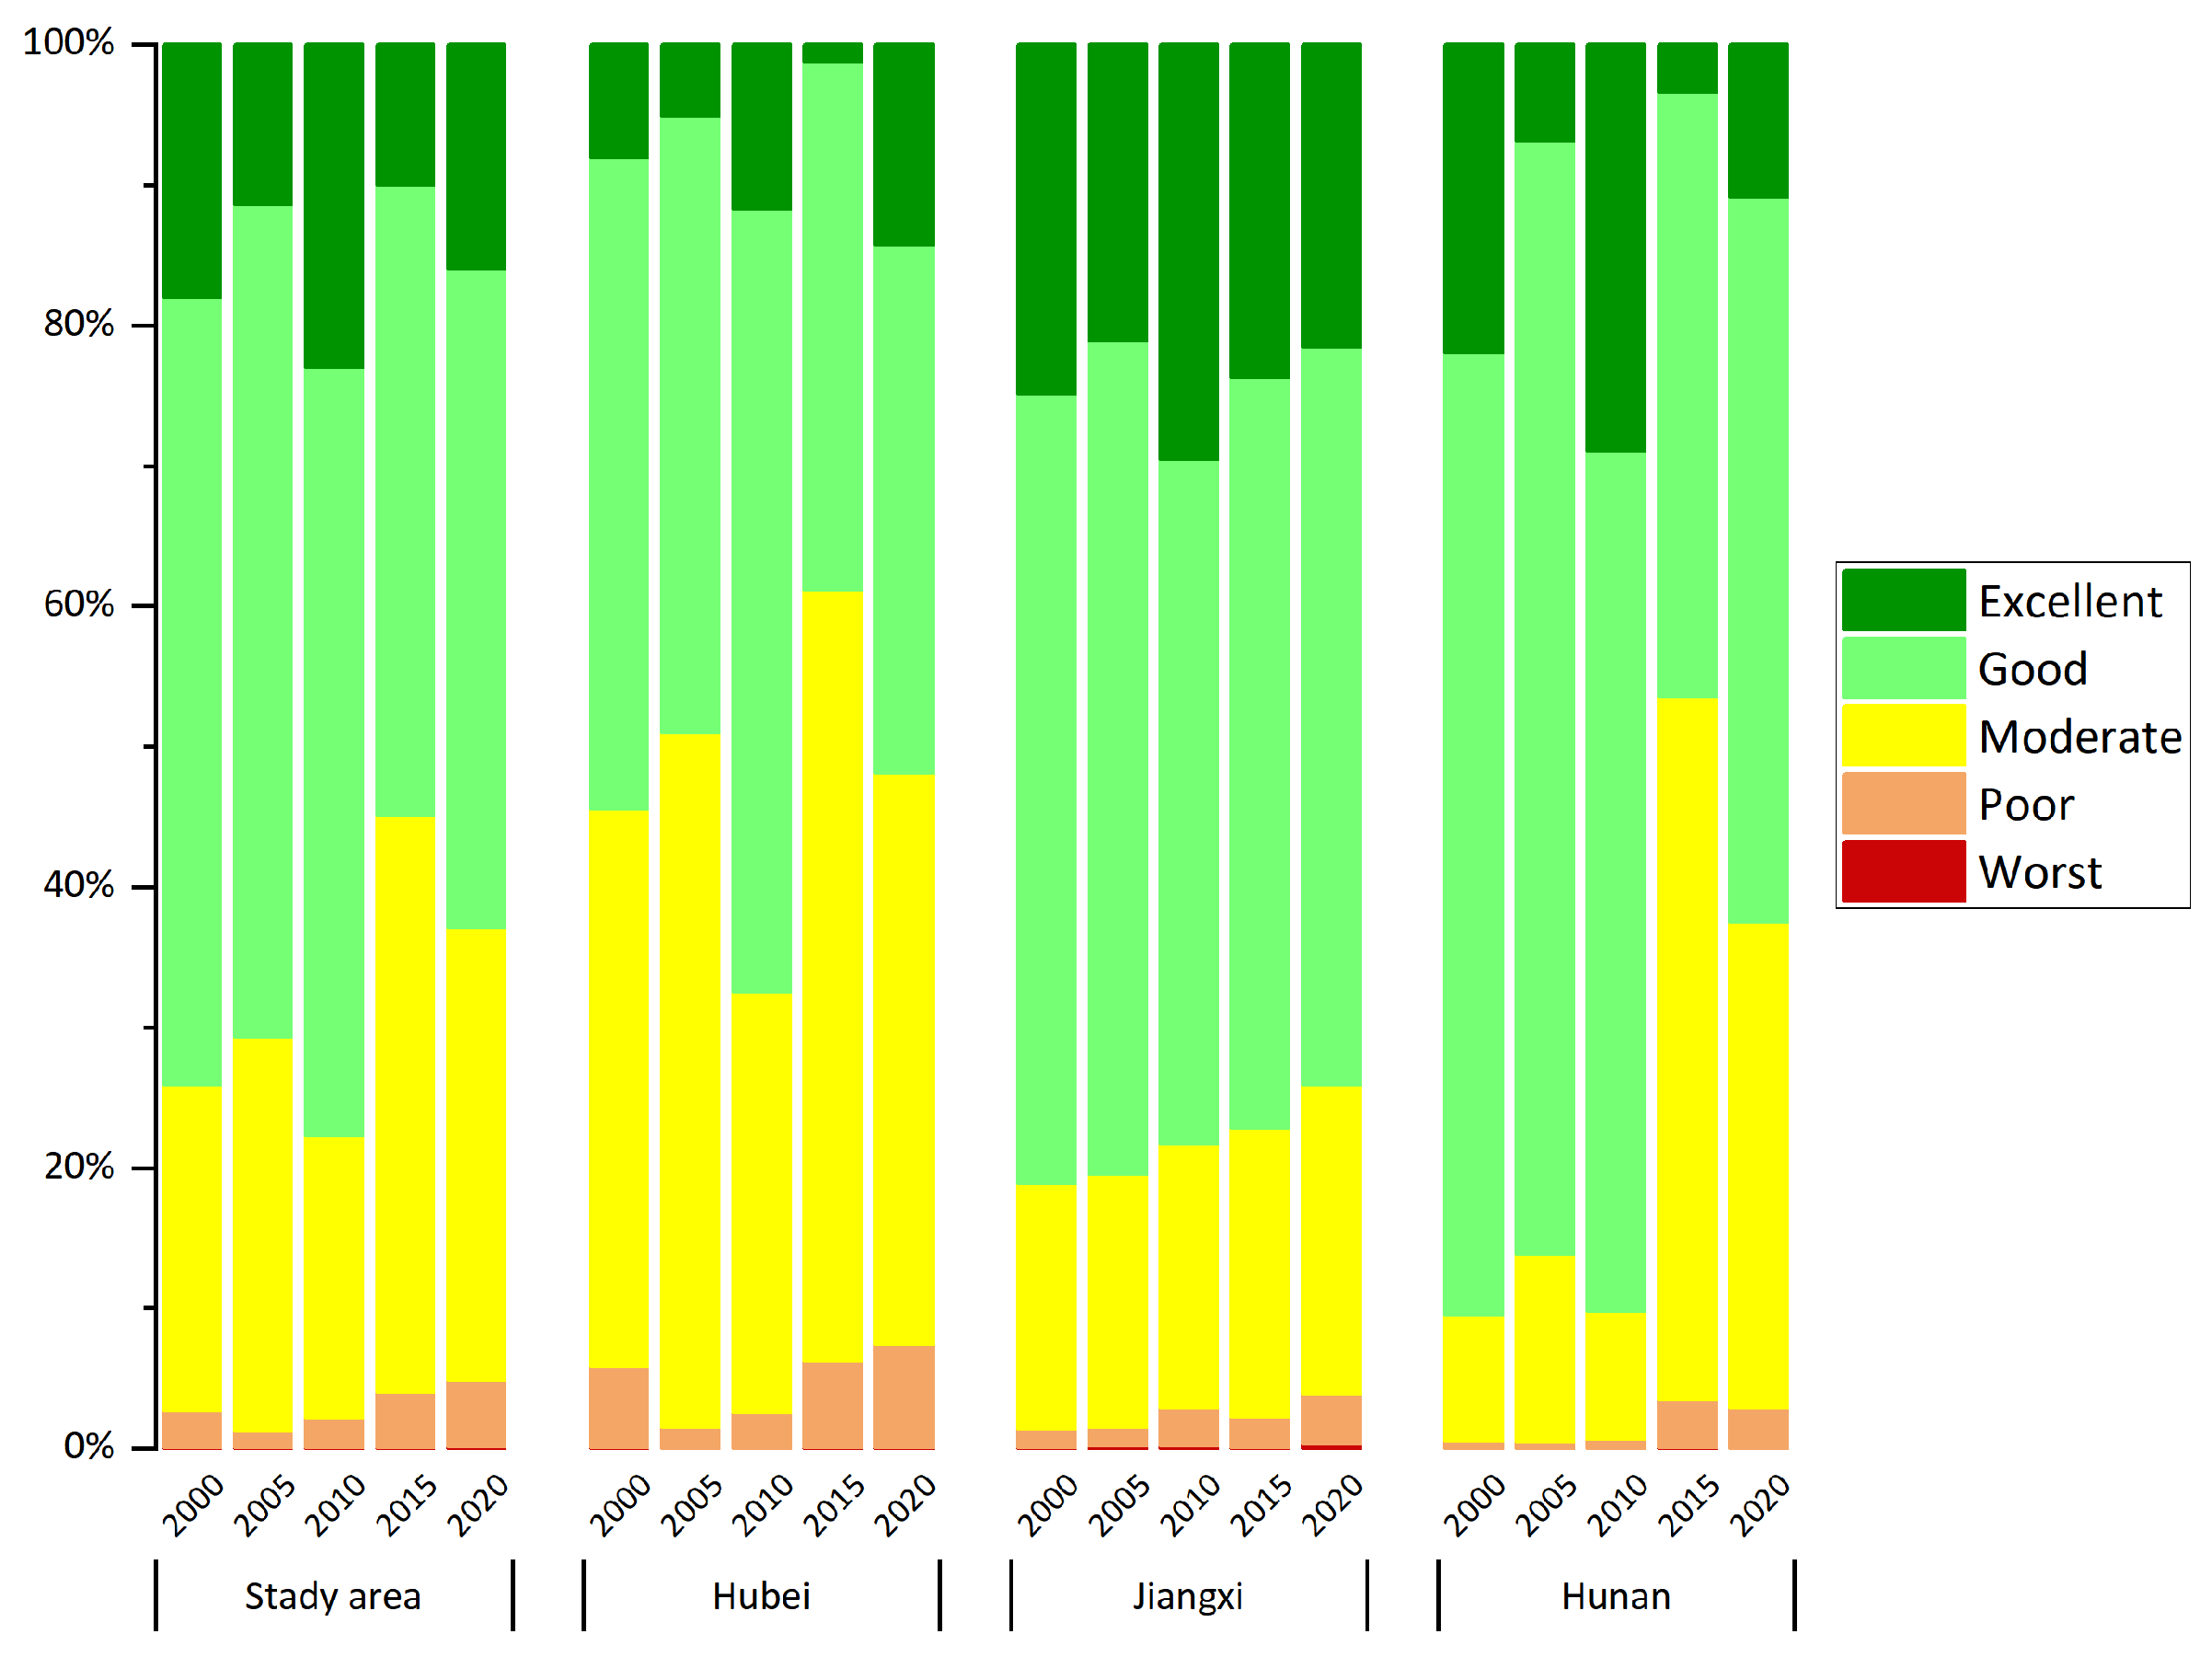
4.2. Spatiotemporal Patterns of Eco-Environmental Quality

Figure 2 shows the spatial distribution patterns of MRSEI levels from 2000 to 2020 in detail. In general, the eco-environmental quality in the majority of the study area was moderate and higher. More specifically, regions with excellent quality were mainly concentrated in the Jiangxi Province; a few were also found in the Hunan and western Hubei provinces. Regions with moderate quality mainly occupied the northern part of the Hubei Province and a few were detected in the Hunan and central Jiangxi provinces. Regions with good quality were extensively and evenly distributed in other regions. Note that only a very small number of regions showed poor or the worst eco-environmental quality. They were mainly concentrated in urban areas, especially capital cities of the three provinces and some large cities. In terms of changes, the level of eco-environmental quality alternated between improvement and degradation, rather than persistently showing improvement or degradation. Furthermore, in the vast majority of regions, the eco-environmental quality transitioned to adjacent quality levels and rarely showed cross-level changes. Note also that the total area of regions with poor and the worst eco-environmental quality has increased. However, this increased area was mainly concentrated in urban peripheries and was caused by urban expansion, whereas the total area occupied by these two quality levels outside urban areas has decreased.
The data shown in Figure 3 reflect the changes in the average MRSEI values in the overall study area and individual provinces from 2000 to 2020. The average MRSEI of the YRMRM fluctuated within a range of 0.62–0.70 and was characterized by alternating decreases and increases. This suggests that the eco-environmental quality of this region was generally good. In particular, the average MRSEI of this region peaked in 2010 and troughed in 2015, resulting in the most significant change between 2010 and 2015, with a decrease of 10.5%. Changes in the other years were relatively small, ranging between 2% and 4%.
At the provincial level, differences were observed in the eco-environmental status of all three provinces. The average MRSEI of the Jiangxi Province was relatively high and stable (~0.69), indicating a good eco-environmental quality. However, the average MRSEI of this province also slightly decreased. The average MRSEI of the Hubei Province was consistently low, ranging between 0.57 and 0.66. Except for 2015, during which the average MRSEI was < 0.6, indicating a moderate eco-environmental quality, the values of other years were > 0.6, indicating a good eco-environmental quality. The MRSEI changes were characterized by alternating decreases and increases. The largest change, that is, a decrease of 13.3%, was observed between 2010 and 2015. The average MRSEI of the Hunan Province showed relatively large fluctuations within the range of 0.6–0.73, generally exhibiting a good eco-environmental quality. Its trend was similar to that of the Hubei Province, also showing the largest magnitude of change between 2010 and 2015, with a decrease of 18.7%. However, in contrast to the Hubei Province, the average MRSEI of the Hunan Province consistently remained above 0.6. This can mainly be attributed to the high average MRSEI in 2010, similar to the situation in the Jiangxi Province.
The percentage of areas with different eco-environmental quality levels was calculated (Figure 4). The results indicate that the percentage of areas with moderate or above eco-environmental quality was > 95%. Regions with good eco-environmental quality accounted for the highest percentage, fluctuating within the range of 44.9–59.3%. From 2000 to 2010, this percentage was relatively stable, ranging between 54.7% and 59.3%. However, from 2010 to 2015, the magnitude of change was the most significant, with a significant decrease from 54.7% to 44.9%. From 2015 to 2020, this percentage stabilized within the range of 44.9–46.9%. The percentage of areas with moderate eco-environmental quality fluctuated between 20.1% and 41.1%. From 2000 to 2010, the magnitude of change was relatively small, with the percentage ranging between 20.1% and 28.1%. However, from 2010 to 2015, this percentage significantly increased from 20.12% to 41.01%, representing an increase of more than 100%. Although this percentage somewhat decreased in 2020, it stabilized at 32.3%. The percentage of areas with excellent quality fluctuated within the range of 10.0–23.0%, with the minimum and maximum values occurring in 2010 and 2015, respectively. The percentage of areas with poor and the worst eco-environmental quality did not exceed 5%, the majority of which was poor quality. From 2005 onwards, the percentage of areas with poor quality showed a gradual upward trend, which peaked in 2020; the percentage of areas with the worst quality also peaked in 2020, but it was less than 0.2%.
Significant differences were observed among the three provinces. The percentage of areas with different eco-environmental quality levels showed a similar trend to the overall study area. However, the percentages of regions with moderate and poor quality were significantly larger, ranging from 29.9% to 54.9% and 1.5% to 7.3%, respectively. In contrast, the percentages of areas with good and excellent quality were slightly lower than that of the overall study area, ranging from 37.6% to 55.8% and 1.2% to 14.3%, respectively. Jiangxi Province showed a relatively stable trend with respect to areas with different eco-environmental quality levels, with relatively small annual changes. Regions with good quality accounted for the highest percentage, ranging from 48.7% to 59.3%. Regions with moderate and excellent quality accounted for similar percentages, with ranges of 17.5–22.0% and 21.5–29.6%, respectively. Furthermore, regions with excellent quality mostly accounted for a higher percentage than those with moderate quality. Regions with poor quality and below remained within the range of 1.4–3.9%. The percentage of areas with different eco-environmental quality levels in the Hunan Province was similar to that of the Jiangxi Province from 2000 to 2010, but it became more similar to that of the Hubei Province from 2015 to 2020, exhibiting significant differences.

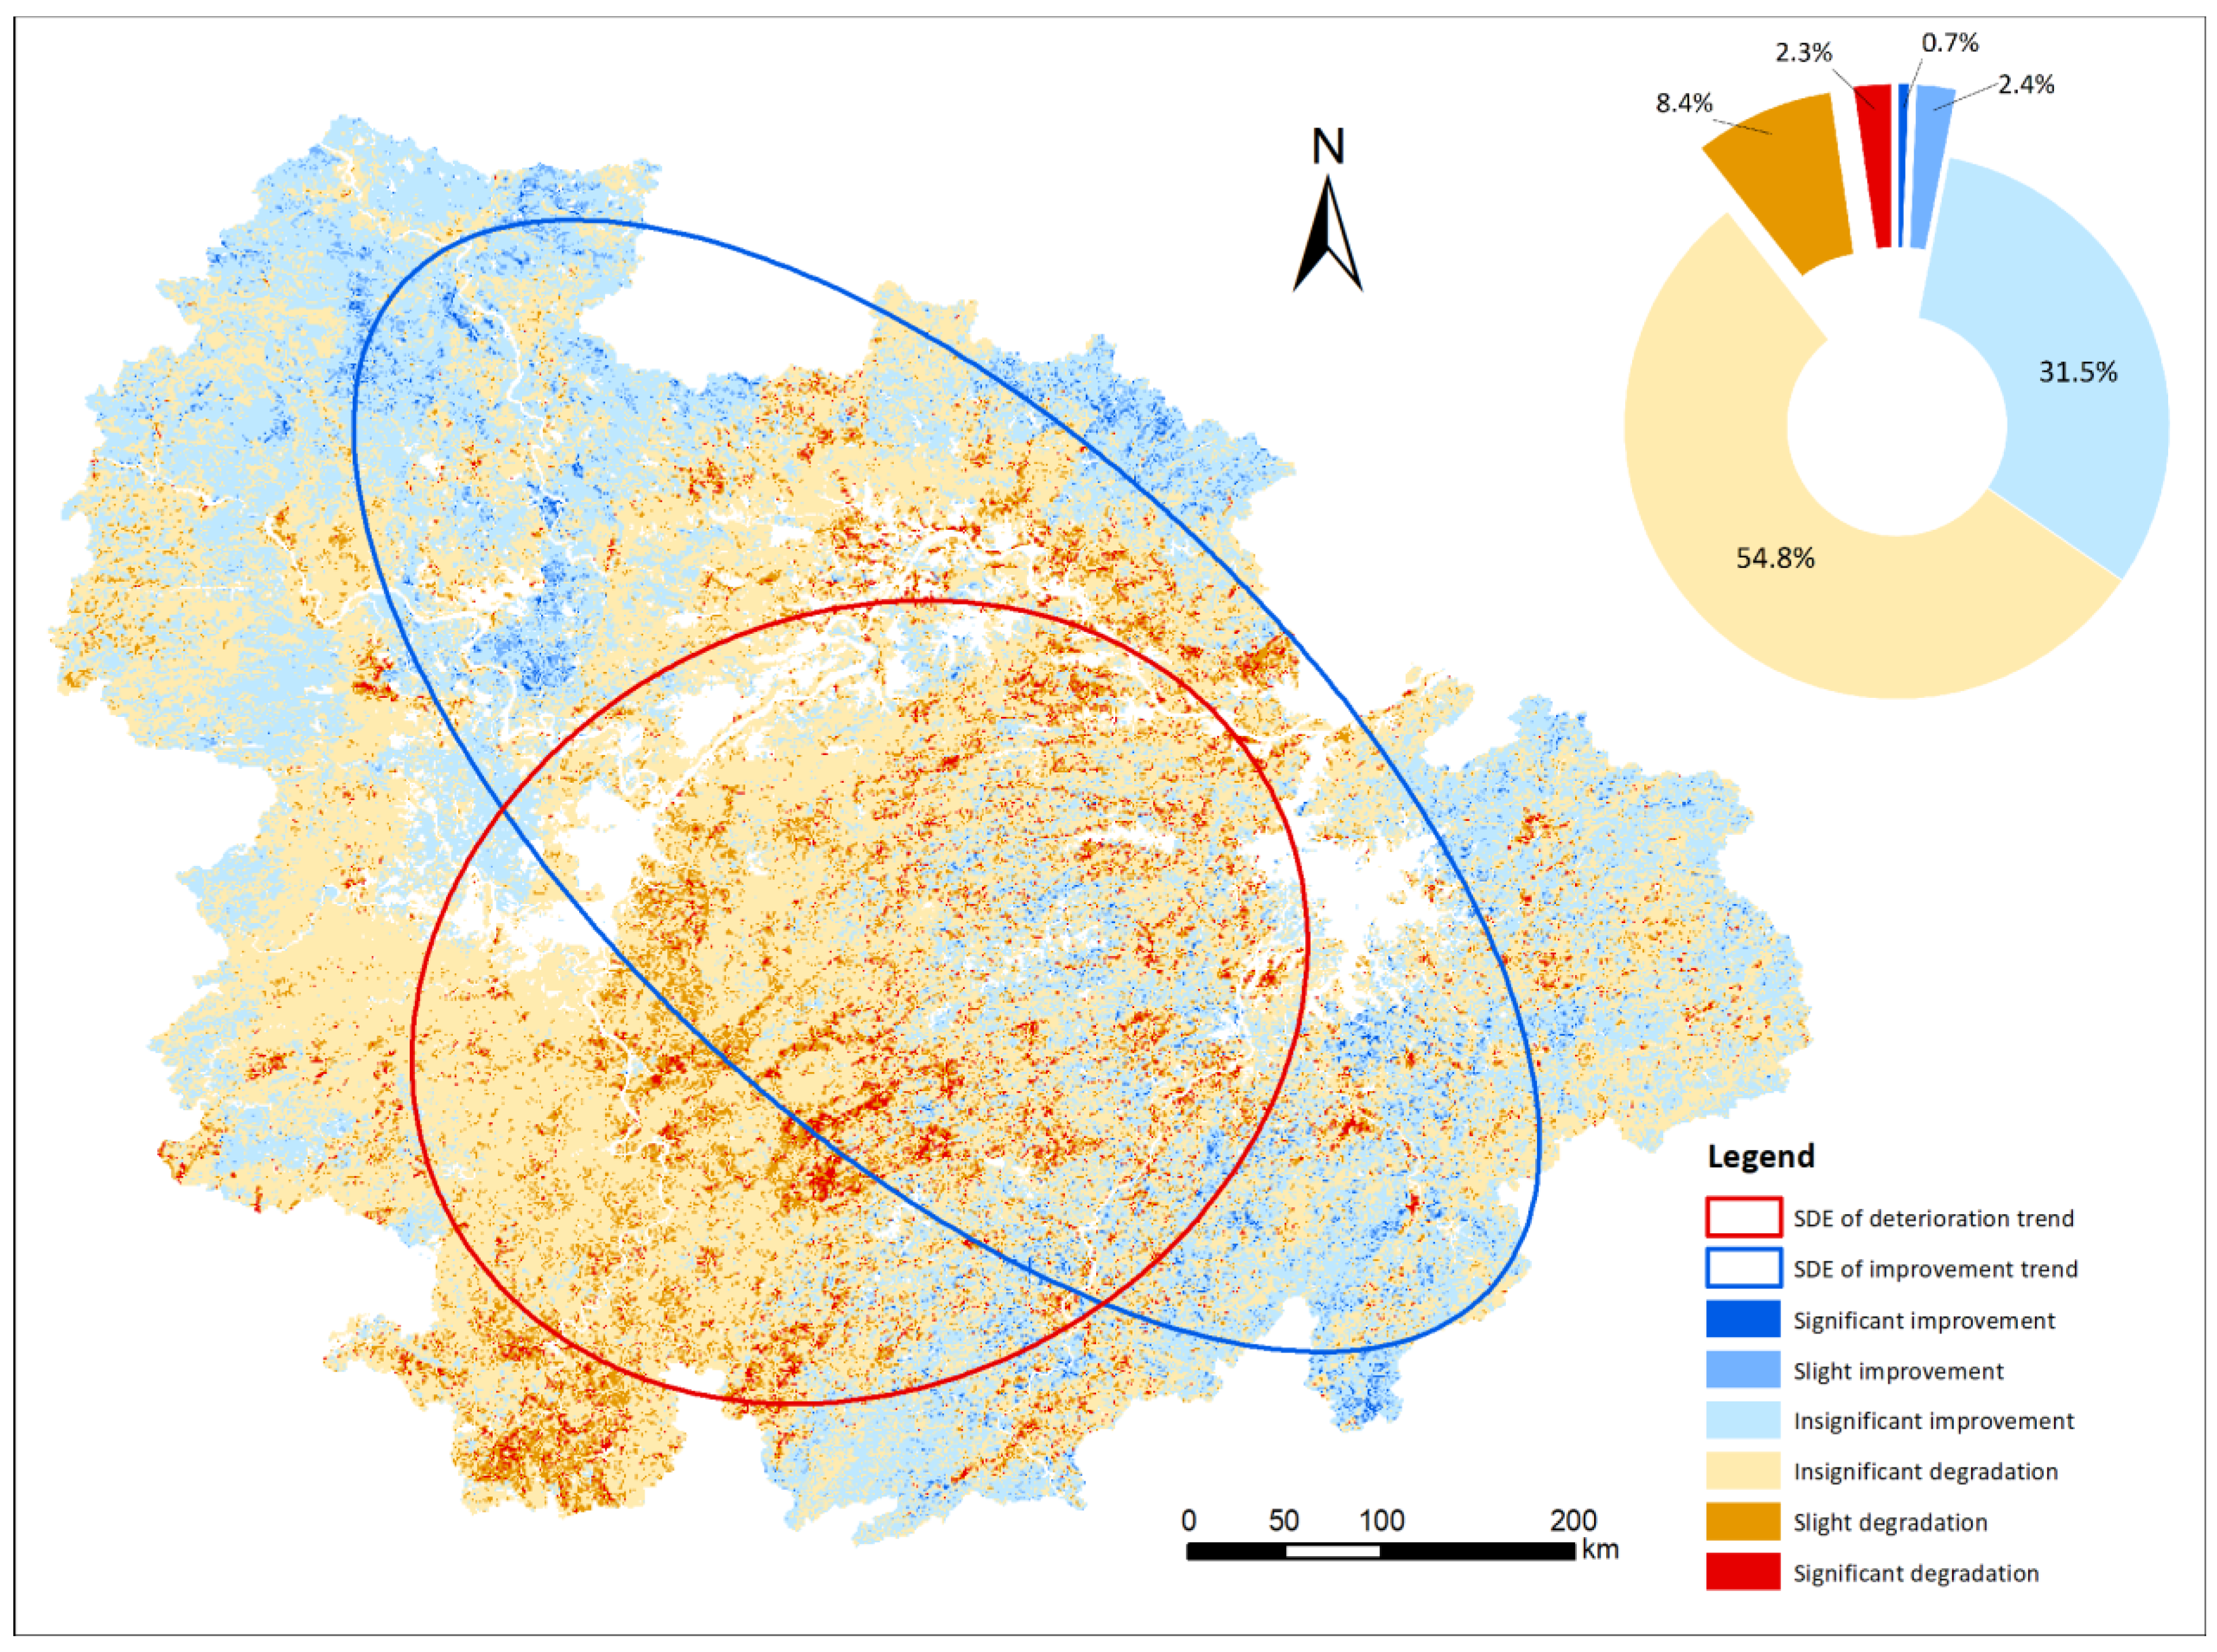
4.3. Trend and Sustainability Analysis

The Theil–Sen and Mann–Kendall methods were employed to analyze the trends in changes in the eco-environmental quality in the study area over the past 20 years. The results are shown in Figure 5. In terms of the total area, regions showing insignificant changes in eco-environmental quality accounted for the highest percentage. These regions can be divided into two categories, that is, insignificant degradation and insignificant improvement, which occupied 54.8% and 31.5% of the area, respectively, and accounted for a total percentage of 86.3%. Because the trends in changes in these regions did not reach the significance level, we can infer that the eco-environmental quality of most regions in the study area essentially remained stable. In addition, we observed that a small number of regions showed a trend of improvement in the eco-environmental quality. The percentage of areas showing a significant and slight improvement was 0.7% and 2.4%, respectively, leading to a total of 3.1%. This implies that only an extremely small number of regions in the study area showed improvement (mainly small) in the eco-environmental quality. In addition, other regions exhibited a trend of degradation in the eco-environmental quality. The percentage of areas showing significant and slight degradation was 2.3% and 8.4%, respectively, representing a total of 10.7%. This implies that a small number of regions within the study area showed a trend of mild degradation.
The standard deviational ellipse method was employed to analyze the spatial distribution of the trends (Figure 5). The centroid, major axis, and minor axis represent the central position, distribution direction, and range of the data, respectively. In terms of degradation trends, the centroid of the standard deviational ellipse was located in the Hunan Province, close to the intersection of the three provinces. The direction of the major axis was southwest to northeast, whereas the range of the minor axis mainly covered the Hunan Province. The results of this analysis indicate that degradation trends were observed in all provinces in the central part of the study area, mainly in the southeastern Hubei Province, central and eastern Hunan Province, and northwestern Jiangxi Province. The most severe degradation was observed in the Hunan Province. With respect to the spatial distribution of improvement trends, the centroid of the standard deviational ellipse was located at the intersection between the Hubei and Jiangxi provinces. The direction of the major axis was northwest to southeast, whereas the range of the minor axis mainly covered the Hubei and Jiangxi provinces. These data suggest that the area of improvement mainly covered the northwestern and southeastern parts of the study area, predominantly the Hubei and Jiangxi provinces, whereas the distribution in the Hunan Province was almost negligible.
The Hurst exponent of the study area ranged between 0.06 and 0.99, with an average of 0.65. Regions with a Hurst exponent < 0.50 accounted for 18.6% of the total area, whereas those with a value of >0.50 accounted for 81.4%. This distribution indicates that the study area had a relatively strong persistence. More specifically (Table 3), 2.4%, 16.2%, 51.8%, and 29.6% of the area exhibited a strong anti-persistence, weak anti-persistence, weak persistence, and strong persistence, respectively. To assess the sustainability of the ecological changes, overlay analysis was performed between the trend analysis results of eco-environmental changes and Hurst exponent. The results show that 91.6% and 89.5% of the improvement and degradation trends are sustainable, respectively. These findings strongly suggest that future trends will essentially remain consistent with those observed from 2000 to 2020, showing strong continuity and stability.

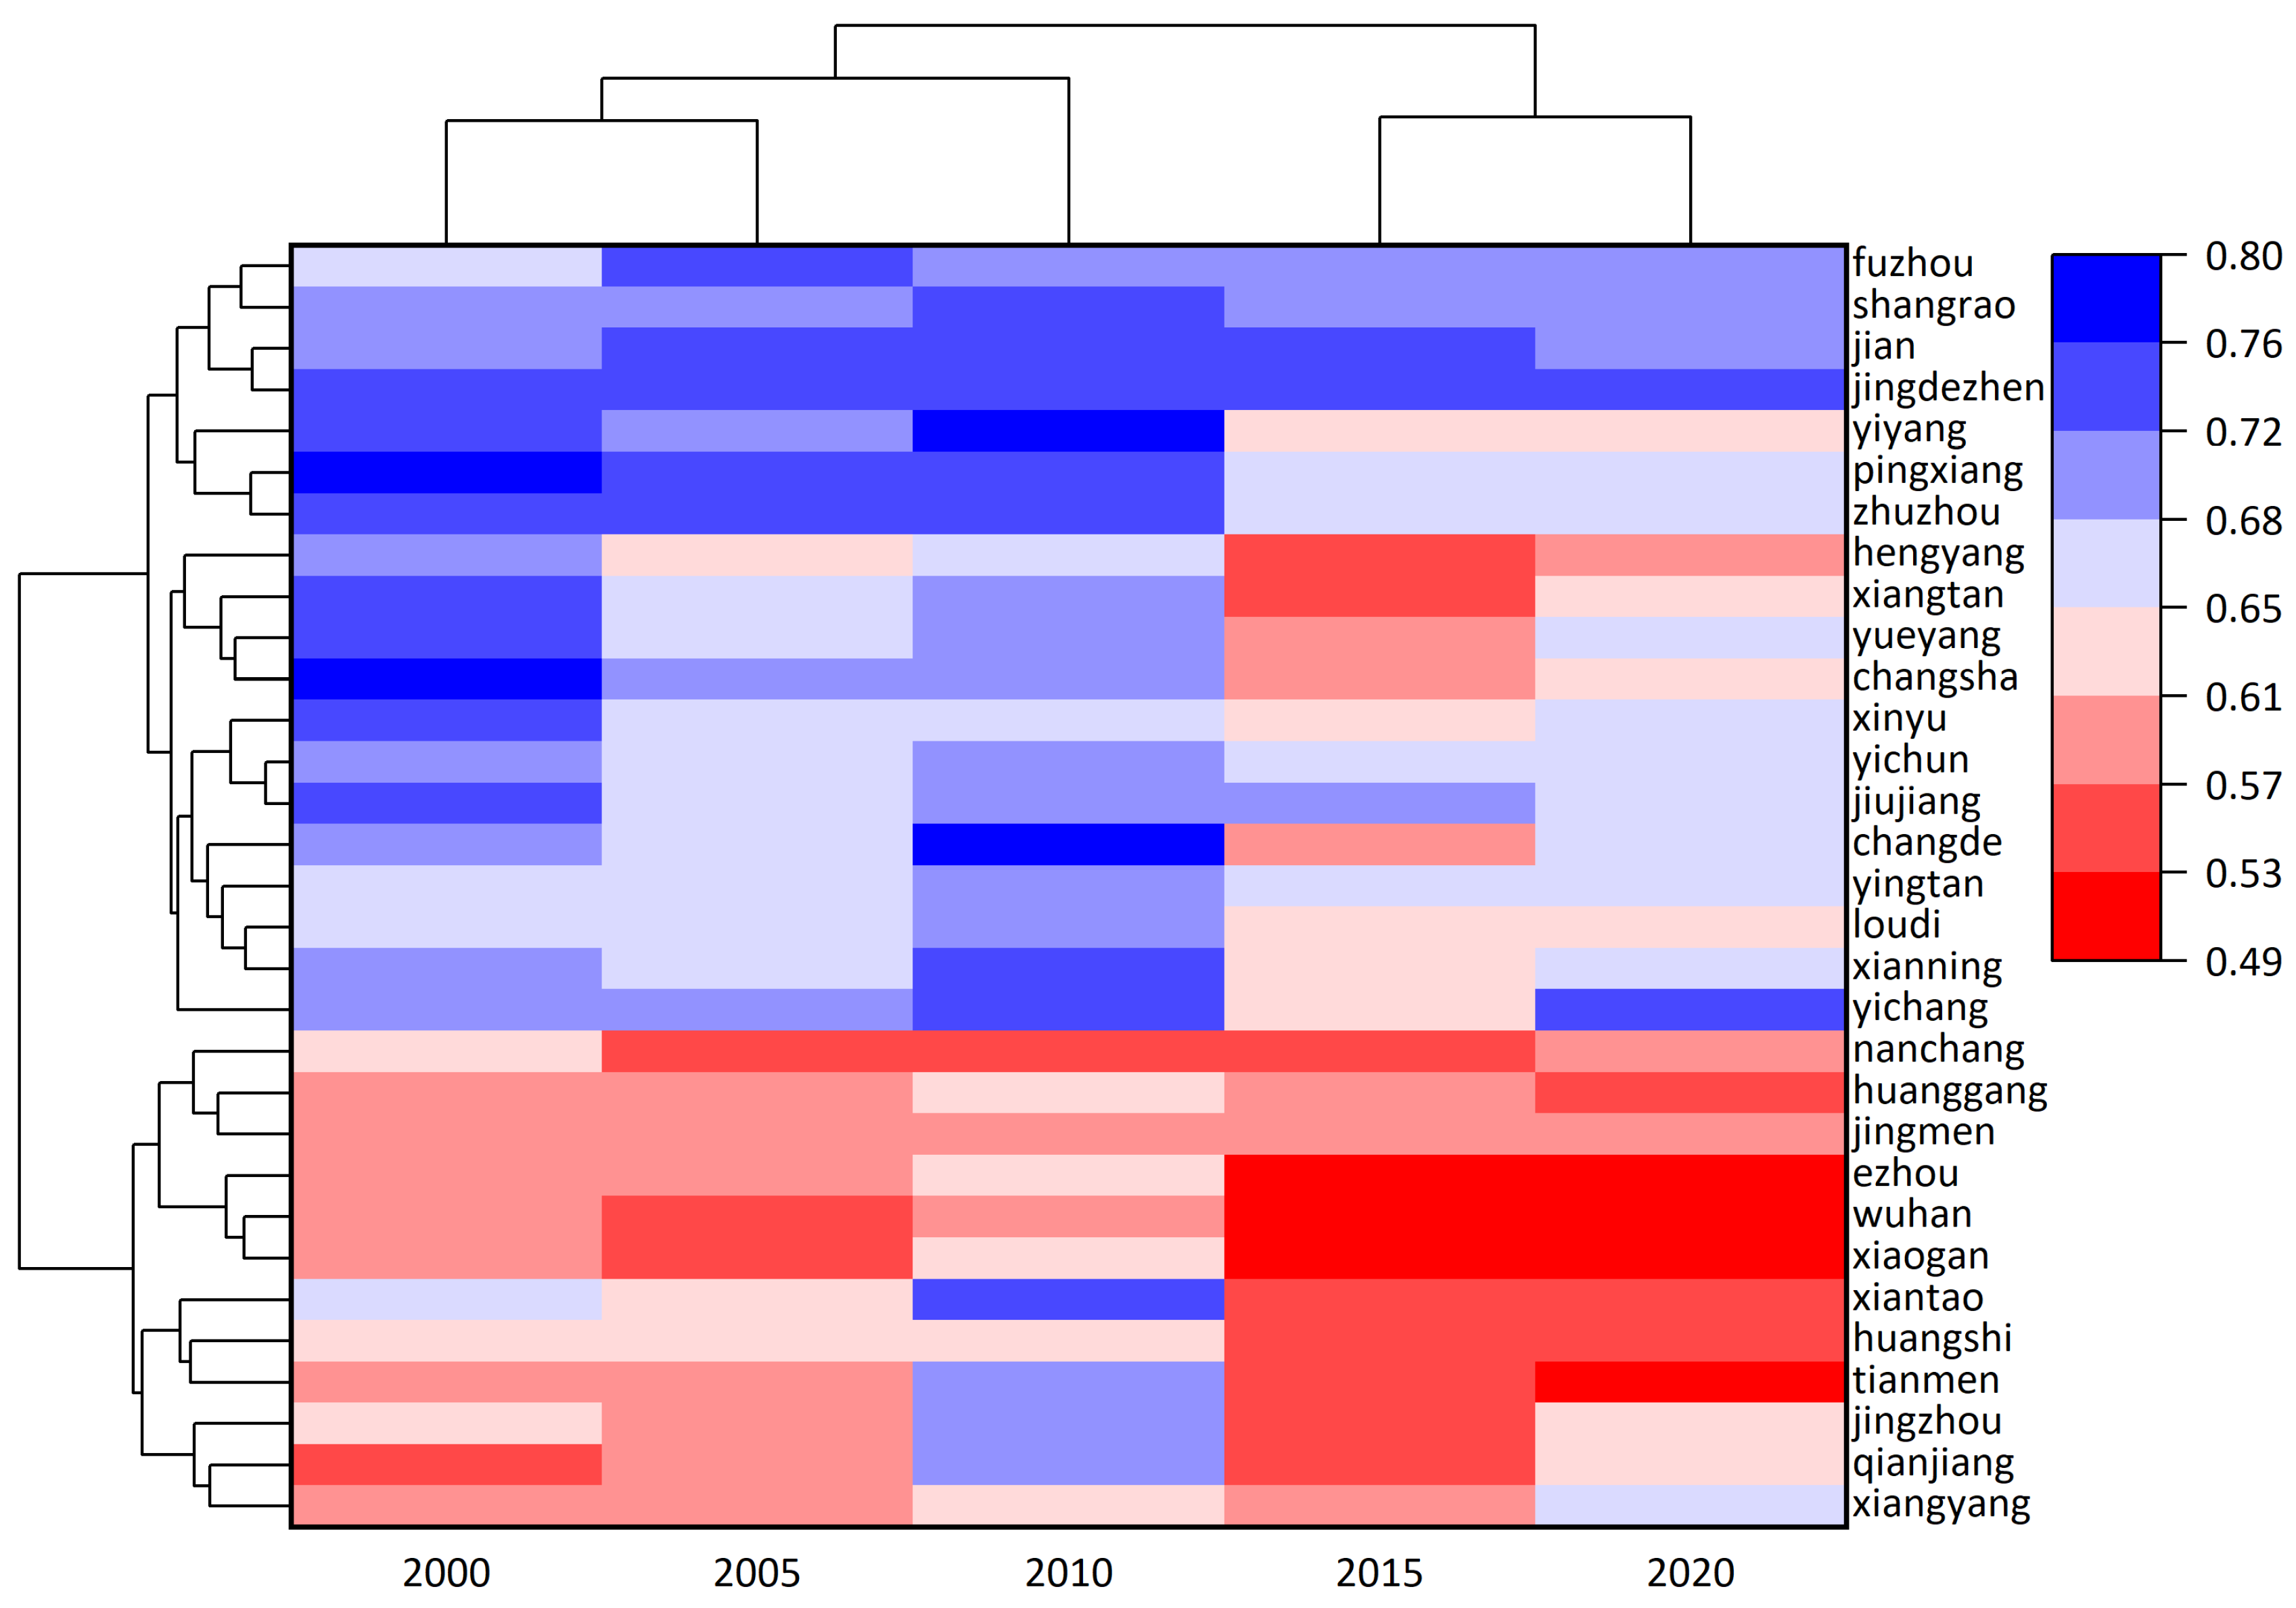
4.4. Comprehensive Eco-Environmental Assessment

The average MRSEI of each city was calculated for each year and cluster analysis was performed. The results are shown in Figure 6. The 31 cities in the YRMRM can be divided into four main classes according to the level of eco-environmental quality. Class I cities consistently showed a moderate level of eco-environmental quality. Class II cities displayed a moderate eco-environmental quality for most of the time but also exhibited a good quality in some periods. Class III cities mainly showed a good eco-environmental quality but occasionally displayed or approached moderate levels. Class IV cities consistently exhibited a good eco-environmental quality. Overall, Classes I and II fell within the scope of moderate eco-environmental quality, whereas Classes III and IV fell within the scope of good eco-environmental quality. In addition, with respect to the temporal scale, we observed two distinct stages: from 2000 to 2010, the eco-environmental quality was generally good, whereas it was relatively poor from 2015 to 2020.
Based on the spatial distribution above (Figure 7), Class I and II cities were mainly concentrated in the Hubei Province in the northern part of the study area, Class II cities were mainly concentrated in the Hunan Province in the western part of the study area, and Class IV cities were mainly concentrated in the Jiangxi Province in the eastern part of the study area. Thus, the eco-environmental quality of the study area was characterized by high levels in the south and east and low levels in the north and west, with overall levels ranging between moderate and good. With regard to the process of change, degradation and improvement alternated in all cities, but the magnitudes of change varied. Cities with better eco-environments showed smaller magnitudes of change, whereas cities with poorer eco-environments showed larger magnitudes of change. The largest changes (most significant decline) occurred from 2010 to 2015. In terms of the sustainability of these trends, the vast majority of cities showed a stable trend. Regions with persistent improvement were mostly distributed in Class I and IV cities, whereas regions with persistent degradation were mostly distributed in Class II and III cities. These results indicate that cities with the best and worst eco-environments showed partial improvement, whereas cities with moderate levels of eco-environmental quality exhibited partial degradation.

5. Discussion

5.1. MRSEI Compared to Traditional RSEI

In order to verify the reasonableness of the model improvement, the results of this study were compared with studies using the traditional RSEI. Li et al. showed that the ecological environment of the urban agglomeration in the middle reaches of the Yangtze River experienced a process of decline followed by recovery from 2013 to 2021, with the most significant decline in 2015; the RSEI values of the cities in Hubei Province were usually lower than those of the other two provinces, and the differences in the RSEI values between cities in Hunan Province were the smallest, while the RSEI values of the cities in Jiangxi Province were the highest [33]. Yang et al. showed that RSEI values in the Yangtze River Basin underwent a decline in 2005 and 2015, reaching their lowest level in 2015 [34]. Zhou et al. compared changes in the ecological environment of the Yangtze River Economic Belt in 2001 and 2020, and found that the ecological quality of the Jianghan Plain in Hubei Province and the Dongting Lake Plain in Hunan Province declined significantly [35]. Yi et al.’s study of the Jianghan Plain showed a fluctuating downward trend in RSEI from 2000 to 2020 [36], and Yuan et al.’s study of the Dongting Lake Basin showed that the RSEI fluctuated during 2001–2019, and that the eco-environmental quality may have deteriorated after 2014 [12]. The results of the modified RSEI are in strong agreement with the temporal and spatial trends of these studies based on the traditional RSEI.
However, the value of the MRSEI is slightly lower compared to the RSEI value of the above studies, which is due to the introduction of pollution degree as a negative indicator. As a matter of fact, the pollution factor has been used as an important indicator in both statistical data-based ecological studies [37] and the current Chinese Technical Criterion For Ecosystem Evaluation (HJ 192-2015). A study of air pollution in the Yangtze River Basin by He et al. showed that after 2000, the various concentrations of air pollutants had a significant increase [38]. Therefore, the MRSEI considering the pollution factor can better evaluate the ecological environment status of urban agglomeration areas.

5.2. Factors Influencing Eco-Environmental Quality Changes

Based on the contribution rate of each indicator to PC1 (Table 2), wetness (WET) and greenness (NDVI) indicators had a positive impact on RSEI, whereas the dryness (NDBSI) and heat (LST) indicators had a negative impact, which is similar to the results of previous studies [39]. The addition of the pollution indicator (AOD) also had a negative impact, which suggests that pollution caused by human activities in urban agglomerations cannot be overlooked. The weights of various indicators in different years constantly changed. This was because the degree of influence on the overall eco-environment changed accordingly when the eco-environment factors represented by each indicator changed. In the ecological quality evaluation of the Tibet region, surface temperature had a positive impact on the ecological environment. That is, a higher surface temperature indicated a better eco-environment. This was due to the cold climate in Tibet, where a relatively higher temperature was more suitable for vegetation growth [40]. Therefore, the weights of the indicators can reflect, to some extent, the degree of impact of the indicators on the eco-environment.
Among all indicators, the greenness and dryness indicators had more significant effects compared with others. These two indicators are directly associated with land use and land cover types, which implies that land use and land cover types are the most important determinants of eco-environmental quality. A better vegetation cover can significantly enhance eco-environmental quality, whereas bare and built-up land significantly and negatively affect eco-environmental quality. In fact, changes in land use and land cover type have been widely examined in research related to the eco-environment [41,42,43,44]. Climate factors represented by wetness and heat generally have a positive impact on the eco-environment because favorable water and heat conditions in this region are conducive to plant growth and development over the long term. However, in the context of global climate change, the increased frequency of extreme weather, floods, droughts, and other natural disasters may threaten the region’s eco-environment in the short term [45,46]. The impact of the pollution indicator varied substantially, exerting significant effects in 2005 and 2015 and smaller ones in the other years. This suggests that pollution caused by human activities, especially due to urbanization, can significantly affect the eco-environment, whereas the population’s demand for a better eco-environment can also lead to a reduction in pollution emissions and environmental improvement. Hence, this process is a dynamic equilibrium undergoing constant adjustments. This view is supported by a study of industrial pollutant emissions in the Yangtze River Economic Belt. The authors described an initial increase, followed by a decrease in industrial emissions in 2003–2019, with industrial pollution spreading from large to small and medium cities [47].
Both human and natural factors can affect eco-environmental quality. These two factors have different effects in different regions. Human factors play a more dominant role in regions closer to urban areas [48]. The continued acceleration of urbanization in the middle reaches of the Yangtze River has led to the growing impact of human factors. Therefore, during urbanization, it is necessary to conduct urban construction planning in a scientific and rational manner to reduce pollution emissions as well as actively monitor natural disasters, such as climate change, floods, and droughts, to respond to any related environmental threats.

5.3. Strengths and Limitations

In the MRSEI, a pollution indicator was added to the four original indicators to compensate for the shortcomings of the original method. This index better agrees with the indicators specified in China’s current “Technical Criterion for Ecosystem Status Evaluation” and is also fully based on remote sensing data, retaining the advantages of the original method. In the past, eco-environmental studies based on the RSEI were mostly limited by remote sensing images themselves. On one hand, this approach required the downloading of a large number of images to a local computer and selecting images with high quality and low cloud cover from similar seasons. On the other hand, it also involved a large number of repetitive operations including image preprocessing, clipping, splicing, and computing each index. These tasks are not only time- and energy-consuming but also prone to human errors. In contrast, in the GEE platform, all necessary steps can be rapidly and accurately implemented through code, allowing researchers to focus on their research objectives rather than repetitive technical tasks.
This study has several limitations. Because of the research methodology, it was necessary to exclude waterbodies. Hence, the water environment was not assessed. Furthermore, AOD data were incorporated as a pollution indicator for our calculations. Although some researchers showed that AOD is highly correlated with air quality and can reflect the level of air pollution, air pollution is only one component of pollution factors. Therefore, improving the relevant indicators is still a research hotspot that awaits further investigation and verification.

6. Conclusions

Based on the use of the GEE platform and Landsat and MODIS data, we constructed a MRSEI model to conduct dynamic spatiotemporal monitoring and trend analysis on the eco-environmental quality of the YRMRM from 2000 to 2020 and examine the factors influencing eco-environmental changes. Our results show that: (1) The impact of pollution factors on urban agglomerations cannot be overlooked. A pollution indicator was introduced in the MRSEI model to better assess the eco-environmental quality of urban agglomeration areas. (2) The eco-environmental quality of the study area is characterized by high levels in the south and east and low levels in the north and west, with overall levels ranging between moderate and good. The eco-environmental quality can be divided into four classes, with Class I consistently maintaining a moderate level, Class II mostly showing moderate levels, but occasionally exhibiting good levels, Class III mostly showing good levels, but occasionally showing or approaching moderate levels, and Class IV consistently maintaining good levels. (3) Based on the trends in the eco-environmental quality, 86.3% of the study area remained stable, 3.1% showed improvement trends, mainly the northwestern and southeastern parts of the study area, and 10.7% showed degradation trends, mainly in the central parts of the study area. (4) The land use and land cover type is directly related to the eco-environment. Better natural vegetation cover implies a better eco-environmental quality. Climate factors indirectly affect the eco-environment. Human factors have a greater impact on the eco-environmental quality closer to cities and urban peripheries through changes in land use types as well as urban internal heat accumulation and air pollution.

Author Contributions

Conceptualization, X.Z. and Y.W.; methodology, X.Z.; software, S.W.; validation, X.Z. and S.W.; formal analysis, X.Z. and S.W.; resources, X.Z.; data curation, X.Z.; writing—original draft preparation, X.Z.; writing—review and editing, X.Z. and Y.W.; visualization, S.W. All authors have read and agreed to the published version of the manuscript.

Funding

This research received no external funding.

Institutional Review Board Statement

Not applicable.

Informed Consent Statement

Not applicable.

Data Availability Statement

Data will be provided based on request.

Acknowledgments

The authors would like to thank all of the anonymous reviewers for their constructive comments regarding this article.

Conflicts of Interest

Author Siyu Wei was employed by Changjiang Spatial Information Technology Engineering. The remaining authors declare that the research was conducted in the absence of any commercial or financial relationships that could be construed as a potential conflict of interest.

References

  1. Fang, C.; Liu, H.; Wang, S. The coupling curve between urbanization and the eco-environment: China’s urban agglomeration as a case study. Ecol. Indic. 2021, 130, 108107. [Google Scholar] [CrossRef]
  2. Cui, X.; Fang, C.; Liu, H.; Liu, X. Assessing sustainability of urbanization by a coordinated development index for an Urbanization-Resources-Environment complex system: A case study of Jing-Jin-Ji region, China. Ecol. Indic. 2019, 96, 383–391. [Google Scholar] [CrossRef]
  3. Pei, T.; Xu, J.; Liu, Y.; Huang, X.; Zhang, L.; Dong, W.; Qin, C.; Song, C.; Gong, J.; Zhou, C. GIScience and remote sensing in natural resource and environmental research: Status quo and future perspectives. Geogr. Sustain. 2021, 2, 207–215. [Google Scholar] [CrossRef]
  4. Spadoni, G.L.; Cavalli, A.; Congedo, L.; Munafò, M. Analysis of Normalized Difference Vegetation Index (NDVI) multi-temporal series for the production of forest cartography. Remote Sens. Appl. Soc. Environ. 2020, 20, 100419. [Google Scholar] [CrossRef]
  5. Lacouture, D.L.; Broadbent, E.N.; Crandall, R.M. Detecting vegetation recovery after fire in a fire-frequented habitat using normalized difference vegetation index (NDVI). Forests 2020, 11, 749. [Google Scholar] [CrossRef]
  6. Vijith, H.; Dodge-Wan, D. Applicability of MODIS land cover and Enhanced Vegetation Index (EVI) for the assessment of spatial and temporal changes in strength of vegetation in tropical rainforest region of Borneo. Remote Sens. Appl. Soc. Environ. 2020, 18, 100311. [Google Scholar] [CrossRef]
  7. Xu, J.; Quackenbush, L.J.; Volk, T.A.; Im, J. Forest and crop leaf area index estimation using remote sensing: Research trends and future directions. Remote Sens. 2020, 12, 2934. [Google Scholar] [CrossRef]
  8. Pandey, P.C.; Chauhan, A.; Maurya, N.K. Evaluation of earth observation datasets for LST trends over India and its implication in global warming. Ecol. Inform. 2022, 72, 101843. [Google Scholar] [CrossRef]
  9. Ortiz-Gómez, R.; Flowers-Cano, R.S.; Medina-García, G. Sensitivity of the RDI and SPEI drought indices to different models for estimating evapotranspiration potential in semiarid regions. Water Resour. Manag. 2022, 36, 2471–2492. [Google Scholar] [CrossRef]
  10. Eid, A.N.M.; Olatubara, C.; Ewemoje, T.; El-Hennawy, M.T.; Farouk, H. Inland wetland time-series digital change detection based on SAVI and NDWI indecies: Wadi El-Rayan lakes, Egypt. Remote Sens. Appl. Soc. Environ. 2020, 19, 100347. [Google Scholar] [CrossRef]
  11. Xu, H. A remote sensing index for assessment of regional ecological changes. China Environ. Sci. 2013, 33, 889–897. [Google Scholar]
  12. Yuan, B.; Fu, L.; Zou, Y.; Zhang, S.; Chen, X.; Li, F.; Deng, Z.; Xie, Y. Spatiotemporal change detection of ecological quality and the associated affecting factors in Dongting Lake Basin, based on RSEI. J. Clean. Prod. 2021, 302, 126995. [Google Scholar] [CrossRef]
  13. Maity, S.; Das, S.; Pattanayak, J.M.; Bera, B.; Shit, P.K. Assessment of ecological environment quality in Kolkata urban agglomeration, India. Urban Ecosyst. 2022, 25, 1137–1154. [Google Scholar] [CrossRef]
  14. Karbalaei Saleh, S.; Amoushahi, S.; Gholipour, M. Spatiotemporal ecological quality assessment of metropolitan cities: A case study of central Iran. Environ. Monit. Assess. 2021, 193, 305. [Google Scholar] [CrossRef] [PubMed]
  15. Zhu, D.; Chen, T.; Zhen, N.; Niu, R. Monitoring the effects of open-pit mining on the eco-environment using a moving window-based remote sensing ecological index. Environ. Sci. Pollut. Res. 2020, 27, 15716–15728. [Google Scholar] [CrossRef]
  16. Wang, J.; Liu, D.; Ma, J.; Cheng, Y.; Wang, L. Development of a large-scale remote sensing ecological index in arid areas and its application in the Aral Sea Basin. J. Arid Land 2021, 13, 40–55. [Google Scholar] [CrossRef]
  17. Chen, N.; Cheng, G.; Yang, J.; Ding, H.; He, S. Evaluation of Urban Ecological Environment Quality Based on Improved RSEI and Driving Factors Analysis. Sustainability 2023, 15, 8464. [Google Scholar] [CrossRef]
  18. Wang, Z.; Chen, T.; Zhu, D.; Jia, K.; Plaza, A. RSEIFE: A new remote sensing ecological index for simulating the land surface eco-environment. J. Environ. Manag. 2023, 326, 116851. [Google Scholar] [CrossRef]
  19. He, J.; Wang, S.; Liu, Y.; Ma, H.; Liu, Q. Examining the relationship between urbanization and the eco-environment using a coupling analysis: Case study of Shanghai, China. Ecol. Indic. 2017, 77, 185–193. [Google Scholar] [CrossRef]
  20. Chang, Y.; Hou, K.; Wu, Y.; Li, X.; Zhang, J. A conceptual framework for establishing the index system of ecological environment evaluation–A case study of the upper Hanjiang River, China. Ecol. Indic. 2019, 107, 105568. [Google Scholar] [CrossRef]
  21. Amani, M.; Ghorbanian, A.; Ahmadi, S.A.; Kakooei, M.; Moghimi, A.; Mirmazloumi, S.M.; Moghaddam, S.H.A.; Mahdavi, S.; Ghahremanloo, M.; Parsian, S.; et al. Google earth engine cloud computing platform for remote sensing big data applications: A comprehensive review. IEEE J. Sel. Top. Appl. Earth Obs. Remote Sens. 2020, 13, 5326–5350. [Google Scholar] [CrossRef]
  22. Liu, X.; Hu, G.; Chen, Y.; Li, X.; Xu, X.; Li, S.; Pei, F.; Wang, S. High-resolution multi-temporal mapping of global urban land using Landsat images based on the Google Earth Engine Platform. Remote Sens. Environ. 2018, 209, 227–239. [Google Scholar] [CrossRef]
  23. Teluguntla, P.; Thenkabail, P.S.; Oliphant, A.; Xiong, J.; Gumma, M.K.; Congalton, R.G.; Yadav, K.; Huete, A. A 30-m landsat-derived cropland extent product of Australia and China using random forest machine learning algorithm on Google Earth Engine cloud computing platform. ISPRS J. Photogramm. Remote Sens. 2018, 144, 325–340. [Google Scholar] [CrossRef]
  24. Gorelick, N.; Hancher, M.; Dixon, M.; Ilyushchenko, S.; Thau, D.; Moore, R. Google Earth Engine: Planetary-scale geospatial analysis for everyone. Remote Sens. Environ. 2017, 202, 18–27. [Google Scholar] [CrossRef]
  25. Liu, Y.; Zhang, X.; Pan, X.; Ma, X.; Tang, M. The spatial integration and coordinated industrial development of urban agglomerations in the Yangtze River Economic Belt, China. Cities 2020, 104, 102801. [Google Scholar] [CrossRef]
  26. Chen, Y.; Zhang, S.; Huang, D.; Li, B.L.; Liu, J.; Liu, W.; Ma, J.; Wang, F.; Wang, Y.; Wu, S.; et al. The development of China’s Yangtze River Economic Belt: How to make it in a green way. Sci. Bull. 2017, 62, 648–651. [Google Scholar] [CrossRef]
  27. Wang, J.; Jiang, L.; Qi, Q.; Wang, Y. An Ecological Quality Evaluation of Large-Scale Farms Based on an Improved Remote Sensing Ecological Index. Remote Sens. 2024, 16, 684. [Google Scholar] [CrossRef]
  28. Zhong, A.; Hu, C.; You, L. Evaluation and Prediction of Ecological Restoration Effect of Beijing Wangping Coal Mine Based on Modified Remote Sensing Ecological Index. Land 2023, 12, 2059. [Google Scholar] [CrossRef]
  29. Bilal, M.; Mhawish, A.; Nichol, J.E.; Qiu, Z.; Nazeer, M.; Ali, M.A.; de Leeuw, G.; Levy, R.C.; Wang, Y.; Chen, Y.; et al. Air pollution scenario over Pakistan: Characterization and ranking of extremely polluted cities using long-term concentrations of aerosols and trace gases. Remote Sens. Environ. 2021, 264, 112617. [Google Scholar] [CrossRef]
  30. Najafi, Z.; Fatehi, P.; Darvishsefat, A. Vegetation dynamics trend using satellite time series imagery. Int. Arch. Photogramm. Remote Sens. Spat. Inf. Sci. 2019, 42, 783–788. [Google Scholar] [CrossRef]
  31. Alhaji, U.; Yusuf, A.; Edet, C.; Oche, C.O.; Agbo, E. Trend analysis of temperature in Gombe state using Mann Kendall trend test. J. Sci. Res. Rep. 2018, 20, 1–9. [Google Scholar] [CrossRef]
  32. Rivas-Tabares, D.A.; Saa-Requejo, A.; Martín-Sotoca, J.J.; Tarquis, A.M. Multiscaling NDVI series analysis of rainfed cereal in Central Spain. Remote Sens. 2021, 13, 568. [Google Scholar] [CrossRef]
  33. Li, C.; Chen, T.; Jia, K.; Plaza, A. Coupling Analysis Between Ecological Environment Change and Urbanization Process in the Middle Reaches of Yangtze River Urban Agglomeration, China. IEEE J. Sel. Top. Appl. Earth Obs. Remote Sens. 2024, 17, 880–892. [Google Scholar] [CrossRef]
  34. Zhang, S.; Yang, P.; Xia, J.; Qi, K.; Wang, W.; Cai, W.; Chen, N. Research and analysis of ecological environment quality in the Middle Reaches of the Yangtze River Basin between 2000 and 2019. Remote Sens. 2021, 13, 4475. [Google Scholar] [CrossRef]
  35. Quanping, Z.; Pengbin, Z.; Tengfei, X.; Yuehua, J.; Lin, G.; Ranran, Y. Ecological environment changes in Yangtze River Economic Zone in recent 20 years. Geol. China 2021, 48, 1127–1141. [Google Scholar]
  36. Yi, S.; Zhou, Y.; Zhang, J.; Li, Q.; Liu, Y.; Guo, Y.; Chen, Y. Spatial-temporal evolution and motivation of ecological vulnerability based on RSEI and GEE in the Jianghan Plain from 2000 to 2020. Front. Environ. Sci. 2023, 11, 1191532. [Google Scholar] [CrossRef]
  37. Yu, Y.; Tong, Y.; Tang, W.; Yuan, Y.; Chen, Y. Identifying Spatiotemporal Interactions between Urbanization and Eco-Environment in the Urban Agglomeration in the Middle Reaches of the Yangtze River, China. Sustainability 2018, 10, 290. [Google Scholar] [CrossRef]
  38. He, P.; Lv, J.; He, L.; Ma, K.; Hu, Q.; Liu, X. Spatial and temporal evolution of air pollution and verification of the environmental Kuznets curve in the Yangtze River Basin during 1980—2019. Eur. J. Remote Sens. 2023, 56, 2265157. [Google Scholar] [CrossRef]
  39. Yue, H.; Liu, Y.; Li, Y.; Lu, Y. Eco-environmental quality assessment in China’s 35 major cities based on remote sensing ecological index. IEEE Access 2019, 7, 51295–51311. [Google Scholar] [CrossRef]
  40. Wu, Y.; Zhao, X.; Xi, Y.; Liu, H.; Li, C. Comprehensive evaluation and spatial-temporal changes of eco-environmental quality based on MODIS in Tibet during 2006–2016. Acta Geogr. Sin. 2019, 74, 1438–1449. [Google Scholar]
  41. Houghton, R.A.; Nassikas, A.A. Global and regional fluxes of carbon from land use and land cover change 1850–2015. Glob. Biogeochem. Cycles 2017, 31, 456–472. [Google Scholar] [CrossRef]
  42. Hassan, Z.; Shabbir, R.; Ahmad, S.S.; Malik, A.H.; Aziz, N.; Butt, A.; Erum, S. Dynamics of land use and land cover change (LULCC) using geospatial techniques: A case study of Islamabad Pakistan. SpringerPlus 2016, 5, 1–11. [Google Scholar] [CrossRef] [PubMed]
  43. Li, X.; Chen, G.; Liu, X.; Liang, X.; Wang, S.; Chen, Y.; Pei, F.; Xu, X. A new global land-use and land-cover change product at a 1-km resolution for 2010 to 2100 based on human–environment interactions. Ann. Am. Assoc. Geogr. 2017, 107, 1040–1059. [Google Scholar] [CrossRef]
  44. Hua, A.K.; Ping, O.W. The influence of land-use/land-cover changes on land surface temperature: A case study of Kuala Lumpur metropolitan city. Eur. J. Remote Sens. 2018, 51, 1049–1069. [Google Scholar] [CrossRef]
  45. Mittnik, S.; Semmler, W.; Haider, A. Climate disaster risks—Empirics and a multi-phase dynamic model. Econometrics 2020, 8, 33. [Google Scholar] [CrossRef]
  46. Zandalinas, S.I.; Fritschi, F.B.; Mittler, R. Global warming, climate change, and environmental pollution: Recipe for a multifactorial stress combination disaster. Trends Plant Sci. 2021, 26, 588–599. [Google Scholar] [CrossRef]
  47. Wang, Y.; Duan, X.; Wang, L.; Zou, H. Spatial temporal patterns and driving factors of industrial pollution and structures in the Yangtze River Economic Belt. Chemosphere 2022, 303, 134996. [Google Scholar] [CrossRef]
  48. Zhang, Y.; She, J.; Long, X.; Zhang, M. Spatio-temporal evolution and driving factors of eco-environmental quality based on RSEI in Chang-Zhu-Tan metropolitan circle, central China. Ecol. Indic. 2022, 144, 109436. [Google Scholar] [CrossRef]
Figure 1. Map of the Yangtze River middle reaches megalopolis (YRMRM) location.
Sustainability 16 08118 g001
Figure 2. Distribution of modified remote sensing ecological index (MRSEI) levels from 2000 to 2020.
Sustainability 16 08118 g002
Figure 3. Changes in the average MRSEI from 2000 to 2020.
Sustainability 16 08118 g003
Figure 4. Percentage of areas with different eco-environmental quality levels from 2000 to 2020.
Sustainability 16 08118 g004
Figure 5. Trends in eco-environmental change.
Sustainability 16 08118 g005
Figure 6. Cluster analysis of the MRSEI for each city from 2000 to 2020.
Sustainability 16 08118 g006
Figure 7. Spatial distribution of various city types.
Sustainability 16 08118 g007
Table 1. Trend types for the Mann–Kendall test.
βZChange Trends
β > 02.58 > |Z| ≥ 1.96Significant improvement
1.96 > |Z| ≥ 1.65Slight improvement
|Z| < 1.65Insignificant improvement
β < 0|Z| < 1.65Insignificant degradation
1.96 > |Z| ≥ 1.65Slight degradation
2.58 > |Z| ≥ 1.96Significant degradation
Table 2. Eigenvectors and eigenvalue contribution rates of PC1 for the five indicators.
YearPC1Contribution
(%)
NDVIWETNDBSILSTAOD
20000.6900.239−0.660−0.106−0.13886.20
20050.6970.240−0.437−0.071−0.51076.67
20100.7400.240−0.588−0.075−0.20780.95
20150.5200.193−0.659−0.310−0.40177.82
20200.7150.262−0.639−0.034−0.10188.06
Table 3. Persistence of eco-environmental quality changes.
HPersistence TypePercentage
0–0.25Strong anti-persistence2.4%
0.25–0.5Weak anti-persistence16.2%
0.5–0.75Weak persistence51.8%
0.75–1Strong persistence29.6%
Disclaimer/Publisher’s Note: The statements, opinions and data contained in all publications are solely those of the individual author(s) and contributor(s) and not of MDPI and/or the editor(s). MDPI and/or the editor(s) disclaim responsibility for any injury to people or property resulting from any ideas, methods, instructions or products referred to in the content.

