1. Introduction
The socio-economic trajectories of cities are profoundly shaped by both structural reforms and the inherent characteristics of urban systems. This study examines the impact of the 1999 administrative reform in Poland, which redefined the status of regional capitals and altered the central functions of many cities. Focusing on the evolution of urban hierarchies and economic roles, this study situates its findings within the broader context of economic and spatial theories.
Despite the significant number of studies on this topic, there remains a clear research gap in understanding the long-term effects of losing administrative status on the dynamics of urban development. Many studies focus on short-term effects or residents’ subjective perceptions, neglecting more detailed analyses of economic and demographic data. Furthermore, much research concentrates on cities that have lost administrative functions without simultaneously conducting a comparative analysis of cities that have retained their status.
The example of Poland, where the 1999 administrative reform reduced the number of voivodeships (administrative regions) from 49 to 16 [
1] and changed the status of many cities, provides a unique case study for analyzing the impact of such reforms on urban development.
This article aims to fill this gap by analyzing how the loss of administrative function affected urban development in Poland, both in the short and long term. By using centrality indicators and other socio-economic measures, this study assesses whether losing the status of regional capital leads to a significant slowdown in urban development and identifies factors that may mitigate or exacerbate these effects. The results of this analysis provide valuable insights for policymakers, urban planners, and researchers seeking to understand and manage the dynamic processes of urban transformation.
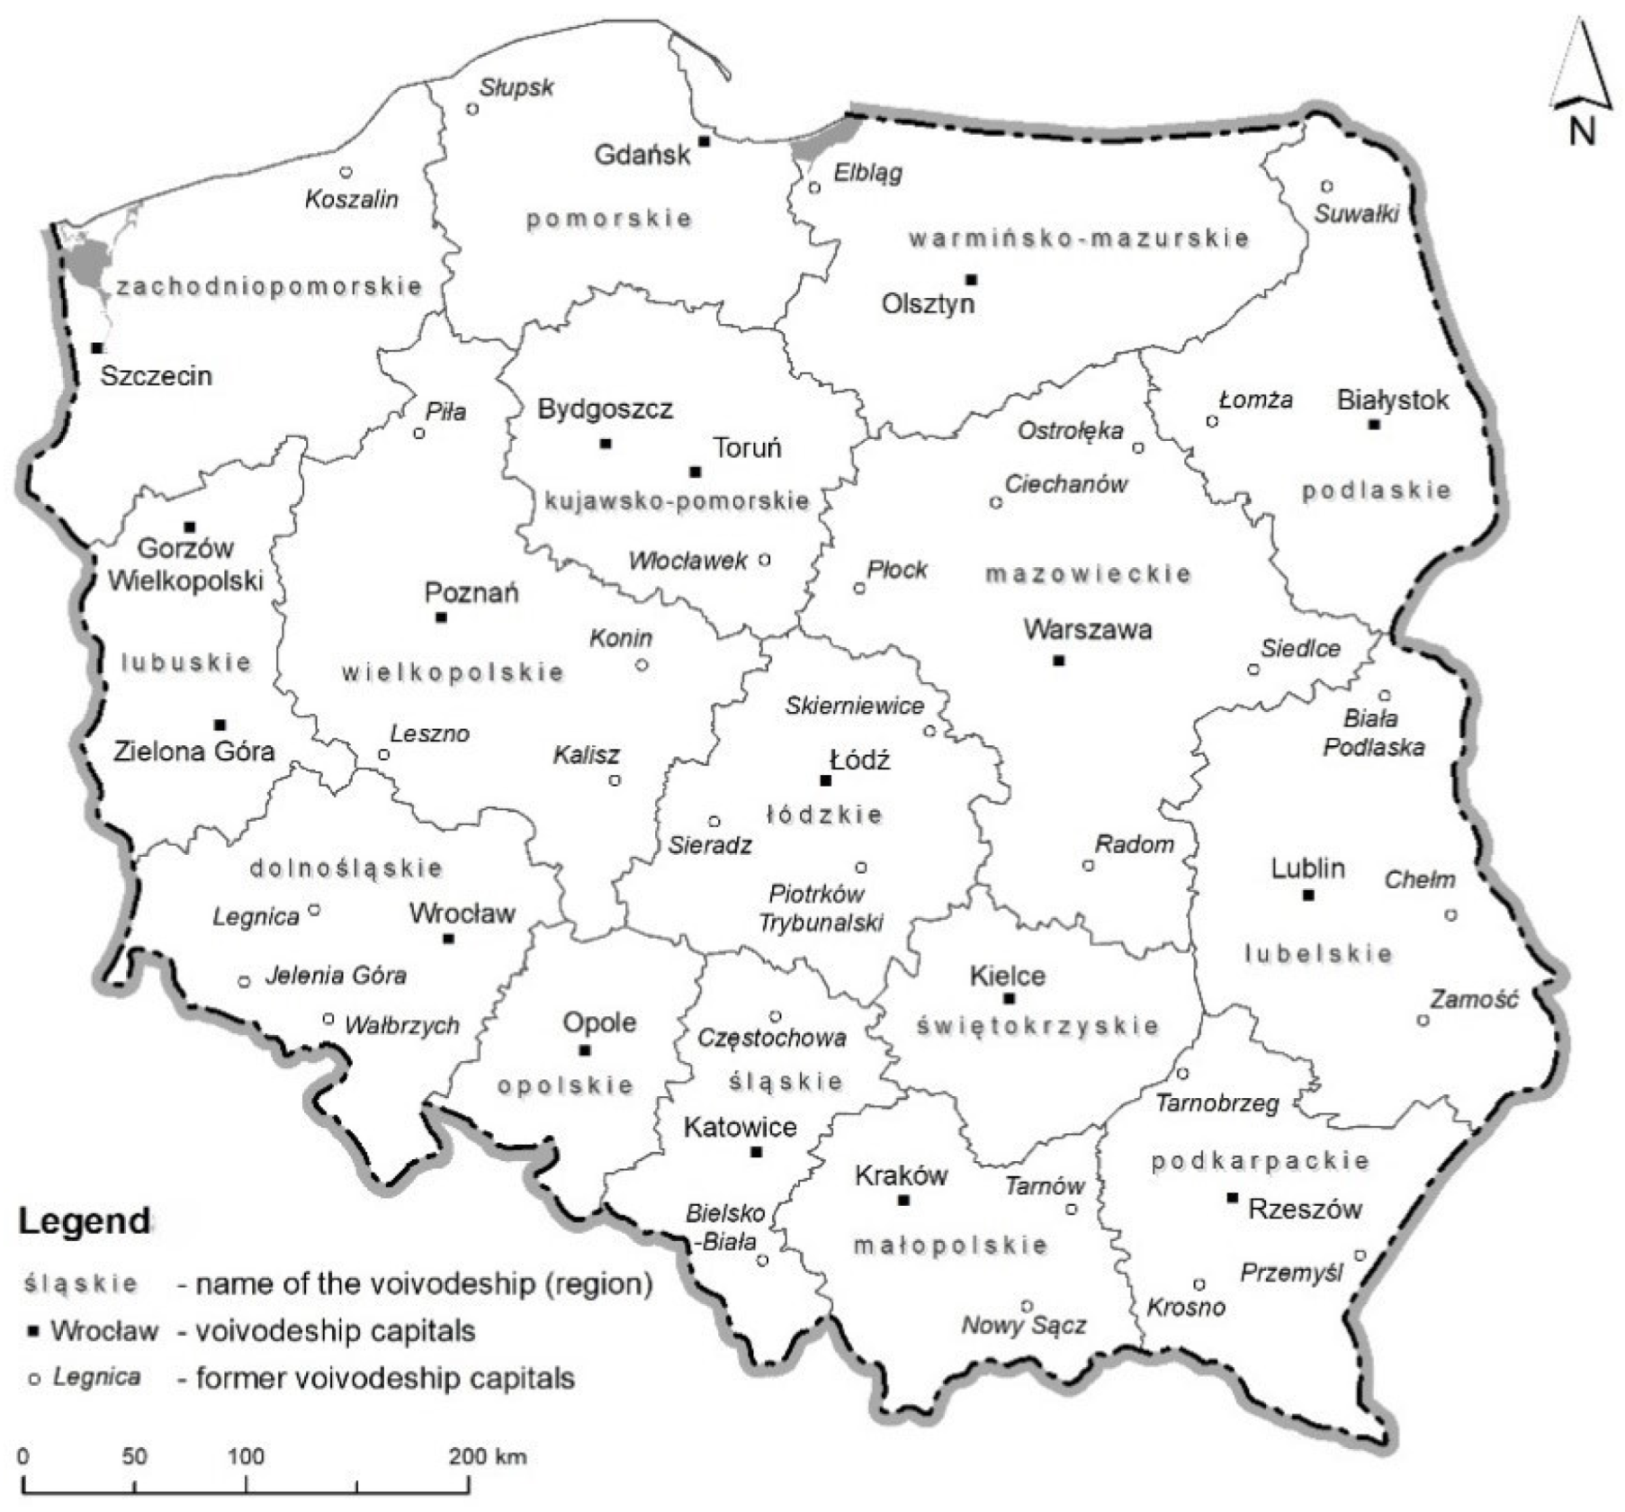
The aim of the article is to determine and evaluate changes in the implementation of central functions in major Polish cities in the context of the 1999 administrative reform. This study covers a twenty-two-year period (1998–2019), providing a good perspective for assessing functional changes within the current territorial division. The research encompasses the 49 cities (
Figure 1) that served as provincial capitals until 1998. These can be divided into two groups.
The first group includes the cities that retained this status after 1998: Białystok, Bydgoszcz, Gdańsk, Gorzów Wielkopolski, Katowice, Kielce, Kraków, Lublin, Łódź, Olsztyn, Opole, Poznań, Rzeszów, Szczecin, Toruń, Warsaw, Wrocław, and Zielona Góra. Fourteen of these cities serve as both the voivode’s seat and the regional self-government’s seat. In two voivodeships, these administrative functions are shared: in the Kuyavian-Pomeranian Voivodeship, Bydgoszcz is the voivode’s seat, while Toruń houses the regional assembly and marshal’s office; similarly, in the Lubusz Voivodeship, Gorzów Wielkopolski is the voivode’s seat, and Zielona Góra is the self-government seat. As a result, 18 cities play the role of a regional capital in the 16 Polish voivodeships.
The second group consists of the 31 cities that lost their status as a provincial capital due to the reform: Biała Podlaska, Bielsko-Biała, Chełm, Ciechanów, Częstochowa, Elbląg, Jelenia Góra, Kalisz, Konin, Koszalin, Krosno, Legnica, Leszno, Łomża, Nowy Sącz, Ostrołęka, Piła, Piotrków Trybunalski, Płock, Przemyśl, Radom, Siedlce, Sieradz, Skierniewice, Słupsk, Suwałki, Tarnobrzeg, Tarnów, Wałbrzych, Włocławek, Zamość. Except for Ciechanów, Piła, Sieradz, and Wałbrzych (temporarily), these cities retained the status of being a powiat (metropolitan district) [
2].
This study will investigate the hypothesis that administrative changes influence the process of urban development, in particular that losing provincial capital status limits this development.
2. Theoretical Frameworks
Urban theory has long grappled with the forces shaping city development and regional dynamics. Walter Christaller’s central place theory, a milestone in spatial economics, posits that cities function as central hubs providing goods and services to surrounding areas, thereby creating a hierarchical urban network [
3]. This theory suggests that the centrality of a place, defined by the concentration of a range of services, plays a crucial role in its economic vitality and socio-political significance.
Christaller’s model faced criticism for its simplified view of urban systems, especially its static description of the distribution of population and the provision of services. However, later researchers, including Brian Berry and August Lösch, expanded on these ideas, integrating them with empirical observations to give a better understanding of patterns of urban and regional development [
4,
5].
In the second half of the 20th century, spatial economists and urbanists began to focus more on the dynamic aspects of urban growth, introducing concepts such as agglomeration economies and urban scaling laws. Some assumptions of Christaller were particularly questioned due to their static nature [
6] and simplified understanding of the hierarchy of cities based solely on population size [
7,
8,
9].
Paul Krugman and Masahisa Fujita further developed these ideas within the framework of new economic geography. Although this concept arises from somewhat different theoretical constructs, such as François Perroux’s theory of growth poles [
10], based on external economies of scale and agglomeration, or Paul Samuelson’s theory of location and international trade [
11], their work emphasized the role of increasing returns to scale and transport costs in shaping the spatial distribution of economic activity [
12]. They introduced models explaining how agglomerative forces—such as economies of scale, network effects, and labor market pooling—compete with dispersive forces, such as congestion and the high cost of land, to determine the size and spatial arrangement of cities. A similar concept in their model of the new economic geography of central places, combining Christaller’s ideas with those of Fujita and Mori, was presented in [
13].
Other scholars [
14,
15] have also contributed to the development and adaptation of classical central place theories, refining them to suit contemporary urban realities. Parr, in his analysis of multi-tiered urban structures, highlights the need to integrate the theory with a more flexible approach that considers polycentricity and the functional diversity of cities. On the other hand, [
15] expands Christaller’s theories within the context of the growing importance of global cities and international economic networks, leading to a reassessment of traditional assumptions regarding spatial hierarchies.
In the context of contemporary research, it is also important to highlight the role of new analytical tools such as GIS systems and AI-based models, which allow for more precise analysis of spatial structures and enable a better understanding of the complex interactions between administrative, economic, and social factors. For example, the works [
16,
17] integrate traditional theories with modern approaches based on big data analysis and simulation models. As a result, central place theory, despite its limitations, finds new applications, particularly in studies on dynamic processes of regional transformation and sustainable development.
In this way, W. Christaller’s central place theory, understood as a spatial-economic model, was revitalized. Its classic form still holds significance in the social sciences and spatial economics. Its simplicity, while not fully capturing the complexity of modern urban systems, nevertheless provides a universal analytical framework. In the context of the increasing availability of spatial data and GIS analysis tools, this theory is finding new applications and can be used as an element of more advanced research models. This has resulted in a certain renaissance of central place theory. Fujita, Krugman, and Mori [
18] even stated that this theory was simply too powerful to remain undeveloped.
The utility of this concept for studying post-socialist realities was demonstrated by [
19]. It examined how the political and economic changes that followed the fall of communism impacted the hierarchy of central places in Poland and other countries in the region. These analyses included factors such as administrative decentralization, changes in economic structure, and population migration. It has been argued that Christaller’s theory could be useful in analyzing these processes, provided it is adapted to specific historical and social conditions.
Similarly, the work [
20] refers to central place theory, adapting it to contemporary socio-economic realities. Like [
19], it emphasizes the need to consider specific local and regional conditions, as well as new trends such as sustainable development and polycentrism, in the analysis of urban structures. Its contributions highlight the ongoing evolution of Christaller’s theory and its adaptation to changing global conditions.
In the context of research on the impact of administrative factors on urban development trajectories, central place theory offers valuable analytical tools for understanding how changes in administrative structures can affect the hierarchy and functions of cities. Administrative reforms, such as changes in the status of regional capitals or the redistribution of government functions, have the potential to transform local economies, influencing their ability to attract investment, population, and capital.
The literature often highlights that granting a city administrative functions can lead to multiplier effects that promote development in other areas of the urban economy. This may form a basis for the future development of a city [
21,
22,
23,
24,
25]. However, some authors also note negative aspects of being a regional or national capital. For example, the dominance of public functions may lead to a drain of talent and resources, which negatively impacts development in other areas of activity [
25,
26,
27]. Another threat might lie in the rise of a bureaucratic culture of administration and management, leading to an inflexible approach that acts as a barrier to entrepreneurship and innovation [
28].
A comprehensive review of empirical studies based on the theories described above can be found in [
29,
30,
31]. It is worth discussing several fundamental works in more detail, especially as contemporary research on the impact of the loss of administrative functions on urban development trajectories emphasizes the diverse effects of this process.
For example, research conducted in Austria [
32] showed that the loss of the status of being a regional capital leads to a significant decline in public and private investment, often resulting in long-term economic regression. Similar results appear in analyses concerning cities in Germany [
33], where it was observed that cities losing administrative functions experience greater outmigration and loss of talent, exacerbating the marginalization of these centers. These studies, continuing the fundamental work [
23], showed that loss of administrative status could lead to increasing unemployment, decreasing incomes, and the weakening of the service sector, which is often closely linked to the presence of administrative institutions.
However, research in Poland [
34] indicates that the perception of marginalization may not always correspond to economic reality. These analyses show that while cities losing the status of regional capital often report concerns about declining prestige and significance, actual socio-economic indicators do not always show dramatic regression. In some cases, these cities, despite losing administrative functions, find alternative development paths, such as specializing in innovative or tourism sectors.
Additionally, a study [
35], based on analyses conducted in several European countries, suggests that the effects of losing administrative functions may be less straightforward and rather dependent on the regional context and structural conditions of particular cities. It indicates that a key factor determining the consequences of losing administrative status is the prior level of economic diversification and the degree of involvement of local government in restructuring processes and seeking new sources of economic growth.
Similar studies outside Europe also reveal the complexity of these processes. For example, research in Australia [
36] showed that cities losing the status of state capital face challenges related to halting the outflow of inhabitants and decline in investment, often leading to regional inequalities. Similarly, studies in the United States [
37] indicate that changes in administrative status can affect public policy and the redistribution of resources, which in turn impacts a city’s ability to adapt and pursue sustainable development.
These observations suggest that administrative reform can act as a catalyst for change, influencing urban development trajectories by modifying the central functions of cities. In practice, this means that cities often need to adapt their development strategies to respond to changing administrative and economic conditions. In summary, research on the impact of administrative factors on urban development uses central place theory as an analytical framework, enabling an understanding of how political and administrative decisions shape urban economic and social landscapes. Integrating these theories with modern approaches and empirical research enables a better understanding of the complex interactions that define the development of contemporary cities.
3. Materials and Methods
The level of development of the central functions of a city was measured using two indicators: the indicator of the centrality of a city
and the indicator of the centrality of a city corrected according to its demographic potential
. It should be noted here that a similar approach was used by Przybyła and Kachniarz [
29]. The data used there covered the period from 1998 to 2013. The study presented here uses those data, together with new data covering the period up to 2019.
The indicator of the centrality of a city,
WC (Equation (1)), measures the number of people employed in a given sector within a city relative to the number of people employed in that sector in the administrative region containing that city. This term is the difference between the number of people employed in a sector within a city and the number of people that would be employed if the proportion employed in that sector was the same as in the administrative region. When the proportion of individuals employed in a sector within a city is fixed, this indicator is proportional to the population of the city. Hence, in order to compare cities with different populations, it is necessary to scale
WC according to the population of a city. The scaled indicator of the centrality of a city corrected according to its demographic potential,
(Equation (2)), measures the relative excess of the number employed in a sector within a city per 1000 inhabitants. A large positive value of this indicator shows that a city exhibits specialization in that sector (high centrality), while low or negative values show a low level of specialization (low centrality). A large value of the indicator for general employment shows that a relatively large number of people commute into the city. Hence, this indicator enables us to compare the centrality of cities and their influence on the surrounding region [
38].
where the following definitions hold:
—indicator of the centrality of a city;
—number employed in Sector i within a city;
—population of a city;
—number employed in Sector i within the region of attraction (administrative region) of a city;
—population of the region of attraction (administrative region) of a city.
where the following definitions hold:
—indicator of the centrality of a city corrected according to its population;
—indicator of the centrality of a city (based on Equation (1));
—population of a city.
It should be noted that, as in previously conducted studies, the region of attraction of each city is assumed to correspond to the set of local government administrations included in the original region (voivodeship). It should be noted that under the administrative reforms of 1998, in general, several regions were combined to form larger regions. For example, the Jelenia Góra, Legnica, Wałbrzych, and Wrocław regions were combined into the new region of Lower Silesia with its capital in Wrocław. The changes in the borders of administrative regions at lower levels were minimal. This enables a comparison of the central functions of a city at different points in time; see [
29].
It should also be noted that the classification of businesses by the Polish government changed between 1998 and 2019. The Polish Business Classification of 2007 (PBC 2007) has been used since 2008, replacing the PBC 2004 system. These changes mean that some of the classes are not comparable. Hence, it was necessary to use expert knowledge to correct for the differences between these data; see [
29].
In order to analyze the relationship between the relative measure of centrality, or changes in the global value of a city’s indicator of centrality (adjusted for population size) and the population of a city (measured in 1998, the start of the study period), Spearman’s coefficient of correlation, rS, was used. This coefficient takes values between −1 and +1 (inclusively). Values close to zero indicate a lack of a systematic relation between the population of a city and its indicator of centrality. When rS = 1, the indicator of centrality is strictly increasing in a city’s population. When rS = −1, the indicator of centrality is strictly decreasing in a city’s population. In order to assess the strength of association between two variables, we use the following scale:
—weak (or no) dependence;
—moderate dependence;
—strong dependence.
It should be noted that the adjusted index of centrality, , does not have a normal distribution and the number of cities investigated is not very large. For this reason, in order to assess the relations between the status of a city (current or former capital) and the adjusted index of centrality (including changes in the index of centrality), a non-parametric test was used, the Wilcoxon rank test.
4. Changes in the Central Function of Polish Cities
Studies on the centrality of cities have concentrated on the various sectors of service provided in the cities considered; see [
18,
23,
38,
39,
40]. Such data are presented in
Table 1,
Table 2,
Table 3,
Table 4,
Table 5 and
Table 6. Note that current capitals are written in italics, while former capitals are indicated by normal script.
The numbers employed in various sectors in 1998 are presented in
Table 1. The corresponding indices of centrality are presented in
Table 2. The corresponding data for 2013 are presented in
Table 3 and
Table 4.
Table 5 gives the number employed in various sectors in 2019, while
Table 6 presents the corresponding corrected measures of centrality.
Table 7 presents the global measures of centrality in decreasing order. As in the previous tables, the current regional capitals are written in italics. It should be noted that in each case the majority of the top ten positions, including all of the top three positions, are occupied by current capitals. While three of the top ten positions were occupied by former regional capitals in 1998 (Krosno, Nowy Sącz, Przemyśl), in 2013, Krosno was the only former regional capital in the top ten. On the other hand, the lower positions are dominated by former regional capitals. This is particularly visible in 2019, when the bottom half of the table is occupied solely by former regional capitals.
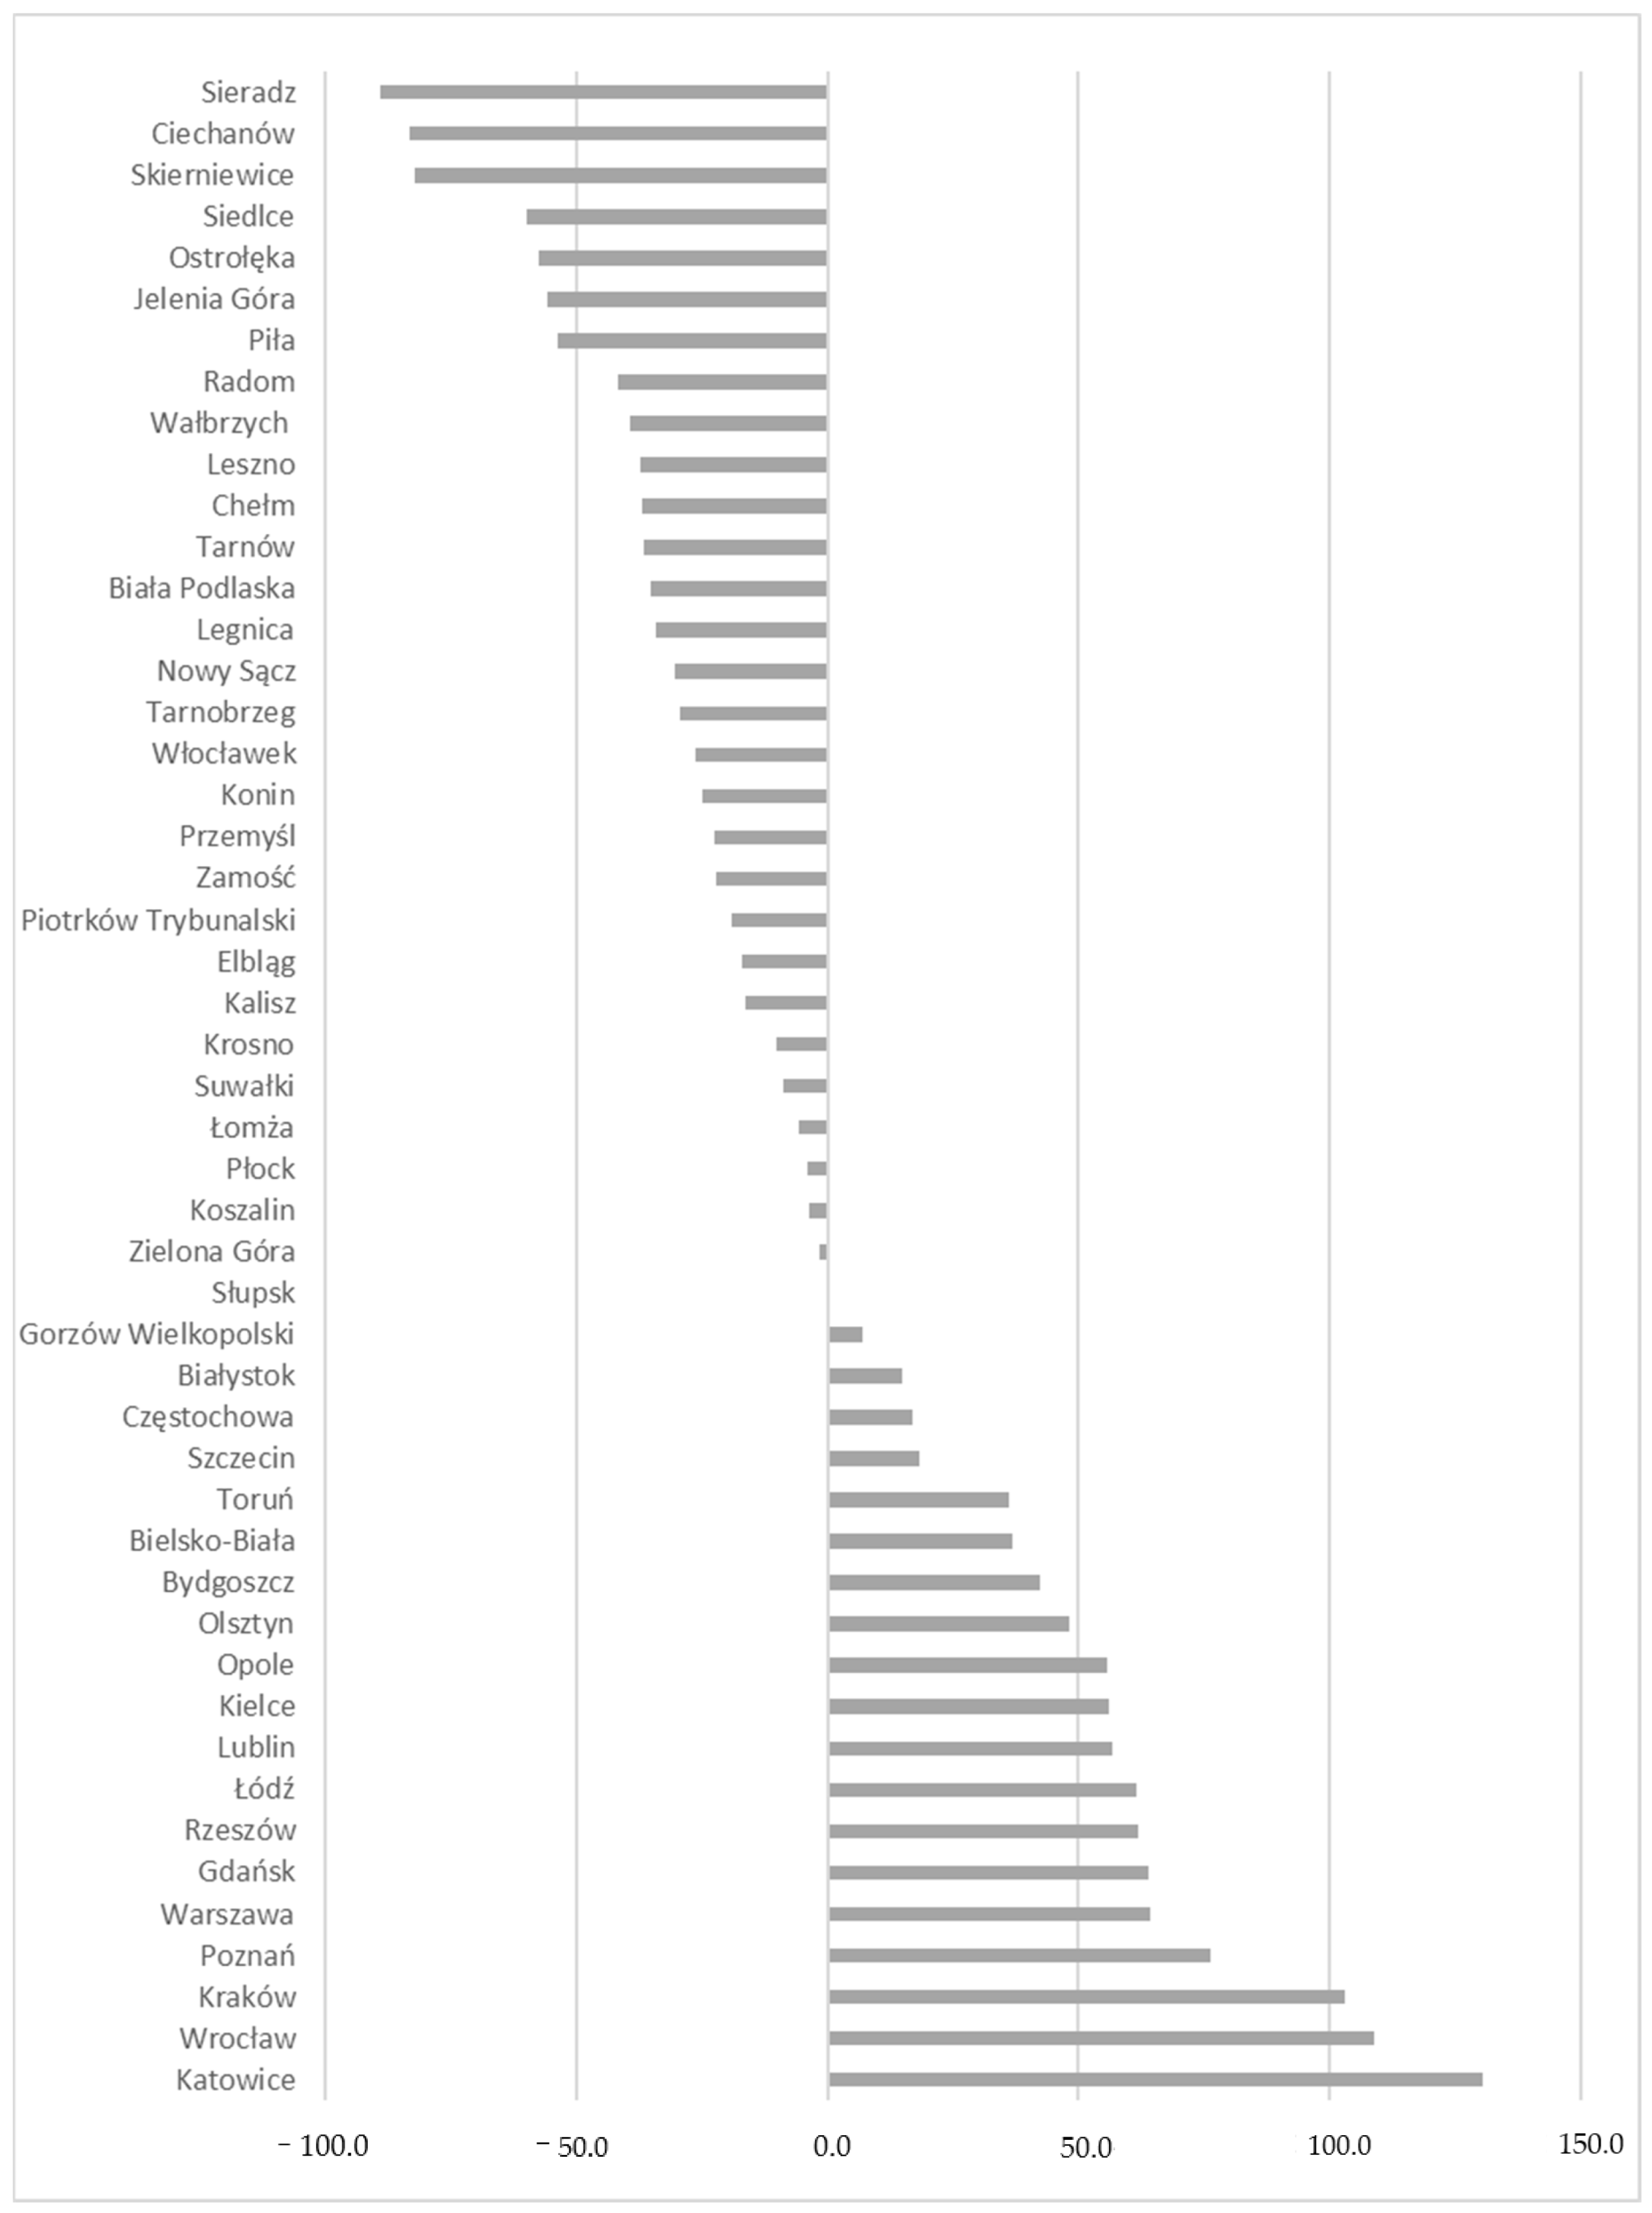
Figure 2 illustrates the changes in the corrected values of the global index of centrality over the period from 1998 to 2019. It can be seen that the largest increases in this index correspond to current capitals. Only one current capital, Zielona Góra, exhibited a (small) decrease in the value of the global index of centrality. There exists a clear positive correlation between the size of a city and the global centrality index. The largest cities in Poland are Warsaw (1.8 mln. inhabitants), Cracow (0.8 mln.), Łódź (0.7 mln.), Wrocław (0.65 mln.), Poznań (0.54 mln.), and Gdańsk (0.5 mln.). The highest ranked city according to the increase in the global centrality index, Katowice (population 0.3 mln.), is not in itself amongst the largest cities in Poland. However, it is part of the Silesian conurbation whose total population is greater than that of the Warsaw conurbation. Only three of the former regional capitals exhibited an increase in this index over the period 1998–2019: Bielsko-Biała, Częstochowa, and Słupsk. Each of the three former capitals exhibiting the largest fall in the global index of centrality has a population of less than 50 thousand.
The Spearman coefficient of correlation between the population of a city in 1998 and the change in the global centrality index equals 0.8. Hence, it can be stated that there exists a strong, positive association between these two variables. While the importance of smaller cities in Poland as centers of employment has generally decreased, the relative importance of large cities in Poland has increased.
4.1. Comparison of Mean Measures of Centrality According to Status
Due to the relatively small sample sizes (18 current capitals and 31 former capitals) and the skewness of the distribution of the measures of centrality, a non-parametric test (Wilcoxon test) was used to investigate systematic differences in the measures of centrality according to the status of a city. A significance level of 5% was applied; i.e., a difference was inferred to be statistically significant when the corresponding p-value was found to be less than 0.05.
- (A)
In 1998
Note that, for example, the index 10
−4 denotes that the first non-zero digit of the
p-value appears in the fourth position after the decimal point (
Table 8).
Immediately prior to the administrative reforms, the current capitals exhibited a clearly higher level of centrality in the market sectors. The level of centrality in the non-market sectors was not associated with the status of a city resulting from the re-forms. Overall, the current capitals exhibited a higher level of centrality.
- (B)
In 2013
In 2013, the current capitals exhibited a higher level of centrality in all of the sec-tors (
Table 9). The extremely low
p-values suggest that the difference between the levels of centrality according to a city’s current status increased in the period from 1998 to 2013. This is confirmed by the following facts:
In this period, the measure of centrality for the market sectors clearly decreased in the former capitals, but decreased more slowly in the current capitals.
The measure of centrality for the non-market sectors did not significantly change in the former capitals, but clearly increased in the current capitals.
This will be analyzed more closely when the dynamics of change according to the current status of a city are investigated.
- (C)
In 2019
In 2019, the current capitals exhibited a higher level of centrality in all of the sec-tors (
Table 10).
1. In this period, the measure of centrality for the market sectors again decreased in the former capitals, but increased almost back to 1998 levels in the cur-rent capitals.
2. The measure of centrality for the non-market sectors marginally decreased in the former capitals, but again increased in the current capitals.
In summary, at the beginning of the study period, the level of centrality in the non-market sectors was very similar among both the cities that lost their status as re-gional capitals and the current capitals. However, the level of centrality in the market sectors, and thus the overall level of centrality, was significantly higher in the current capitals. This indicates that, even before the administrative reforms, the current re-gional capitals had higher economic status than the cities that lost this status. Between 1998 and 2013, there was a fall in the level of centrality in the market sectors among both sets of cities, which was more prominent in the former capitals. While there was no significant change in the level of centrality in the non-market sectors among the former regional capitals, this level increased significantly amongst the current capitals. Between 2013 and 2019, the level of centrality in the market sectors amongst the cur-rent capitals returned to a similar level to that in 1998. On the other hand, this level continued to decline in the former capitals, albeit at a slightly slower rate. The level of centrality in the non-market sector continued to rise in the current capitals, while re-maining stable in the former capitals. Hence, although the pattern of changes is not uniform, the changes generally indicate an increasing disparity between the current regional capitals and the former capitals. These changes will be analyzed in more de-tail in the following subsections.
4.2. Dynamics of Change in the Former Capitals
The Wilcoxon test for paired values was used to test whether the mean centrality measures changed over the study period. Note that the mean values are all rounded to two decimal places, which may result in minor differences between the mean increase and the corresponding base values.
- (A)
Between 1998 and 2013
Statistical analysis of the dynamics of change in the former capitals confirms the observations made above. In the period from 1998 to 2013, there was no significant change in the measure of centrality for the non-market sector (
Table 11). On the other hand, there is a very clear fall in the measure of centrality for the market sectors, which corresponds to a clear fall in the global measure of centrality. The measure of centrality for the market sectors only grew in 2 of the 31 former capitals (Krosno and Płock). The changes in the non-market sector were evenly distributed: the centrality measure rose in 16 cities and fell in 15. The global change in centrality was positive in 6 of the 31 former capitals (Legnica, Łomża, Krosno, Częstochowa, Bielsko-Biała, and Płock).
- (B)
Between 2013 and 2019
In the period from 2013 to 2019, the changes observed were very similar (
Table 12). The mean measure of centrality continued to fall in the market sector but did not change significantly in the non-market sector. The global measure increased in 7 of the 31 former capitals (Bielsko-Biała, Częstochowa, Chełm, Przemyśl, Suwałki, Kalisz, and Słupsk). It is notable that three of the cities (Chełm, Przemyśl, Suwałki) lie very close to the eastern border of Poland, a region that received a large amount of finance from EU structural funds. The measure of centrality for the market sectors increased in five of the cities (Nowy Sącz, Bielsko-Biała, Częstochowa, Chełm, Przemyśl). In each of these five cities plus Suwałki, the measure of centrality for Sector 1 increased in this period. The measure of centrality in Sector 2 increased in nine of the 31 former capitals (Os-trołęka, Nowy Sącz, Bielsko-Biała, Chełm, Konin, Leszno, Legnica, Słupsk, and Elbląg). The measure of centrality for the non-market sector increased in 12 of the 31 cities.
- (C)
Over the Entire Study Period (1998 to 2019)
These results correspond to the results given above. The mean centrality measure for the former capitals in the non-market sector does not change significantly over the full study period. On the other hand, it falls significantly in the market sector, and as a result, the global mean measure of centrality also falls significantly. Over the entire period, the global measure of centrality grew in only 3 of these 31 cities (Bielsko-Biała, Częstochowa, and Słupsk). In the market sector, the measure of centrality only increased in Częstochowa. The measure of centrality in the non-market sector increased in 15 of the 31 former capitals (
Table 13).
4.3. Dynamics of Change in the Current Capitals
- (A)
Between 1998 and 2013
Both the global measure of centrality and the measure of centrality in the non-market sector increased in each of the 18 current capitals (
Table 14). The measure of centrality in the market sectors increased in only 4 of these 18 cities (Łódź, Lublin, Wrocław, and Gdańsk).
- (B)
Between 2013 and 2019
In this period, the global measure of centrality and the measure of centrality for the non-market sector continued to grow in a clear majority of the current capitals (
Table 15). The previous fall in the measure of centrality in the market sector reversed. This is observed clearly in Sector 1. In the majority of current capitals, the measure of centrality in Sector 2 decreased. However, the change in this sector is not significant at a level of 5%. The measure of centrality in the non-market sector only fell in Zielona Góra (which shares the role of capital with Gorzów Wielkopolski). The global level of centrality decreased in Gorzów Wielkopolski, Zielona Góra, and Opole. These are three of the smallest regional capitals (the first two share this role in the Lubuskie region). The same pattern of change was also observed in Sector 1. The measure of centrality for Sector 2 increased in 4 of the 18 current capitals (Łódź, Warsaw, Cracow, and Ka-towice). These are among the largest cities in Poland.
- (C)
Over the Entire Study Period (1998 to 2019)
Over the entire period, the measure of centrality in the non-market sector exhib-ited a very clear increase (in all of the current capitals), which in turn led to a clear in-crease in the mean global measure of centrality (
Table 16). The only decrease in the global index of centrality was observed in Zielona Góra. The mean measure of central-ity in the market sectors did not change significantly overall (i.e., these measures re-turned to values similar to those observed in 1998 after an initial fall).
4.4. Comparison of the Dynamics of Change in Former and Current Capitals
- (A)
Between 1998 and 2013
The increase in the measure of centrality for the non-market sector is clearly greater in the current capitals (where it grows significantly) than in the former capitals (where there is no significant change) (
Table 17). The fall in the measure of centrality for the market sectors is significantly greater in the former capitals than in the current capitals. As a consequence, the increase in the global measure of centrality is significantly greater in the current capitals (where a clear rise is observed) than in the former capitals (where the mean measure falls).
- (B)
Between 2013 and 2019
In the period from 2013 to 2019, the following mean measures of centrality exhibited greater increases in the current capitals than in the former capitals: (a) global, (b) for the market sectors, (c) for the non-market sector, (d) for Sector I. These differences were highly significant (
p < 0.001 in all cases). On the other hand, there was no difference in the dynamics of change in Sector II according to the status of a city (
Table 18).
- (C)
Over the Entire Study Period (1998 to 2019)
The mean increase in the mean measure of centrality in the non-market sector over the whole study period was greater in the current capitals than in the former capitals (where there was no significant change in the mean measure of centrality) (
Table 19). The mean decrease in the mean measure of centrality in the market sector was greater in the former capitals than in the current capitals (where there was no significant change in the mean measure of centrality). As a result, the mean increase in the mean global measure of centrality was greater in the current capitals than in the former capitals (where there was a significant fall in the mean global measure of centrality).
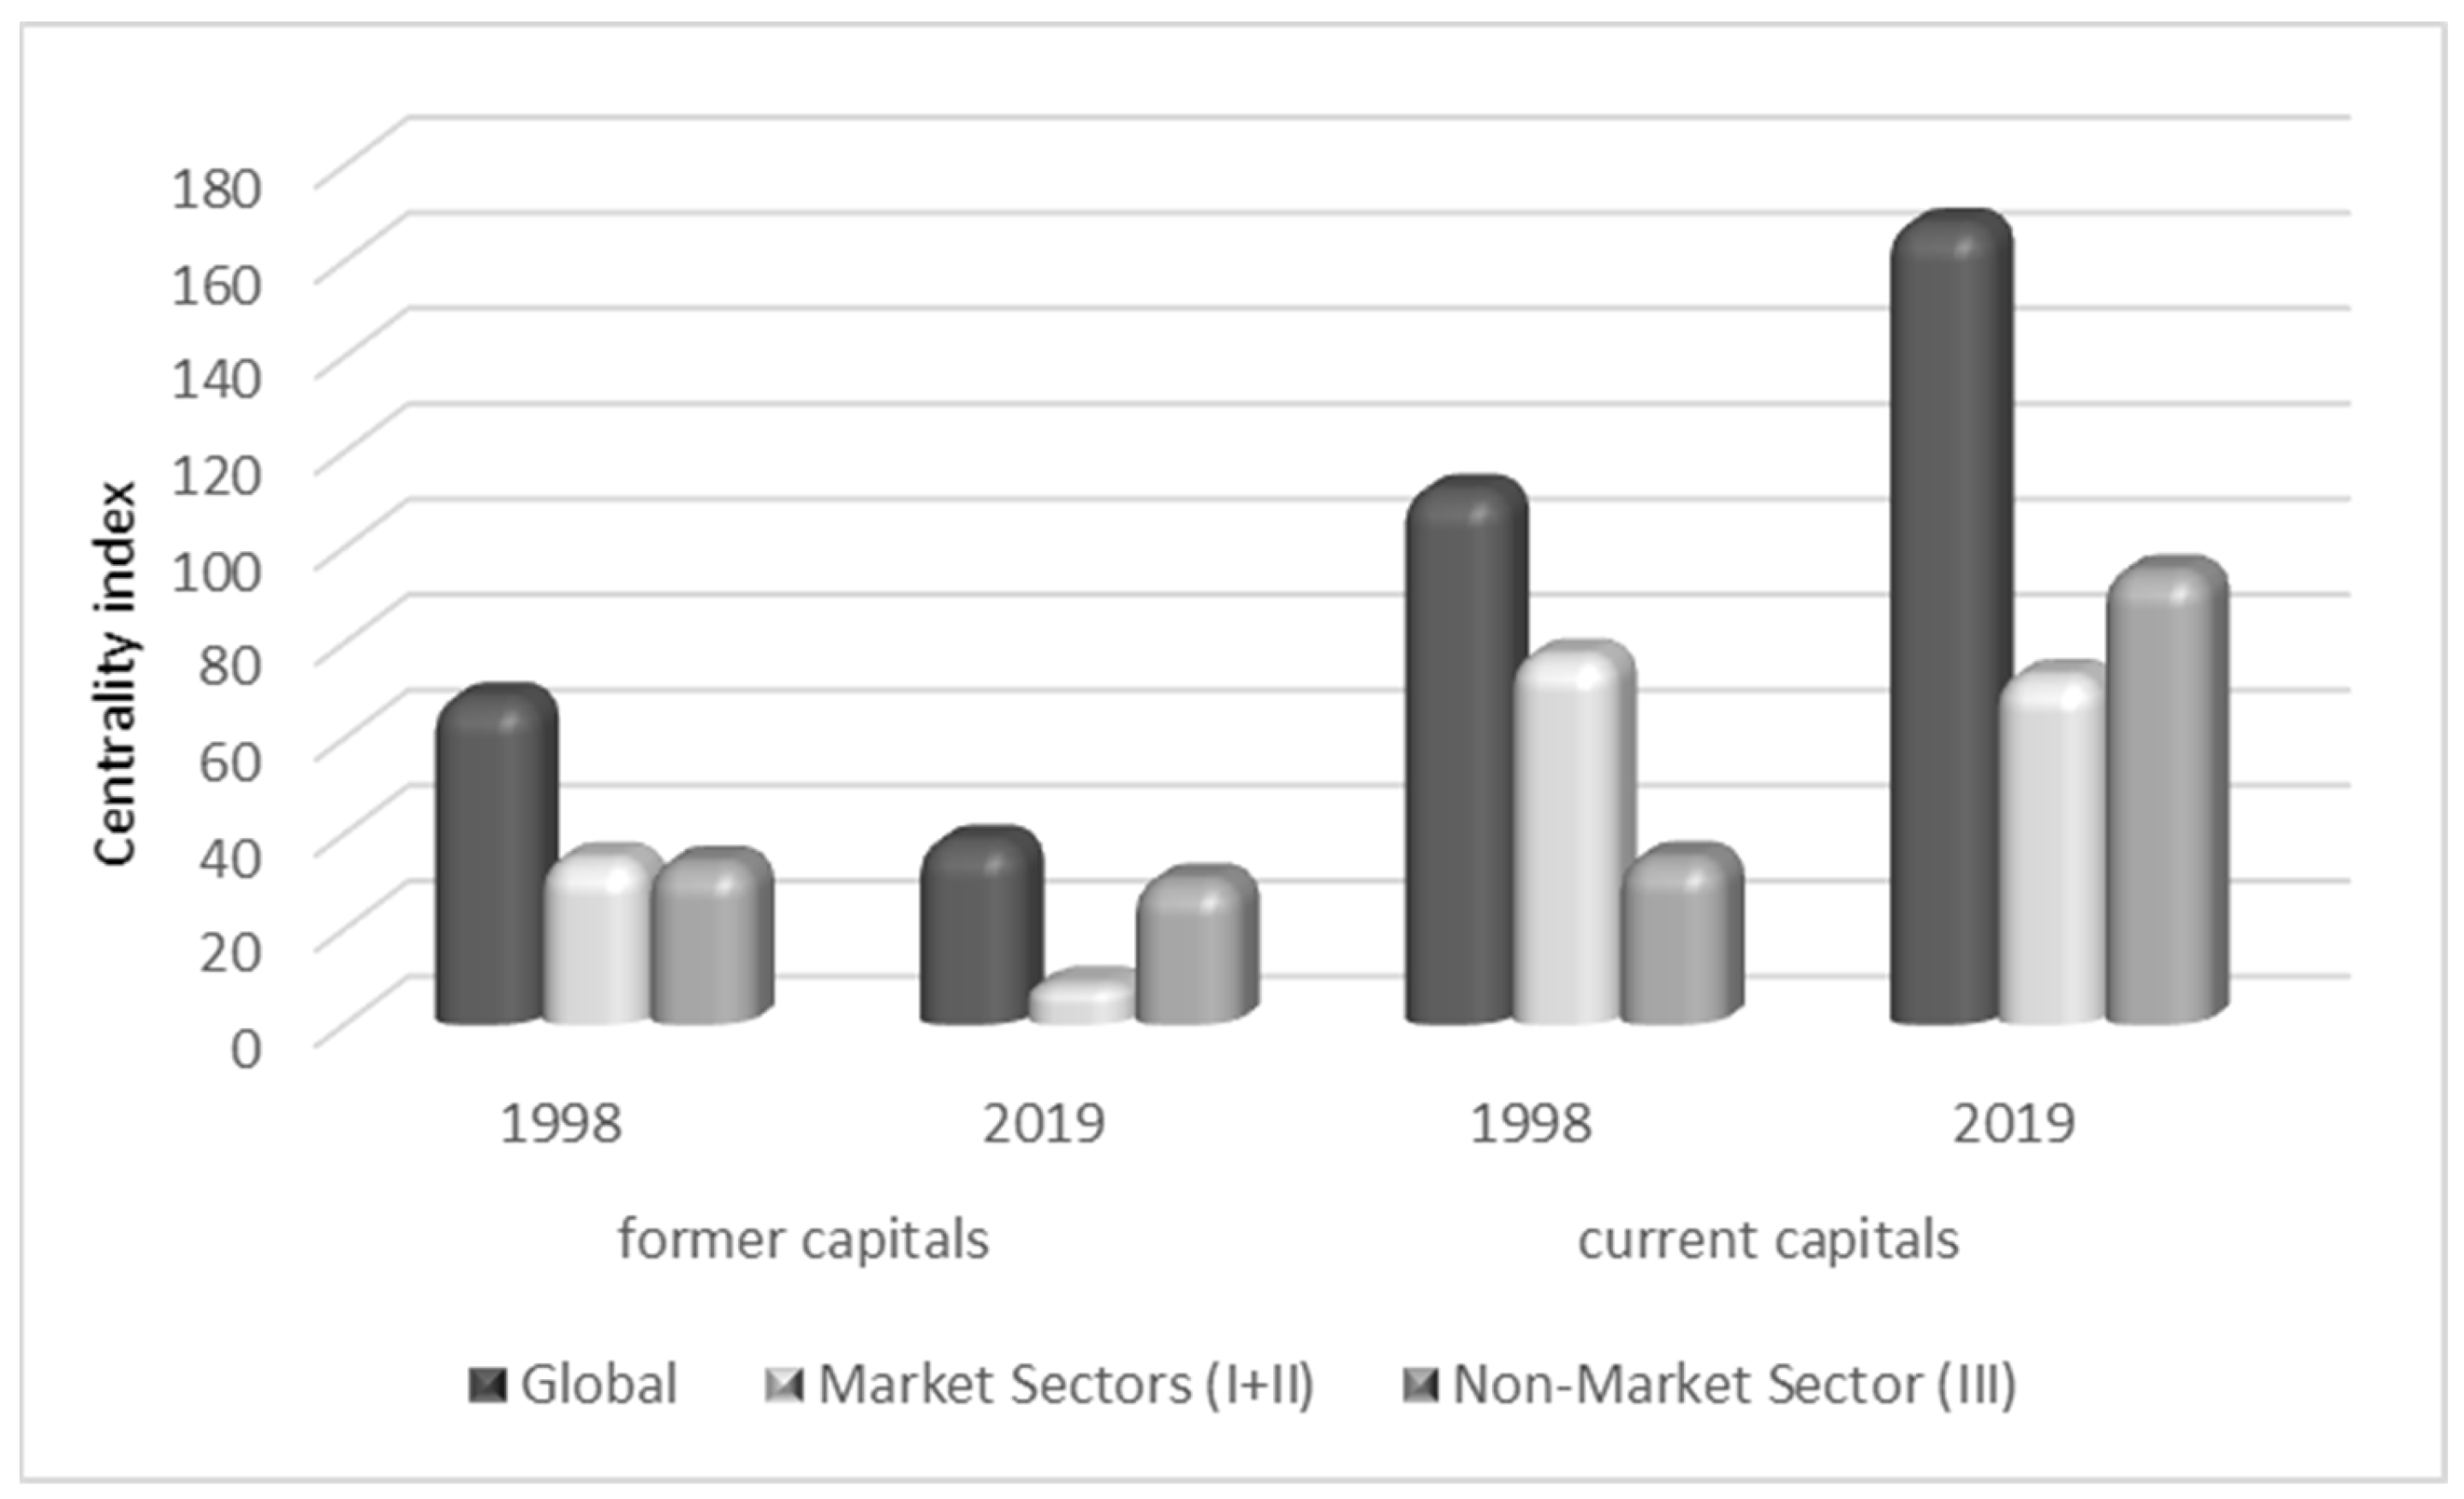
These changes are clearly illustrated in
Figure 3. In 1998, the overall centrality index in cities that retained their status as regional capital was significantly higher than in cities that lost this status. Since there were similar values of centrality in the non-market services according to status, this was determined by the clearly higher centrality index in the market services observed in cities that retained their status. In 2019, this difference was even larger, resulting from a dynamic increase in the centrality coefficient associated with non-market services in current capitals, and a decrease in the importance of market services in former capitals.
5. Discussion
In light of the results presented above, it can be stated that the evolutionary path of the central functions of Polish cities over the study period differed according to a city’s administrative role.
The group of cities whose central functions became less important (correcting for a city’s population) between 1998 and 2019 includes only those that lost their role as a regional capital. These former capitals can be generally described as large towns with a population below 100 thousand. The exceptions from this rule are Radom (210 thou.) and Wałbrzych (110 thou.), which have both faced major problems associated with the process of economic transformation and the collapse of local industry (coal mining in Wałbrzych and arms production in Radom) [
42,
43].
On the other hand, the group of cities whose central function became increasingly important predominantly includes current regional capitals. In addition, the largest cities were all ranked amongst those with the greatest increases in the importance of central functions. The largest increase was observed in Katowice (pop. 291 thou.)—which is the capital of the Silesia region and the largest city in the Silesian conurbation (pop. 3 mln.). Moreover, the cities of Bielsko-Biała (pop. 170 thou.) and Częstochowa (pop. 218 thou.), which are former regional capitals and now located in the Silesia region but at some distance from the Silesian conurbation, are two clear exceptions to this rule. Although these two cities lost their administrative status as regional capitals, the importance of their central functions has increased. Their demographic potential is sufficient to create their own development identity based on the industrial sector and the provision of services, both market (e.g., trade, tourism) and provided by the public sector (e.g., administration, health care, higher education) [
2]. They provide an attractive alternative to the Silesian conurbation (Częstochowa is the largest city in Poland that does not have the status of a regional capital).
The cities that share the status of being the capital of a region—Zielona Góra (pop. 141 thou.) and Gorzów Wielkopolski (pop. 123 thou.) in the Lubuskie region, as well as Bydgoszcz (pop. 345 thou.) and Toruń (pop. 199 thou.) in the Kujawsko-Pomorskie region—have a less dynamic evolutionary path than cities of a similar size that independently play the role of a regional capital.
On the basis of such results, public debate has often drawn the conclusion that cities that lost their status as regional capitals are justified in seeing themselves as “losers” due to the administrative reforms in comparison to the cities that retained their status as regional capitals. This often leads to inferring the existence of a cause–effect relationship, according to which losing the status of regional capital automatically leads to the central functions of a city becoming less important. These intuitive conclusions have been confirmed by a number of academic studies. However, generally, such studies were conducted on the basis of opinion polls.
In the authors’ opinion, these results, in themselves, do not confirm the hypothesis that administrative reform influences the evolutionary path of a city’s development and that the loss of status directly inhibits such development. Closer inspection of the component elements in the general measure of centrality enables us to look at these changes from a wider perspective. In order to make a more accurate assessment of the nature of this phenomenon, the authors have analyzed the changes in the importance of central functions in the largest Polish cities. This analysis split the central functions of a city into public services and those provided by the market.
On the basis of this analysis, it was found that in 1998, immediately before the administrative reforms, the current regional capitals already exhibited a greater power of attraction than those cities that lost their status as regional capitals. This was mostly exhibited in a higher level of centrality in the field of services provided by the market. The importance of public services was at a similar level in both sets of cities. Hence, the greater attractive power of the current regional capitals is not simply the result of their administrative status. At the time of the administrative reforms, they already occupied a higher position in the hierarchy of cities. Hence, one may conclude that the administrative reforms of 1999 simply reflected the differing evolutionary paths of the cities that retained the status of regional capital and of those that lost this status. This is in line with the theory of the evolutionary paths of urban centers within a network of settlements [
3,
13,
18].
Over the period from 1998 to 2019, the importance of public services (public administration and national defense, obligatory social services, education, health and social care) as an employer did not change significantly in the former regional capitals, while the importance of such services increased significantly in the current capitals. Hence, despite their loss of status, the importance of public services as an employer in former regional capitals did not decrease—as might be expected. On the other hand, the importance of the former regional capitals in providing employment within the market sector fell throughout the study period. On the other hand, while a fall in the importance of the market sector (e.g., trade, financial services) as an employer was initially observed in the current regional capitals, the importance of this sector has returned to a similar level to that in 1998. Hence, one might conclude that, in the field of providing market services, the former regional capitals no longer stand out from other towns and cities in the near vicinity. Hence, it is debatable whether the former regional capitals have become less attractive due to the administrative reforms. The current processes of socio-economic polarization, which concentrate economic growth in the largest urban settlements, can also be used to explain these evolutionary paths. This trend of metropolitanization is occurring, for the most part, independently of administrative reforms and not due to them. Hence, ascribing the degradation of Polish cities simply to administrative reform is unjustified.
It should be noted that the Polish administrative reforms were made in conjunction with the socio-economic transformation from a centrally planned economy to a neo-liberal one. Poland’s accession to the EU in 2004 accelerated the modernization processes and inflow of foreign capital. This was accompanied by a corresponding migration of highly educated young adults. This reinforced the polarizing trends in structural and spatial development. The service industries grew in importance, and this growth was concentrated in the largest cities. The gap between the largest cities and medium-sized cities increased, and as a result the former regional capitals (which tended to be smaller) naturally became more peripheral [
44,
45]. Researchers have also pointed out the importance of other factors that may have played a role in determining the path of development of Polish cities, such as an aging population [
46], spatial differences in affluence [
47], environmental problems [
48], and the use of international connections by city administrations [
49]. Our research indicates that the evolution of market services has played a crucial role in determining the evolution of a city’s global centrality measure. This supports the hypothesis that the process of metropolitanization has been more important in affecting the hierarchy of cities than administrative reforms. These results are in line with the conclusions made in earlier studies by Kurniewicz and Swianiewicz [
50], Becker [
33], and Heider, Rosenfeld, and Kauffmann [
25]. These arguments concur with the theory of the evolutionary formation of an urban network, as described by a new economic geography model of central places [
13]. This theory argues that economic integration promotes the growth of large cities, which attract an increasing number of firms and workers, at the expense of smaller cities.
6. Conclusions
The authors have attempted to address the research gap regarding the range of the effects of administrative reforms on the central functions of cities by analyzing economic data on employment. Due to the specific circumstances under which these administrative reforms were carried out, it is not possible to simply generalize these results to an international level. However, more broadly, the results of our research contribute many key insights to the global discussion of the effects of administrative reforms at the subnational level. The context in which reforms are made and a country’s level of economic development may have a significant influence on the effect of reforms on the evolution of the hierarchy of cities. This article has considered one specific context (Polish accession to the EU), and the question of how administrative reforms affect the evolution of the hierarchy of cities in other contexts is open to question. One possible direction for future research is to attempt to replicate these results in a variety of contexts.
Hence, this study has strengthened the evidence that the evolutionary path of the central functions of a city is complex and dependent on a large number of factors. Thus, the effect of administrative reforms on the hierarchy of cities is more difficult to predict than our intuition would suggest. Ascribing a causal role in the advance or degradation of a city to reform may well be an illusion, and the underlying reasons behind these development trends might lie in another set of processes. This aspect of the studied phenomenon might have very important practical implications—basing public administration policy on imperfect, although generally held, beliefs may well lead to suboptimal decision making. Hence, our study could be understood as part of the stream of research on data-driven Decision Support Systems (DSSs) [
51].
The findings of this analysis provide valuable insights for policymakers, urban planners, and researchers striving to understand and manage the dynamic processes of urban transformation. The conducted study revealed that administrative reforms in Poland, particularly those implemented in 1999, significantly impacted the central functions of cities, both for those that lost their status as regional capitals and those that retained it. The analysis demonstrated that cities that lost their status experienced a decline in centrality, particularly in market sectors, which may suggest a deterioration in their role as local economic centers. However, some of these cities, through appropriate development strategies, managed to mitigate the negative effects and identify alternative growth paths. On the other hand, cities that retained their status showed an increase in centrality, highlighting the importance of maintaining administrative status for preserving and enhancing central functions. These results underscore the complexity of urban processes, indicating that administrative reforms can act as catalysts for change, but their effects are strongly dependent on local conditions and management strategies. Therefore, policymakers should consider these factors when planning future reforms and urban development to support sustainable growth and adaptation to changing socio-economic conditions.


 ,
, 
