
Building a Sustainable Future: Enhancing Construction Safety through Macro-Level Analysis


Abstract
1. Introduction
2. Materials and Methods
2.1. Analysis of Factors Influencing Accident Rate
2.2. Model Construction
2.2.1. System Objectives
2.2.2. System Boundaries
2.2.3. Model Assumptions
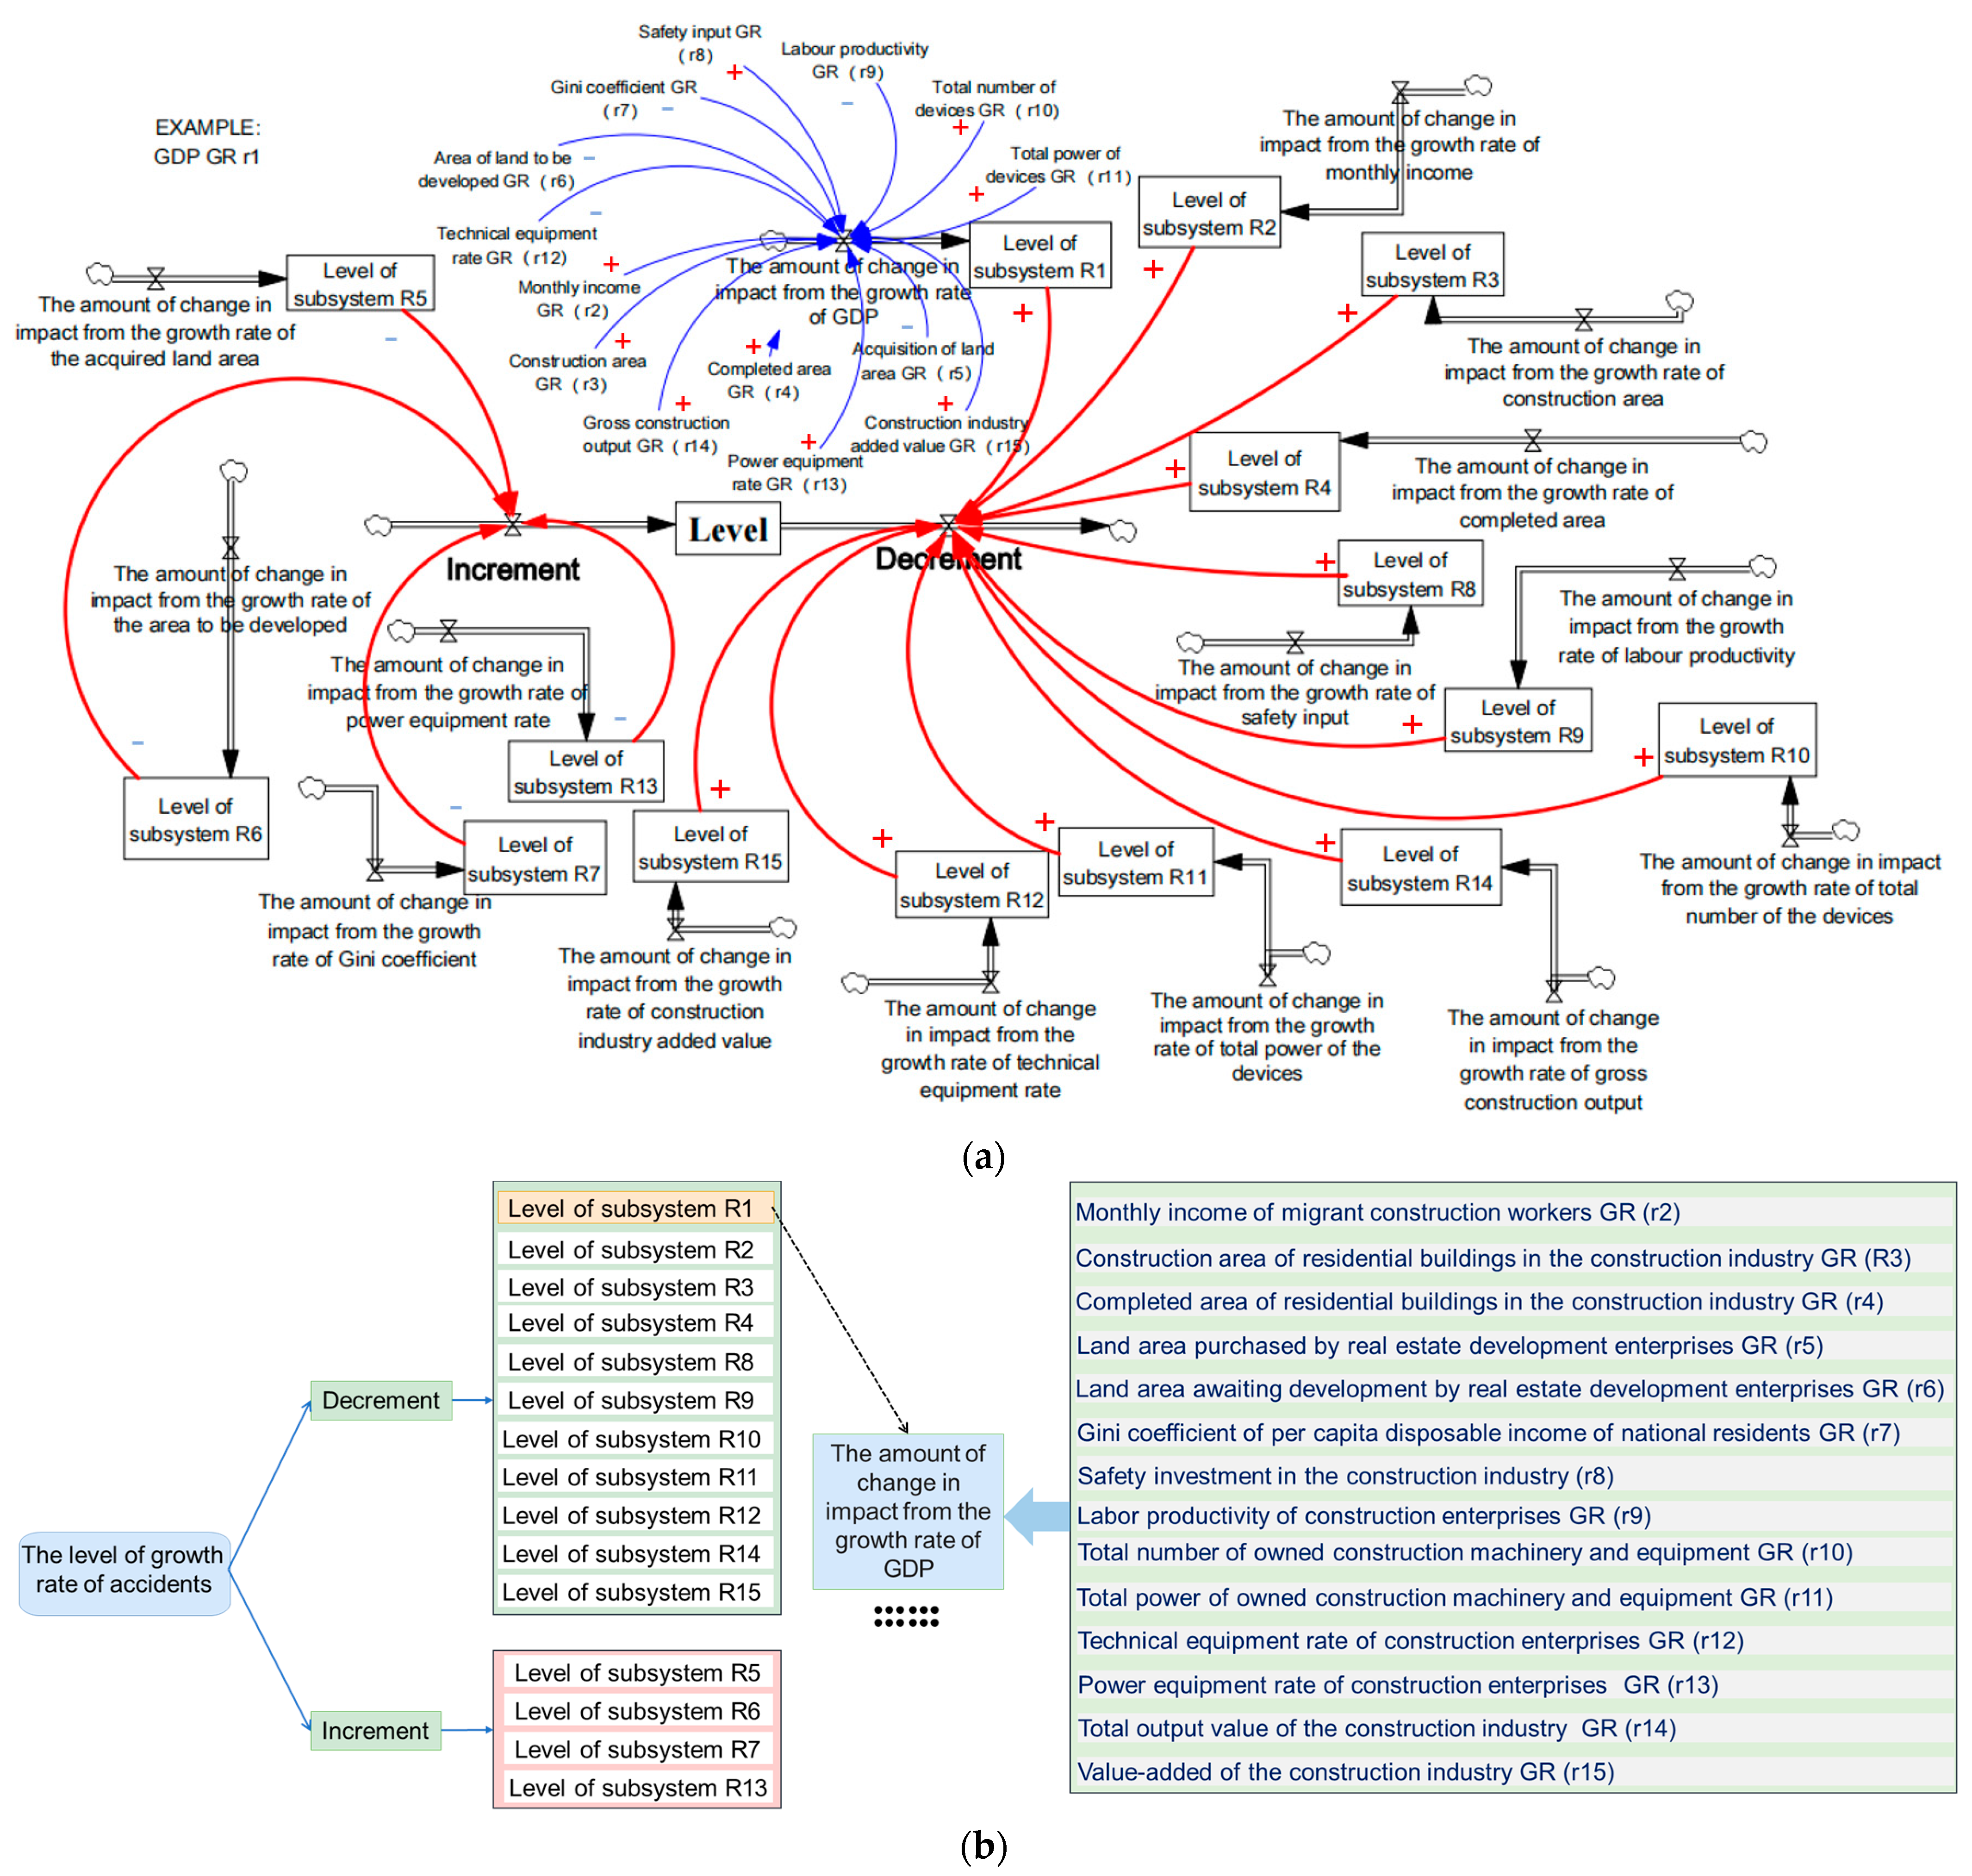
2.3. Causal Relationships and Stock-Flow Diagrams
3. System Dynamics Model Simulation
3.1. Calculation of Indicator Weights
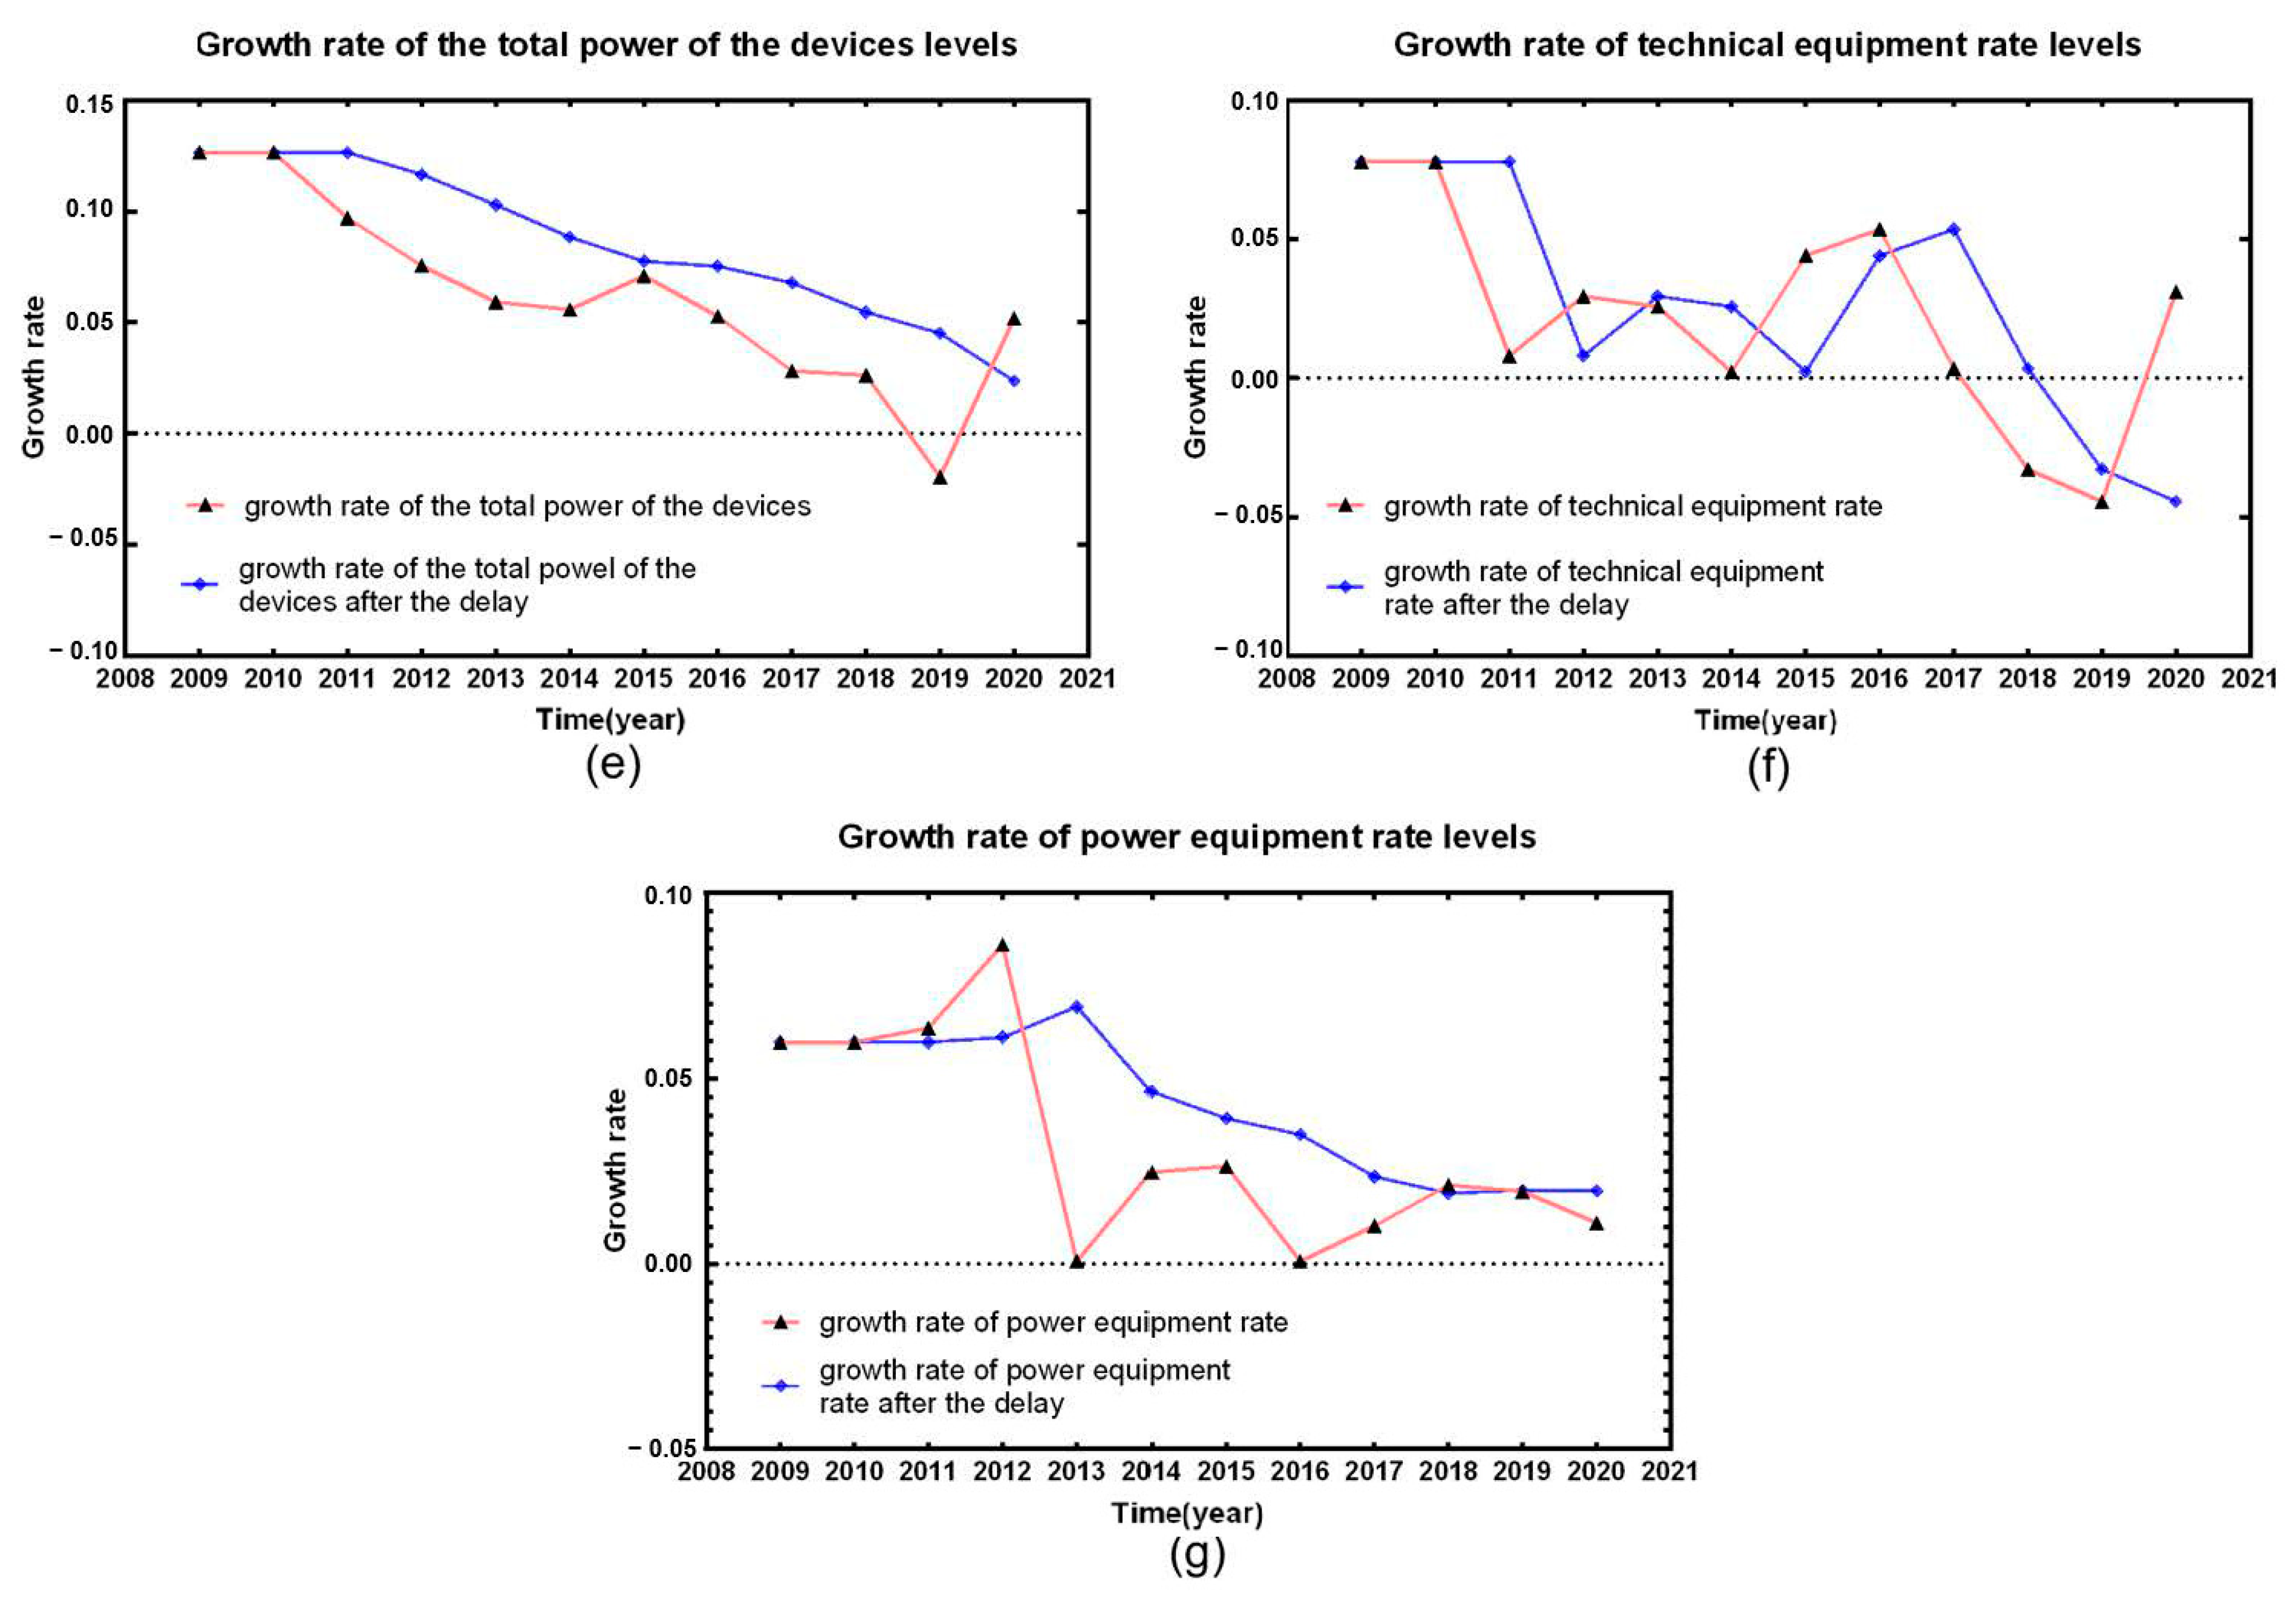
3.2. Time-Lag Correlation Analysis
3.3. Formatting of Mathematical Components
4. Discussion
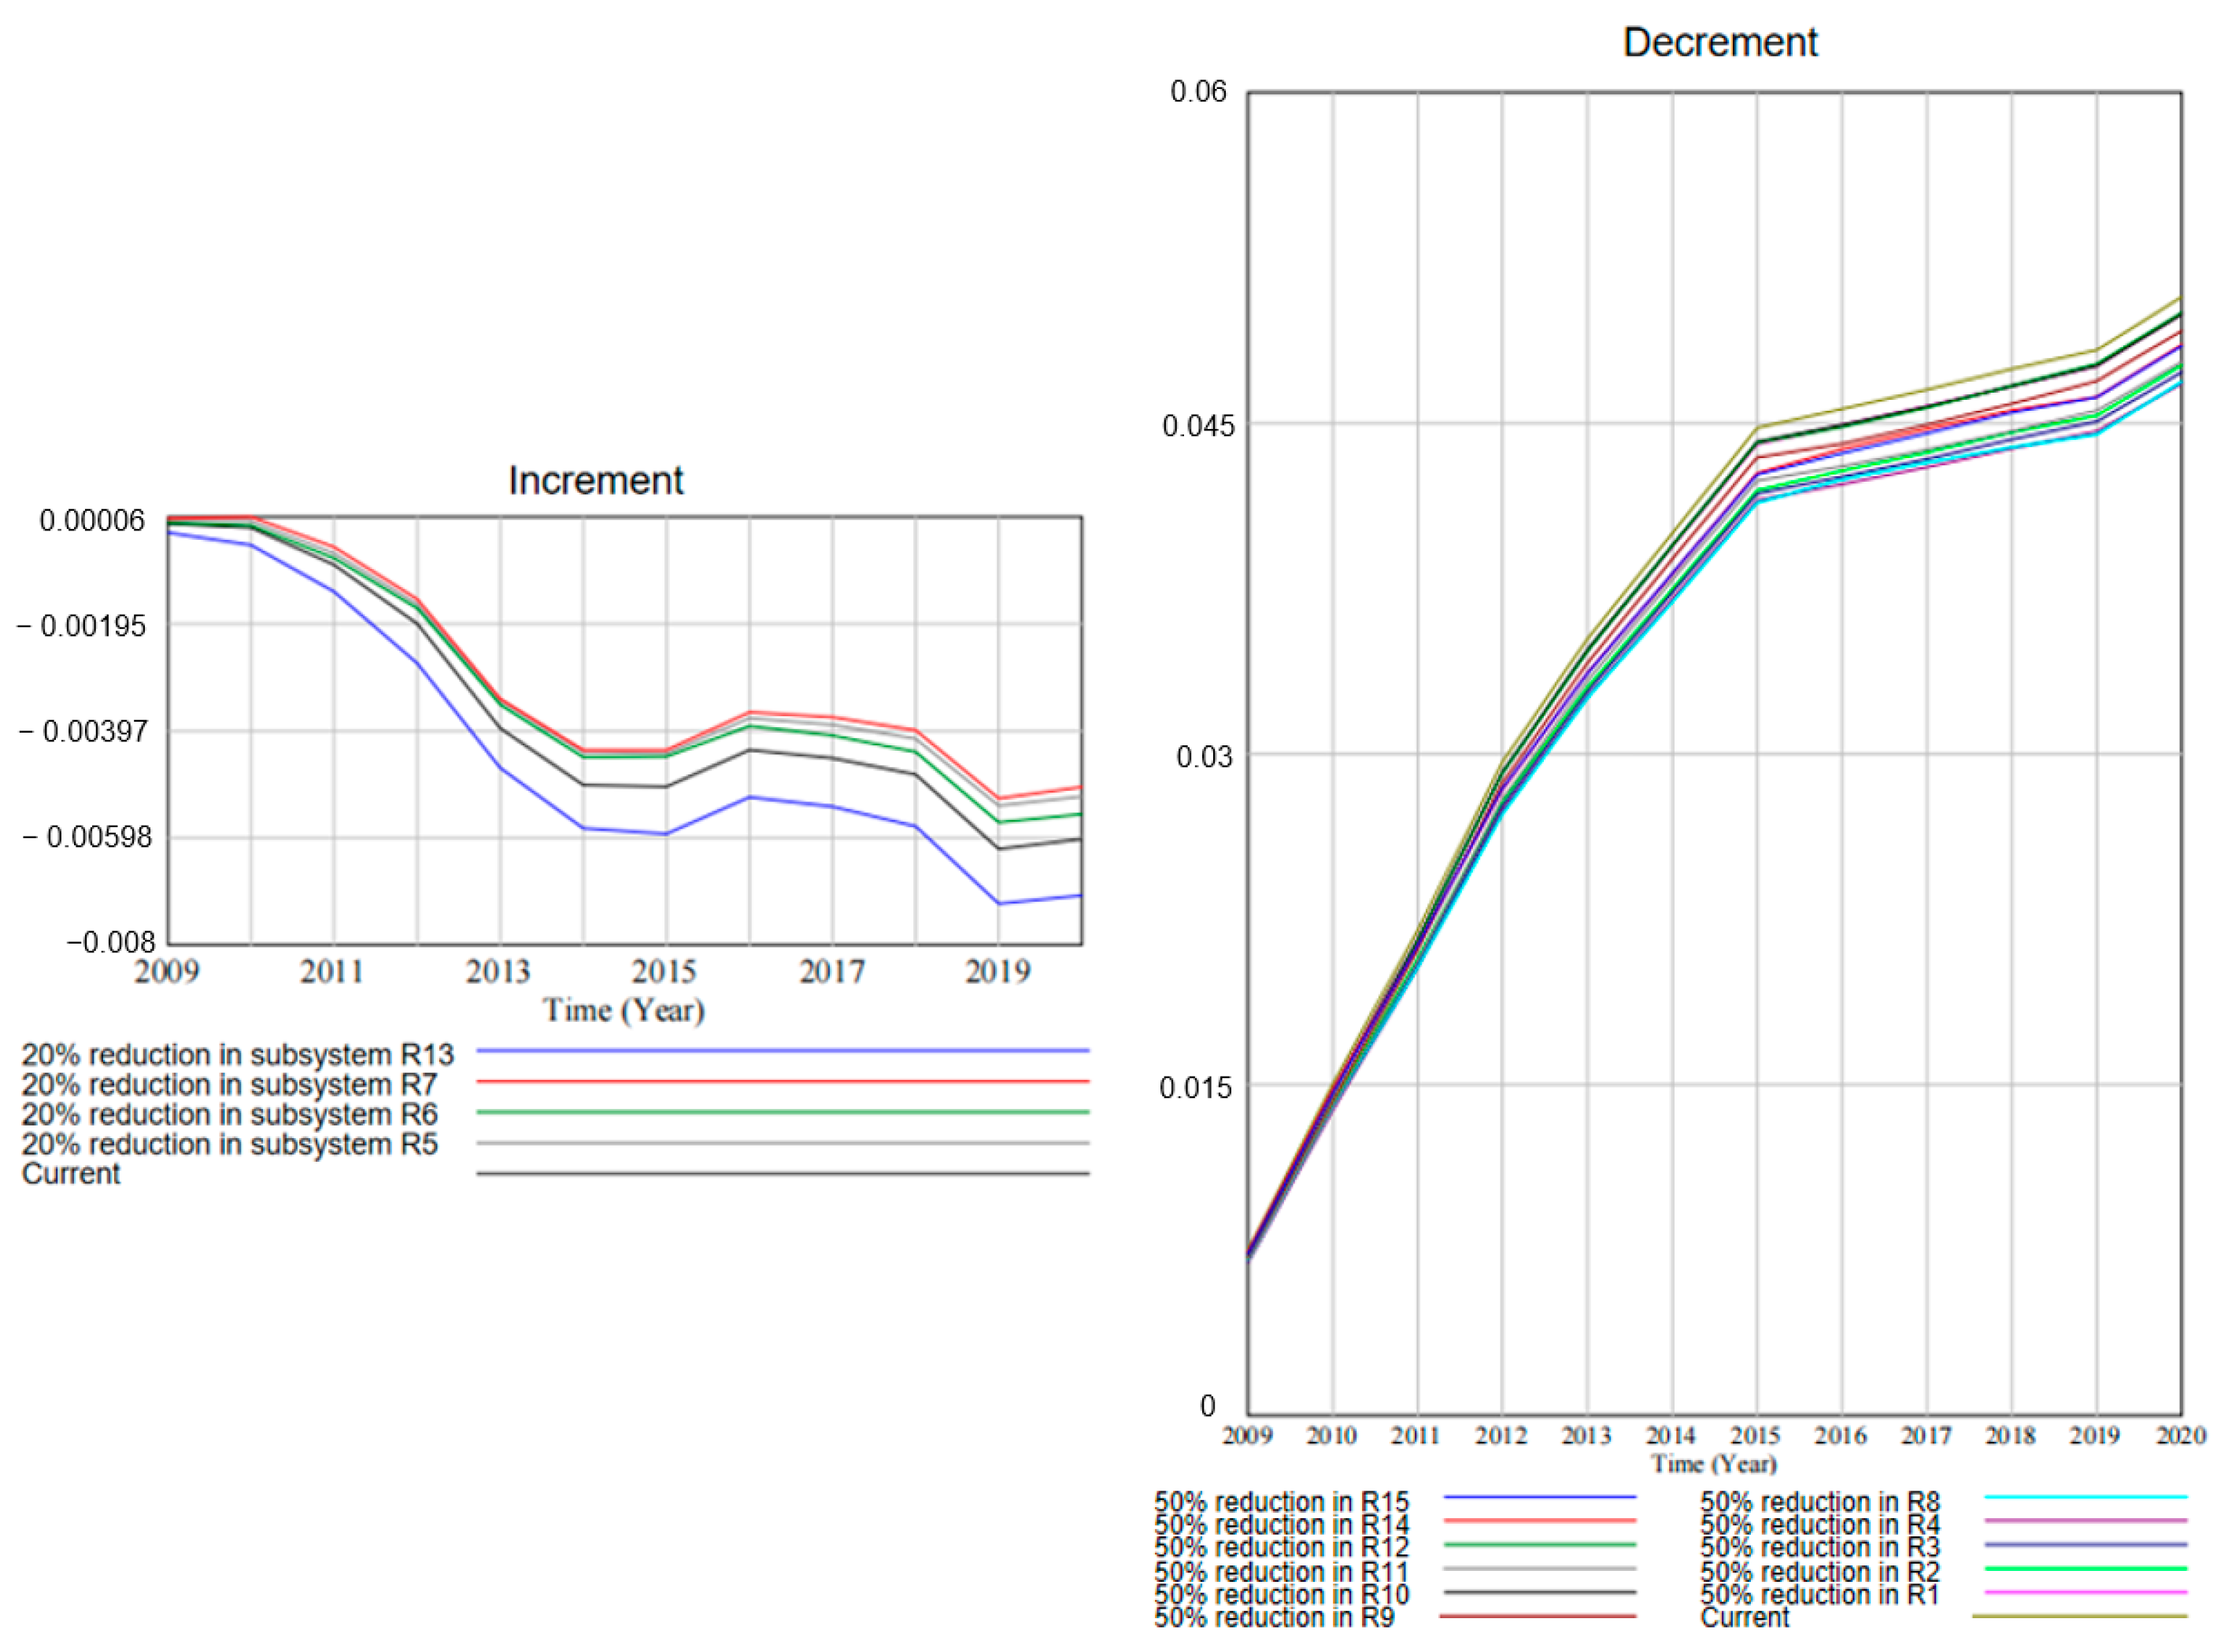
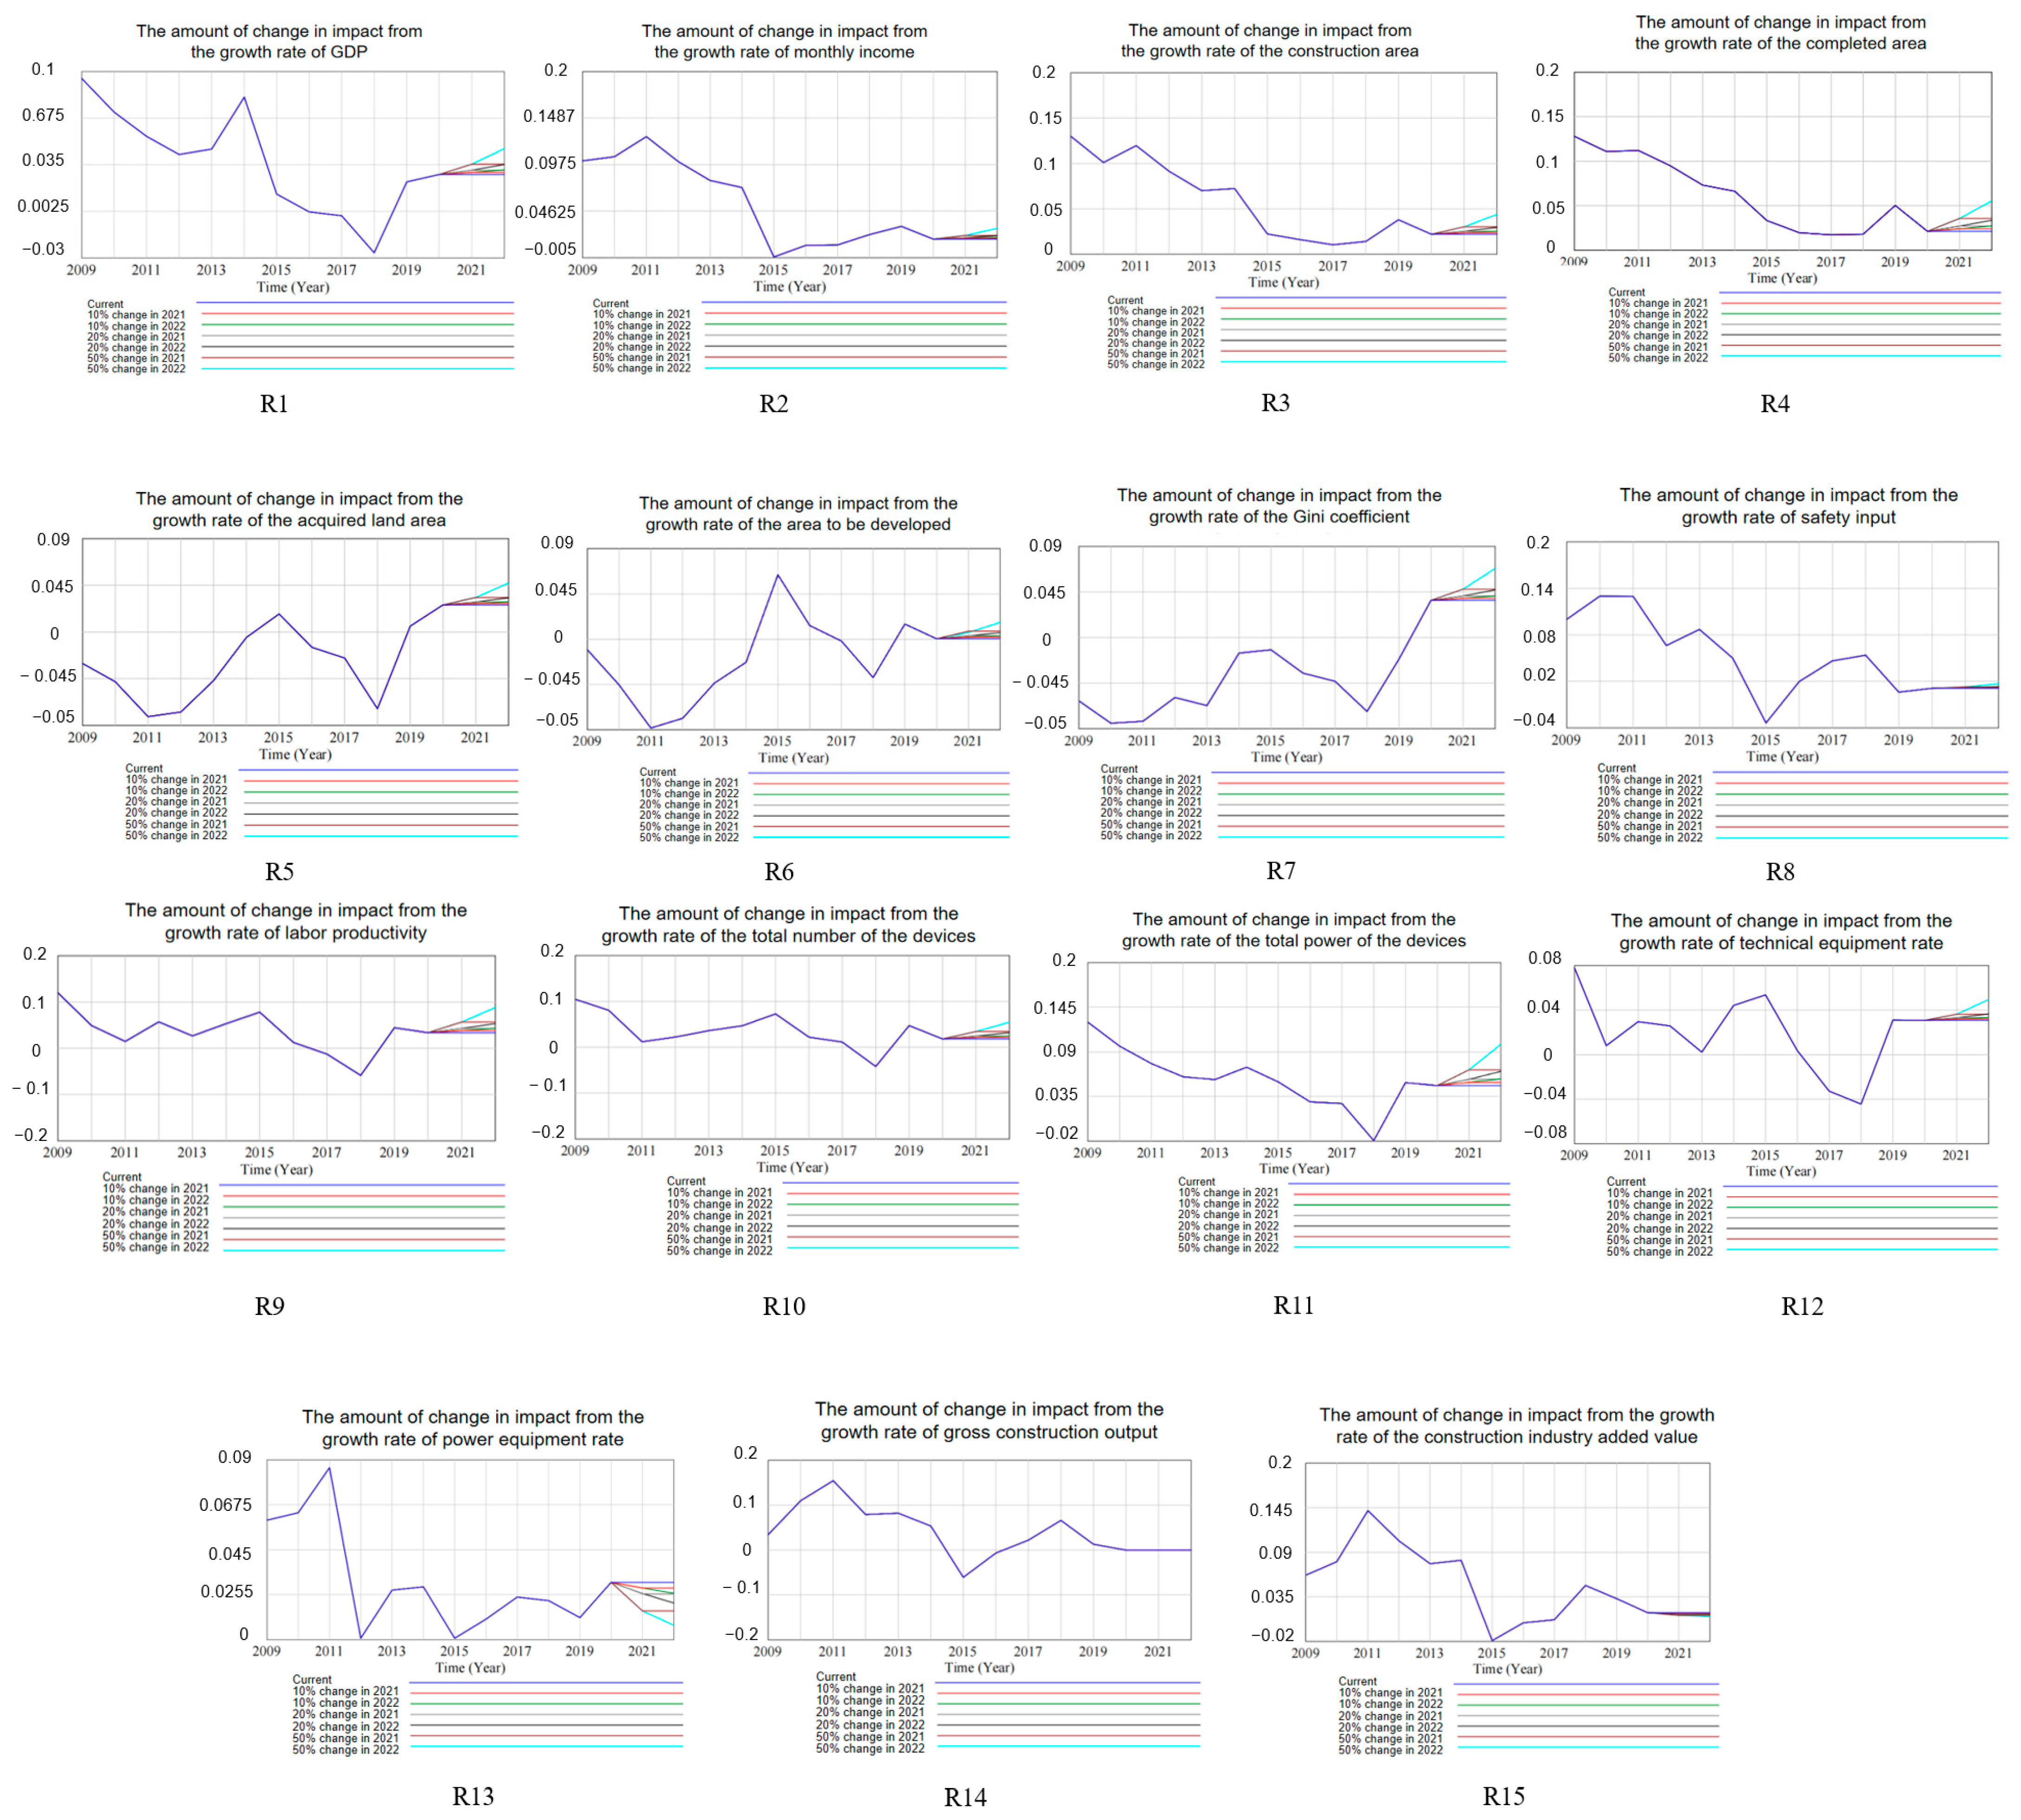
4.1. Single Subsystem Simulation
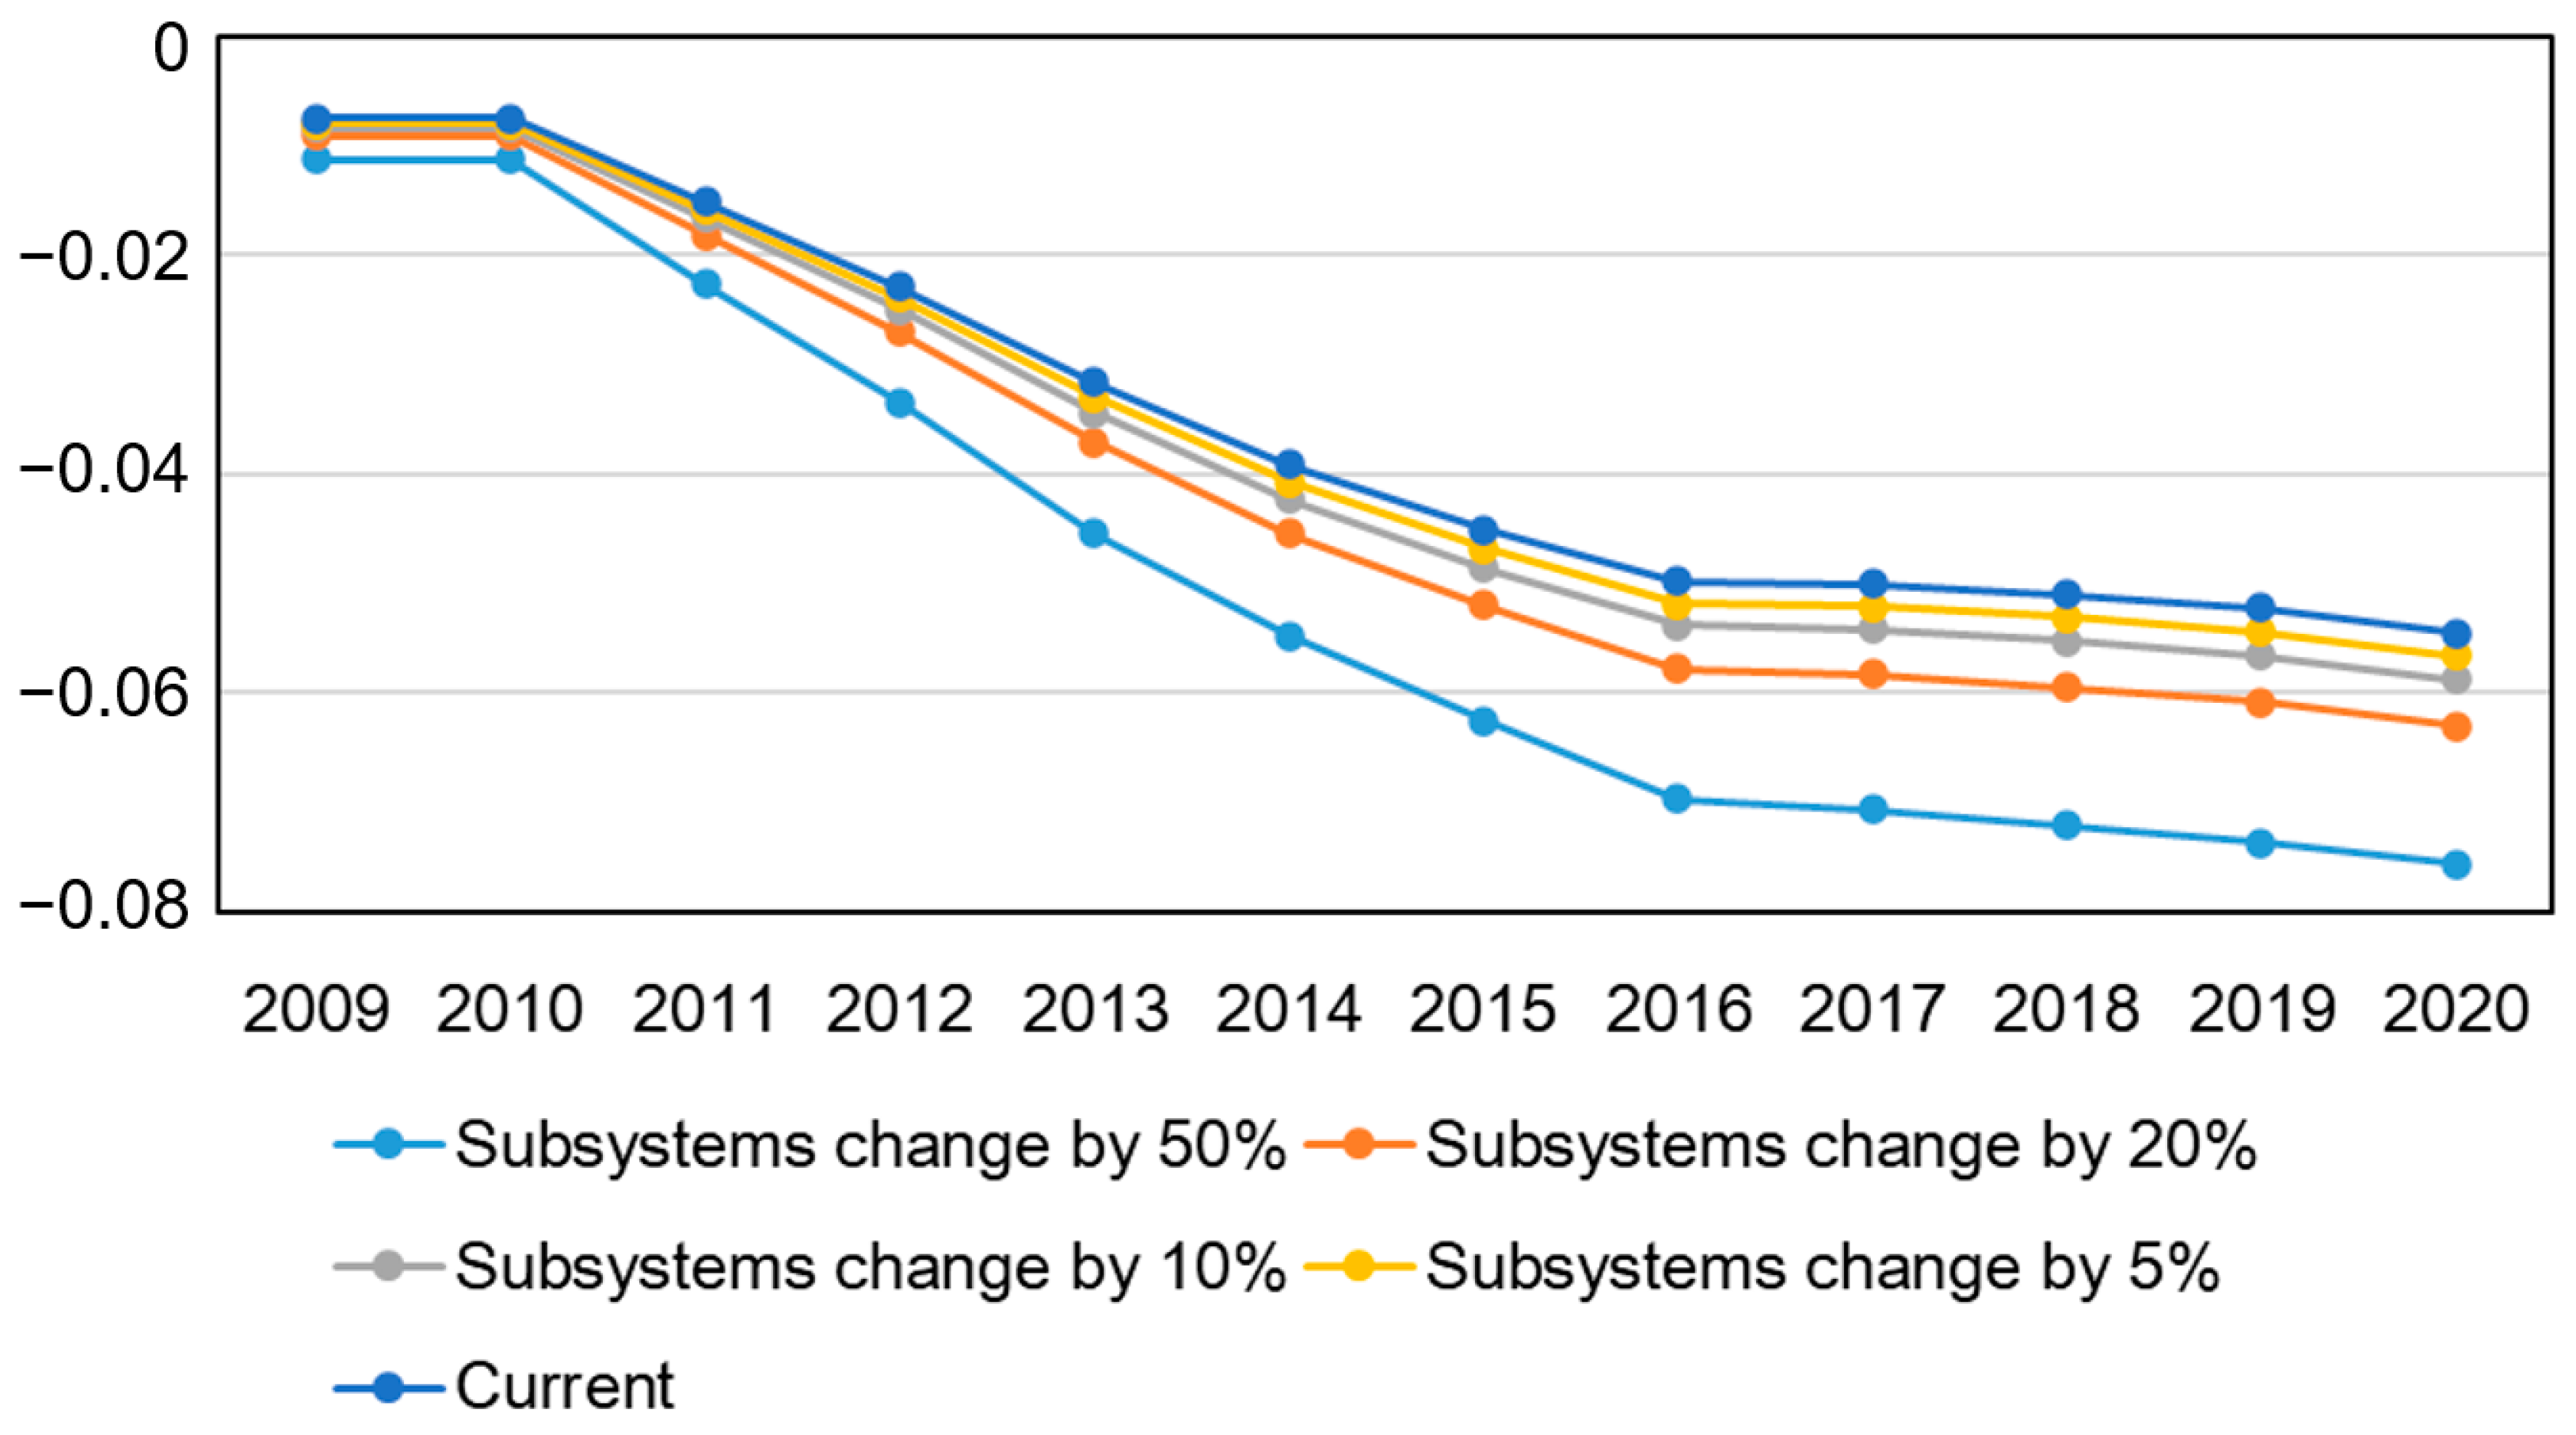
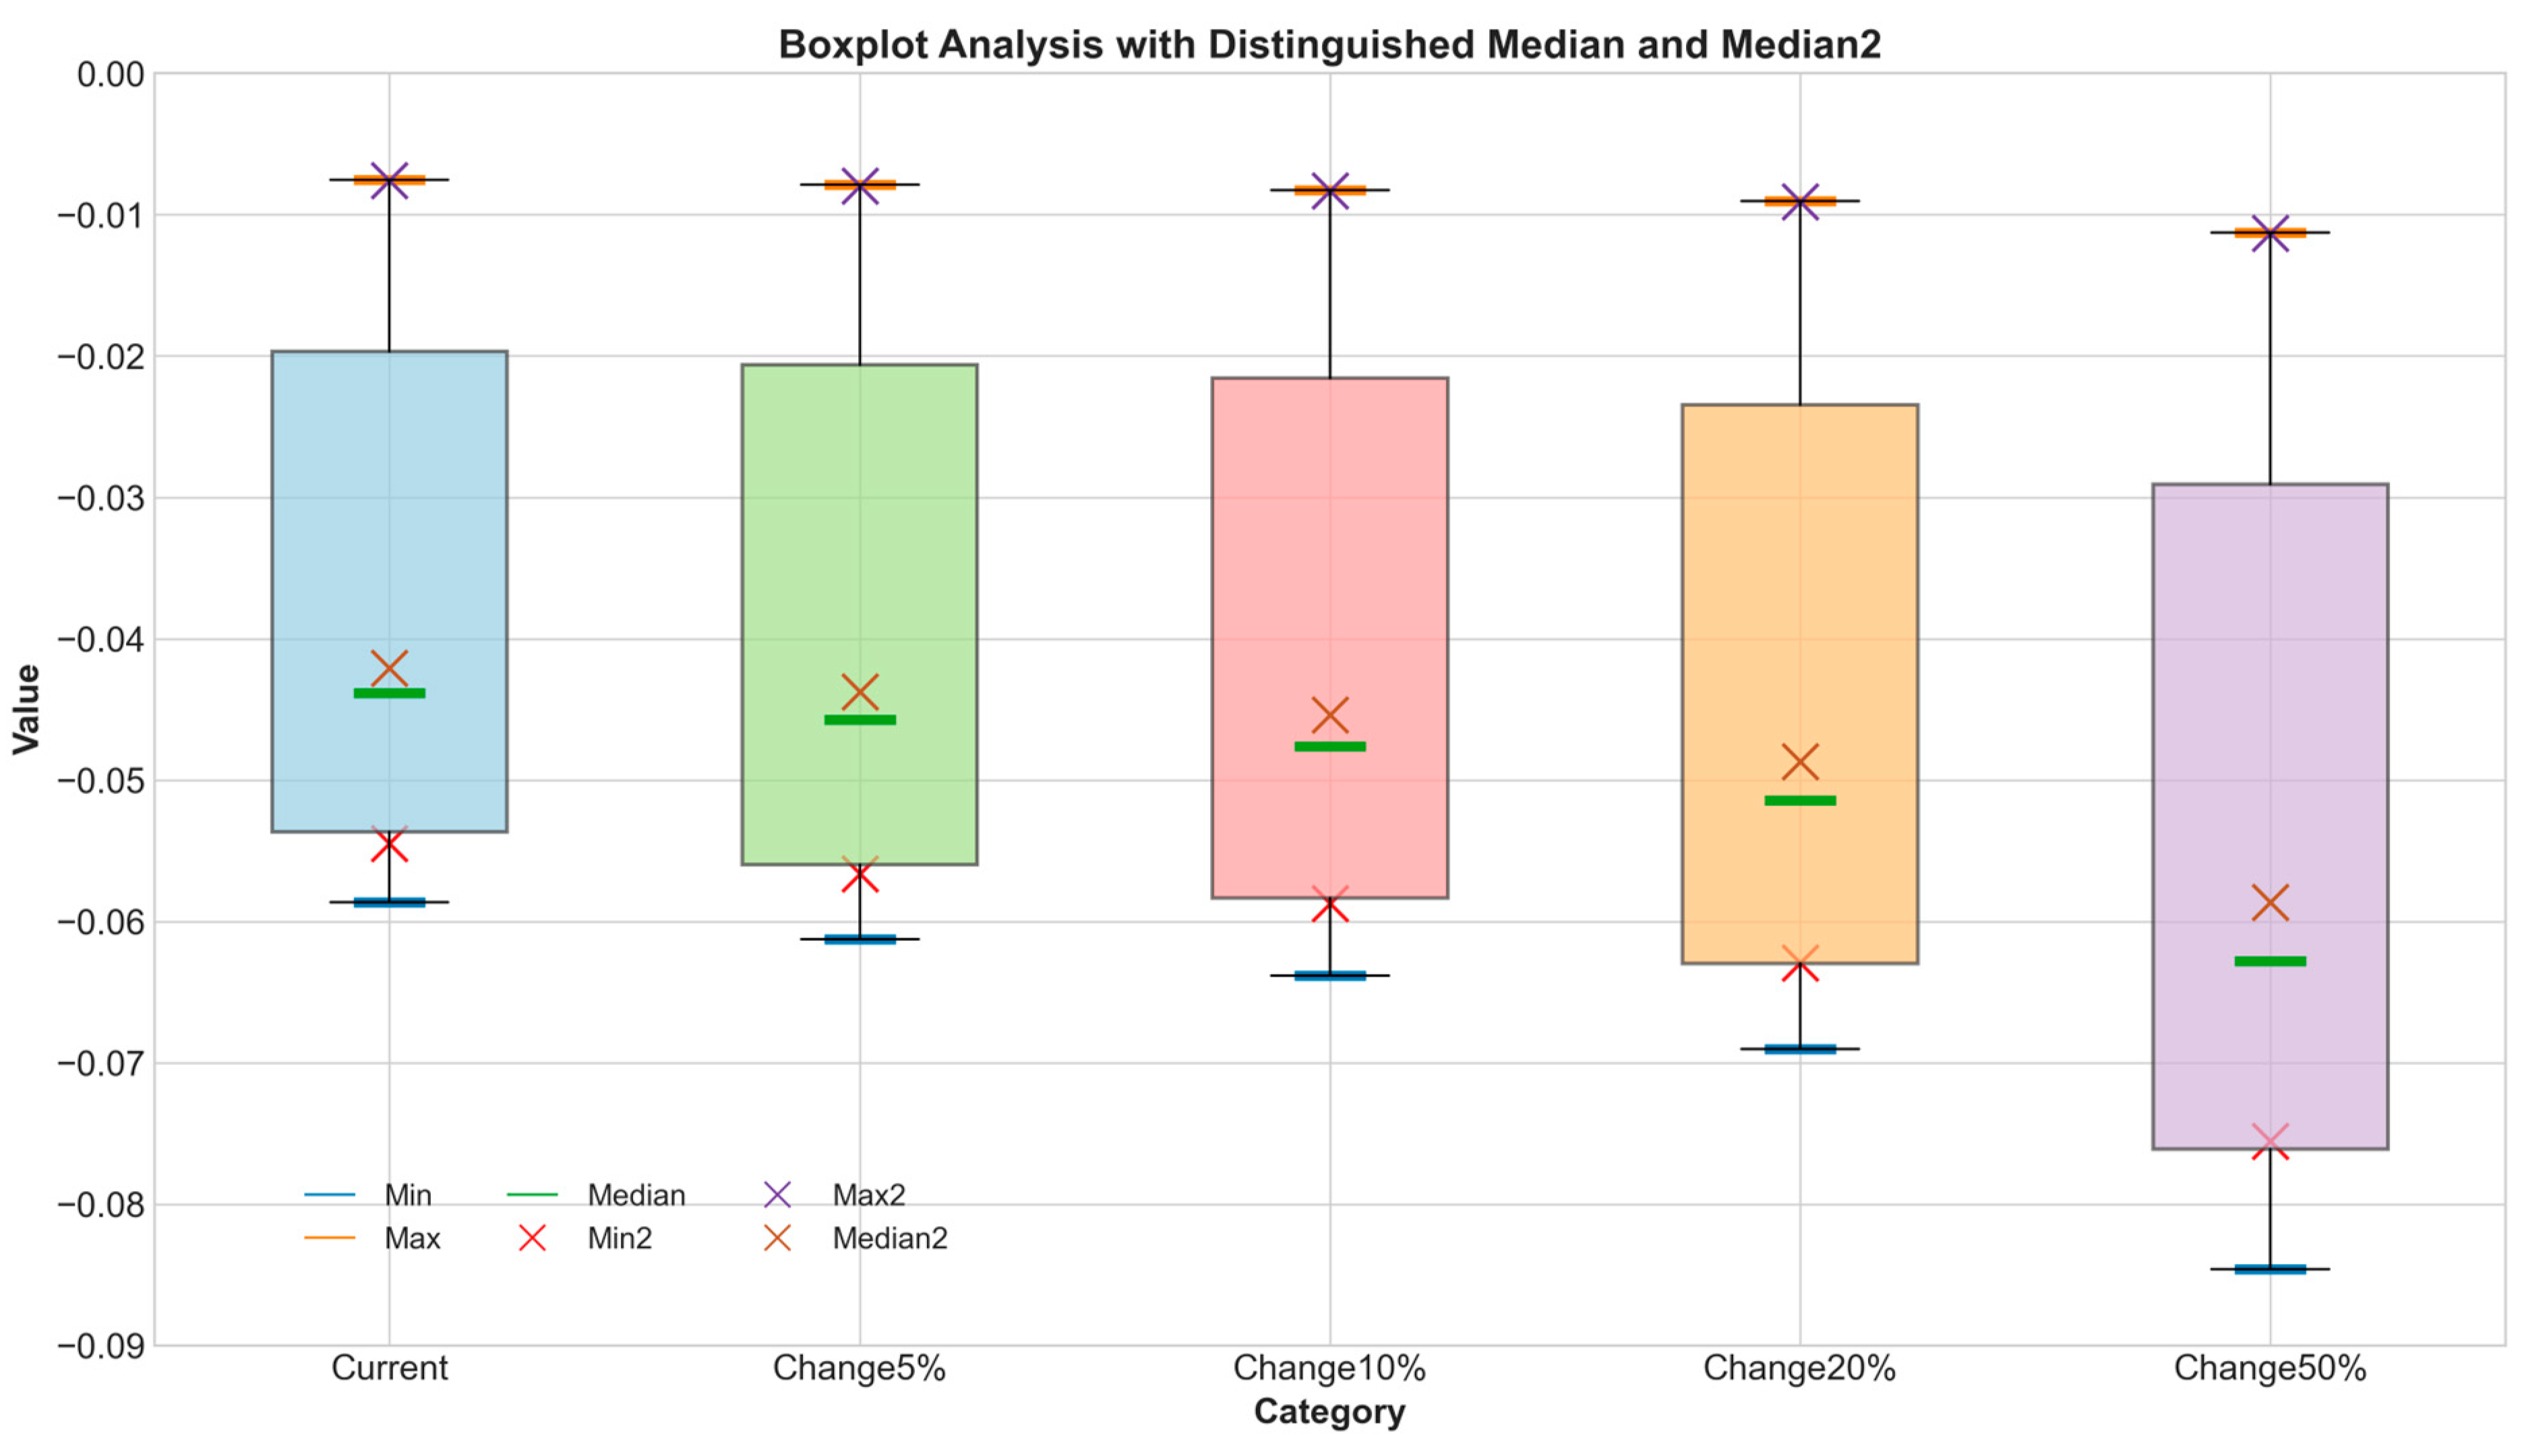
4.2. Full System Level Simulation
4.3. Policy Recommendations
5. Conclusions
- (1)
- Macro factors significantly influence the accident growth rate. Factors such as the power equipment rate (R13), completed area (R4), and safety investment (R8) notably affect the growth rate of construction accidents. In particular, increasing the power equipment rate and safety investment can significantly reduce the frequency of accidents. This not only enhances immediate operational safety, but also contributes to the long-term sustainability of construction practices by ensuring that modern, efficient, and safer methods are adopted.
- (2)
- Introducing delay functions validated the lag effect of different macro factors on the accident growth rate. This indicates that the impact of some factors is not immediate, but gradually unfolds over time. For example, although the improvement in the power equipment rate might not show significant effects in the short term, it has a notable impact on reducing accidents in the long term. Such delayed effects underscore the importance of planning for sustainability in safety practices, where long-term benefits are realized through consistent and sustained efforts.
- (3)
- The simulation results demonstrate that the system dynamics model can accurately reflect the actual growth trends of construction accidents. Adjusting the increases and decreases in subsystem levels can effectively control the growth rate of accidents. The model validation shows high reliability in predicting accident occurrence rates.
- (4)
- This study found that slight adjustments in subsystem indicators can have significant cumulative effects over the long term. Even small changes can notably impact the control of the accident growth rate. This provides policymakers with a theoretical basis for gradually improving safety management measures. Such incremental adjustments align with sustainable development principles, where ongoing minor improvements can lead to substantial enhancements in safety and efficiency.
Author Contributions
Funding
Institutional Review Board Statement
Informed Consent Statement
Data Availability Statement
Conflicts of Interest
References
- Chuai, X.; Lu, Q.; Huang, X.; Gao, R.; Zhao, R. China’s Construction Industry-Linked Economy-Resources-Environment Flow in International Trade. J. Clean. Prod. 2021, 278, 123990. [Google Scholar] [CrossRef]
- Alaloul, W.S.; Musarat, M.A.; Rabbani, M.B.A.; Iqbal, Q.; Maqsoom, A.; Farooq, W. Construction Sector Contribution to Economic Stability: Malaysian GDP Distribution. Sustainability 2021, 13, 5012. [Google Scholar] [CrossRef]
- Nnaji, C.; Karakhan, A.A. Technologies for Safety and Health Management in Construction: Current Use, Implementation Benefits and Limitations, and Adoption Barriers. J. Build. Eng. 2020, 29, 101212. [Google Scholar] [CrossRef]
- Yiu, N.S.N.; Chan, D.W.M.; Shan, M.; Sze, N.N. Implementation of Safety Management System in Managing Construction Projects: Benefits and Obstacles. Saf. Sci. 2019, 117, 23–32. [Google Scholar] [CrossRef]
- Grant, E.; Salmon, P.M.; Stevens, N.J.; Goode, N.; Read, G.J. Back to the Future: What Do Accident Causation Models Tell Us about Accident Prediction? Saf. Sci. 2018, 104, 99–109. [Google Scholar] [CrossRef]
- Sanni-Anibire, M.O.; Mahmoud, A.S.; Hassanain, M.A.; Salami, B.A. A Risk Assessment Approach for Enhancing Construction Safety Performance. Saf. Sci. 2020, 121, 15–29. [Google Scholar] [CrossRef]
- Manzoor, B.; Othman, I.; Manzoor, M. Evaluating the Critical Safety Factors Causing Accidents in High-Rise Building Projects. Ain Shams Eng. J. 2021, 12, 2485–2492. [Google Scholar] [CrossRef]
- Yılmaz, F. Analysis of the Interaction between Safety Measures and Workers’ Safety Awareness from the Construction Workers’ Perspective. Eng. Constr. Archit. Manag. 2021, 30, 41–55. [Google Scholar] [CrossRef]
- Pljakić, M.; Jovanović, D.; Matović, B.; Mićić, S. Macro-Level Accident Modeling in Novi Sad: A Spatial Regression Approach. Accid. Anal. Prev. 2019, 132, 105259. [Google Scholar] [CrossRef] [PubMed]
- Elvik, R. Risk Factors as Causes of Accidents: Criterion of Causality, Logical Structure of Relationship to Accidents and Completeness of Explanations. Accid. Anal. Prev. 2024, 197, 107469. [Google Scholar] [CrossRef] [PubMed]
- Wu, C.; Huang, L. A New Accident Causation Model Based on Information Flow and Its Application in Tianjin Port Fire and Explosion Accident. Reliab. Eng. Syst. Saf. 2019, 182, 73–85. [Google Scholar] [CrossRef]
- Cai, Q.; Abdel-Aty, M.; Lee, J.; Huang, H. Integrating Macro- and Micro-Level Safety Analyses: A Bayesian Approach Incorporating Spatial Interaction. Transp. A Transp. Sci. 2019, 15, 285–306. [Google Scholar] [CrossRef]
- Wang, D.; Liu, Q.; Ma, L.; Zhang, Y.; Cong, H. Road Traffic Accident Severity Analysis: A Census-Based Study in China. J. Saf. Res. 2019, 70, 135–147. [Google Scholar] [CrossRef]
- Lee, J.; Abdel-Aty, M. Macro-Level Analysis of Bicycle Safety: Focusing on the Characteristics of Both Crash Location and Residence. Int. J. Sustain. Transp. 2018, 12, 553–560. [Google Scholar] [CrossRef]
- Stickley, A.; Baburin, A.; Jasilionis, D.; Krumins, J.; Martikainen, P.; Kondo, N.; Leinsalu, M. Macroeconomic Changes and Educational Inequalities in Traffic Fatalities in the Baltic Countries and Finland in 2000–2015: A Register-Based Study. Sci. Rep. 2021, 11, 2397. [Google Scholar] [CrossRef] [PubMed]
- Li, X.; Liu, J.; Zhou, J.; Liu, X.; Zhou, L.; Wei, W. The Effects of Macroeconomic Factors on Road Traffic Safety: A Study Based on the ARDL-ECM Model. Sustainability 2020, 12, 10262. [Google Scholar] [CrossRef]
- Nikolaou, P.; Dimitriou, L. Evaluation of Road Safety Policies Performance across Europe: Results from Benchmark Analysis for a Decade. Transp. Res. Part A Policy Pract. 2018, 116, 232–246. [Google Scholar] [CrossRef]
- Zhou, C.; Shi, C.; Wang, S.; Zhang, G. Estimation of Eco-Efficiency and Its Influencing Factors in Guangdong Province Based on Super-SBM and Panel Regression Models. Ecol. Indic. 2018, 86, 67–80. [Google Scholar] [CrossRef]
- Liu, J.; Zou, Y.; Wang, W.; Zhang, L.; Liu, X.; Ding, Q.; Qin, Z.; Čepin, M. Analysis of Dependencies among Performance Shaping Factors in Human Reliability Analysis Based on a System Dynamics Approach. Reliab. Eng. Syst. Saf. 2021, 215, 107890. [Google Scholar] [CrossRef]
- Liu, Q.; Li, X.; Meng, X. Effectiveness Research on the Multi-Player Evolutionary Game of Coal-Mine Safety Regulation in China Based on System Dynamics. Saf. Sci. 2019, 111, 224–233. [Google Scholar] [CrossRef]
- Zhang, G.; Shen, X.; Hua, J.; Zhao, J.; Liu, H. System Dynamics Modelling for Dynamic Emergency Response to Accidents Involving Transport of Dangerous Goods by Road. J. Adv. Transp. 2021, 2021, 2474784. [Google Scholar] [CrossRef]
- Park, Y.; Park, D.J. System Dynamics Approach for Assessing the Performance of Safety Management Systems in Petrochemical Plants. J. Loss Prev. Process Ind. 2024, 90, 105324. [Google Scholar] [CrossRef]
- Mohammadi, A.; Tavakolan, M.; Khosravi, Y. Factors Influencing Safety Performance on Construction Projects: A Review. Saf. Sci. 2018, 109, 382–397. [Google Scholar] [CrossRef]
- Hasan, A.; Baroudi, B.; Elmualim, A.; Rameezdeen, R. Factors Affecting Construction Productivity: A 30 Year Systematic Review. Eng. Constr. Archit. Manag. 2018, 25, 916–937. [Google Scholar] [CrossRef]
- Ghoddousi, P.; Poorafshar, O.; Chileshe, N.; Hosseini, M.R. Labour Productivity in Iranian Construction Projects: Perceptions of Chief Executive Officers. Int. J. Product. Perform. Manag. 2015, 64, 811–830. [Google Scholar] [CrossRef]
- Kharazishvili, Y.; Kwilinski, A.; Grishnova, O.; Dzwigol, H. Social Safety of Society for Developing Countries to Meet Sustainable Development Standards: Indicators, Level, Strategic Benchmarks (with Calculations Based on the Case Study of Ukraine). Sustainability 2020, 12, 8953. [Google Scholar] [CrossRef]
- Łyszczarz, B.; Nojszewska, E. Economic Situation and Occupational Accidents in Poland: 2002-2014 Panel Data Regional Study. Int. J. Occup. Med. Env. Health 2018, 31, 151–164. [Google Scholar] [CrossRef]
- Liang, K.; Fung, I.W.H. The Impact of Macroeconomic and Industrial Fluctuation on Fatalities of Construction Workers in China. J. Saf. Res. 2019, 70, 149–158. [Google Scholar] [CrossRef]
- Khadim, N.; Agliata, R.; Marino, A.; Thaheem, M.J.; Mollo, L. Critical Review of Nano and Micro-Level Building Circularity Indicators and Frameworks. J. Clean. Prod. 2022, 357, 131859. [Google Scholar] [CrossRef]
- Kaklauskas, A.; Kelpsiene, L.; Zavadskas, E.K.; Bardauskiene, D.; Kaklauskas, G.; Urbonas, M.; Sorakas, V. Crisis Management in Construction and Real Estate: Conceptual Modeling at the Micro-, Meso- and Macro-Levels. Land Use Policy 2011, 28, 280–293. [Google Scholar] [CrossRef]
- Assaad, R.; El-adaway, I.H. Impact of Dynamic Workforce and Workplace Variables on the Productivity of the Construction Industry: New Gross Construction Productivity Indicator. J. Manag. Eng. 2021, 37, 04020092. [Google Scholar] [CrossRef]
- Oswald, D.; Zhang, R.P.; Lingard, H.; Pirzadeh, P.; Le, T. The Use and Abuse of Safety Indicators in Construction. Eng. Constr. Archit. Manag. 2018, 25, 1188–1209. [Google Scholar] [CrossRef]
- Zhao, X.; Hwang, B.-G.; Pheng Low, S.; Wu, P. Reducing Hindrances to Enterprise Risk Management Implementation in Construction Firms. J. Constr. Eng. Manag. 2015, 141, 04014083. [Google Scholar] [CrossRef]
- Francis, A.; Thomas, A. A Framework for Dynamic Life Cycle Sustainability Assessment and Policy Analysis of Built Environment through a System Dynamics Approach. Sustain. Cities Soc. 2022, 76, 103521. [Google Scholar] [CrossRef]
- Li, G.; Kou, C.; Wang, Y.; Yang, H. System Dynamics Modelling for Improving Urban Resilience in Beijing, China. Resour. Conserv. Recycl. 2020, 161, 104954. [Google Scholar] [CrossRef]
- McAvoy, S.; Grant, T.; Smith, C.; Bontinck, P. Combining Life Cycle Assessment and System Dynamics to Improve Impact Assessment: A Systematic Review. J. Clean. Prod. 2021, 315, 128060. [Google Scholar] [CrossRef]
- Barroso, J.M.F.; Albuquerque-Oliveira, J.L.; Oliveira-Neto, F.M. Correlation Analysis of Day-to-Day Origin-Destination Flows and Traffic Volumes in Urban Networks. J. Transp. Geogr. 2020, 89, 102899. [Google Scholar] [CrossRef]
- Miśkiewicz, J. Analysis of Time Series Correlation. The Choice of Distance Metrics and Network Structure. Acta Phys. Pol. A 2012, 121, B-89–B-93. [Google Scholar] [CrossRef]
- Ausloos, M.; Eskandary, A.; Kaur, P.; Dhesi, G. Evidence for Gross Domestic Product Growth Time Delay Dependence over Foreign Direct Investment. A Time-Lag Dependent Correlation Study. Phys. A Stat. Mech. Its Appl. 2019, 527, 121181. [Google Scholar] [CrossRef]
- Osei-Asibey, D.; Ayarkwa, J.; Acheampong, A.; Adinyira, E.; Amoah, P. Impacts of Accidents and Hazards on the Ghanaian Construction Industry. Int. J. Constr. Manag. 2023, 23, 708–717. [Google Scholar] [CrossRef]
- Zhang, C.-K.; Long, F.; He, Y.; Yao, W.; Jiang, L.; Wu, M. A Relaxed Quadratic Function Negative-Determination Lemma and Its Application to Time-Delay Systems. Automatica 2020, 113, 108764. [Google Scholar] [CrossRef]
- Dushkov, I.N.; Jordanov, I.P.; Vitanov, N.K. Numerical Modeling of Dynamics of a Population System with Time Delay. Math. Methods Appl. Sci. 2018, 41, 8377–8384. [Google Scholar] [CrossRef]
- Glassbrenner, D.; Herbert, G.; Reish, L.; Webb, C.; Lindsey, T. Evaluating Disparities in Traffic Fatalities by Race, Ethnicity, and Income; National Highway Traffic Safety Administration: Washington, DC, USA, 2022. [Google Scholar]
- Mitsova, D.; Dumbaugh, E.; Saha, D. Crash Risk for Low-Income and Minority Populations: An Examination of At-Risk Population Segments and Underlying Risk Factors; Florida Atlantic University: Boca Raton, FL, USA, 2021. [Google Scholar]
- Anbarci, N.; Escaleras, M.; Register, C.A. Traffic Fatalities: Does Income Inequality Create an Externality? Can. J. Econ. /Rev. Can. D’économique 2009, 42, 244–266. [Google Scholar] [CrossRef]
- Mou, Z.; Jin, C.; Wang, H.; Chen, Y.; Li, M.; Chen, Y. Spatial Influence of Engineering Construction on Traffic Accidents, a Case Study of Jinan. Accid. Anal. Prev. 2022, 177, 106825. [Google Scholar] [CrossRef] [PubMed]
- Baek, H.; Jung, S.; Hong, J.; Hong, T. Simulation-Based Framework for Optimal Construction Equipment Allocation Considering Construction Noise Emissions. J. Asian Archit. Build. Eng. 2023, 22, 2959–2976. [Google Scholar] [CrossRef]
- Wang, Y.; Lee, H.W.; Tang, W.; Whittington, J.; Qiang, M. Structural Equation Modeling for the Determinants of International Infrastructure Investment: Evidence from Chinese Contractors. J. Manag. Eng. 2021, 37, 04021033. [Google Scholar] [CrossRef]
- Sutrisna, M.; Goulding, J. Managing Information Flow and Design Processes to Reduce Design Risks in Offsite Construction Projects. Eng. Constr. Archit. Manag. 2019, 26, 267–284. [Google Scholar] [CrossRef]


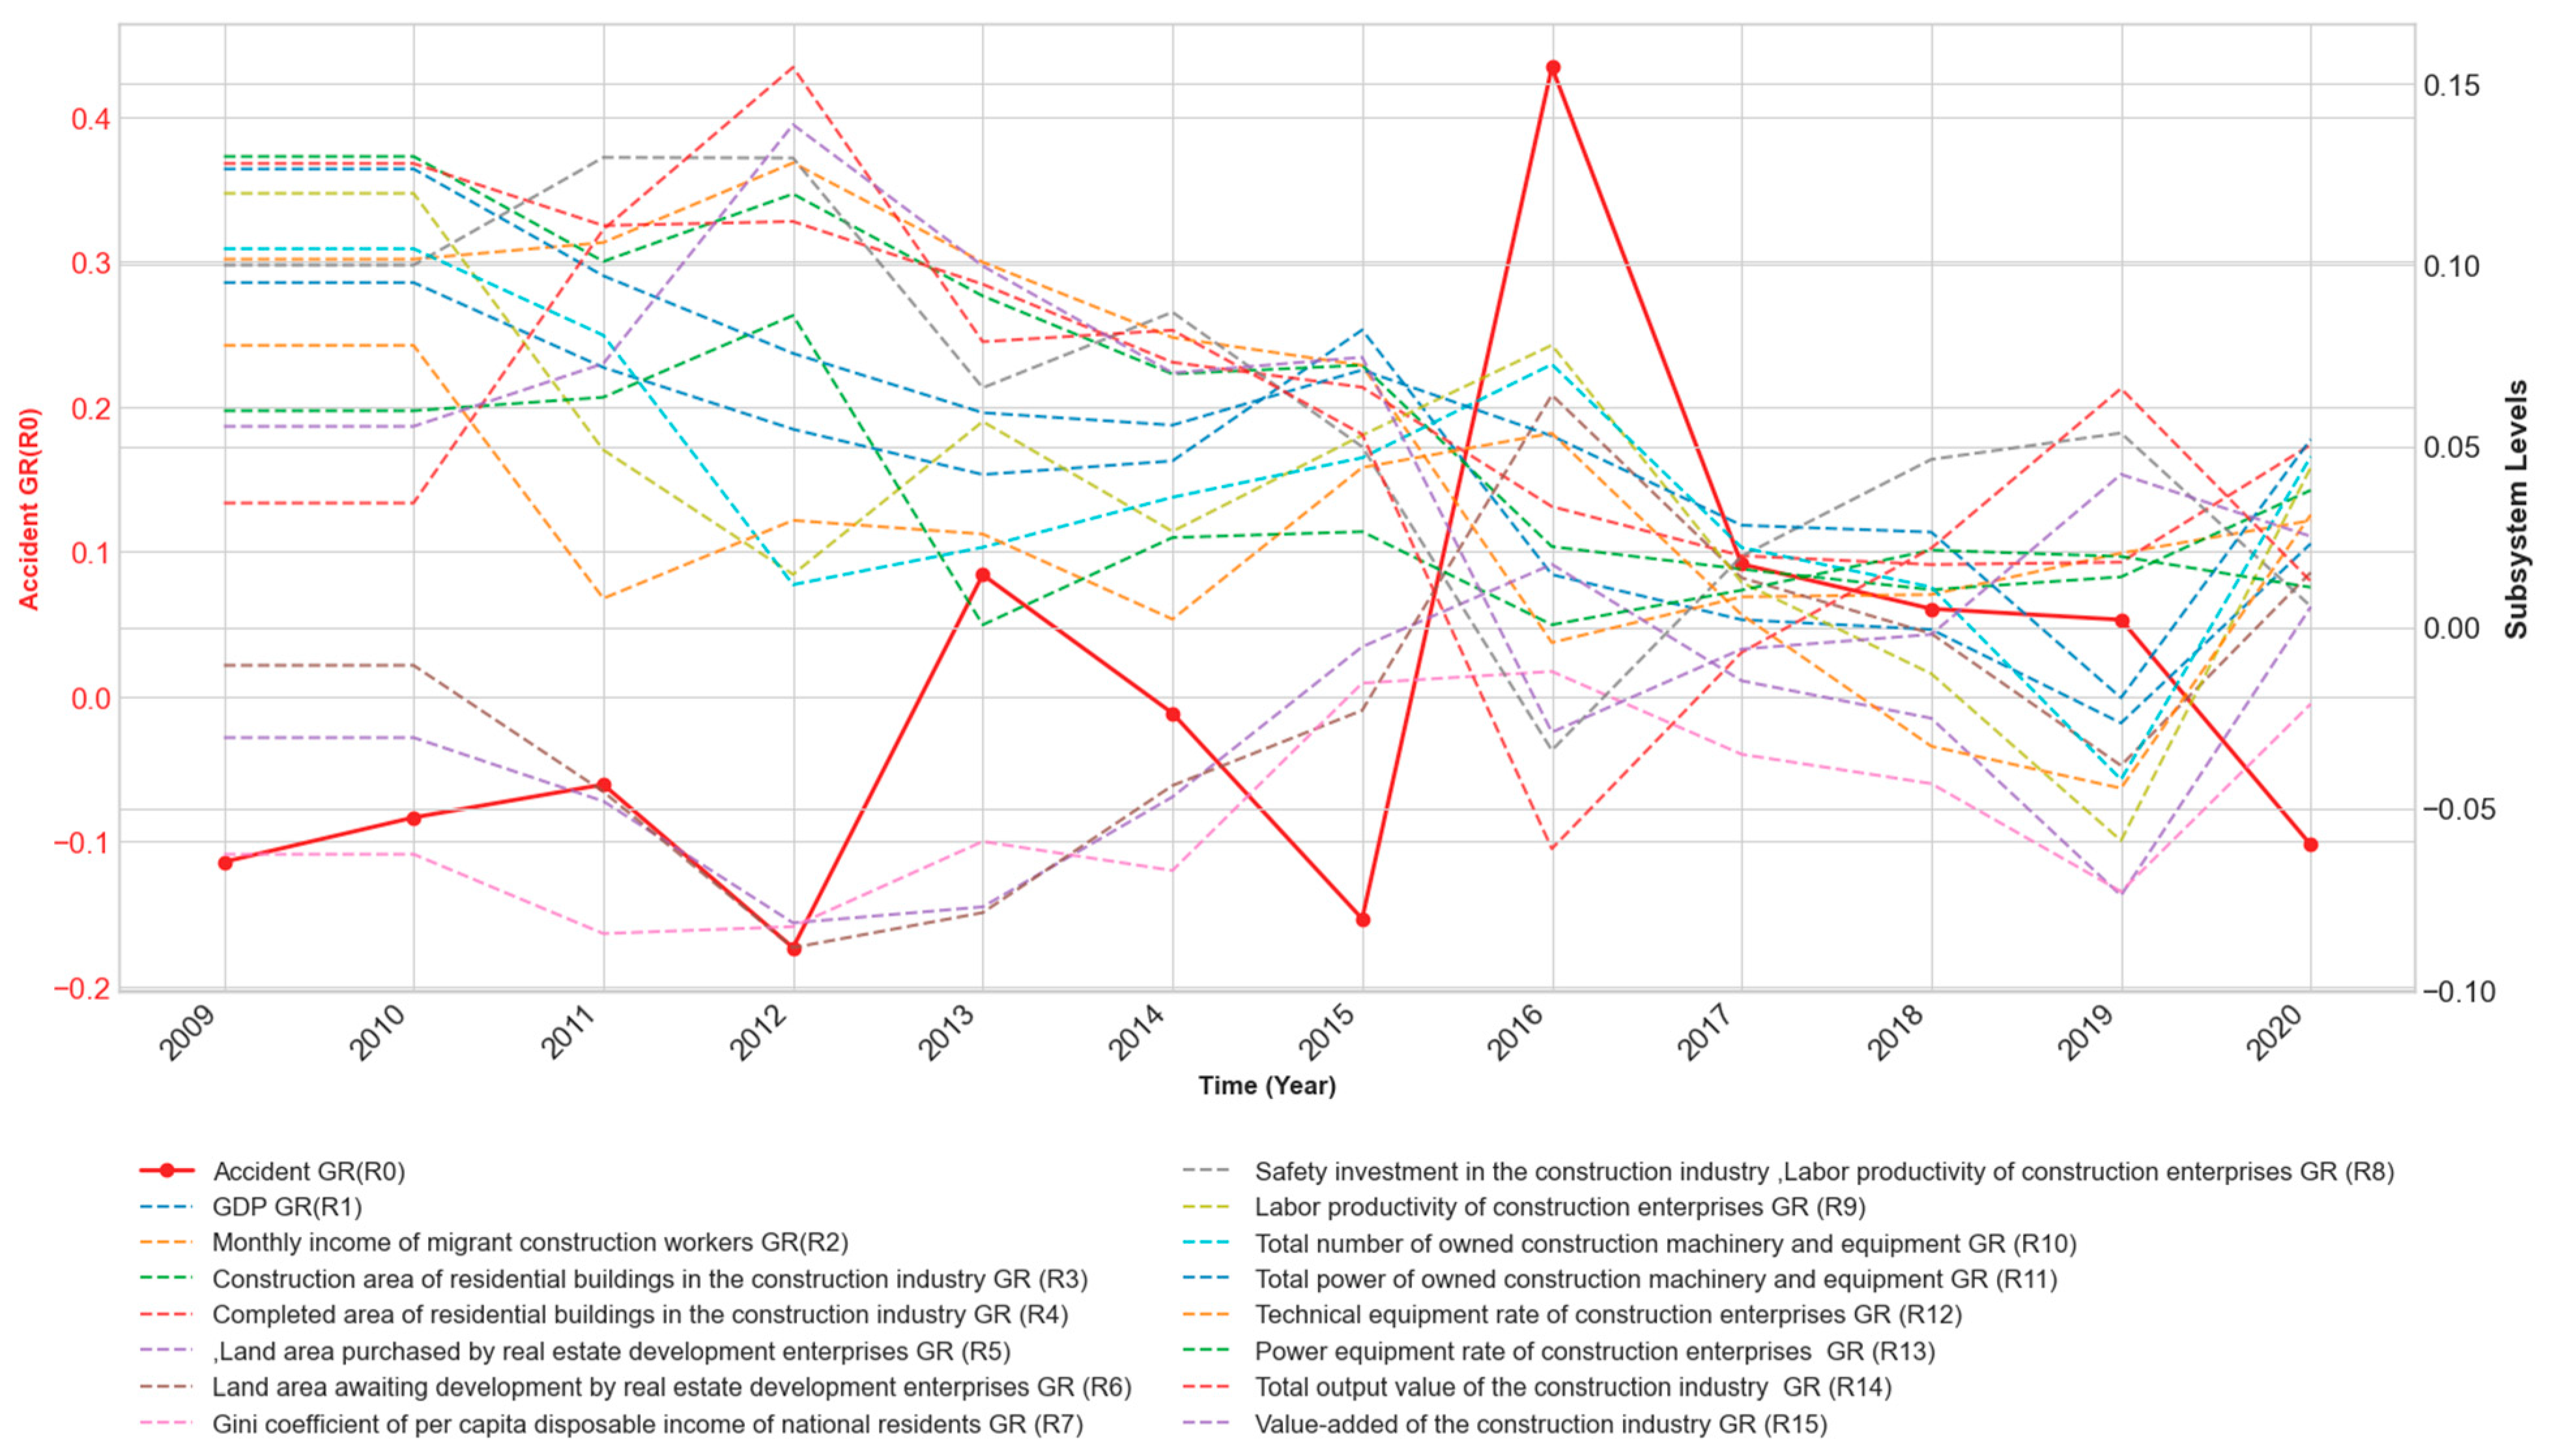
| Time (Year) | Number of Accidents | Accident Growth Rate | Time (Year) | Number of Accidents | Accident Growth Rate |
|---|---|---|---|---|---|
| 2008 | 778 | 0 | 2015 | 442 | −0.153256705 |
| 2009 | 684 | −0.113989637 | 2016 | 634 | 0.43438914 |
| 2010 | 627 | −0.083333333 | 2017 | 692 | 0.09148265 |
| 2011 | 589 | −0.060606061 | 2018 | 734 | 0.060693642 |
| 2012 | 487 | −0.173174873 | 2019 | 773 | 0.053133515 |
| 2013 | 528 | 0.084188912 | 2020 | 689 | −0.102199224 |
| 2014 | 522 | −0.011363636 |
| Indicators | Units | Definition |
|---|---|---|
| Gross Domestic Product (GDP) | CNY 100 million yuan | The total final output of all resident units in a country or region during a certain period, reflecting the economic situation of the country or region. |
| Monthly income of migrant construction workers | CNY | The monthly income of migrant construction workers refers to the total labor remuneration obtained by migrant workers engaged in the construction industry each month, including wages, bonuses, allowances, and subsidies. This indicator reflects the income level of workers in the construction industry. |
| Construction area of residential buildings in the construction industry | 10,000 square meters | The construction area of residential buildings in the construction industry refers to the total area of houses under construction by construction enterprises during the reporting period, including new construction, expansion, and renovation. This indicator reflects the production scale and activity level of the construction industry. |
| Completed area of residential buildings in the construction industry | 10,000 square meters | The completed area of residential buildings in the construction industry refers to the total area of houses completed and handed over for use by construction enterprises during the reporting period. This indicator reflects the actual output and completion status of the construction industry. |
| Land area purchased by real estate development enterprises | 10,000 square meters | The land area purchased by real estate development enterprises refers to the land area obtained by real estate development enterprises through various means during the reporting period. This indicator reflects the activity of real estate development enterprises in the land market. |
| Land area awaiting development by real estate development enterprises | 10,000 square meters | The land area awaiting development by real estate development enterprises refers to the land area that has been approved by relevant departments and obtained land use rights through various means, but has not yet started construction. This indicator reflects the future development potential and reserves of real estate development enterprises. |
| Gini coefficient of per capita disposable income of national residents | None | The Gini coefficient of per capita disposable income of national residents is an indicator that reflects the fairness of income distribution, with values ranging between 0 and 1. |
| Safety investment in the construction industry | CNY 100 million | Safety investment in the construction industry refers to various expenditures made by construction enterprises to ensure safe production during the production process, including safety training, purchase and maintenance of safety equipment, safety inspections, etc. This indicator reflects the importance and investment of enterprises in safe production. |
| Labor productivity of construction enterprises | CNY/person | Labor productivity of construction enterprises refers to the output value created by each employee of construction enterprises during a certain period. This indicator reflects the production efficiency of construction enterprises and the work efficiency of workers. |
| Total number of owned construction machinery and equipment | units | The total number of owned construction machinery and equipment refers to the total number of various types of construction machinery and equipment owned by construction enterprises. This indicator reflects the mechanization level and construction capacity of enterprises. |
| Total power of owned construction machinery and equipment | (Kw) | The total power of owned construction machinery and equipment refers to the total power of all construction machinery and equipment owned by construction enterprises. This indicator reflects the overall energy and construction capacity of enterprise machinery and equipment. |
| Technical equipment rate of construction enterprises | CNY/person | The technical equipment rate of construction enterprises is the value of mechanical equipment that belongs to fixed assets per person on average, reflecting the level of enterprise mechanical equipment. This indicator reflects the investment and technical level of enterprises in technical equipment. |
| Power equipment rate of construction enterprises | (Kw/person) | The power equipment rate of construction enterprises is the ratio of the total power of owned mechanical equipment at the end of the year to the number of all employees or workers at the end of the year. This indicator reflects the investment and technical level of enterprises in power equipment. |
| Total output value of the construction industry | CNY 100 million | The total output value of the construction industry refers to the total value of construction industry products and services produced by construction enterprises in a certain period, expressed in monetary terms. This indicator reflects the total output and economic contribution of the construction industry. |
| Value-added of the construction industry | CNY 100 million | The value-added of the construction industry refers to the final results of construction industry production and business activities expressed in monetary terms by construction enterprises during the reporting period. It is the new value created in the production process of enterprises. This indicator reflects the contribution of the construction industry to economic growth. |
| Evaluation Object | Absolute Value of Original Correlation Coefficient | Absolute Value of Correlation Coefficient | Change Magnitude | Lag Periods | Weight of Lag | Range | Composite Score | Normalized Weight (with Direction) |
|---|---|---|---|---|---|---|---|---|
| R1 | 0.081 | 0.299 | 0.218 | 3 | 0.1 | 0.189 | 0.233 | −0.0330 |
| R2 | 0.421 | 0.386 | 0.035 | 1 | 0.3 | 0.186 | 0.638 | −0.0901 |
| R3 | 0.344 | 0.409 | 0.065 | 1 | 0.3 | 0.211 | 0.650 | −0.0919 |
| R4 | 0.321 | 0.474 | 0.153 | 1 | 0.3 | 0.184 | 0.716 | −0.1011 |
| R5 | 0.282 | 0.271 | 0.011 | 3 | 0.1 | 0.569 | 0.278 | 0.0393 |
| R6 | 0.211 | 0.246 | 0.035 | 3 | 0.1 | 0.600 | 0.269 | 0.0381 |
| R7 | 0.404 | 0.244 | 0.16 | 3 | 0.1 | 0.042 | 0.225 | 0.0318 |
| R8 | 0.516 | 0.309 | 0.207 | 1 | 0.3 | 0.401 | 0.795 | −0.1123 |
| R9 | 0.399 | 0.407 | 0.008 | 2 | 0.2 | 0.294 | 0.474 | −0.0669 |
| R10 | 0.238 | 0.296 | 0.058 | 3 | 0.1 | 0.350 | 0.236 | −0.0334 |
| R11 | 0.357 | 0.333 | 0.024 | 1 | 0.3 | 0.261 | 0.611 | −0.0863 |
| R12 | 0.082 | 0.407 | 0.325 | 3 | 0.1 | 0.372 | 0.401 | −0.0567 |
| R13 | 0.058 | 0.199 | 0.141 | 2 | 0.2 | 0.413 | 0.391 | 0.0552 |
| R14 | 0.077 | 0.259 | 0.182 | 1 | 0.3 | 0.250 | 0.582 | −0.0822 |
| R15 | 0.007 | 0.246 | 0.239 | 1 | 0.3 | 0.221 | 0.579 | −0.0818 |
| System | Variable Name | Type | System Dynamics Equations |
|---|---|---|---|
| Subsystem R1 | GDP Growth Rate Impact Change | Rate | 0.0850r2 + 0.0806r3 + 0.0817r4 − 0.0595r5 − 0.0846r6 − 0.1072r7 + 0.0646r8 − 0.0595r9 + 0.0411r10 + 0.0777r11 − 0.0495r12 + 0.0641r13 + 0.0737r14 + 0.071r15 |
| Subsystem R2 | Monthly Income Growth Rate Impact Change | Rate | 0.0815r1 + 0.1103r3 + 0.1204r4 − 0.0405r5 − 0.0438r6 − 0.0537r7 + 0.0786r8 + 0.0772r9 + 0.064r10 + 0.0758r11 + 0.0578r12 + 0.0347r13 + 0.0872r14 + 0.0744r15 |
| Subsystem R3 | Construction Area Growth Rate Impact Change | Rate | 0.0779r1 + 0.1112r2 + 0.1105r4 − 0.0604r5 − 0.0648r6 − 0.0438r7 + 0.0754r8 + 0.0744r9 + 0.035r10 + 0.0631r11 + 0.0529r12 + 0.0257r13 + 0.0996r14 + 0.1053r15 |
| Subsystem R4 | Completed Area Growth Rate Impact Change | Rate | 0.0759r1 + 0.1167r2 + 0.1062r3 − 0.0643r5 − 0.0491r6 − 0.0639r7 + 0.0762r8 + 0.0782r9 + 0.0398r10 + 0.0574r11 + 0.0485r12 − 0.0358r13 + 0.0984r14 + 0.0897r15 |
| Subsystem R5 | Land Acquisition Area Growth Rate Impact Change | Rate | −0.0643r1 − 0.0456r2 − 0.0674r3 − 0.0747r4 − 0.0652r6 + 0.0484r7 + 0.0626r8 − 0.1373r9 − 0.0671r10 − 0.0575r11 − 0.1095r12 + 0.0525r13 + 0.0874r14 − 0.0606r15 |
| Subsystem R6 | Undeveloped Land Area Growth Rate Impact Change | Rate | −0.0827r1 − 0.0447r2 − 0.0655r3 − 0.0517r4 − 0.059r5 − 0.0744r7 − 0.0393r8 − 0.1237r9 − 0.0847r10 − 0.0904r11 − 0.0847r12 − 0.0662r13 + 0.0674r14 + 0.0656r15 |
| Subsystem R7 | Gini Coefficient Growth Rate Impact Change | Rate | −0.1125r1 − 0.0587r2 − 0.0476r3 − 0.0721r4 + 0.047r5 − 0.0799r6 + 0.0448r8 − 0.0865r9 − 0.1163r10 + 0.0734r11 − 0.0675r12 + 0.0653r13 − 0.0419r14 − 0.0864r15 |
| Subsystem R8 | Safety Investment Growth Rate Impact Change | Rate | 0.0737r1 + 0.0936r2 + 0.0889r3 + 0.0935r4 + 0.0662r5 − 0.0459r6 + 0.0487r7 + 0.0803r9 + 0.0728r10 + 0.059r11 + 0.0703r12 + 0.0347r13 + 0.0861r14 + 0.0862r15 |
| Subsystem R9 | Labor Productivity Growth Rate Impact Change | Rate | −0.0542r1 + 0.0733r2 + 0.0701r3 + 0.0767r4 − 0.1159r5 − 0.1153r6 − 0.0751r7 + 0.0641r8 − 0.0502r10 + 0.0502r11 − 0.0433r12 − 0.0591r13 + 0.0771r14 + 0.0754r15 |
| Subsystem R10 | Total Number of Owned Construction Machinery Growth Rate Impact Change | Rate | 0.0461r1 + 0.075r2 + 0.0407r3 + 0.0481r4 − 0.0698r5 − 0.0973r6 − 0.1245r7 + 0.0716r8 − 0.0619r9 − 0.0342r11 − 0.0757r12 − 0.0663r13 + 0.0915r14 + 0.0975r15 |
| Subsystem R11 | Total Power of Owned Construction Machinery Growth Rate Impact Change | Rate | 0.0796r1 + 0.0809r2 + 0.0668r3 + 0.0632r4 − 0.0545r5 − 0.0947r6 + 0.0715r7 + 0.053r8 + 0.0564r9 − 0.0311r10 − 0.0857r12 + 0.0443r13 + 0.0974r14 + 0.121r15 |
| Subsystem R12 | Technical Equipment Rate Growth Rate Impact Change | Rate | −0.0535r1 + 0.0651r2 + 0.0591r3 + 0.0563r4 − 0.1096r5 − 0.0935r6 − 0.0695r7 + 0.0666r8 − 0.0513r9 − 0.0729r10 − 0.0904r11 + 0.0919r13 + 0.0609r14 + 0.0593r15 |
| Subsystem R13 | Power Equipment Rate Growth Rate Impact Change | Rate | 0.0836r1 + 0.0472r2 + 0.0347r3 − 0.0503r4 + 0.0635r5 − 0.0883r6 + 0.0811r7 + 0.0396r8 − 0.0845r9 − 0.0769r10 + 0.0565r11 + 0.111r12 + 0.0734r14 + 0.1094r15 |
| Subsystem R14 | Total Output Value of Construction Industry Growth Rate Impact Change | Rate | 0.0688r1 + 0.0849r2 + 0.0962r3 + 0.0988r4 + 0.0756r5 + 0.0644r6 − 0.0373r7 + 0.0704r8 + 0.079r9 + 0.076r10 + 0.0888r11 + 0.0526r12 + 0.0525r13 + 0.0545r15 |
| Subsystem R15 | Value-Added Growth Rate of Construction Industry Growth Rate Impact Change | Rate | 0.0634r1 + 0.0693r2 + 0.0972r3 + 0.0862r4 − 0.0501r5 + 0.0599r6 − 0.0735r7 + 0.0674r8 + 0.0738r9 + 0.0775r10 + 0.1055r11 + 0.049r12 + 0.0749r13 + 0.0521r14 |
| Subsystem R5 + R6 + R7 + R13 | Growth Rate Increase | Rate | 0.0393R5 + 0.0381R6 + 0.0318R7 + 0.0552R13 |
| Other Subsystems not Including Increase | Growth Rate Decrease | Rate | 0.0330R1 + 0.0901R2 + 0.0919R3 + 0.1011R4 + 0.1123R8 + 0.0669R9 + 0.0334R10 + 0.0863R11 + 0.0567R12 + 0.0822R14 + 0.0818R15 |
| Level | Accident Growth Rate Level | State | INTEG (Increase—Decrease) |
| Baseline Indicator (R0) | Original Correlation Coefficient | Maximum Time-Lag Correlation Coefficient | Periods | Baseline Indicator (R0) | Original Correlation Coefficient | Maximum Time-Lag Correlation Coefficient | Periods |
|---|---|---|---|---|---|---|---|
| R1 | −0.081 | −0.299 | −3 | R9 | −0.399 | −0.407 | −2 |
| R2 | −0.421 | −0.386 | 1 | R10 | 0.238 | −0.296 | −3 |
| R3 | −0.344 | −0.409 | 1 | R11 | −0.357 | −0.333 | 1 |
| R4 | −0.321 | −0.474 | −1 | R12 | −0.082 | −0.407 | −2 |
| R5 | 0.282 | 0.271 | −3 | R13 | −0.058 | 0.199 | −2 |
| R6 | 0.211 | 0.246 | −3 | R14 | −0.077 | −0.259 | −1 |
| R7 | 0.404 | 0.244 | −3 | R15 | −0.007 | −0.246 | −1 |
| R8 | −0.516 | −0.309 | 1 |
| Subsystem | Lag Periods | Correlation Coefficient | Subsystem | Lag Periods | Correlation Coefficient |
|---|---|---|---|---|---|
| R1 | −3 | −0.6347 | R9 | −3 | −0.4190 |
| R2 | 0 | 0.5106 | R10 | −3 | 0.3127 |
| R3 | 0 | −0.5217 | R11 | −3 | −0.6373 |
| R4 | 0 | −0.5177 | R12 | −1 | −0.4190 |
| R5 | −3 | −0.2137 | R13 | −3 | −0.5406 |
| R6 | 0 | −0.4473 | R14 | 0 | −0.3395 |
| R7 | 0 | −0.4211 | R15 | 0 | −0.4314 |
| R8 | 0 | −0.6373 |
Disclaimer/Publisher’s Note: The statements, opinions and data contained in all publications are solely those of the individual author(s) and contributor(s) and not of MDPI and/or the editor(s). MDPI and/or the editor(s) disclaim responsibility for any injury to people or property resulting from any ideas, methods, instructions or products referred to in the content. |
© 2024 by the authors. Licensee MDPI, Basel, Switzerland. This article is an open access article distributed under the terms and conditions of the Creative Commons Attribution (CC BY) license (https://creativecommons.org/licenses/by/4.0/).
Share and Cite
Feng, R.; Zhang, Z.; Li, Z.; Meng, G.; Liu, J. Building a Sustainable Future: Enhancing Construction Safety through Macro-Level Analysis. Sustainability 2024, 16, 7706. https://doi.org/10.3390/su16177706
Feng R, Zhang Z, Li Z, Meng G, Liu J. Building a Sustainable Future: Enhancing Construction Safety through Macro-Level Analysis. Sustainability. 2024; 16(17):7706. https://doi.org/10.3390/su16177706
Chicago/Turabian StyleFeng, Rui, Zhuqing Zhang, Zonghao Li, Ge Meng, and Jian Liu. 2024. "Building a Sustainable Future: Enhancing Construction Safety through Macro-Level Analysis" Sustainability 16, no. 17: 7706. https://doi.org/10.3390/su16177706
APA StyleFeng, R., Zhang, Z., Li, Z., Meng, G., & Liu, J. (2024). Building a Sustainable Future: Enhancing Construction Safety through Macro-Level Analysis. Sustainability, 16(17), 7706. https://doi.org/10.3390/su16177706