

Experimental and Numerical Studies on the Fire Performance of Thin Sustainable Wood-Based Laminated Veneers


Abstract
1. Introduction
2. Materials and Methods
2.1. Material Used
2.2. Experimental Methodology
2.3. Numerical Model Specification
3. Results and Discussion
3.1. Fire Rating (V-Rating)
3.2. Fire Reaction Properties
3.2.1. Time to Ignition (tIg)
3.2.2. Ignition Temperature (TIg)
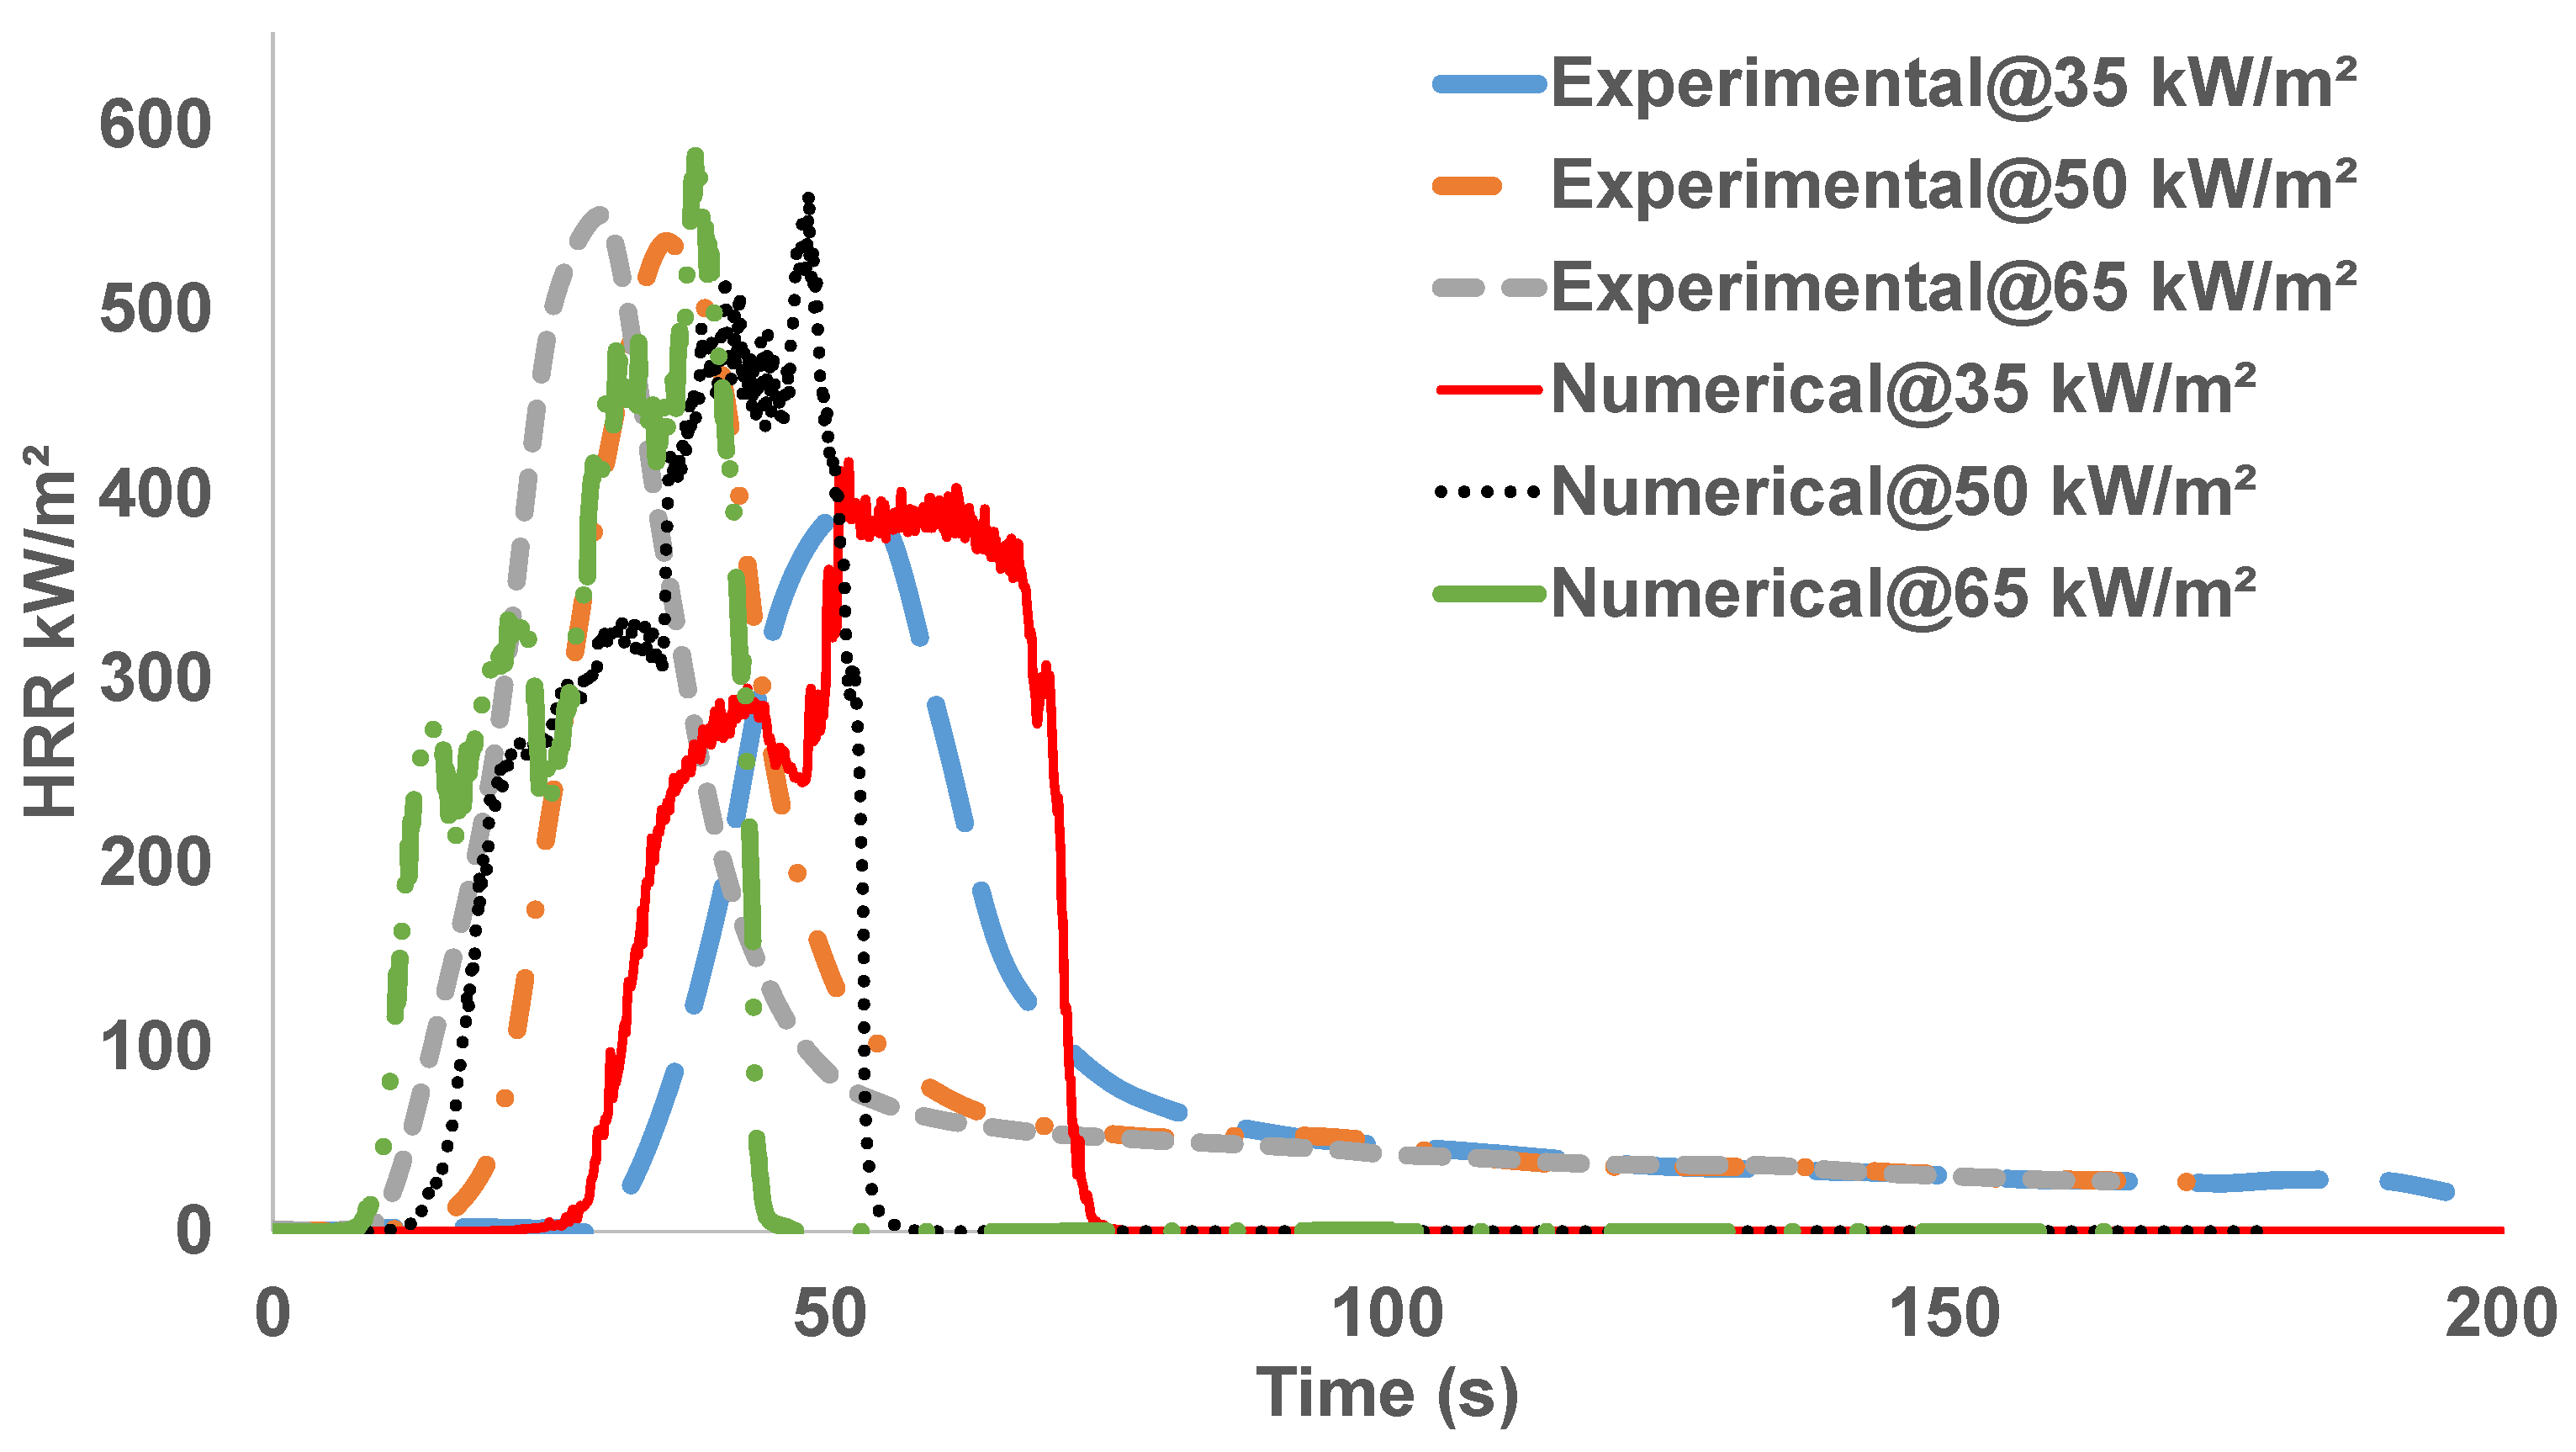
3.2.3. Heat Release Rate (HRR)
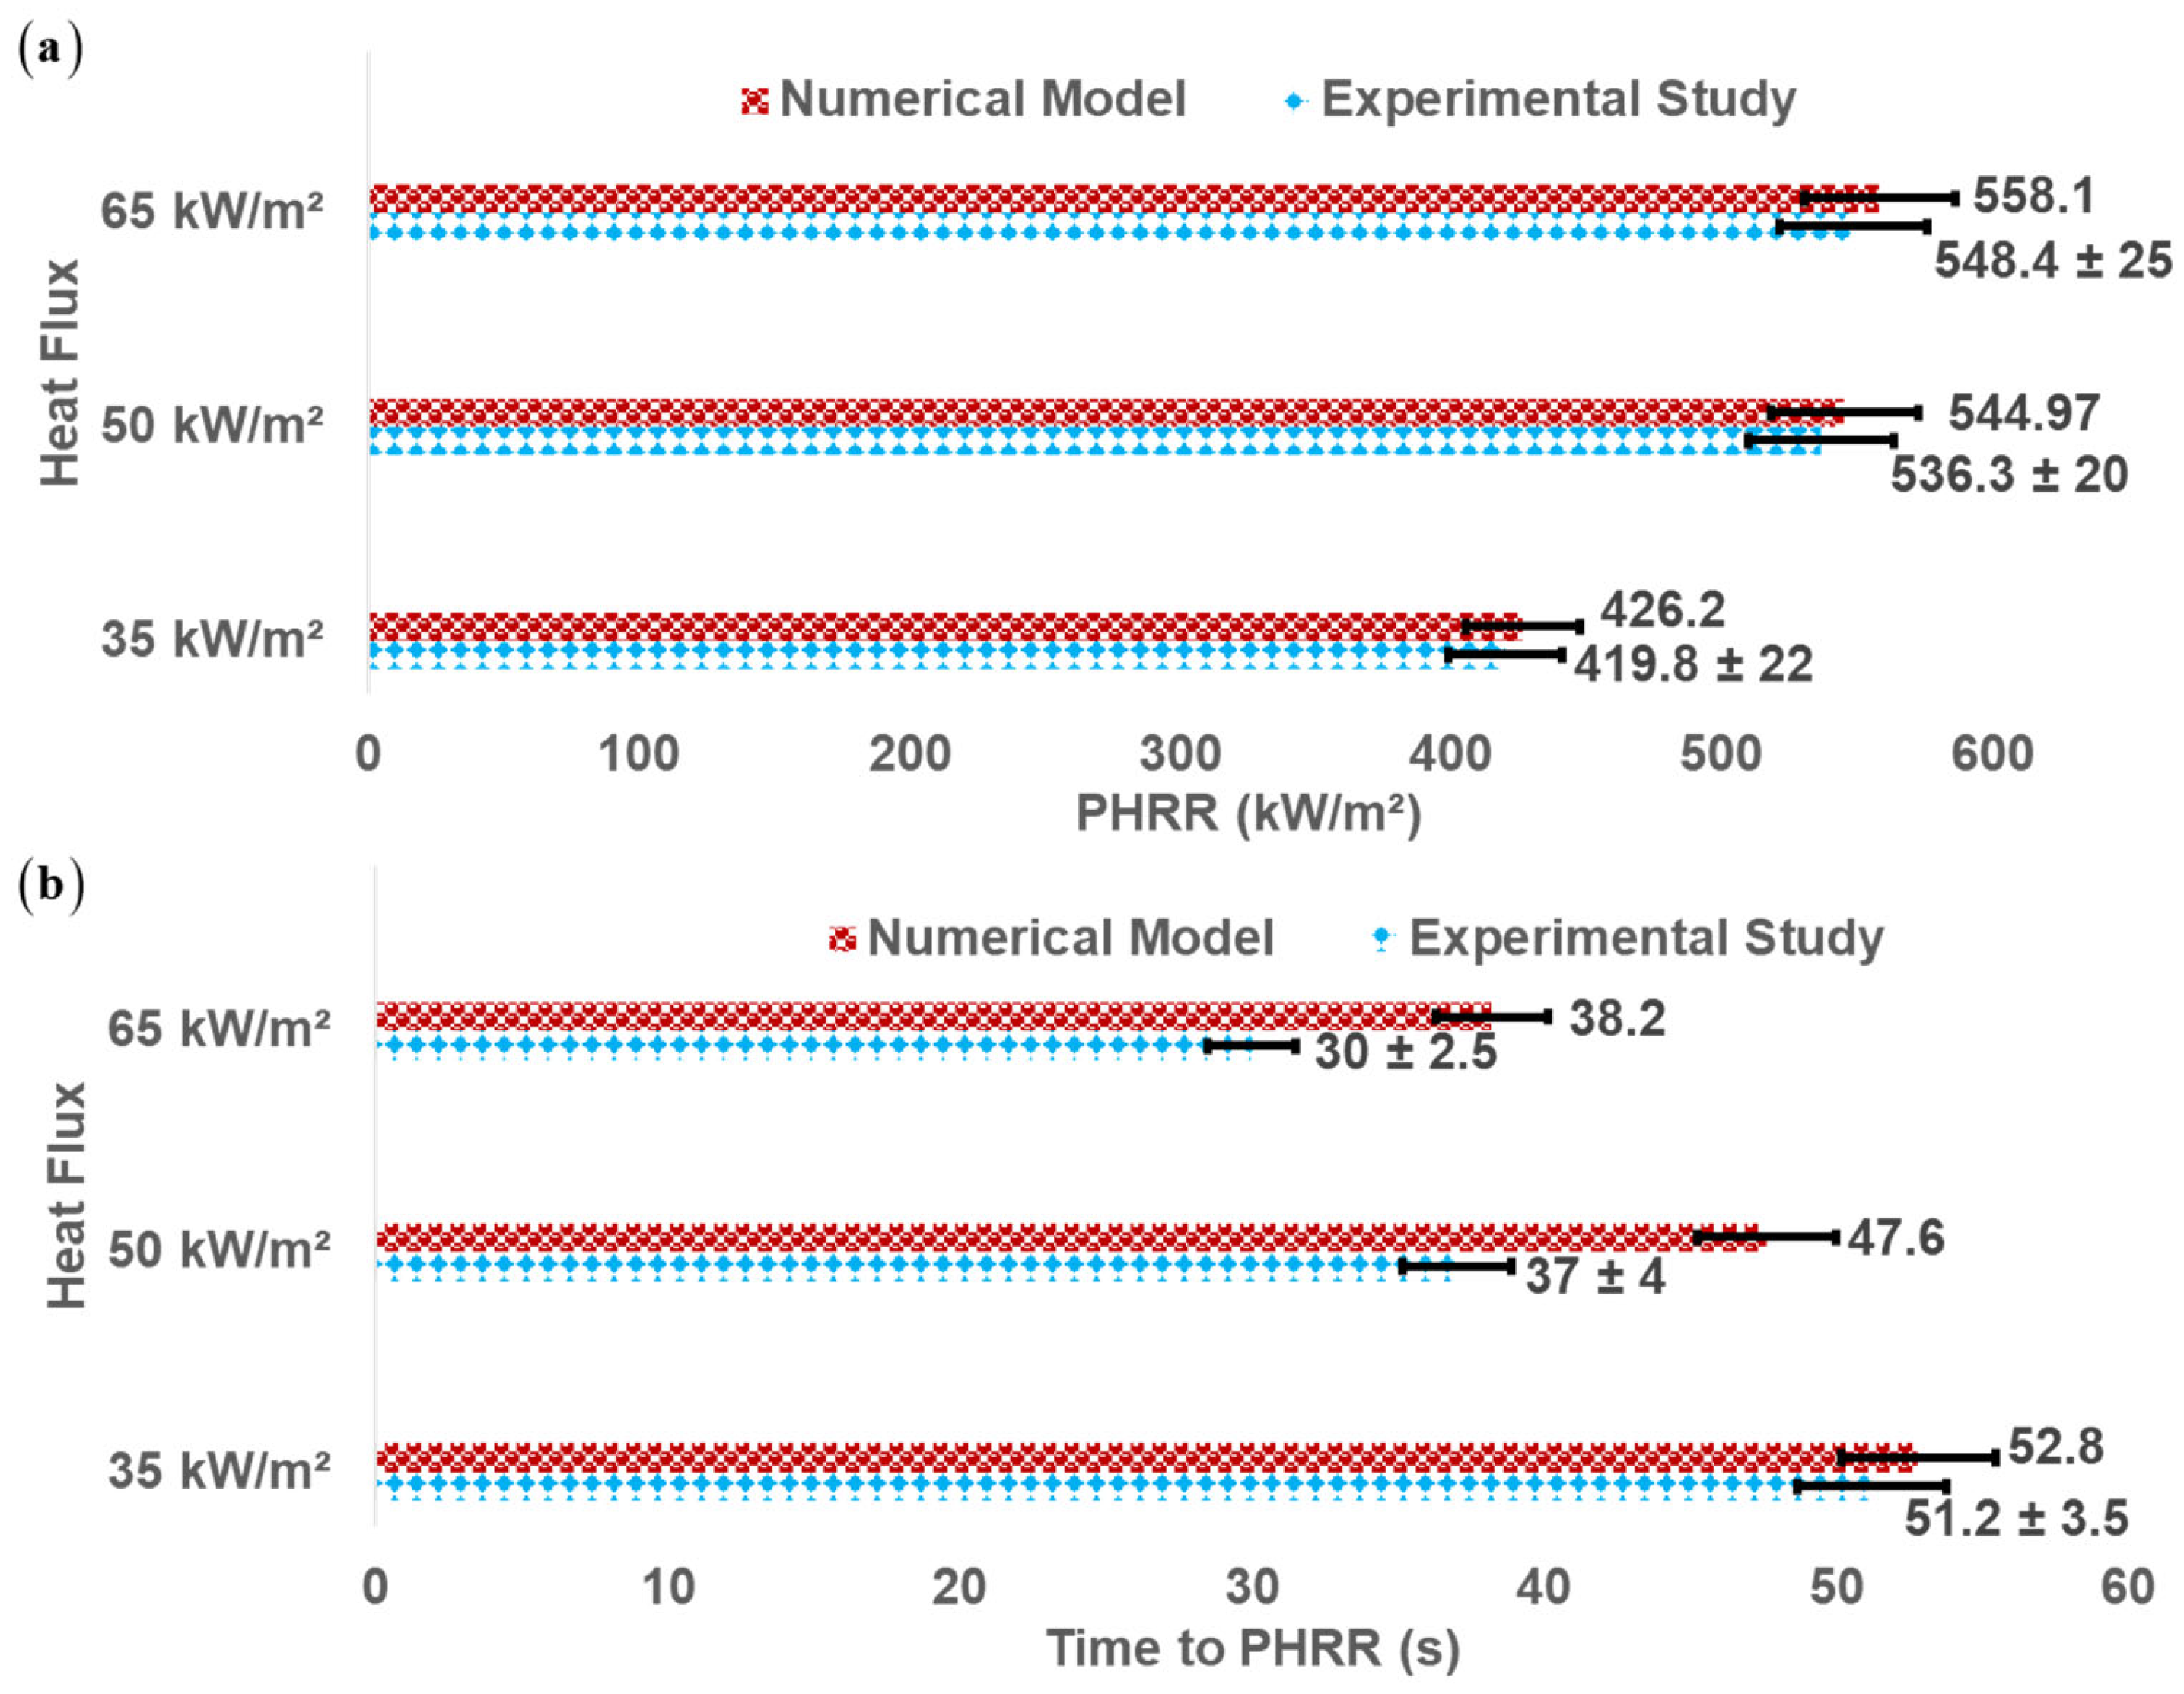
3.2.4. Peak Heat Release Rate (PHRR)
3.2.5. Time to Flameout (tf) and Burn Time (tb)
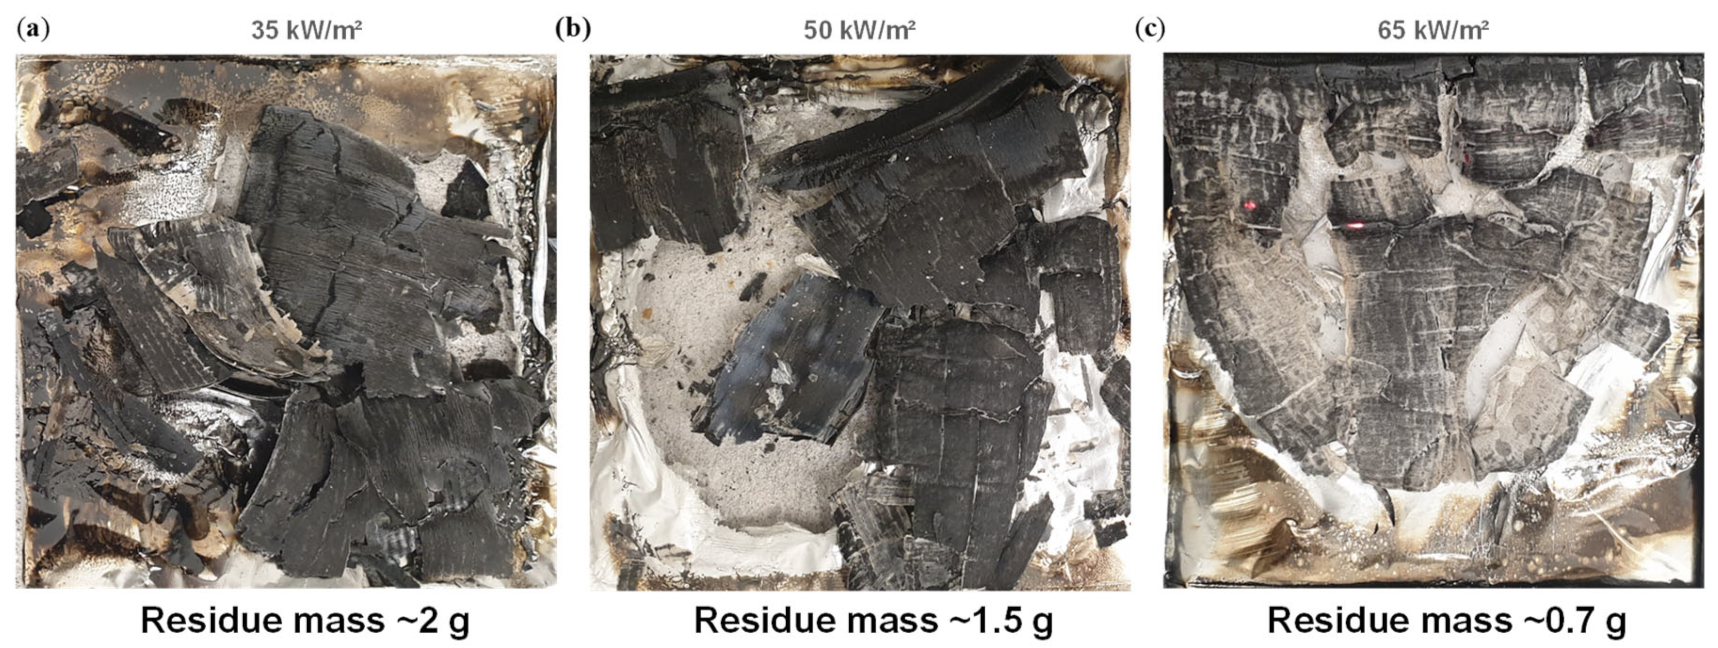
3.2.6. Mass Loss
4. Conclusions
- The vertical burn test gave a rating of V-1 to the plywood samples with a self-extinguishing ability, proving that the material system can have substantial applications if fire retardancy can be introduced;
- The plywood samples were observed to experience a decrease in time to ignition by an average of about 39%, flameout by about 21.5%, peak heat release rate by about 24.5%, and burn time by about 13% with the gradual increase in the heat fluxes;
- The increase in heat irradiance also resulted in the samples experiencing a higher ignition temperature that increased roughly on average by ~7.25%, peak heat release by ~12%, and mass loss by ~30% when tested under the cone-calorimeter;
- The numerical model showed satisfactory agreement with the experimental data from all the heat fluxes. The highest correlation coefficient was calculated to be 0.89 for the heat irradiance of 35 kW/m2, followed by 0.88 for 65 kW/m2, and 0.83 for 50 kW/m2;
- ANOVA analysis further proved that the variations in HRR, PHRR, tIg, and tPHRR-@35 values between the numerical and experimental analyses were statistically not significant, while the other factors showed similar trends observed from experimental values. This helped develop confidence in the numerical model;
- The non-dimensional dependencies of the various fire reaction parameters of the three heat fluxes used were calculated both experimentally and numerically. They had considerably good agreement, except for the time to peak heat release rate. This variation can be attributed to the inability of the FDS to simulate the fire suppression experienced in the real experiment due to char formation, an aspect that needs further research.
Author Contributions
Funding
Institutional Review Board Statement
Informed Consent Statement
Data Availability Statement
Acknowledgments
Conflicts of Interest
References
- Chanda, A.; Bhattacharyya, D. A parametric study to minimise spring-back while producing plywood channels. J. Clean. Prod. 2021, 304, 127109. [Google Scholar] [CrossRef]
- Wegst, U.G.K.; Bai, H.; Saiz, E.; Tomsia, A.P.; Ritchie, R.O. Bioinspired structural materials. Nat. Mater. 2015, 14, 23–36. [Google Scholar] [CrossRef] [PubMed]
- Chen, C.; Kuang, Y.; Zhu, S.; Burgert, I.; Keplinger, T.; Gong, A.; Li, T.; Berglund, L.; Eichhorn, S.J.; Hu, L. Structure–property–function relationships of natural and engineered wood. Nat. Rev. Mater. 2020, 5, 642–666. [Google Scholar] [CrossRef]
- Srinivasan, N. Forming of Woodfibre Composites and Veneer Sheets. Ph.D. Thesis, University of Auckland, Auckland, New Zealand, 2008. Available online: https://researchspace.auckland.ac.nz/handle/2292/52216 (accessed on 24 June 2024).
- Sathre, R.; Gustavsson, L. Using wood products to mitigate climate change: External costs and structural change. Appl. Energy 2009, 86, 251–257. [Google Scholar] [CrossRef]
- Castanie, B.; Bouvet, C.; Ginot, M. Review of composite sandwich structure in aeronautic applications. Compos. Part C Open Access 2020, 1, 100004. [Google Scholar] [CrossRef]
- Mohammadabadi, M.; Yadama, V.; Smith, L.V. WOOD-BASED PREPREG FOR COMPOSITE LAMINATES: Wood-Based Prepreg. Wood Fiber Sci. 2022, 54, 122–133. [Google Scholar]
- Wu, Z.; Deng, X.; Luo, Z.; Zhang, B.; Xi, X.; Yu, L.; Li, L. Improvements in Fire Resistance, Decay Resistance, Anti-Mold Property and Bonding Performance in Plywood Treated with Manganese Chloride, Phosphoric Acid, Boric Acid and Ammonium Chloride. Coatings 2021, 11, 399. [Google Scholar] [CrossRef]
- Cao, J.Z. A review on wood protectant dispersion systems and their liquid penetration. J. For. Eng. 2019, 4, 1–9. [Google Scholar]
- Nicholas, D.D.; Siau, J.F. Factors influencing the treatability of wood. Wood Deterior. Its Prev. Preserv. Treat. 1973, 2, 329–345. [Google Scholar]
- Di Blasi, C.; Branca, C.; Galgano, A. Flame retarding of wood by impregnation with boric acid—Pyrolysis products and char oxidation rates. Polym. Degrad. Stab. 2007, 92, 752–764. [Google Scholar] [CrossRef]
- Baysal, E.; Altinok, M.; Colak, M.; Ozaki, S.K.; Toker, H. Fire resistance of Douglas fir (Pseudotsuga menzieesi) treated with borates and natural extractives. Bioresour. Technol. 2007, 98, 1101–1105. [Google Scholar] [CrossRef] [PubMed]
- Bogdanova, V.V.; Kobets, O.I.; Kirlitsa, V.P. The mechanism of action and the synergistic effect of nitrogenand phosphorus-containing fire retardants in fire protection and wood and peat fire suppression. Russ. J. Phys. Chem. B 2016, 10, 306–312. [Google Scholar] [CrossRef]
- Yang, J.; Zhu, X.; Tian, C.; Yao, C.; Wu, Y. Properties of eucalyptus plywood treated with boron-nitrogen and phosphorus flame retardants. China Prod. Ind. 2014, 41, 17–20. [Google Scholar]
- Branca, C.; Di Blasi, C. Oxidation characteristics of chars generated from wood impregnated with (NH4)2HPO4 and (NH4)2SO4. Thermochim. Acta 2007, 456, 120–127. [Google Scholar] [CrossRef]
- Su, W.-Y.; Subyakto; Hata, T.; Nishimiya, K.; Imamura, Y.; Ishihara, S. Improvement of fire retardancy of plywood by incorporating boron or phosphate compounds in the glue. J. Wood Sci. 1998, 44, 131–136. [Google Scholar] [CrossRef]
- Lebow, S.T.; Winandy, J.E. The role of grade and thickness in the degradation of fire-retardant-treated plywood. For. Prod. J. 1998, 48, 88–94. [Google Scholar]
- Chanda, A.; Kim, N.K.; Wijaya, W.; Bhattacharyya, D. Fire reaction of sandwich panels with corrugated and honeycomb cores made from natural materials. J. Sandw. Struct. Mater. 2021, 23, 4196–4217. [Google Scholar] [CrossRef]
- Chanda, A.; Kim, N.K.; Bhattacharyya, D. Effects of adhesive systems on the mechanical and fire-reaction properties of wood veneer laminates. Compos. Sci. Technol. 2022, 230, 109331. [Google Scholar] [CrossRef]
- Lautenberger, C.; Fernandez-Pello, C. A model for the oxidative pyrolysis of wood. Combust. Flame 2009, 156, 1503–1513. [Google Scholar] [CrossRef]
- Yuen, R.; Yeoh, G.; Davis, G.d.V.; Leonardi, E. Modelling the pyrolysis of wet wood—II. Three-dimensional cone calorimeter simulation. Int. J. Heat Mass Transf. 2007, 50, 4387–4399. [Google Scholar] [CrossRef]
- Hostikka, S.; Matala, A. Pyrolysis Model for Predicting the Heat Release Rate of Birch Wood. Combust. Sci. Technol. 2017, 189, 1373–1393. [Google Scholar] [CrossRef]
- Ding, Y.; Fukumoto, K.; Ezekoye, O.A.; Lu, S.; Wang, C.; Li, C. Experimental and numerical simulation of multi-component combustion of typical charring material. Combust. Flame 2020, 211, 417–429. [Google Scholar] [CrossRef]
- Delichatsios, M.; Paroz, B.; Bhargava, A. Flammability properties for charring materials. Fire Saf. J. 2003, 38, 219–228. [Google Scholar] [CrossRef]
- Emberley, R.; Do, T.; Yim, J.; Torero, J.L. Critical heat flux and mass loss rate for extinction of flaming combustion of timber. Fire Saf. J. 2017, 91, 252–258. [Google Scholar] [CrossRef]
- Lin, S.; Huang, X.; Gao, J.; Ji, J. Extinction of wood fire: A near-limit blue flame above hot smoldering surface. Fire Technol. 2021, 58, 415–434. [Google Scholar]
- Chanda, A.; Kim, N.K.; Bhattacharyya, D. Manufacturing and characterisation of wood-veneer sandwich panels with flame-retardant composite cores. Compos. Commun. 2021, 27, 100870. [Google Scholar] [CrossRef]
- Schartel, B.; Hull, T.R. Development of fire-retarded materials—Interpretation of cone calorimeter data. Fire Mater. 2007, 31, 327–354. [Google Scholar] [CrossRef]
- ASTM E1354-23; Standard Test Method for Heat and Visible Smoke Release Rates for Materials and Products Using an Oxygen Consumption Calorimeter. ASTM Internationnal: West Conshohocken, PA, USA, 2023. [CrossRef]
- AASTM D3801-20a; Standard Test Method for Measuring the Comparative Burning Characteristics of Solid Plastics in a Vertical Position. ASTM Internationnal: West Conshohocken, PA, USA, 2020. Available online: https://www.astm.org/d3801-20a.html (accessed on 1 July 2024).
- McGrattan, K.; Hostikka, S.; McDermott, R.; Floyd, J.; Weinschenk, C.; Overholt, K. Fire Dynamics Simulator User’s Guide; NIST Special Publication; NIST: Gaithersburg, MD, USA, 2013; Volume 1019, pp. 1–339.
- McGrattan, K.B.; Baum, H.R.; Rehm, R.G.; Hamins, A.; Forney, G.P.; Floyd, J.E.; Hostikka, S.; Prasad, K. Fire Dynamics Simulator—Technical Reference Guide; National Institute of Standards and Technology, Building and Fire Research: Gaithersburg, MD, USA, 2000.
- Dutta, S. Understanding and Modelling the Thermo-Mechanical Response of FRP Composites under Fire. Ph.D. Thesis, University of Auckland, Auckland, New Zealand, 2020. Available online: https://researchspace.auckland.ac.nz/handle/2292/49675 (accessed on 22 April 2023).
- Ngo, T.D.; Nguyen, Q.T.; Tran, P. Heat release and flame propagation in prefabricated modular unit with GFRP composite facades. Build. Simul. 2016, 9, 607–616. [Google Scholar] [CrossRef]
- Yuen, A.C.Y.; Chen, T.B.Y.; Yeoh, G.H.; Yang, W.; Cheung, S.C.-P.; Cook, M.; Yu, B.; Chan, Q.N.; Yip, H.L. Establishing pyrolysis kinetics for the modelling of the flammability and burning characteristics of solid combustible materials. J. Fire Sci. 2018, 36, 494–517. [Google Scholar] [CrossRef]
- Shine, L.C.; Bower, S.M. A One-Way Analysis of Variance for Single-Subject Designs. Educ. Psychol. Meas. 1971, 31, 105–113. [Google Scholar] [CrossRef]
- Ross, R. Wood Handbook: Wood as an Engineering Material; General Technical Report FPL-GTR-190; Forest Products Laboratory (US): Madison, WI, USA, 2010; Volume 1.
- Tsai, K.-C. Orientation effect on cone calorimeter test results to assess fire hazard of materials. J. Hazard. Mater. 2009, 172, 763–772. [Google Scholar] [CrossRef] [PubMed]
- Asuero, A.G.; Sayago, A.; González, A.G. The correlation coefficient: An overview. Crit. Rev. Anal. Chem. 2006, 36, 41–59. [Google Scholar]


| Properties | Unit | Value | Source |
|---|---|---|---|
| Density | kg/m3 | 566 | Supplier |
| Emissivity | - | 0.9 | [31] |
| Specific Heat Capacity | kJ/kg K | 2.58 | [37] |
| Thermal Conductivity | W/m K | 0.12 | [37] |
| Heat of Combustion | kJ/kg | 1.4233 × 10⁴ | Cone calorimeter |
| Heat of Reaction | kJ/kg | 430 | [37] |
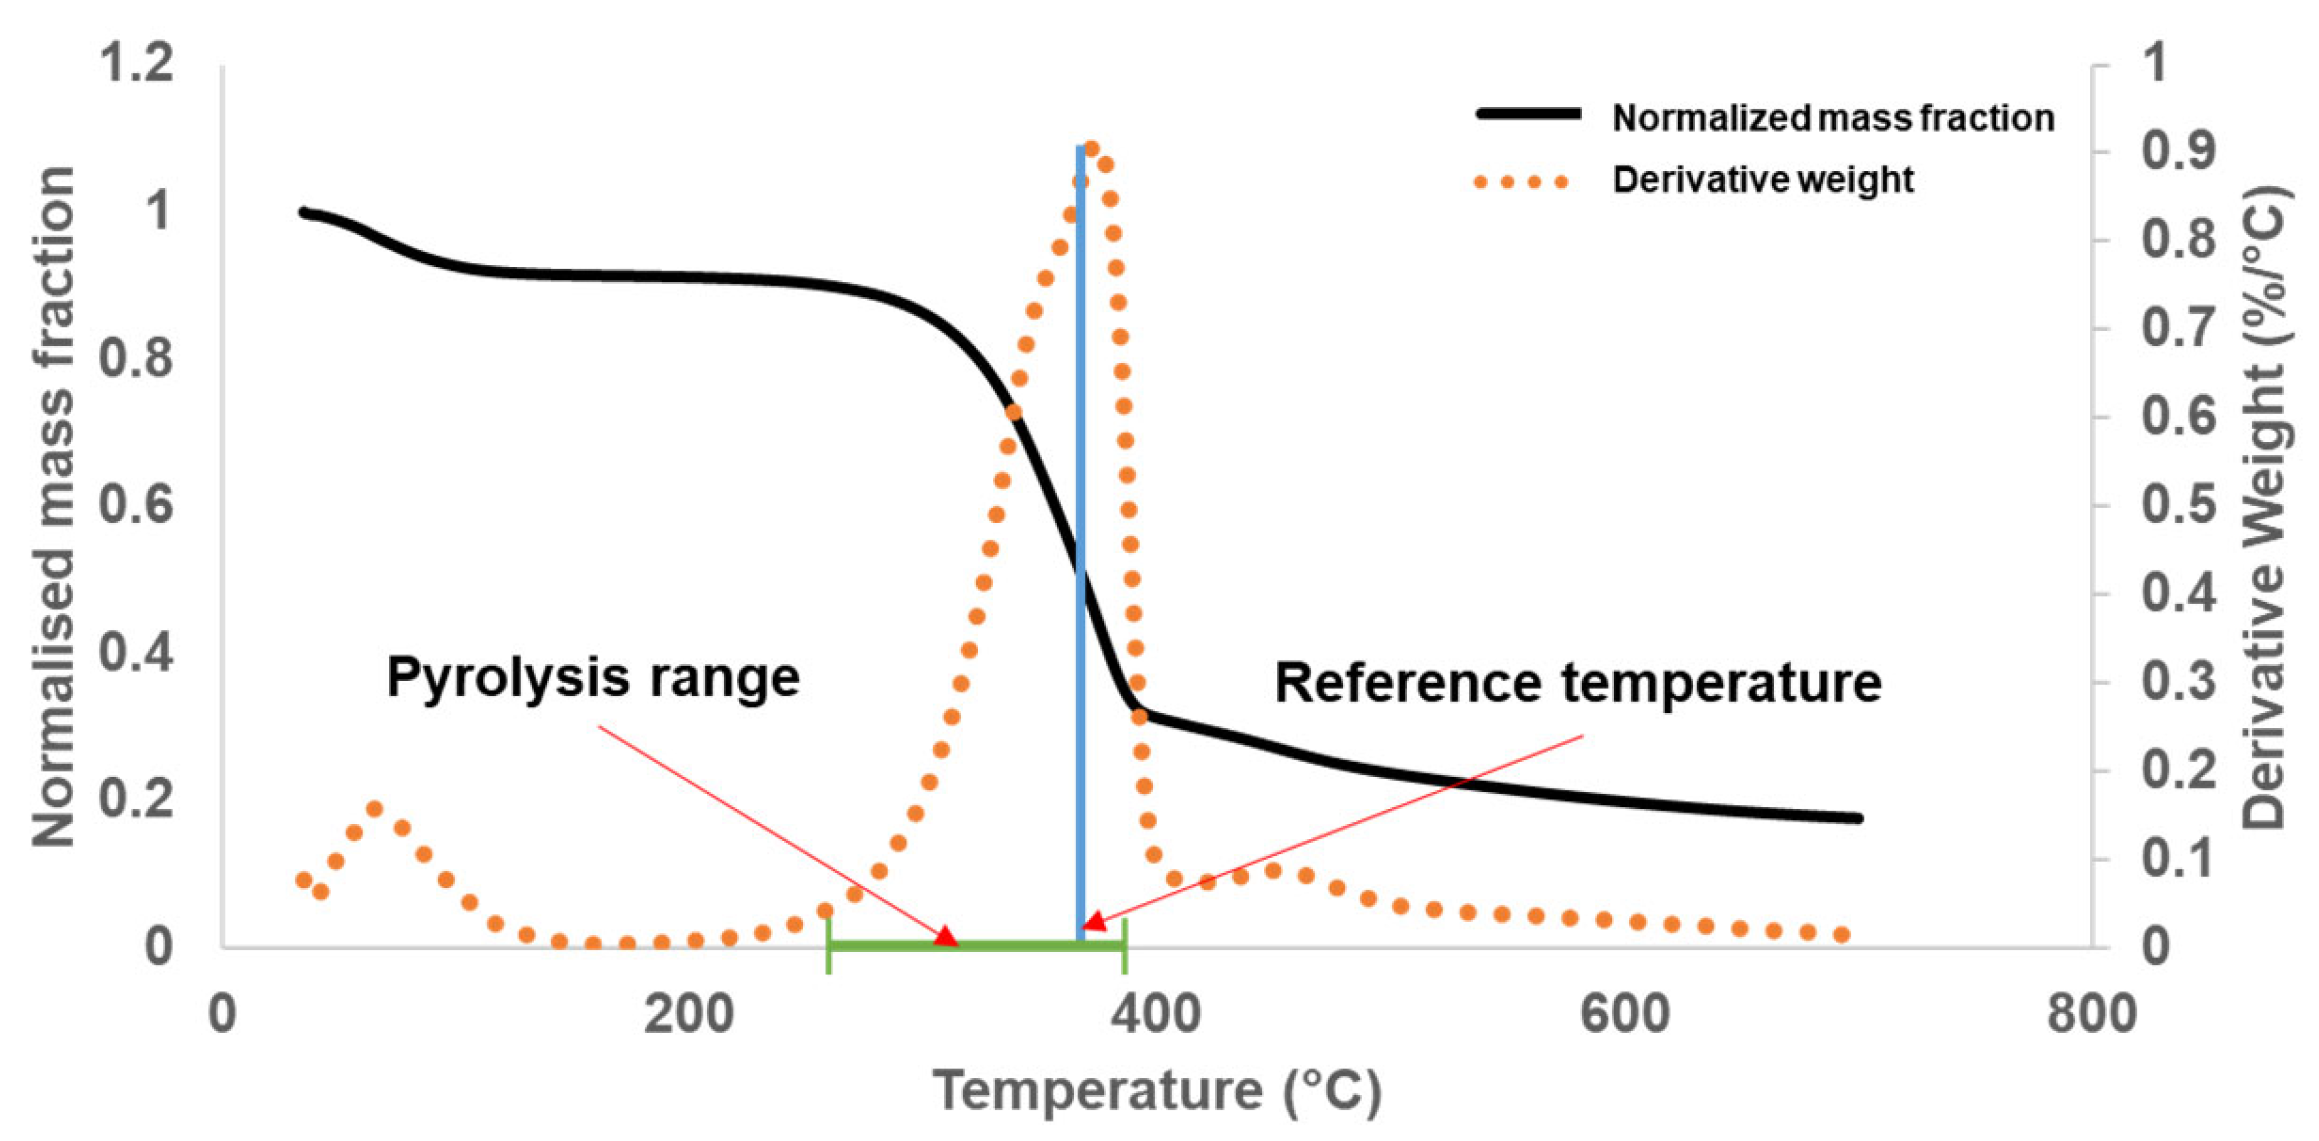
| Reference Temperature | °C | 374 | TGA |
| Reaction Rate (rP) | s−1 | 0.002 | TGA |
| Heating Rate (Ṫ) | K/min | 5 | TGA |
| Exponential constant (e) | - | 2.718 | [31] |
| Universal Gas Constant (R) | - | 8.314 | [31] |
| Mass Fraction (Ys) (no. of reactions) | - | 1 | [31] |
| Pre-exponential Constant (A) | 1/s | 1.07 × 10⁶ | TGA/DSC |
| Activation Energy (E) | J/mol | 4.67 × 10⁴ | TGA/DSC |
| Pyrolysis Range | °C | 284–399 | TGA |
| Auto-ignition Temperature | °C | 35 kW/m2: 428 | Cone calorimeter (tested without igniter) |
| 50 kW/m2: 329 | |||
| 65 kW/m2: 318 | |||
| Surface Temperature of Burner | °C | 35 kW/m2: 750 | Cone calorimeter (tested without igniter) |
| 50 kW/m2: 830 | |||
| 65 kW/m2: 900 |
| Type of Variation | Experimental | Numerical |
|---|---|---|
| Time to ignition (tIg) | tIg@35 = 1.73 tIg@50 | tIg@35 = 1.74 tIg@50 |
| tIg@50 = 1.55 tIg@65 | tIg@50 = 1.59 tIg@65 | |
| tIg@35 = 2.68 tIg@65 | tIg@35 = 2.78 tIg@65 | |
| Ignition temperature (TIg) | TIg@35 = 0.95 tIg@50 | TIg@35 = 0.93 TIg@50 |
| TIg@50 = 0.9 TIg@65 | TIg@50 = 0.93 TIg@65 | |
| TIg@35 = 0.86 TIg@65 | TIg@35 = 0.87 TIg@65 | |
| PHRR | PHRR@35 = 0.78 PHRR@50 | PHRR@35 = 0.78 PHRR@50 |
| PHRR@50 = 0.98 PHRR@65 | PHRR@50 = 0.98 PHRR@65 | |
| PHRR@35 = 0.76 PHRR@65 | PHRR@35 = 0.76 PHRR@65 | |
| Time to PHRR (tPHRR) | tPHRR@35 = 1.38 tPHRR@50 | tPHRR@35 = 1.11 tPHRR@50 |
| tPHRR@50 = 1.23 tPHRR@65 | tPHRR@50 = 1.24 tPHRR@65 | |
| tPHRR@35 = 1.71 tPHRR@65 | tPHRR@35 = 1.38 tPHRR@65 | |
| Time to flameout (tf) | tf@35 = 1.28 tf@50 | tf@35 = 1.33 tf@50 |
| tf@50 = 1.27 tf@65 | tf@50 = 1.23 tf@65 | |
| tf@35 = 1.64 tf@65 | tf@35 = 1.64 tf@65 | |
| Burn time (tb) | tb@35 = 1.38 tb@50 | tb@35 = 1.11 tb@50 |
| tb@50 = 1.23 tb@65 | tb@50 = 1.19 tb@65 | |
| tb@35 = 1.71 tb@65 | tb@35 = 1.33 tb@65 |
Disclaimer/Publisher’s Note: The statements, opinions and data contained in all publications are solely those of the individual author(s) and contributor(s) and not of MDPI and/or the editor(s). MDPI and/or the editor(s) disclaim responsibility for any injury to people or property resulting from any ideas, methods, instructions or products referred to in the content. |
© 2024 by the authors. Licensee MDPI, Basel, Switzerland. This article is an open access article distributed under the terms and conditions of the Creative Commons Attribution (CC BY) license (https://creativecommons.org/licenses/by/4.0/).
Share and Cite
Chanda, A.; Das, O.; Bhattacharyya, D. Experimental and Numerical Studies on the Fire Performance of Thin Sustainable Wood-Based Laminated Veneers. Sustainability 2024, 16, 7188. https://doi.org/10.3390/su16167188
Chanda A, Das O, Bhattacharyya D. Experimental and Numerical Studies on the Fire Performance of Thin Sustainable Wood-Based Laminated Veneers. Sustainability. 2024; 16(16):7188. https://doi.org/10.3390/su16167188
Chicago/Turabian StyleChanda, Avishek, Oisik Das, and Debes Bhattacharyya. 2024. "Experimental and Numerical Studies on the Fire Performance of Thin Sustainable Wood-Based Laminated Veneers" Sustainability 16, no. 16: 7188. https://doi.org/10.3390/su16167188
APA StyleChanda, A., Das, O., & Bhattacharyya, D. (2024). Experimental and Numerical Studies on the Fire Performance of Thin Sustainable Wood-Based Laminated Veneers. Sustainability, 16(16), 7188. https://doi.org/10.3390/su16167188