Article

A Numerical Investigation of the Effects of Wave-Induced Soil Deformation on Solute Release from Submarine Sediments

1
Shandong Provincial Key Laboratory of Marine Environment and Geological Engineering, Ocean University of China, Qingdao 266100, China
2
College of Environmental Science and Engineering, Ocean University of China, Qingdao 266100, China
3
College of Civil Engineering, Qingdao University of Technology, Qingdao 266033, China
4
College of Harbor, Coastal and Offshore Engineering, Hohai University, Nanjing 210098, China
*
Author to whom correspondence should be addressed.
Sustainability 2024, 16(16), 7177; https://doi.org/10.3390/su16167177
Submission received: 6 June 2024 / Revised: 5 August 2024 / Accepted: 19 August 2024 / Published: 21 August 2024
(This article belongs to the Section Hazards and Sustainability)

Abstract

:
The sustainable development of marine environments requires a deep understanding of their chemical and biological conditions. These are significantly impacted by the exchange of substances such as contaminants, heavy metals, and nutrients between marine sediments and the water column. Although the existing literature has addressed the physics of enhanced solute migration in sediment due to sea waves, the role of coupled flow and soil deformation has often been neglected. This study investigates the effects of wave-induced soil deformation on solute release from the marine sediment using a coupled numerical model that incorporates the effect of soil deformation into the advection–diffusion equation. The results reveal that solute release is notably accelerated in deformable sediments with a smaller shear modulus, with the longitudinal dispersion coefficient increasing up to five times as the shear modulus decreases from 108 Pa to 106 Pa. This enhancement is more pronounced in shallow sediments as the sediment permeability decreases, where the longitudinal dispersion coefficient in deformable sediments can be 15 times higher than that in non-deformable sediments at a hydraulic conductivity of 1 × 10⁻⁵ m/s. Furthermore, the rate of solute release increases with decreasing sediment saturation due to the compressibility of pore water, although this rate of increase gradually diminishes.

1. Introduction

Natural processes or anthropogenic activities can cause exchanges of solutes such as pollutants, heavy metals, and nutrients between the marine sediments and the overlying seawater through advection, molecular diffusion, or mechanical dispersion [1]. Solutes can accumulate in sediments due to their transport from overlying seawater, biological activity in sediments, and other processes [2]. As a result, sediments with high concentrations of solutes can become a “source” from which solutes are released into the overlying seawater through hydrodynamic dispersion or advection under waves and currents, which is an important physical process affecting the marine environment [2,3]. Understanding the characteristics and physical mechanism of solute exchange between submarine sediments and the water column is crucial for assessing the chemical and biological conditions in seawater and sediment, which is significant for the sustainable development of marine environments.
In estuaries and coastal areas, solute can be transported into or released from sediments due to pore water motion induced by differential pressure at the seabed surface due to hydrodynamics such as waves, currents, and tides [4,5,6]. Field experiments and laboratory results have demonstrated that the wave-enhanced dispersion coefficient can be two–three orders of magnitude larger than the value of molecular diffusion in sediments [7] and that the wave-induced liquefaction of the seabed may have a vital influence on solute release [8,9]. Bed forms (e.g., bed ripples or biogenic burrows) can accelerate the pore flow velocity, and the exchange of solute may occur mainly through advection under sea waves [10]. Even on smooth seabed without bed forms, where the net advective flux of solute is negligible due to equal quantities of pore water flow into and out of the sediments over a wave cycle [11,12], the effective diffusivity of solutes in permeable sediment may increase by up to four orders of magnitude compared to its molecular diffusion value due to wave-driven pore water flow [11].
Numerical simulations have also been conducted to investigate the migration and release of solutes from subaquatic sediments. A two-dimensional advection–diffusion equation (ADE) has been used by Boufadel et al. (2011) [13] to model the solute migration in a beach under the action of tides and waves. The results showed that the pollutant fluxes were enhanced by tides and waves. Qian et al. (2008, 2009) [14,15,16] conducted a series of modeling analyses using the ADE to investigate the effect of wave-induced interstitial flow on vertical solute transfer in sediments, suggesting that the enhancement of solute transfer by standing waves was greater than that by progressive waves. Considering the effect of the adsorption and desorption of solute, Cheng et al. (2013) [17] established a mathematical model by coupling the Navier–Stokes equation, Darcy equation, and solute transport equation (i.e., ADE). Their modeling for currents passing over a flat phosphorus-contaminated bed showed that the instantaneous concentration through convection diffusion can be 6–50 times larger than the value of molecular diffusion during initial stages, and that decreasing particle size can increase the release of phosphorus due to the greater adsorption/desorption capacity of sediment with a smaller particle size. Numerical simulations of solute release from sediments where a current crossed bed ripples on the sediment surface showed that the bedform-induced pore water flow in sediments greatly contributed to the solute transfer into the water column [18,19]. The effects of non-Darcy flow on solute exchange between the sediment and overlying water under waves have been investigated by Habel and Bagtzoglou (2005) [20] and Higashino and Stefan (2011) [21] using the ADE. They concluded that the non-Darcy pore water flow can have a prominent effect on solute migration only when the hydraulic conductivity is larger than 0.01 m/s. Recently, Liu et al. (2023) [22] conducted numerical simulations on solute release from a flat seabed driven by accumulated pore water pressures under sea waves, indicating that the seepage flow associated with accumulated pore pressure greatly enhanced the rate at which the solute transported out of the seabed.
However, the numerical investigations mentioned above have often neglected the impact of soil deformation, i.e., the expansion or contraction of the soil volume induced by external loads [23], which can significantly affect the seepage flow and subsequent solute migration. By combining Biot’s consolidation theory and ADE, researchers have extensively studied solute transport in deformable landfills influenced by gravitational forces, such as Wu et al. (2020) [24], Nomura et al. (2018) [25], Zhang et al. (2012) [26], and Peters and Smith (2002) [23]. Building on this foundation, Liu et al. (2022) [27] extended this approach to examine solute migration into deformable sediments from the overlying seawater under marine conditions, specifically focusing on the dynamics induced by surface water waves. However, there remains a lack of investigation on how wave-induced soil deformation affects the release of solute from a contaminated layer buried within sandy sediments.
The main objective of this study is to investigate the mechanism of non-reactive solute release from a solute layer embedded in deformable marine sediments driven by sea waves using a coupled numerical model. The mathematical formulations and model validations are first elaborated, followed by a discussion on the influential characteristics of soil deformation on solute release and transport. Finally, the performance of solute release and migration in marine sediment with various soil parameters is investigated.

2. Problem Description

Figure 1 shows the schematic diagram of the problem considered in this study. The origin of the coordinate system is located at the top left corner of the flat sediment bed, which is characterized by a relatively even surface without large dunes, steep slopes, or micro-topography such as ripple marks. The sediment bed has a thickness of h, with the x-axis extending along the seabed surface (i.e., the interface between seawater and sediment) in the positive rightward direction. The positive direction of the y-axis is oriented upward.
The deformable porous sediment is assumed to be elastic, isotropic, homogenous, and highly saturated. The gas in pores is considered dissolved or enclosed in water as tiny bubbles, so the pore fluids (e.g., gas and water) in the sediment pores are treated as one fluid, i.e., the pore water, with its compressibility depending on the gas content or saturation [28]. A contaminated soil layer with a thickness of hs is embedded at a depth of ds from the sediment surface. The initial concentration of solute in the contaminated soil layer is assumed to be c s 0 = 1.0   mg / L . The initial concentration of solute in other areas, including the sediment and seawater, is assumed to be zero.
Regular progressive waves with wave height Hw and wave length Lw travel over the flat sediment bed, resulting in relatively high wave pressure under the crest and relatively low pressure under the trough on the seabed surface, as shown in Figure 1. As the wave propagates, it will cause oscillatory seabed responses, such as cyclic soil displacements and cyclic pore water flow due to the periodic wave pressure and the pressure gradients [28,29]. Consequently, the net exchange pore water flux is zero, and this means the net solute flux by advection in a wave period is negligible, while the solute migration depends mainly on the hydrodynamic dispersion [5,11,22,27].
This study focuses on the effects of wave-induced oscillatory soil deformation on non-reactive solute transport and release from marine sediments. Two main physical processes are involved in this problem, i.e., the oscillatory seabed response, including the coupled effect of soil deformation and pore water seepage, and the solute migration in sediments. The oscillatory seabed response can be described using Biot’s consolidation theory, where the pore water seepage follows Darcy’s law [28,29]. The conventional advection–diffusion theory is used to describe the process of solute migration and release from sediments. The wave pressure on the sediment surface is calculated according to the Airy wave theory [30].
It should be noted that the sediment particles may be resuspended and redeposited under wave action [31], which may affect seepage, solute migration, and release. This additional complexity is an important factor that should be considered in future studies.

3. Mathematical Model and Validation

3.1. Governing Equations

The detailed governing equations, including Biot’s consolidation equations and the advection–dispersion equation (ADE), have been described in Liu et al. (2022) [27]. The primary equations are summarized as follows.
The Biot’s consolidation equations are expressed as [32]
G 2 w x + G 1 2 μ   ε x = p x
G 2 w y + G 1 2 μ   ε y = p y
k γ w 2 p x 2 + 2 p y 2 n 0 β p t = ε t
where w x and w y are soil displacements in the x - and y -directions, μ is Poisson’s ratio, G is shear modulus of sediment, p is oscillatory pore water pressure induced by waves, γ w is the unit weight of water, n 0 is the porosity of sediment, t is time, and k is the hydraulic conductivity.
ε in Equation (1) represents the volumetric strain of seabed soil (negative denotes compression), i.e.,
ε   =   w x x + w y y
β in Equation (3) is the compressibility of pore fluid expressed as [28]
β = 1 K w 0 + 1 S r P w 0
where Kw0 is the true bulk modulus of water, 2 × 10⁹ N/m2, Pw0 denotes the absolute pore water pressure, and Sr is the degree of saturation of sediment.
The seepage velocity in x- and y-directions can be expressed, respectively, as
u = k n 0 S r   γ w p x ;   v = k n 0 S r   γ w p y
For cases of non-deformable (i.e., rigid) porous sediment, the governing equation for the seepage velocity field of pore water can be obtained from Equation (3), with the volumetric strain being zero and the pore water being incompressible, i.e.,
2 p x 2 + 2 p y 2 = 0
The two-dimensional ADE for solute transport in deformable sediments can be written as [23,33]
c t = ( u + u s ) c x ( v + v s ) c y + x D x x c x + D x y c y + y D y y c y + D y x c x
D x x = α L u u V + α T v v V + D e m D x y = D y x = α L α T u v V + D e m D y y = α L v v V + α T u u V + D e m
where c is the solute concentration in pore water, u s = w x / t , v s = w y / t are velocities of the soil skeleton, and D x x , D y y , D x y , and D y x are components of the tensor of hydrodynamic dispersion coefficient D . D e m is the effective coefficient of molecular diffusion, taken as 1 × 10   9 m 2 / s [13,34]. V = u 2 + v 2 , α L is the longitudinal dispersivity of the sediment, approximately taken as the mean particle size [13], α T = α L / 3 , indicating the transverse dispersivity of the sediment [14].
Compared to the solute equation for non-deformable sediment, the solute transport equation of a deforming one includes the soil velocity in advective terms and the pore water velocity that reflects the coupled effect of pore fluid seepage and soil deformation.

3.2. Boundary Conditions

At the surface of the sediment bed (y = 0), the wave pressure Pb equal to the wave-induced pore water pressure is determined based on the Airy wave theory [30], i.e.,
p x , 0 , t = P b ( x , t ) = P 0 cos k w x ω t
where P 0 = γ w H w / 2 cosh k w   d w denotes the amplitude, k w = 2 π / L w is the wave number, and ω = 2 π / T w is the wave frequency. The wavelength is calculated by the dispersion equation of the Airy wave theory as follows
L w = g T w 2 tanh k w   d w / 2 π
Moreover, the solute concentration at the sediment surface is assumed as zero, which means that the solute released from the sediment will be diluted immediately by the vast ocean water [18].
At the bottom of the sediment (y = −h), no displacements, seepage flow, or solute flux are assumed, i.e.,
p x , h , t y = 0 , w x   x , h , t = w y x , h , t = 0 ,   c y = 0
For the lateral sides of the seabed ( x = 0 and x = L w ), periodic boundary conditions are applied:
p x = 0 = p x = L w ,   w x x = 0 = w x x = L w ,   w y x = 0 = w y x = L w ,   c x = 0 = c x = L w

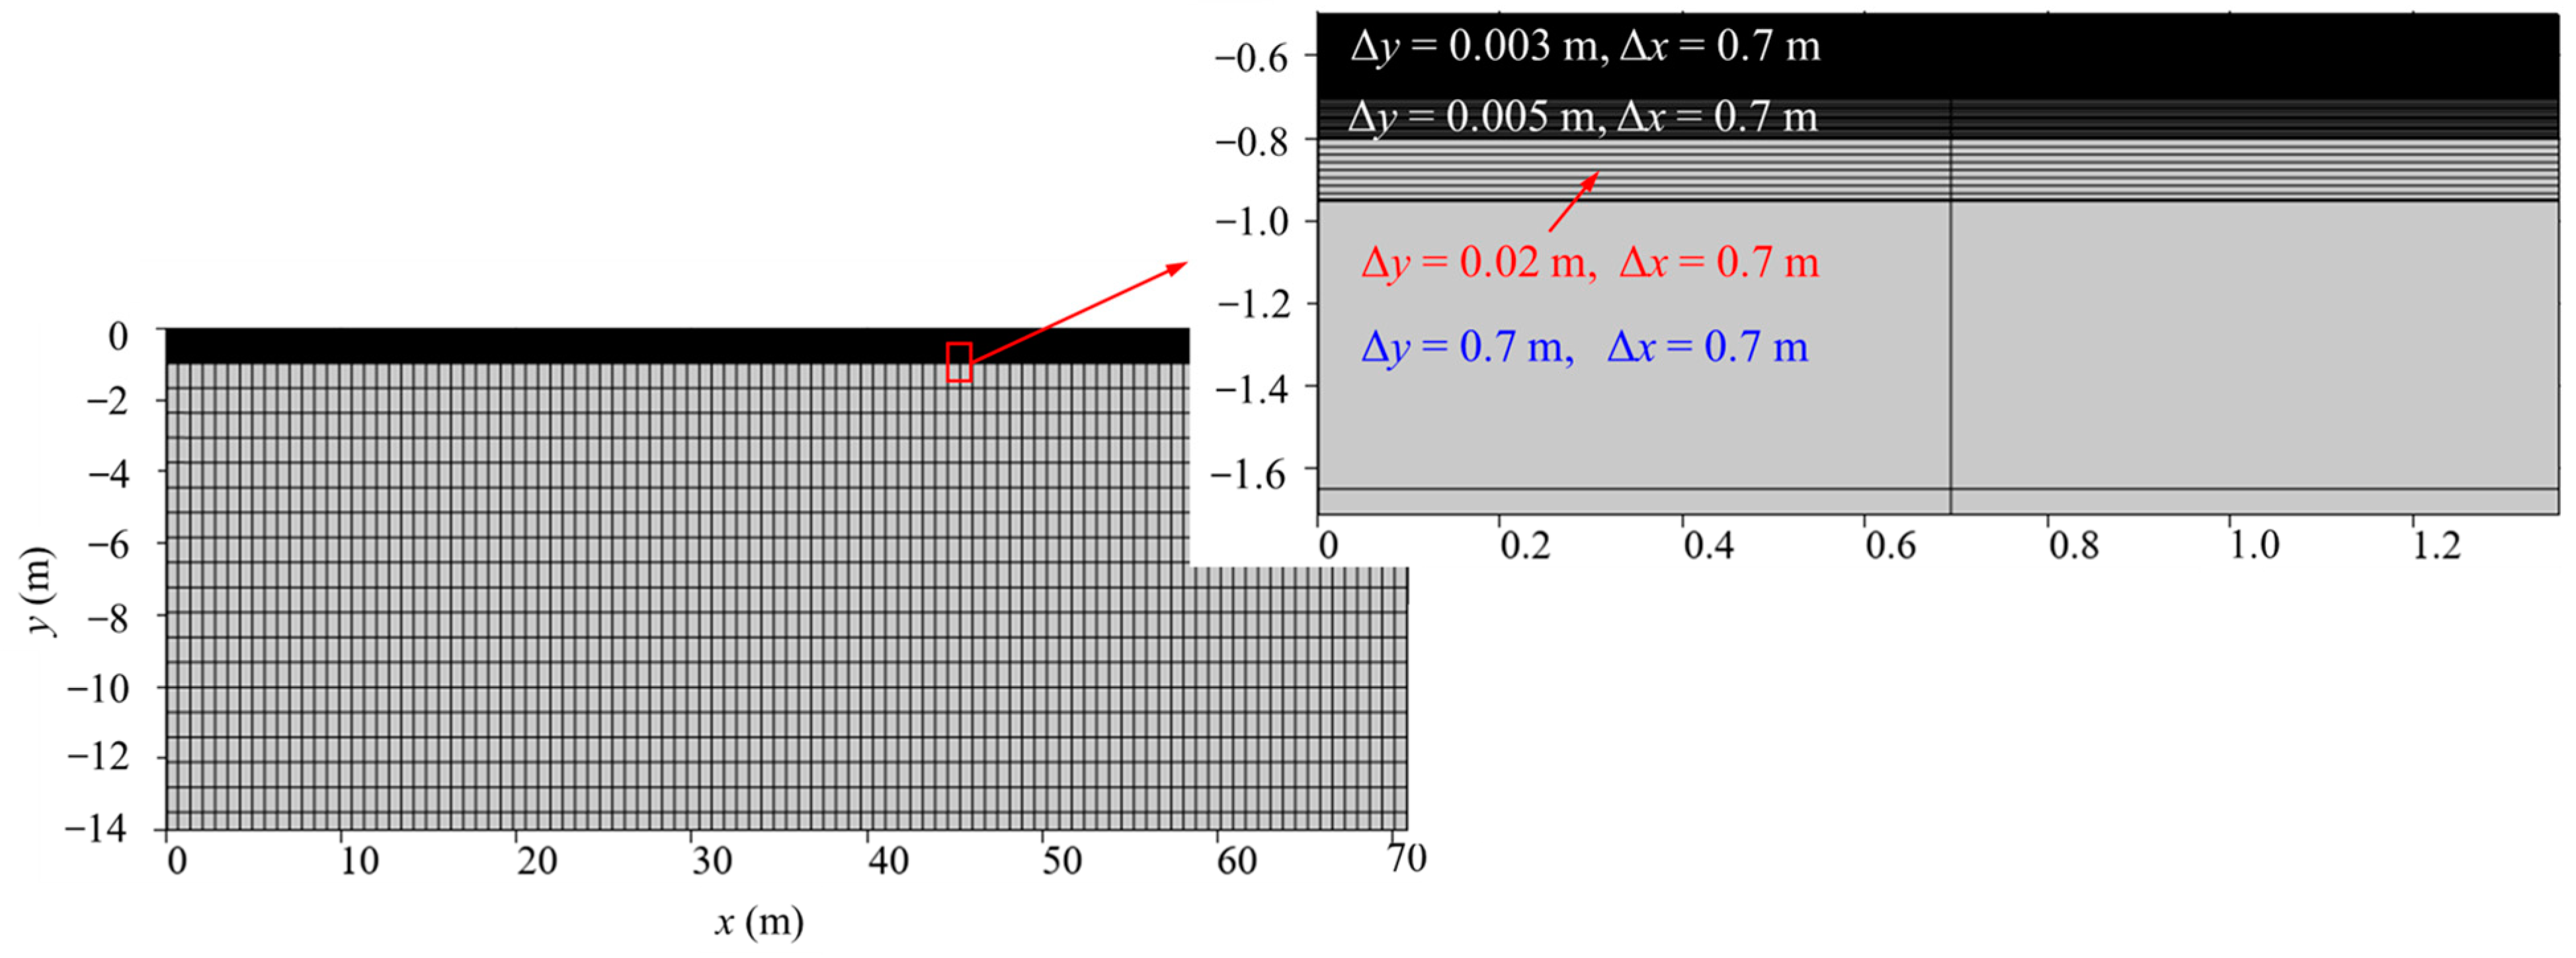
3.3. Numerical Implementation and Validations

The governing equations and boundary conditions are implemented within the Comsol Multiphysics® environment (Version 5.5) using the PDE (Partial Differential Equation) module. As shown in Figure 2, quadrilateral mapping grids are employed to discretize the computational domain where the vertical size of grids (Δy) in the area with solute migration is in the order of millimeters. The vertical size of the grids (Δy) increases gradually from the minimum size of 0.003 m in the solute layer to the maximum size of 0.7 m in the area far from the solute layer, while the horizontal size of the grids (Δx) is constant, at a size of 0.7 m. The grids have been refined until they have no influence on the results. There are a total of 30,396 elements in the numerical model used for the simulation in Section 4.
The timestep size is auto-determined by the program based on error analysis. By solving Equations (1)–(3) and (8), the oscillatory soil displacement, seepage field, and solute concentration field can be obtained. For non-deformable sediment, the seepage field and solute concentration can be determined by solving Equations (7) and (8).
The mathematical model has been rigorously validated against a variety of experimental results related to wave-induced seepage field and solute migration in both deformable and non-deformable sediments. For detailed information on these validations, the readers can refer to Liu et al. (2022) [27].

4. Results and Discussion

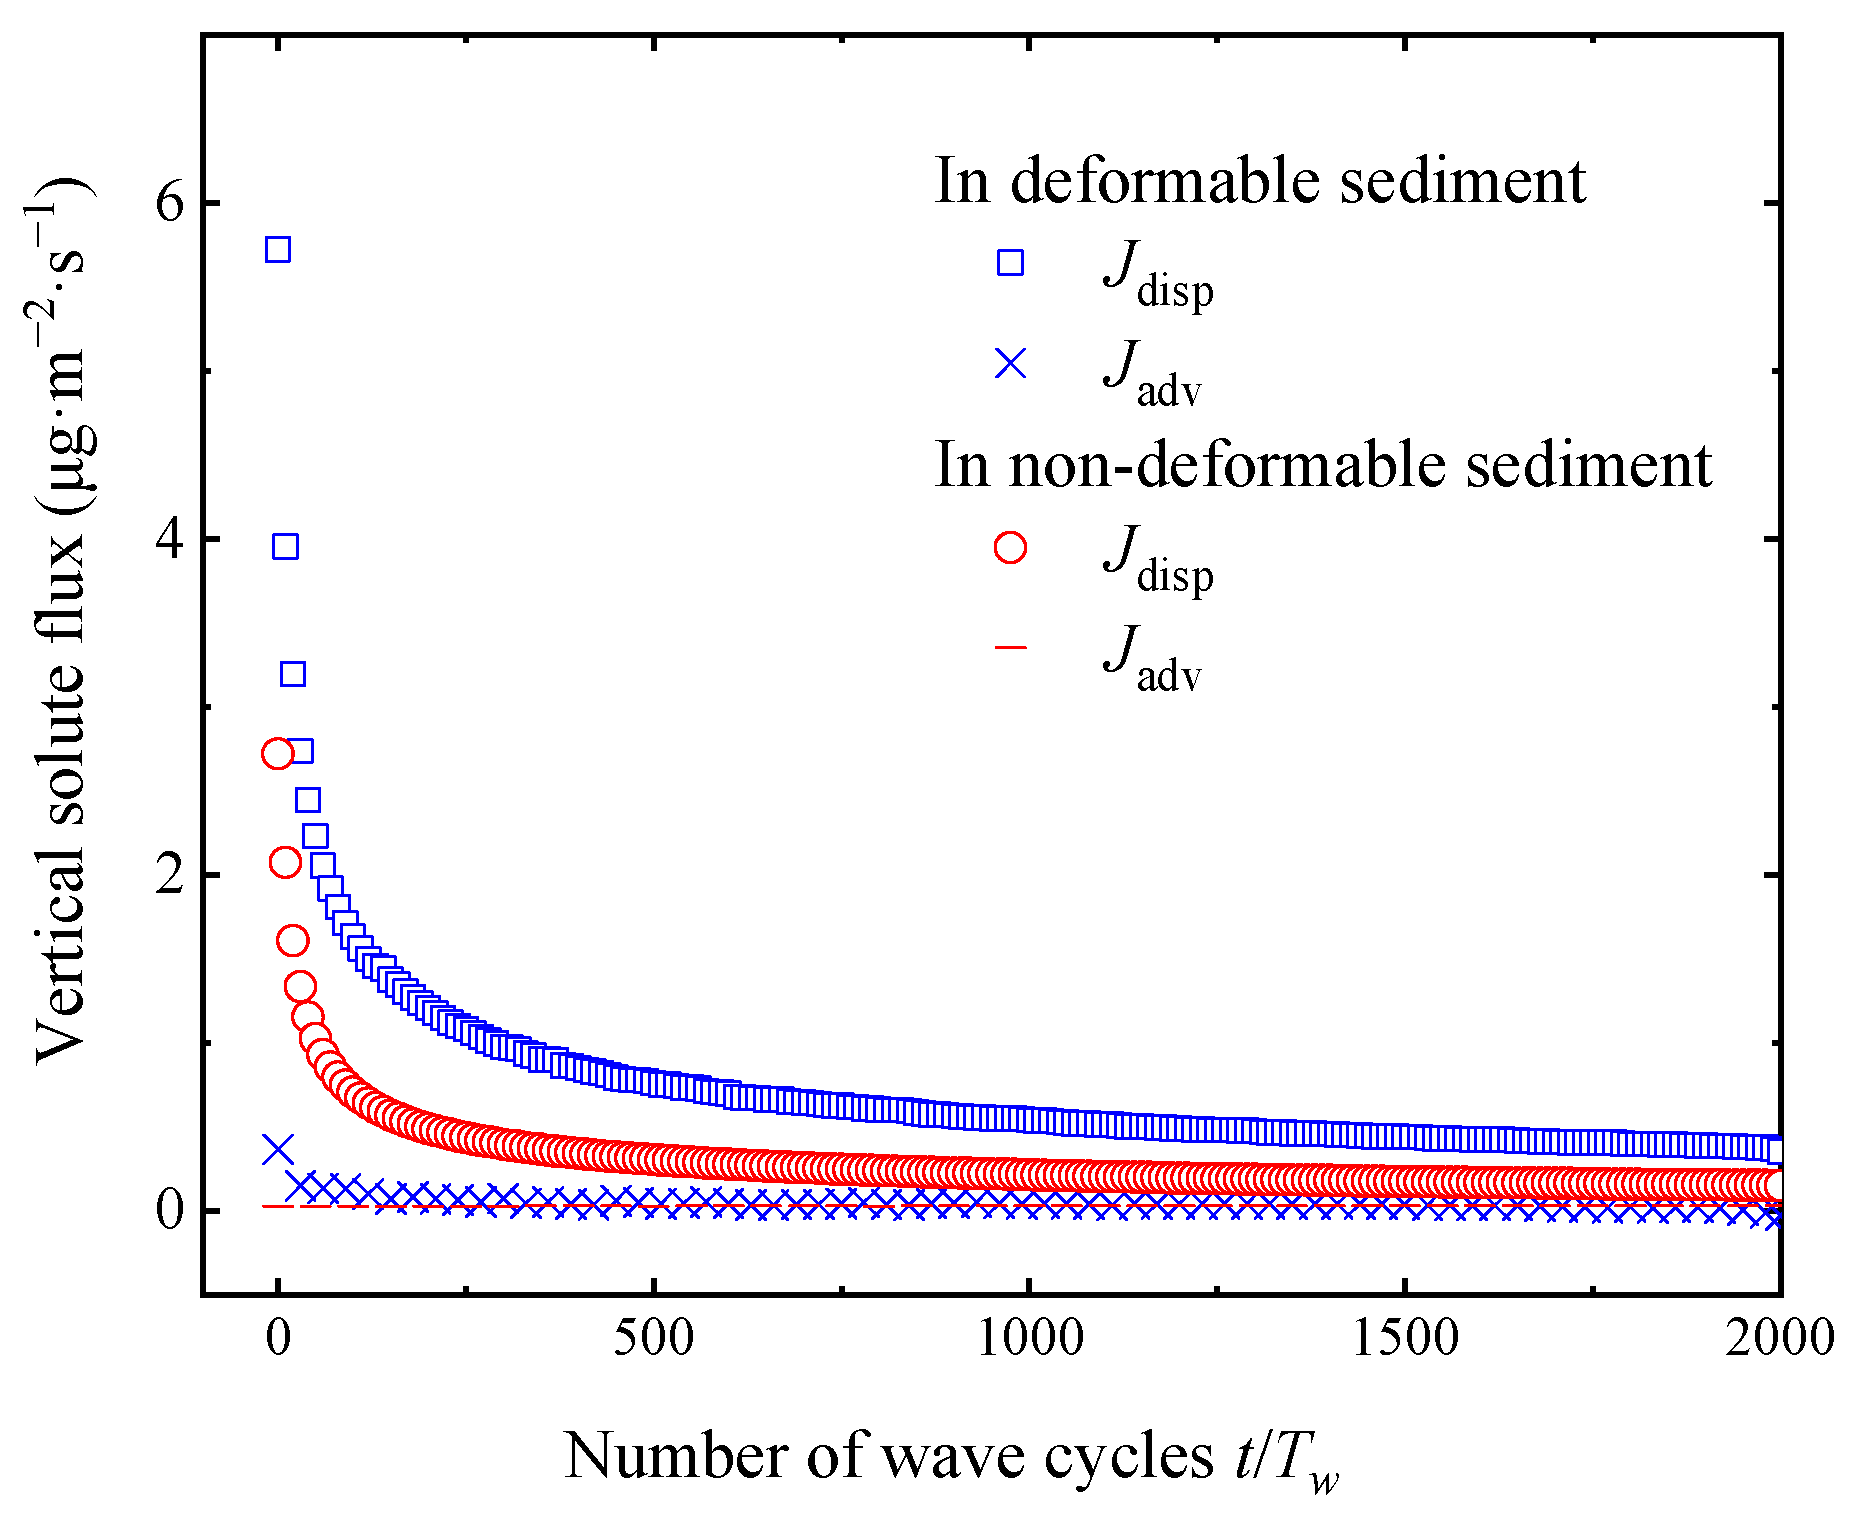
4.1. The Effect of Soil Deformation on Characteristics of Solute Release and Transport

The wave and sediment parameters used for numerical simulation are tabulated in Table 1. The distance from the seabed surface to the upper boundary of the solute layer is ds = 0.1 m in the initial state, and the thickness of the solute layer is hs = 0.5 m (Figure 1).
Due to the uniform distribution of solute in the horizontal (x) direction, there is no concentration gradient horizontally, resulting in solute transport occurring predominantly in the vertical direction. The vertical solute flux, which includes both the vertical advective flux and dispersive flux, refers to the averaged flux with which the solute moves vertically through a horizontal plane within the seabed. This can be calculated as follows:
J a d v = n 0   S r L w 0 L w ( v   c )   d x
J d i s p = n 0   S r L w 0 L w D y y c y + D y x c x d x
where Jadv represents the vertical advective flux and Jdisp represents the vertical dispersive flux. A positive value indicates upward transport towards the interface of the seabed and the overlying water, while a negative value indicates downward transport towards the bottom of the sediment bed.
Figure 3 presents the time histories of vertical hydrodynamic dispersive flux and advective flux through the upper boundary of the solute layer in both deformable and non-deformable sediments. The rate of solute migration upwards is most significant during the first few tens of wave cycles, then quickly attenuates until reaching a stable state. This can be explained by the rapidly decreasing gradient of solute concentration due to the upward solute transport at the upper boundary of the solute layer. The release flux of solute in a deformable seabed is consistently higher than in a non-deformable seabed due to the volumetric changes in the soil that facilitate pore water seepage. The advective fluxes are almost zero, indicating that the wave-induced solute migration in a flat seabed mainly depends on the hydrodynamic dispersion. This observation aligns with the findings of Harrison et al. (1983) [11] and Webster (2003) [12], who noted that the average displacement of pore water over a wave period is zero.
Figure 4 shows the vertical distribution of solute concentration after 2000 wave cycles. It reveals that the solute migrates outward toward the upper and lower boundaries of the solute layer due to the vertical gradient of solute concentration while following the conservation of mass. For example, the solute concentration in the solute layer (Layer II) gradually decreases while it increases in Layers I and III. The rate of solute transport in deformable sediment is faster than in non-deformable sediment, particularly at shallow depths. As shown in Figure 5, near the upper boundary of the solute layer (i.e., 0.01 m below the upper boundary of the solute layer), the solute concentration in deformable sediment decreases about twice as fast as in non-deformable sediment. Near the lower boundary (i.e., 0.01 m above the lower boundary of the solute layer), the rate of decrease in deformable sediment is about 1.6 times that of non-deformable sediment. This difference is likely attributable to the effects of wave-induced soil deformation on the seepage velocity, which may diminish with depth. This will be discussed in detail in the following sections.

4.2. The Physical Mechanism for the Effect of Soil Deformation on Solute Release

The extent of soil deformation can be well presented by its volumetric strain. As shown in Figure 6a, shallow depths experience more significant deformation, attaining peak volumetric strain at the seabed surface, which attenuates rapidly with depth. For saturated sediment, the compressibility of pore fluid is too small to be neglected. According to Biot’s theory of consolidation, the magnitude of the volumetric deformation of the soil skeleton reflects the amount of change in water content per unit volume of soil. A larger volumetric strain indicates a greater change in water content per unit soil volume, faster seepage velocity of the pore water, and a larger gradient of pore water pressure, as shown in Figure 6b. Therefore, the vertical gradient of pore water pressure in shallow soil layers is significantly larger in deformable sediment compared to that in non-deformable sediment.
Figure 7a,b illustrate the time histories of pore water velocity in both deformable and non-deformable sediments. It is evident that the vertical velocity of pore water in deformable sediment is much greater than that in non-deformable sediment, while the horizontal velocity of pore water shows a minimum difference. Correspondingly, the amplitude of the longitudinal dispersion coefficient ( D y y ) is much larger than that of the transverse dispersion coefficient ( D x x ) in the deformable seabed, as shown in Figure 7c,d. Specifically, the amplitude of the longitudinal dispersion coefficient in deformable sediments is about seven times that in non-deformable sediments, whereas the transverse dispersion coefficient is about twice that in non-deformable sediments. Since wave-induced solute migration occurs mainly in the longitudinal direction through hydrodynamic dispersion for the flat seabed considered in this study, wave-induced soil deformation can significantly affect the rate of solute migration.
The vertical distributions of the amplitude of the vertical seepage velocity of pore water and the longitudinal dispersion coefficient are presented in Figure 8a,b, respectively. There is a high consistency between the distributions of vertical seepage velocity and longitudinal dispersion coefficient in depth. In accordance with volumetric strain and pore water pressure, vertical seepage velocity and the longitudinal dispersion coefficient are mainly enhanced in shallow soil layers in deformable sediment, with the amplitude of longitudinal dispersion being approximately seven times that of non-deformable sediment. This explains why the effect of soil deformation on solute release is more significant in shallow soil layers and diminishes at deeper locations.

4.3. The Effects of Sediment Parameters

4.3.1. The Effects of Soil Shear Modulus

The soil shear modulus G can represent the ability of soil to deform. In general, the shear modulus of sediment ranges from 1 × 10⁶ Pa to 1 × 10⁹ Pa [28]. Based on the parameters in Table 1, various shear moduli are used for numerical simulations to investigate the effect of shear modulus on soil deformation and, further, the solute release.
As shown in Figure 9, the soil shear modulus has a pronounced influence on solute migration and release by affecting soil deformation, particularly within the range of 106 Pa to 108 Pa. Increasing the shear modulus leads to a significant decrease in both volumetric strain and the amplitude of the longitudinal hydrodynamic dispersion coefficient in shallow soil layers (up to 3 m deep). This reduction results in a slower rate of solute transport and higher solute concentration, especially near the upper boundary of the solute layer. For example, as the shear modulus decreases from 5 × 10⁸ Pa to 5 × 10⁷ Pa, the maximum longitudinal dispersion coefficient, which typically represents the solute migration rate, increases from 1.0 × 10⁻⁸ m2/s to 1.9 × 10⁻⁸ m2/s, an increase of approximately 90%. Further decreasing the shear modulus from 5 × 10⁷ Pa to 5 × 10⁶ Pa results in the maximum longitudinal dispersion coefficient increasing from 1.9 × 10⁻⁸ m2/s to 5.1 × 10⁻⁸ m2/s, an increase of about 170%. When the shear modulus is increased to 5 × 10⁸ Pa or higher, the volumetric strain becomes minimal, and the longitudinal hydrodynamic dispersion coefficient changes little with the variation of the shear modulus. At this time, changes in the shear modulus have little impact on solute concentration at both the upper and lower boundaries of the solute layer.

4.3.2. The Effects of Soil Permeability

Drainage conditions can influence the coupled flow and soil deformation, thereby affecting solute release. Numerical simulations are conducted to analyze the effect of drainage conditions on solute release and migration for soil hydraulic conductivity, varying from 1 × 10⁻³ m/s to 1 × 10⁻⁵ m/s.
As shown in Figure 10a,b, the solute release and migration is more pronounced with higher pore water movement through sediment under good drainage conditions. As the permeability decreases, the reduction rate of solute concentration significantly drops. In non-deformable sediment, there is minimal difference in solute concentration between the upper and lower boundaries of the solute layer. However, in deformable sediment, the difference is substantial, especially when the permeability is relatively low.
Near the upper boundary of the solute layer, the effect of soil deformation on solute migration is more significant when permeability is low. For instance, in sediment with hydraulic conductivities of 1 × 10⁻³ m/s, 1 × 10⁻⁴ m/s, and 1 × 10⁻⁵ m/s, the reduction rate of solute concentration in deformable sediment is 1.1, 1.8, and 8.6 times greater than in non-deformable sediments, respectively. This occurs because, as shown in Figure 10c, when drainage is impeded, pore water is less likely to drain, resulting in deformation occurring mainly at shallow soil depths. This results in a dramatic increase in pore pressure gradient, and therefore the longitudinal dispersion coefficient of solute in the deformable sediment will have a greater increase compared to the non-deformable sediment as the soil permeability decreases. As shown in Figure 10d, the longitudinal dispersion coefficient at the mudline of a deformable sediment is about 2 times that of a rigid sediment for the hydraulic conductivity of 1 × 10⁻³ m/s, while it is about 15 times for the hydraulic conductivity of 1 × 10⁻⁵ m/s. Consequently, the effect of soil deformation on solute release and migration becomes more pronounced in shallow soil layers as permeability decreases.
Near the lower boundary of the solute layer, the enhancement of soil deformation for solute transport is more significant when the hydraulic conductivity is 1 × 10⁻⁴ m/s, compared to sediments with a hydraulic conductivity of 1 × 10⁻⁵ m/s. This is attributed to the dramatic attenuation of soil deformation with depth at a hydraulic conductivity of 1 × 10⁻⁵ m/s, indicating that although the effect of soil deformation on solute migration becomes more pronounced at a lower permeability, the influential depth of soil deformation decreases. In other words, soil deformation has a greater effect on solute migration in deeper layers when permeability is higher.

4.3.3. The Effects of Sediment Saturation

The pores in the seabed often contain a small amount of gas, resulting in a variation in the degree of saturation [35]. In the nearly fully saturated seabed, the appearance of gas will enhance the compressibility of pore fluid and further affect the seepage field and the solute migration. Therefore, with a degree of saturation of 0.94, 0.96, 0.98, and 1.0, numerical simulations were conducted to analyze the effects of saturation on solute release.
Figure 11a shows the vertical distribution of the amplitude of the difference in volumetric strain between the soil skeleton and pore fluid (i.e., Δ ε ) for various degrees of saturation. According to the mass conservation of pore fluid, this difference indicates the variation in the quantity of pore fluid per unit volume of soil, meaning an increase in Δ ε results in higher seepage velocity. In shallow soil layers (about 1.5 m deep), the amplitude of Δ ε increases as sediment saturation decreases, which meanwhile increases pore water velocity and the longitudinal dispersion coefficient, as shown in Figure 11b. At the seabed surface, for sediment saturations of 0.98, 0.96, and 0.94, the amplitude of the longitudinal dispersion coefficient is 2.3, 3.3, and 4.1 times that of fully saturated sediments, respectively. This variation in the longitudinal dispersion coefficient affects solute release and migration in sediment, as depicted in Figure 11c,d. The rate of solute migration increases as sediment saturation decreases, with the most significant impact observed when the degree of saturation drops from 1.0 to 0.98. At the top of the solute layer, changes in the degree of saturation have a more pronounced effect on solute migration, whereas, below a saturation of 0.96, the influence on downward solute migration is relatively smaller. This shows that the effect of sediment saturation on solute release occurs mainly in shallow soil layers.

5. Conclusions

Understanding the mechanisms of solute release from submarine sediments under ocean wave action is crucial for maintaining the sustainable development of the marine environment. In this study, a coupled mathematical model incorporating the coupled effects of soil deformation and seepage flow into the solute transport equation was used to investigate solute release from marine sediment under sea waves. The characteristics and mechanism of soil deformation on non-reactive solute release with different sediment parameters on a flat seabed were analyzed. The main conclusions are as follows:
(1)
The wave-induced deformation of the soil skeleton results in a steeper gradient of pore water pressure in depth and a larger enhancement of longitudinal dispersion in shallow soil layers compared to deeper soil layers. Consequently, solute near the upper layers of deformable sediment can be released more rapidly under sea waves, whereas in non-deformable sediment, there is less difference in solute migration rate along the depth.
(2)
Reducing the shear modulus significantly facilitates the enhancement of soil deformation for solute release and migration, particularly in shallow soil layers. With the shear modulus reducing from the order of 108 Pa to 106 Pa, the solute longitudinal dispersion coefficient, which largely indicates the solute transport rate, can increase to five times that corresponding to a shear modulus of 108 Pa. When the shear modulus reaches 1 × 10⁸ Pa or higher, variation in the shear modulus has a neglectable effect on solute migration.
(3)
High soil permeability enhances the effect of soil deformation on solute release and transfer to deeper locations, whereas low soil permeability makes the enhancement of soil deformation for solute migration in shallow soil layers more pronounced. At a hydraulic conductivity of 1 × 10⁻⁵ m/s, the longitudinal dispersion coefficient in deformable sediments can reach up to 15 times that of rigid porous sediments.
(4)
Decreasing sediment saturation increases the rate of solute release from marine sediments due to increased pore fluid compressibility. However, the rate of increase in solute release gradually decreases as the sediment saturation continues to decrease.

Author Contributions

Conceptualization, formal analysis, writing—original draft preparation, funding acquisition, X.L.; methodology, investigation, T.Y.; software, data curation, G.X.; formal analysis, writing—review and editing, H.Z. All authors have read and agreed to the published version of the manuscript.

Funding

The financial support by the National Natural Science Foundation of China (No. 42077237) and TaiShan Scholars (No. tsqn202312221) is appreciated.

Institutional Review Board Statement

Not applicable.

Informed Consent Statement

Not applicable.

Data Availability Statement

The data are available by contacting the corresponding author.

Conflicts of Interest

The authors declare no conflicts of interest.

References

  1. Mu, D.; Yuan, D.; Feng, H.; Xing, F.; Teo, F.Y.; Li, S. Nutrient fluxes across sediment-water interface in Bohai Bay Coastal Zone, China. Mar. Pollut. Bull. 2017, 114, 705–714. [Google Scholar]
  2. Couceiro, F.; Fones, G.R.; Thompson, C.E.L.; Statham, P.J.; Sivyer, D.B.; Parker, R.; Kelly-Gerreyn, B.A.; Amos, C.L. Impact of resuspension of cohesive sediments at the Oyster Grounds (North Sea) on nutrient exchange across the sediment-water interface. Biogeochemistry 2013, 113, 37–52. [Google Scholar]
  3. Percuoco, V.P.; Kalnejais, L.H.; Officer, L.V. Nutrient release from the sediments of the Great Bay Estuary, N.H. USA. Estuar. Coast. Shelf Sci. 2015, 161, 76–87. [Google Scholar]
  4. Precht, E.; Huettel, M. Rapid wave-driven advective pore water exchange in a permeable coastal sediment. J. Sea Res. 2004, 51, 93–107. [Google Scholar]
  5. Clark, J.J.; Qian, Q.; Voller, V.R.; Stefan, H.G. Hyporheic exchange in a gravel bed flume with and without traveling surface waves. Adv. Water Resour. 2019, 123, 120–133. [Google Scholar]
  6. Shum, K.T. Wave-induced advective transport below a rippled water-sediment interface. J. Geophys. Res. 1992, 97, 789–808. [Google Scholar]
  7. HHebert, A.B.; Sansone, F.J.; Pawlak, G.R. Tracer dispersal in sandy sediment porewater under enhanced physical forcing. Cont. Shelf Res. 2007, 27, 2278–2287. [Google Scholar]
  8. Xu, G.; Sun, Z.; Fang, W.; Liu, J.; Xu, X.; Lv, C. Release of phosphorus from sediments under wave-induced liquefaction. Water Res. 2018, 144, 503–511. [Google Scholar] [PubMed]
  9. Lu, F.; Zhang, H.; Jia, Y.; Liu, W.; Wang, H. Migration and diffusion of heavy metal Cu from the interior of sediment during wave-induced sediment liquefaction process. J. Mar. Sci. Eng. 2019, 7, 449. [Google Scholar] [CrossRef]
  10. Huettel, M.; Gust, G. Impact of bioroughness on interfacial solute exchange in permeable sediments. Mar. Ecol. Prog. Ser. 1992, 89, 253–267. [Google Scholar]
  11. Harrison, W.D.; Musgrave, D.; Reeburgh, W.S. A wave-induced transport process in marine sediments. J. Geophys. Res. 1983, 88, 7617–7622. [Google Scholar]
  12. Webster, I.T. Wave enhancement of diffusivities within surficial sediments. Environ. Fluid Mech. 2003, 3, 269–288. [Google Scholar]
  13. Boufadel, M.C.; Xia, Y.Q.; Li, H.L. Modeling solute transport and transient seepage in a laboratory beach under tidal influence. Environ. Modell. Softw. 2011, 26, 899–912. [Google Scholar]
  14. Qian, Q.; Voller, V.R.; Stefan, H.G. A vertical dispersion model for solute exchange induced by underflow and periodic hyporheic flow in a stream gravel bed. Water Resour. Res. 2008, 44, W07422. [Google Scholar]
  15. Qian, Q.; Clark, J.J.; Voller, V.R.; Stefan, H.G. Depth-dependent dispersion coefficient for modeling of vertical solute exchange in a lake bed under surface waves. J. Hydraul. Eng. 2009, 13, 187–197. [Google Scholar]
  16. Qian, Q.; Voller, V.R.; Stefan, H.G. Modeling of vertical solute dispersion in a sediment bed enhanced by wave induced interstitial flow. J. Am. Water Resour. Assoc. 2009, 45, 343–354. [Google Scholar]
  17. Cheng, P.D.; Zhu, H.W.; Fan, J.Y.; Fei, M.R.; Wang, D.Z. Numerical research for contaminant release from un-suspended bottom sediment under different hydrodynamic conditions. J. Hydrodyn. 2013, 25, 620–627. [Google Scholar]
  18. Feng, Z.G.; Michaelides, E.E. Secondary flow within a river bed and contaminant transport. Environ. Fluid Mech. 2009, 9, 617–634. [Google Scholar]
  19. Guo, J.H.; Cao, Y.; Zheng, S.J. Numerical research on the mechanism of contaminant release through the porous sediment-overlying water interface. J. Hydrodyn. 2014, 26, 971–979. [Google Scholar]
  20. Habel, F.; Bagtzoglou, A.C. Wave induced flow and transport in sediment beds. J. Am. Water Resour. Assoc. 2005, 41, 461–476. [Google Scholar]
  21. Higashino, M.; Stefan, H.G. Non-linear effects on solute transfer between flowing water and a sediment bed. Water Res. 2011, 45, 6074–6086. [Google Scholar] [PubMed]
  22. Liu, X.; Liu, S.; Zhao, H.; Jeng, D.S.; Guo, L.; Zheng, T. Numerical investigation of solute migration and release from sediments driven by wave-induced accumulation of pore water pressure. Adv. Water Resour. 2023, 179, 104508. [Google Scholar]
  23. Peters, G.P.; Smith, D.W. Solute transport through a deforming porous medium. Int. J. Numer. Anal. Meth. Geomech. 2002, 26, 683–717. [Google Scholar]
  24. Wu, S.; Jeng, D.S.; Seymour, B.R. Numerical modelling of consolidation-induced solute transport in unsaturated soil with dynamic hydraulic conductivity and degree of saturation. Adv. Water Resour. 2020, 135, 103466. [Google Scholar]
  25. Nomura, S.; Kawai, K.; Tachibana, S.; Iizuka, A. Solute transfer during consolidation based on a solid-fluid-solute coupling model. Int. J. Numer. Anal. Meth. Geomech. 2018, 42, 1172–1196. [Google Scholar]
  26. Zhang, H.J.; Jeng, D.S.; Seymour, B.R.; Barry, D.A.; Li, L. Solute transport in partially-saturated deformable porous media: Application to a landfill clay liner. Adv. Water Resour. 2012, 40, 1–10. [Google Scholar]
  27. Liu, X.; Zhao, H.; Liu, M.; Zheng, X.; Ye, T.; He, J. Numerical investigation of solute transport into deformable marine sediments driven by ocean waves. J. Hydrol. 2022, 615, 128713. [Google Scholar]
  28. Yamamoto, T. Sea bed instability from waves. In Proceedings of the OTC, the 10th Annual Offshore Technology Conference, Houston, TX, USA, 8–10 May 1978; pp. 1819–1828. [Google Scholar]
  29. Hsu, J.R.C.; Jeng, D.S. Wave-induced soil response in an unsaturated anisotropic seabed of finite thickness. Int. J. Numer. Anal. Meth. Geomech. 1994, 18, 785–807. [Google Scholar]
  30. Dean, R.G.; Dalrymple, R.A. Water Wave Mechanics for Engineers and Scientists; World Scientific: Singapore, 1991. [Google Scholar]
  31. Liu, X.; Zhu, F.; Zhao, H.; Zhou, J.; Liu, H.; Han, S. An experimental investigation into the evolving instability of a subaqueous mild silty slope under progressive waves. Ocean Eng. 2022, 262, 112209. [Google Scholar]
  32. Biot, M.A. General theory of three-dimensional consolidation. J. Appl. Phys. 1941, 12, 155–164. [Google Scholar]
  33. Gardiner, B.; Smith, D.; Pivonka, P.; Grodzinsky, A.; Frank, E.; Zhang, L. Solute transport in cartilage undergoing cyclic deformation. Comput. Method. Biomech. 2007, 10, 265–278. [Google Scholar]
  34. Brennen, C.E.; Imberger, J. The wave-induced solute flux from submerged sediment. Environ. Fluid Mech. 2014, 14, 221–234. [Google Scholar]
  35. Okusa, S. Wave-induced stresses in unsaturated submarine sediments. Géotechnique 1985, 4, 517–532. [Google Scholar]
Figure 1. Sketch of the physical problem (not to scale).
Sustainability 16 07177 g001
Figure 2. The mesh model used for numerical simulation in this study.
Sustainability 16 07177 g002
Figure 3. Comparison of time histories of vertical solute fluxes at the upper boundary of the solute layer between deformable and non-deformable sediments. Jadv is the vertical advective flux and Jdisp is the vertical dispersive flux.
Sustainability 16 07177 g003
Figure 4. Vertical distribution of the normalized solute concentration (t = 2000 Tw). c is the solute concentration and cs0 is the initial concentration of the solute layer.
Sustainability 16 07177 g004
Figure 5. Comparison of time histories of the normalized solute concentration in the solute layer between deformable and non-deformable sediments: (a) near upper boundary of the solute layer; (b) near lower boundary of the solute layer.
Sustainability 16 07177 g005
Figure 6. Comparison of vertical distributions of (a) the amplitude of soil volumetric strain in deformable and non-deformable sediments, and (b) the amplitude of normalized pore water pressure in deformable and non-deformable sediments.
Sustainability 16 07177 g006
Figure 7. Time histories of seepage velocity in non-deformable and deformable sediments (a,b) and dispersion coefficient in non-deformable and deformable sediments (c,d) at the depth of 0.1 m below the sea floor.
Sustainability 16 07177 g007
Figure 8. Comparison of vertical distributions of (a) the amplitude of vertical seepage velocity in deformable and non-deformable sediments, and (b) the amplitude of the longitudinal dispersion coefficient in deformable and non-deformable sediments.
Sustainability 16 07177 g008
Figure 9. The results for sediments with various shear moduli: (a) the vertical distribution of the amplitude of the volumetric strain of the soil skeleton; (b) the vertical distribution of the amplitude of the longitudinal dispersion coefficient Dyy; (c) time histories of solute concentration near the upper boundary of the solute layer; (d) time histories of solute concentration near the lower boundary of the solute layer.
Sustainability 16 07177 g009aSustainability 16 07177 g009b
Figure 10. The results for sediment with various permeabilities: (a) time histories of solute concentration near the upper boundary of the solute layer; (b) time histories of solute concentration near the lower boundary of the solute layer; (c) the vertical distribution of the amplitude of the volumetric strain of the soil skeleton; (d) the vertical distribution of the amplitude of the longitudinal dispersion coefficient.
Sustainability 16 07177 g010
Figure 11. The results for sediment with various degrees of saturation: (a) the vertical distribution of the amplitude of the difference in the volumetric strain between the soil skeleton and pore fluid; (b) the vertical distribution of the amplitude of the longitudinal dispersion coefficient; (c) time histories of solute concentration near the upper boundary of the solute layer; (d) time histories of solute concentration near the lower boundary of the solute layer.
Sustainability 16 07177 g011
Table 1. Sediment and wave parameters.
ParametersValueUnit
Porosity (n0)0.4-
Shear modulus (G)5 × 10⁶Pa
Mean   particle   diameter   ( d g )0.3mm
Degree   of   saturation   ( S r )1.0-
Hydraulic conductivity ( k )1 × 10⁻⁴m/s
Sediment thickness (h)14.2m
Poisson’s ratio ( μ )0.33-
Weight   of   water   ( γ w )9806N/m3
Water   depth   ( d w )10.0m
Wave   height   ( H w )3.0m
Wave   period   ( T w )8.0s
Wave   length   ( L w )70.87m
Disclaimer/Publisher’s Note: The statements, opinions and data contained in all publications are solely those of the individual author(s) and contributor(s) and not of MDPI and/or the editor(s). MDPI and/or the editor(s) disclaim responsibility for any injury to people or property resulting from any ideas, methods, instructions or products referred to in the content.

