Article

Applying Fuzzy Decision-Making Trial and Evaluation Laboratory and Analytic Network Process Approaches to Explore Green Production in the Semiconductor Industry

Department of Management Science, National Yang Ming Chiao Tung University, 1001 Ta-Hsueh Road, Hsinchu 300093, Taiwan
Sustainability 2024, 16(16), 7163; https://doi.org/10.3390/su16167163
Submission received: 31 May 2024 / Revised: 4 August 2024 / Accepted: 14 August 2024 / Published: 21 August 2024
(This article belongs to the Special Issue Green Supply Chain and Sustainable Operation Management)

Abstract

As environmental awareness grows, society emphasizes green business. Thus, semiconductor companies encompass energy-saving processes and innovative product development. This study employs the fuzzy decision-making trial and evaluation laboratory (DEMATEL) analysis method to assess the impact of four key dimensions, externalities, market orientation, green technology, and corporate social responsibility, on semiconductor companies’ green production decisions. This study uses the DEMATEL-based analytic network process (DANP) approach to rank the criteria order in green production decision-making. The results from the DEMATEL causality diagram highlight externalities as the most critical dimension influencing other dimensions of green production decisions. This study suggests that regulatory pollution punishment and subsidies emerge as the primary drivers for green production decisions. Companies adopt environmentally friendly production practices to prevent regulatory pollution penalties or reduce carbon trading costs. Additionally, the DANP results reveal that corporate image criteria in the corporate social responsibility dimension hold the utmost priority in semiconductor firms’ green production decision-making. This implies that considerations for improving a company’s image should take precedence as semiconductor companies seek shareholder support and governmental subsidies to ensure sustainable operations. Externalities arise as the secondary priority dimension in green production decision-making, aligning with the impact of externalities identified in DEMATEL findings.

1. Introduction

This paper employs fuzzy multi-criteria decision-making approaches to investigate the implementation of green production in the semiconductor industry. The global emphasis on circular economy causes semiconductor companies becoming increasingly involved in green production initiatives to achieve environmental sustainability goals. The urgency of such initiatives is underscored by Tsai and Huang [1] and Pao and Chen [2], who focus on circular economy. Tsai and Chen [3] and Tsai et al. [4] highlight the role of carbon dioxide in global warming. Additionally, Tsai [5] emphasizes the environmental impact of power generation and its contribution to greenhouse gas emissions. In response to these challenges, the United Nations adopted the Paris Agreement in 2015, setting national carbon reduction goals and prompting governments worldwide to implement policies to reduce greenhouse gas emissions. Lyu [6] pointed out that the Chinese government promotes a green economy, hoping to curb global warming as much as possible.
Baines et al. [7] and Zameer et al. [8] pointed out that green production refers to the goal of saving energy, reducing consumption, and reducing pollution, to minimize the pollutants produced and manufacture energy-saving and recyclable products. The green production of semiconductors covers two dimensions: the environmental protection process and product innovation. In terms of the environmental protection process, the semiconductor manufacturing process consumes a lot of electricity and water, which will damage the environment. It is necessary to develop an energy-saving and environmentally friendly manufacturing process. Wen and Liang [9] propose that the green production of the semiconductor industry includes saving water, saving electricity, and reducing carbon dioxide emissions in the manufacturing process. In terms of product innovation, Liao [10] further emphasized the importance of green product innovation. Semiconductors are important components of emerging environmentally friendly green innovations such as electric vehicles, solar panels, light-emitting diode (LED) lights, low-power soft transistors [11], and new semiconductor heterostructures [12]. Green production in the semiconductor industry is critical to achieving sustainability. Since the semiconductor industry is characterized by the extremely high investment costs to execute their decisions, such as Taiwan Semiconductor Manufacturing (TSMC) investing over USD 120 billion in 2-nm technology, cautious considerations are required when making decisions about the future green productions of semiconductor companies. However, previous research has rarely explored the decision-making steps of semiconductor firms. This is why the motivation for this study focuses on the green production decision-making procedure in the semiconductor industry.
The market must accept the products produced by green semiconductor production for companies to make profits. Narver and Slater [13] stated that the market orientation dimension is composed of five criteria, including inter-functional coordination, competitor orientation, consumer orientation, benefit orientation, and long-term profits. This study refers to Narver and Slater [13] to list the market orientation dimension and its five criteria as the decision criteria for green production. In addition to market acceptance of semiconductor industry products, the feasibility of green technology for semiconductor companies is critical for promoting green semiconductor manufacturing. Otherwise, semiconductor products cannot be manufactured with environmentally friendly processes, and the goal of green manufacturing cannot be achieved. In the past, the literature mainly focused on energy saving and environmental protection in the manufacturing process from the perspective of engineering and technology [14]. However, the previous literature rarely discusses the decision-making process of semiconductor green production or product innovation from a management perspective. Green production by semiconductor companies includes environmentally friendly product innovations such as LED lamps, solar panels, energy-saving batteries, and integrated circuits for electric vehicles. The emerging green technology is indispensable. Chen [15] stated that green core competence is related to the scale of the enterprise. The rich resources of large enterprises are conducive to the development and creation of green core competence. Miao et al. [16] used data from 2001 to 2015 to find that investment capitals for green technology and green product innovation have a significant positive effect on the natural resource utilization efficiency. Therefore, this study chooses green technology as the second dimension of semiconductor green production.
The externality dimension, including rewarding environmental protection and punishing pollution by the government, is important in the green production of semiconductors. Based on this, this study chooses externalities as the third dimension of green production. Finally, the previous literature mentioned that corporate social responsibility has become an increasingly important issue for private and non-government companies [17,18,19,20,21]. Lins et al. [22] also proved that corporate social responsibility can increase public trust in the industry and help the industry resist negative business shocks. Semiconductor’s green production is a concrete practice of corporate social responsibility, so this study determines corporate social responsibility as the fourth dimension. This study focuses on the aforementioned four dimensions, externality, market orientation, green technology, and corporate social responsibility. Externalities include tax incentives for environmental protection, which brings external benefits to semiconductor firms and governmental penalties for pollution, which brings external costs to semiconductor firms. Ranking the sequence of these four dimensions is critical to this multi-criteria decision-making across the aforementioned four dimensions. Despite there being many multi-criteria decision-making studies in academic fields [23,24,25], there is a distinct lack of empirical research specifically on the semiconductor industry’s green production. This study, for the first time, explores which of these four dimensions is considered a priority in semiconductor green production, and checks which dimension is the most influential for semiconductor green production. The contribution of this study is to offer a feasible decision procedure that aims to lower the barriers to implementing green production in the semiconductor industry, thereby increasing corporate participation and willingness to engage in environment protection.
Ho et al. [26] and Hossian et al. [27] have employed the decision-making trial and evaluation laboratory (DEMATEL) approach for conducting multi-criteria decision-making. Gabus and Fontela [28] and Fontela and Gabus [29] emphasize the traditional DEMATEL methodology, which involves collecting experts’ assessments on multiple criteria and analyzing the mutual or direct influence relationships among these criteria. A causality diagram is depicted based on mutual relations to guide enterprises in decision-making procedures amidst multi-criteria interactions. However, the conventional DEMATEL method overlooks the inherent ambiguity and vagueness in expert assessments during the multi-criteria decision-making process. Recognizing the challenges posed by the ambiguity and vagueness inherent in human cognition, fuzzy theory has been introduced to transform complex problems, lacking clear definitions, into more precise mathematical representations [30]. Dong et al. [31] exemplify the utilization of fuzzy numbers to preprocess expert assessment data, converting it into a more interpretable mathematical format for subsequent analysis. Consequently, it is necessary to apply fuzzy theory to extend the DEMATEL method. In this study, 55 experts from government agencies, semiconductor companies, and academic fields were surveyed, and triangular fuzzy numbers were employed to convert expert assessments into a meaningful mathematical format for analysis. The investigation specifically focuses on the dimensions of externality, market orientation, green technology, and corporate social responsibility, aiming to uncover the mutual relationships among these dimensions when semiconductor companies engage in green production. The first objective is to employ fuzzy DEMATEL to construct a causality diagram, systematically elucidating the relationships within these dimensions.
Gölcük and Baykasoglu [32] highlight a fundamental flaw in the DEMATEL assumption that all dimensions are considered equally important, which is often impractical in real-world decision-making, where priorities follow a sequence. To overcome the drawbacks, this study adopts the DEMATEL-based analytic network process (DANP) developed by Yang and Tzeng [33]. The DANP method provides a means of ranking the importance levels of various criteria in green production decision-making, offering a valuable reference for prioritizing considerations in corporate decision-making processes. The second objective of this study is to investigate how semiconductor companies, influenced by external factors such as governmental penalties for pollution and tax incentives for environmental protection, can effectively balance green production with market benefits. The research aims to guide the semiconductor industry in implementing green production practices and aligning with government policies on energy efficiency.
This study serves two main goals. Firstly, it employs fuzzy theory to convert expert evaluation data into more clearly defined mathematical forms. Through fuzzy DEMATEL analysis, the study explores the interrelationships among dimensions and constructs a causal diagram to elucidate the key influential dimensions in semiconductor companies’ decision-making regarding green production. The analysis measures how externality, market orientation, green technology, and corporate social responsibility affect semiconductor companies’ green production decisions. Secondly, this study employs DANP to rank all criteria within the dimensions of externalities, market orientation, green technology, and corporate social responsibility. The contribution of our study is to identify the prioritization sequence when engaging in green production within the semiconductor industry.
The remainder of this study is structured as follows. Section 2 reviews the relevant literature and lists the eighteen criteria under the four dimensions of green production. Section 3 illustrates the methodology of data analysis, which includes short-term analysis with DEMATEL and long-term analysis with DANP. Section 4 shows the results of data analysis. Section 5 contains the conclusions and insights of this paper.

2. Literature Review

This study constructs the four main dimensions for the green production of the semiconductor industry, as shown in Table 1. Table 1 summarizes the eighteen criteria under the four dimensions of green production in the semiconductor industry and describes the definition of the criteria.

2.1. Market Orientation

Jaworski and Kohli [34] emphasize that market orientation is associated with risk aversion, interdepartmental conflict, connectedness, centralization, and reward system orientation, so this study lists inter-functional coordination (c1) as a criterion in the market-oriented dimension. The rational integration of the existing industry resources and creating favorable value according to the current market’s customer base, competitors, and potential competitors increases the industry’s profit [13]. Consequently, the market orientation dimension includes competitor orientation (c2) and consumer orientation (c3) criteria. Once a product enters the market, the industry can obtain sufficient benefits from the industry’s primary goal. In addition, the industry should formulate production-related methods according to the industry’s existing situation to obtain long-term profits [13]. Benefit orientation (c4) and long-term profits (c5) are the criteria of the market orientation dimension in our study.

2.2. Green Technology

Fic et al. [35] mentioned that green products must meet three requirements: First, the product must be as easy as possible to recycle and reuse, and the parts that cannot be reused are easy to return to nature and will not cause a burden on the environment. Therefore, this study incorporates sustainable materials (c6) into the criteria of green technology. Second, while pursuing zero environmental burdens, energy consumption must also be controlled during the production process to achieve the goal of lower energy consumption. Therefore, this study regards energy saving (c7) as the green technology dimension. Zhou et al. [36] emphasized the recycling of resources from economic, environmental, and social perspectives. Their research encouraged enterprises to coordinate upstream, midstream, and downstream through supply chain management to achieve sustainability through the ecological economy and policy incentives. Barney [37] promoted enterprises to develop technology, which brings a synergy effect to enterprises. Synergy (c8) is a criterion for green technology. Schiederig et al. [38] defined technological innovation (c9) as the updating of software and hardware of production equipment and technological innovation, so technological innovation (c9) is listed as a criterion of the green technology dimension. It is critical to ensure that the product will not cause harm or toxic substances to the human body and the environment, so we add low toxicity (c10) as a criterion of green technology.

2.3. Externalities

Lee and Kim [14] explored the development of green products and technological innovation as new systematic measures to deal with environmental regulations and challenges. The promotion of green production processes will be deterred by financial or other factors and cannot be implemented as desired. Therefore, it is very important to consider externality. Generally speaking, there will not be enough benefits for enterprises to develop new environmental protection technologies. Therefore, receiving government subsidies is also an important driving force. Li [39] explored the impact of government subsidies on corporate social responsibility in his research. Thus, this study chooses government subsidies (c11) as a criterion of the externality dimension. Mortha et al. [40] pointed out the impact of the carbon tax introduced in Japan in 2012 and emphasized that the process of green production encounters issues with carbon emissions. Therefore, the Paris Agreement and the Kyoto Protocol of the United Nations Framework Convention on Climate Change treat carbon dioxide emissions as a tradable commodity and use the market mechanism to reduce greenhouse gas emissions. Carbon trading (c12) is regarded as a criterion of the externality dimension in this study. Because enterprises are impossible to achieve green production goals, the government should formulate relevant regulations for enterprises to follow. Therefore, regulations (c13) are added as a criterion of our externality dimension. When an enterprise violates the relevant laws and regulations, it will be punished and fined. Punishment (c14) is added as a criterion of our externality dimension in this study as well.

2.4. Corporate Social Responsibility
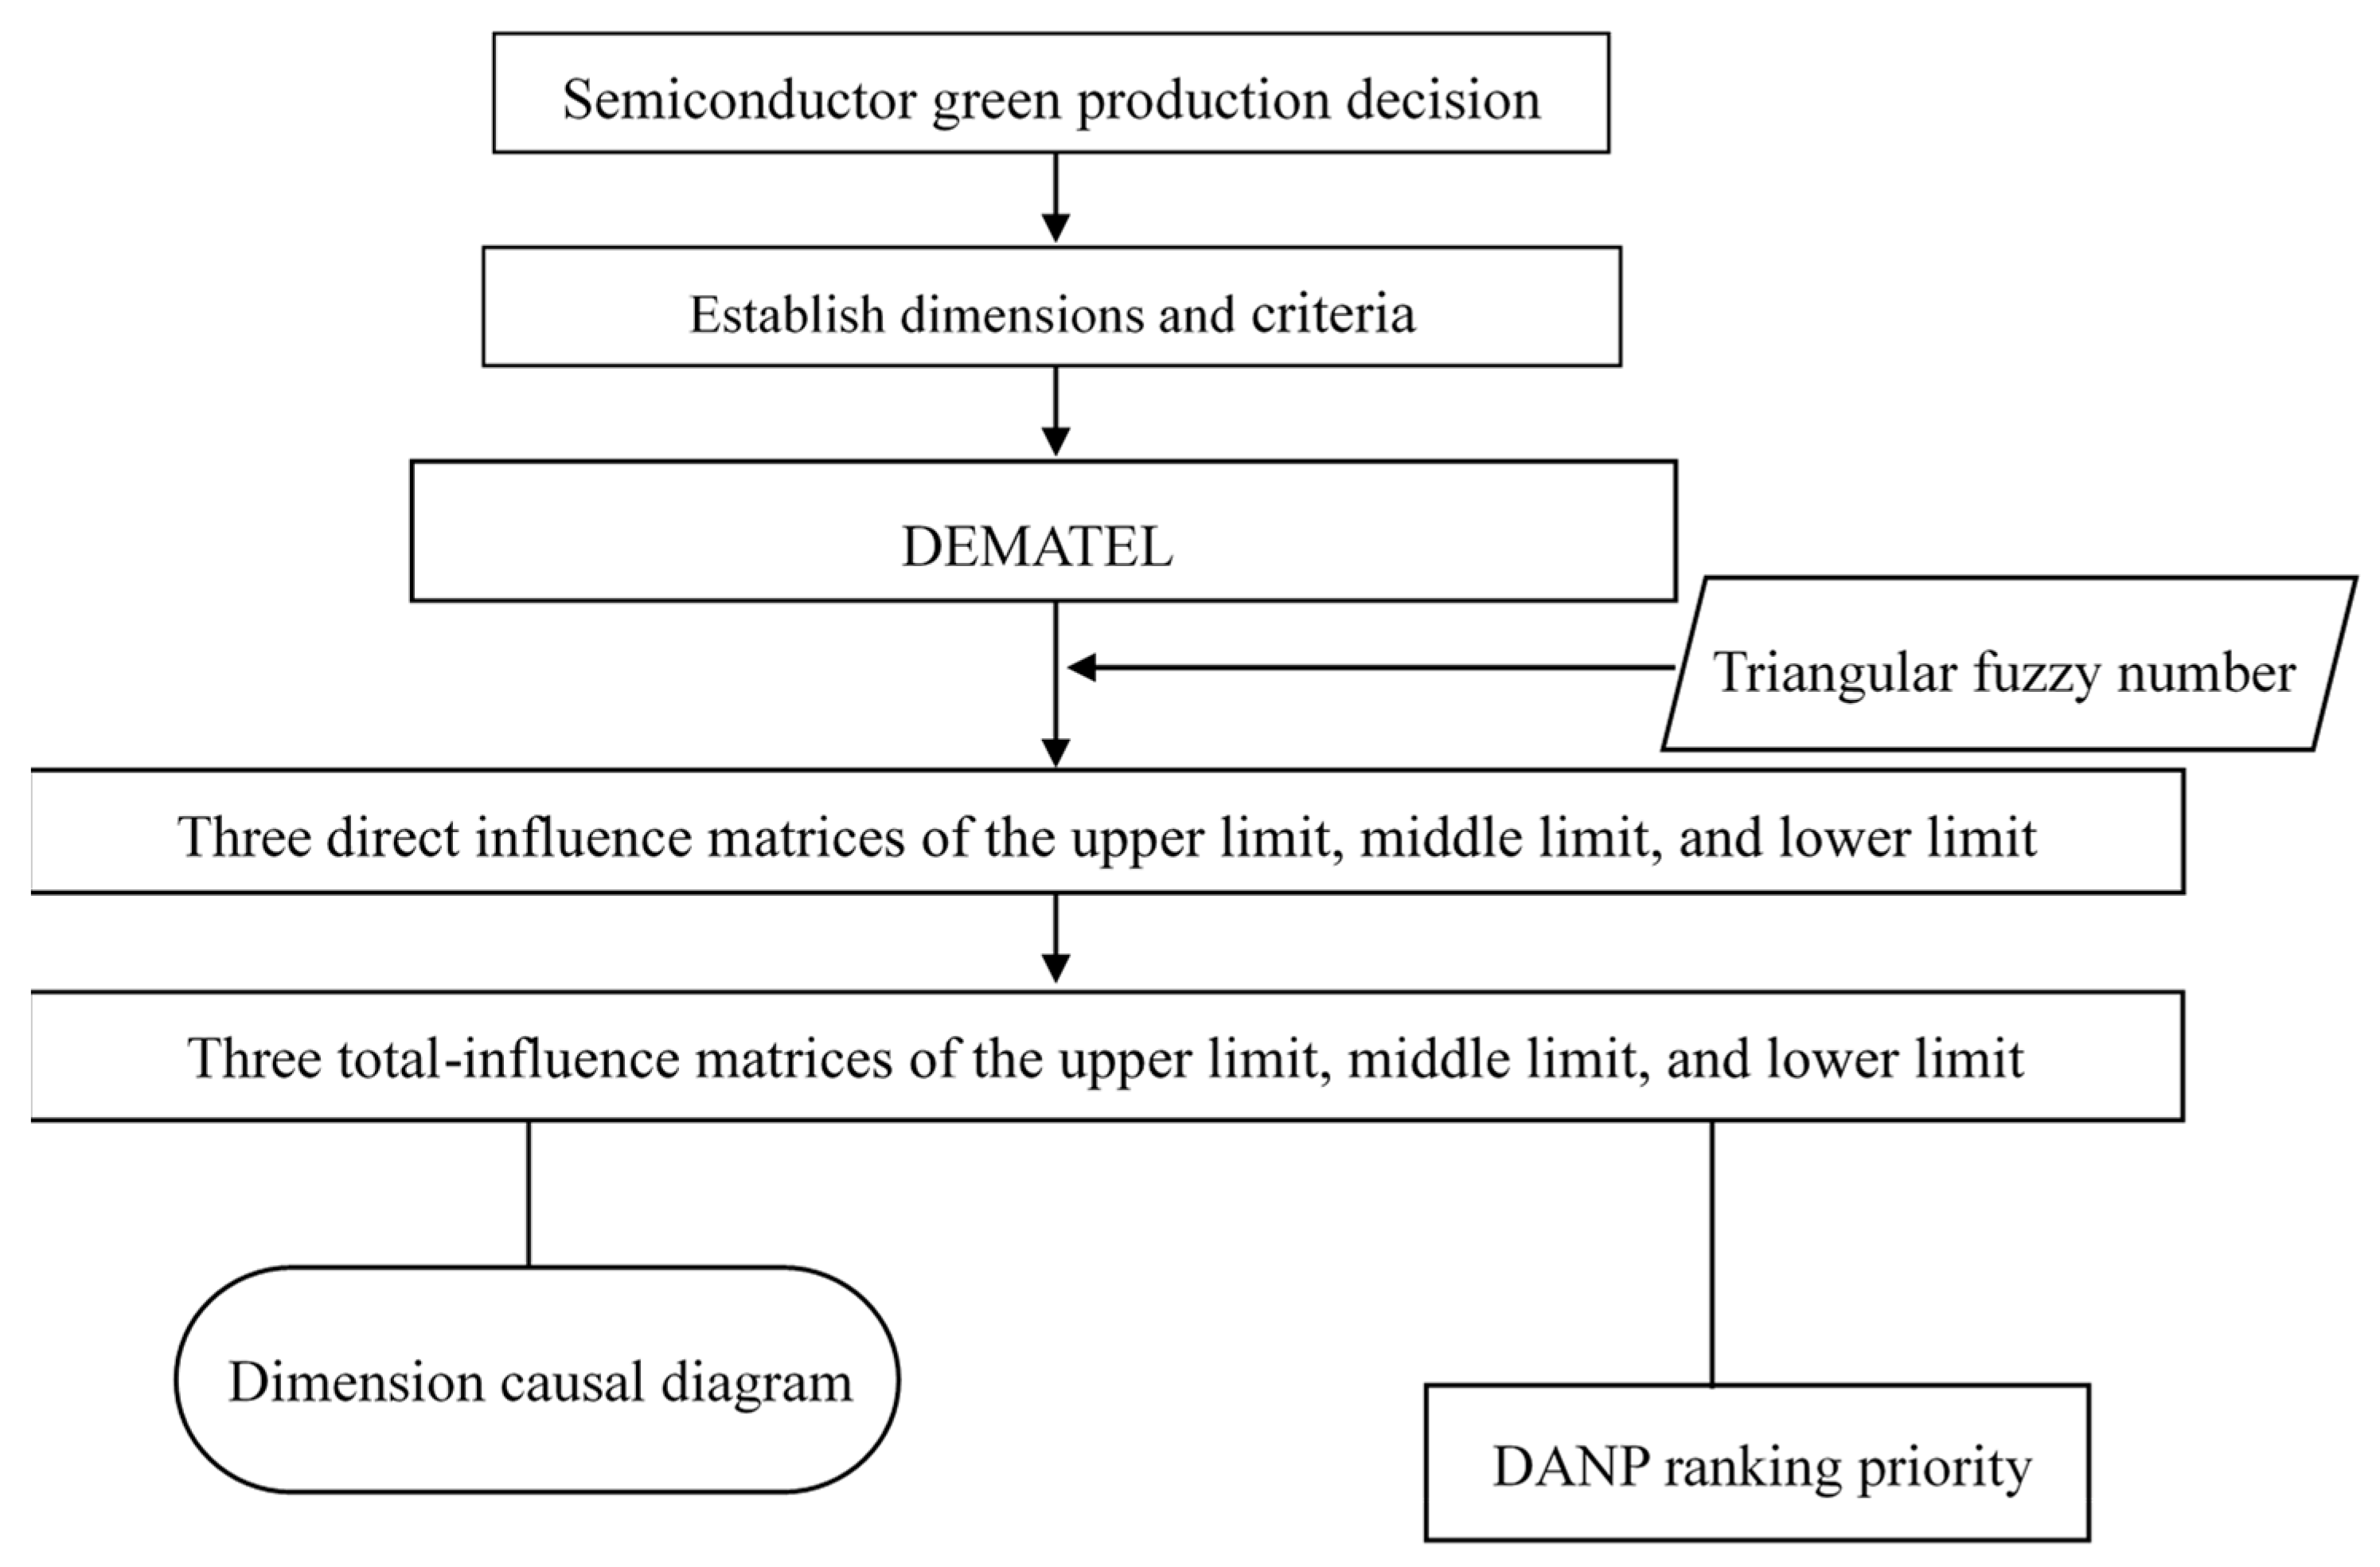
Hopkins [17] and Hu et al. [41] listed four main criteria for corporate image, environmental safety, social care, and workplace environment. Manufacturing green products achieves a good corporate image (c15). In developing green products, avoiding products that may cause environmental damage, and developing products with low environmental loads, we must pay attention to environmental safety (c16). In addition to engaging in production, enterprises must also give back to society by engaging in social welfare and charity activities to assist the development of disadvantaged groups, cultivate new generations of talent, and implement social care (c17). In the process of engaging in green production, the industry must provide a good, comfortable, and safe environment for employees to concentrate on their work. In addition to increasing the production efficiency of the industry, enterprises also ensure the physical and mental health of employees, that is, the workplace environment (c18).

3. Methodology

3.1. Fuzzy DEMATEL Approach

This study combines DEMATEL and fuzzy numbers for analysis. The DEMATEL method can analyze the mutual or direct influence relationships among criteria. The flow chart of our proposed fuzzy DEMATEL and DANP approach is shown in Figure 1.
First, this study collects 55 expert evaluations of criteria influence. This study utilizes 5 evaluation scales: no influence, very low influence, low influence, high influence, and very high influence. After experts respond to our questionnaires regarding each criterion and whether they affect other criteria based on their professional knowledge and experience, this study implements triangular fuzzy numbers based on the defined evaluation scale, which processes the collected expert evaluation data. For example, if the expert opinions have no influence, then fuzzy mathematics is (0.1, 0.1, 0.3). If the expert opinions are slightly influential, influential, quite influential, and very influential, the scores converted into fuzzy mathematics are (0.1, 0.3, 0.5), (0.3, 0.5, 0.7), (0.5, 0.7, 0.9) and (0.7, 0.9, 0.9). Second, DEMATEL and dimension causal diagrams elucidate the short-term inter-influence among criteria. Third, DANP is used to illustrate the long-term ranking priority of green manufacturing criteria.
  • Step 1: Convert direct-influence data into triangular fuzzy numbers
The theory of triangular fuzzy numbers is used to establish three direct-influence matrices of the upper limit, middle limit, and lower limit for the scores of expert evaluation criteria as expressed in Equation (1). The direct-influence matrix has i columns and j columns, and there are ij in total. Direct-influence matrix D = d i , j = d i , j L ,   d i , j M , d i , j U = D L ,   D M ,   D U , because this study has a total of eighteen criteria, as shown in Table 1, so i, j 1 , 2 , 3 , , 18 . The value on the diagonal of the direct-influence matrix is 0, d 1 , 1 = d 2 , 2 = = d 18 , 18 = 0 ,   0 ,   0 . The triangular fuzzy number of experts’ points of view via linguistics is composed of the lower limit matrix D L , the middle matrix D M , and the upper limit matrix D U .
D = d 1 , 1 d 1 , 18 d 18 , 1 d 18 , 18
  • Step 2: Compute the normalized direct influence
We calculate the normalized direct-influence matrix N by multiplying the direct-influence matrix D of Equation (1) and the maximum values of the sum of the criteria of the rows and columns such as S = min 1 max i j = 1 18 d i , j , 1 max j i = 1 18 d i , j   , which is expressed in Equation (2):
  N =   D   ×   S
  • Step 3: Obtain the criteria-based total-influence matrix
The criteria-based total-influence matrix P is calculated by the proportional series calculated by N in Equation (2), and its operation can be simplified as in Equation (3):
P = N + N 2 + N 3 + N 4 + + N h 1 + N h = N I N h I N 1
When the criteria-based total-influence matrix P approaches infinity as h approaches infinity, N h will approach 0, so Equation (3) can be simplified to Equation (4):
  lim h P = lim h N I N h I N 1 = N I N 1
where I matrix is the identity matrix, so the simplified criteria-based total-influence matrix P can be obtained in Equation (5):
P = N I N 1 = p 1 , 1 p 1 , 18 p 18 , 1 p 18 , 18
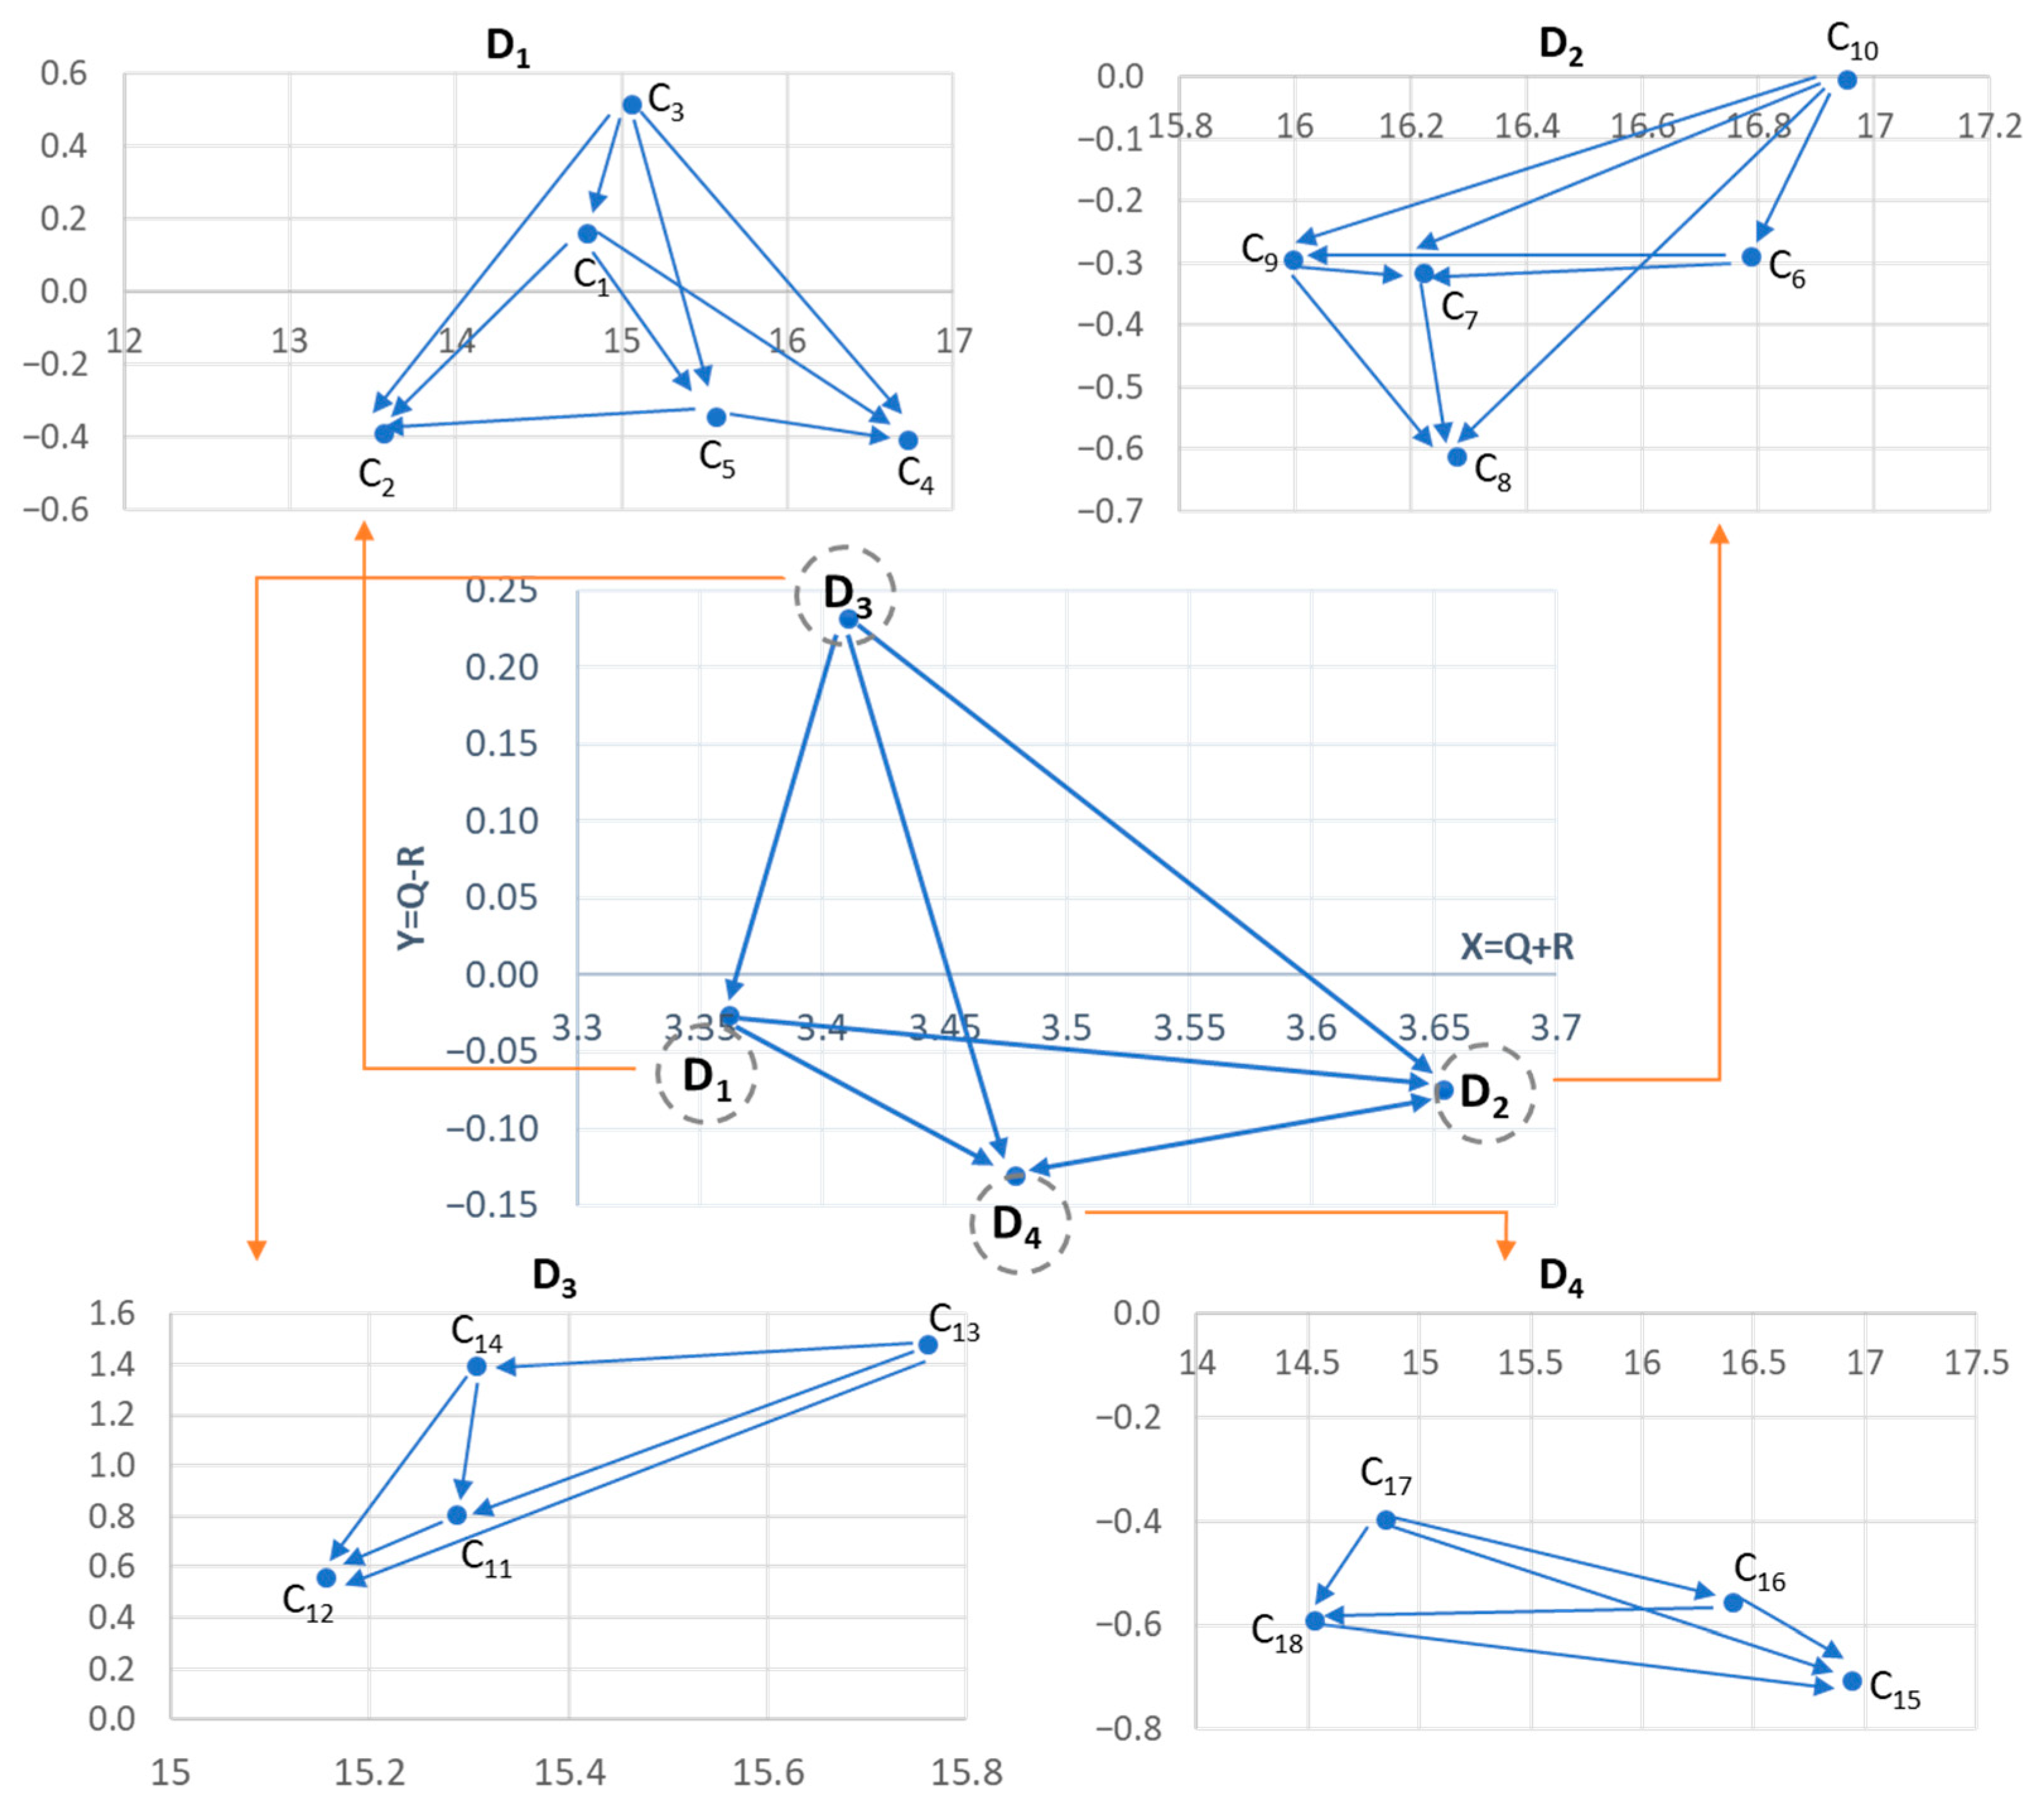
  • Step 4: Compute the causal correlation for each dimension
Each dimension in this study is composed of multiple criteria. Then, this study further averages the criteria of each dimension in matrix P to obtain the dimension-based total-influence matrix T as Equation (6). t i , j denotes the average of criteria in the effect of dimenion i on dimension j with i ,   j 1 , 2 , 3 , 4 . The dimension-based total-influence matrix T is a 4 × 4 matrix. The market orientation (D1), green technology (D2), externality (D3), and corporate social responsibility (D4) dimension have 5, 5, 4, and 4 criteria, respectively. Therefore, t 1 , 1 = 1 25   i = 1 5 j = 1 5 p i , j   , ,   t 4 , 4 = 1 16   i = 15 18 j = 15 18 p i , j   .
T = t 1 , 1 t 1 , 4 t 4 , 1 t 4 , 4 4 × 4
The sum of the rows Q i = j = 1 4 t i , j   and the sum of columns R j = i = 1 4 t i , j of the dimension-based total-influence matrix T are expressed as Q i and R i , which is expressed as in Equation (7):
Q i = j = 1 4 t i , j   R j = i = 1 4 t i , j  
The Q i value indicates whether one dimension directly affects other dimensions. The R i value indicates which dimensions are directly affected by other dimensions. Then, X r = Q r + R r can be calculated to represent the total influence correlation among different dimensions. Next, Y r = Q r R r can be calculated to denote the greater influence of one dimension has on another dimension other than itself. The greater the Y r = Q r R r values are, the greater the influence the dimension has on other dimensions. The positive Y r = Q r R r value implies that these dimensions are the cause that affects other dimensions. Otherwise, the negative Y r = Q r R r value implies that these dimensions are affected by other dimensions. Next, this study depicts the dimension causal diagram. The dimension causal diagram uses the X r value as the X-axis to show the total effect which each factor has and whether it is affected by others. The dimension causal diagram also uses the Y r value as the Y-axis to judge whether this factor drives other factors or is driven by other factors. The greater the sum of the X r and Y r is, the more it must be considered a priority for decision-making.

3.2. Fuzzy DANP Approach

Saaty [42] took the feedback and dependency into consideration and developed the ANP method, which calculates the influence degree of interdependence from the supermatrix. Yang and Tzeng [31] further developed the fuzzy DANP. The DANP method provides a means of ranking the importance levels of various criteria. Therefore, this study uses the DANP method to calculate the mutual influence and dependence relationship between each criterion, as shown in Figure 2.
  • Step 1: Creating the normalized matrix and determining the weights for the supermatrix.
Because the row sum value of the criteria-based total-influence matrix P obtained by Equation (5) is not one, this step will normalize the matrix P to obtain the normalized matrix by these interdependent relations in a group to obtain this unweighted supermatrix P N = p i , j N , which is expressed in Equation (8).
P N = t 1 , 1 p 1 , 1 p 1 , 5 t 1 , 3 p 1 , 11 p 1 , 14 t 1 , 4 p 1 , 15 p 1 , 18 t 1 , 1 p 1 , 1 p 5 , 1 t 3 , 1 p 11 , 1 p 14 , 1 t 4 , 1 p 15 , 1 p 18 , 1 p 1 , 1 j = 1 5 p 1 , j p 1 , 14 j = 11 14 p 1 , j p 1 , 18 j = 15 18 p 1 , j p i , 1 j = 1 5 p i , j p i , 14 j = 11 14 p i , j p i , 18 j = 15 18 p i , j p 18 , 1 j = 1 5 p 18 , j p 18 , 14 j = 11 14 p 18 , j p 18 , 18 j = 15 18 p 18 , j = p 1 , 1 N p 1 , 18 N p 18 , 1 N p 18 , 18 N
  • Step 2: Achieve the weight of the supermatrix
We multiply the total-influence matrix, which is normalized through this total degree of influence to attain the unweighted supermatrix and to obtain the weight of supermatrix W , which is expressed in Equation (9):
W = t 1 , 1 p 1 , 1 N p 1 , 5 N t 1 , 3 p 1 , 11 N p 1 , 14 N t 1 , 4 p 1 , 15 N p 1 , 18 N t 1 , 1 p 1 , 1 N p 5 , 1 N t 3 , 1 p 11 , 1 N p 14 , 1 N t 4 , 1 p 15 , 1 N p 18 , 1 N p 1 , 1 N t 1 , 1 j = 1 4 t 1 , j p 1 , 14 N t 1 , 3 j = 1 4 t 1 , j p 1 , 18 N t 1 , 4 j = 1 4 t 1 , j p i , 1 N t 3 , 1 j = 1 4 t 3 , j p i , 14 N t 3 , 3 j = 1 4 t 3 , j p i , 18 N t 3 , 4 j = 1 4 t 3 , j p 18 , 1 N t 4 , 1 j = 1 4 t 4 , j p 18 , 14 N t 4 , 3 j = 1 4 t 4 , j p 18 , 18 N t 4 , 4 j = 1 4 t 4 , j = w 1 , 1 w 1 , 18 w 18 , 1 w 18 , 18
where k = 1 18 w k , 1 = 1   , , k = 1 18 w k , 18 = 1   . The column sum value for each row is one in Equation (9). The summation of rows within each column equals one, indicating the relative importance of each element across the entire matrix.
  • Step 3: Determines the average criteria weight values across the lower, middle, and upper limit matrices.
Self-multiplications lim n W n under DANP achieve the stable situation, which means that final decision concludes the same outcome after executing decision-making process in the actual situation. The weighted supermatrix W converges to limited value lim n W n , respectively. lim n W L n , lim n W M n and lim n W U n are the fuzzy criteria weight values after multiple matrix self-multiplications. Finally, this work calculates the average criteria weight values from the lower lim n W L n , middle lim n W M n , and upper lim n W U n limit matrix under the fuzzy framework. We analyze the importance raking of the criteria weight value for the eighteen criteria, as shown in the flow chart of Figure 1. Through calculation, the greater the limit value obtained from the eighteen criteria, the greater the influence of the criteria. The enterprise must consider the priority of the criteria in making green production decisions. This study can objectively find out which of the eighteen criteria of this study has a greater influence on the other criteria.

3.3. Data Collection

This study collected questionnaires from 55 experts from government agencies, semiconductor companies, and academic fields. Table 2 lists the expert information in our study. These experts have considerable experience in their respective fields. Experts whose ages are less than 30 years, between 31 and 40, between 41 and 50 years, and over 51 years account for 36.36%, 23.64%, 25.45%, and 14.55% of the group. Experts whose education level is the attainment of a bachelor’s, master’s, or Ph.D degree account for 18.18%, 76.36%, and 5.46% of the group, respectively. Experts whose working experience is less than 1 year, between 2 and 10 years, between 11 and 20 years, and over 21 years account for 27.27%, 20.00%, 27.27%, and 25.45%. The consistency analysis is conducted as in Equation (10).
C o n s i s t e n c y = 1 n 2 i = 1 n j = 1 n t ij α t ij α 1 t ij α × 100 %
In this equation, t ij α is expressed as the average value of the results of the i-th criteria, affecting the j-th criteria in α questionnaires. In this study, α is 55 questionnaires, and n is eighteen criteria, so n2 = 324. The average t ij 55 of 55 questionnaires are compared with the average t ij 54 of 54 questionnaires. According to the consistency analysis, the sample gap is 0.6013%, less than 5%. The significant confidence level reached 99.3987%, which is greater than 99%. This result implied that there is not much difference between the questionnaires answered by 55 experts and those answered by 54 experts. The inclusion of an additional expert in this study would not influence the findings Therefore, our questionnaire contains considerable consensus and consistency.

4. Results and Discussion

4.1. Results of Fuzzy DEMATEL Approach

Table 3 shows a criteria-based total-influence matrix of eighteen criteria obtained by aggregating the opinions of the 55 experts mentioned above. According to Equation (5), the average values of the criteria-based total-influence matrix are acquired from the lower, middle, and upper limit matrix under the fuzzy framework. Next, this study calculates the dimension-based total influence through summing up the criteria-based total influence. Table 4 shows the dimension-based fuzzy total-influence matrix obtained by DEMATEL. The dimension-based fuzzy total-influence matrix calculates the average value from the lower, middle, and upper limit dimension-based total-influence matrix under the fuzzy framework.
If this study utilizes the row and column value of the dimension-based total-influence matrix in Table 5 to draw the dimension causality diagram, this diagram would be complex. To simplify the dimension causality diagram, this study constructs a visual matrix to ignore the relatively small value of the dimension-based total-influence matrix according to the following two steps. First, this work uses the average value 0.4346 of the dimension-based total-influence matrix in Table 4 as the threshold value to establish a visual matrix. Second, this study subtracts the threshold 0.4346 and obtains our visual matrix, which only keeps the positive value and sets the negative value as zero. According to the analysis results of fuzzy DEMANTEL, Figure 2 exhibits the dimension causal diagram, where the X r = Q r + R r value depicted on the X-axis shows the degree to which this dimension affects other dimensions and other dimensions affect this dimension. Figure 2 uses the Y r = Q r R r value as the Y-axis to show the degree to which this dimension affects other dimensions or is affected by other dimensions. The visualization matrix is then used to depict the dimension causality diagram in Figure 2, where the arrows indicate the influence direction.
Table 5 shows the average value of the sum of each row (Q value) and the sum of each column (R value) in Table 4. Then, we calculate X r = Q r + R r and Y r = Q r R r in Table 5. The Q-value of the externalities dimension (D3) is 1.8210, which is the highest among the four dimensions. This indicates that it has the greatest total influence on others. The Y r = Q r R r value of the externalities dimension (D3) is 0.2312. The positive Y r indicates that the externalities dimension (D3) drives other dimensions. It suggests that semiconductor firms can take account of externality to achieve green production goals. The R-value of the corporate social responsibility dimension (D4) is 1.8047, which is the second highest among the four dimensions, and the Q-value of the corporate social responsibility dimension (D4) is 1.6743, which is the second lowest among the four dimensions. Thus, the Y r = Q r R r value of D4 is −0.1304, and this negative Y r indicates that corporate social responsibility is more influenced by other dimensions than the corporate social responsibility dimension affects other dimensions.
Figure 2 illustrates the dimension causality diagram, where the arrows of externalities (D3) are all pointing to other dimensions and no other dimensions are pointing to externalities (D3). This implies that among all the dimensions, the externalities (D3) dimension only unilaterally affects the other dimensions, and the part affected by other dimensions is relatively small. The Ministry of Economic Affairs of many countries has proposed regulations to promote green measures and the recognition of green products. The European Union has proposed the Restriction of Hazardous Substances (RoHS) Directive on electronic equipment or facilities and the Directive on Packaging and Packaging Waste (PPWD Directive) to restrict packaging materials and packaging waste to ensure the sustainability of the Earth’s ecology and the sound development of human society. Our results suggest that governments all over the world, which organize various activities related to green technology and green innovation, accelerates semiconductor enterprises towards green production. The externalities dimension (D3) can be regarded as an effective tool to achieve the target of semiconductors’ green production through tax incentives and pollution prevention, increasing firm benefits or long-term profit in the market orientation dimension (D1).
Additionally, obeying governmental regulations to deal with carbon trading enhances the firm reputation and takes corporate social responsibility (D4). When semiconductor firms take account of the externalities dimension (D3) to obtain tax incentives or avoid pollution penalties by means of obeying governmental regulations, a large amount of capital is required to implement new green technologies (D2). Consequently, external influences from governmental regulations are critical for encouraging green technology (D2). The results of dimension causality diagram have identified the externality dimension (D3) as a driver for the other three dimensions. Furthermore, the upgrade of green technologies (D2) significantly improves the environmental safety and workplace environment in the corporate social responsibility dimension (D4). Semiconductor firms which undertake corporate social responsibility tend to use sustainable materials and engage in energy-saving practices and green innovation. Consequently, corporate social responsibility (D4) and green technology (D2) affect each other. Figure 2 illustrates the criteria causality diagram, where the higher the Y r value is, the more influence the criteria has on other criteria. Consumer orientation (c3) and internal cross-function coordination (c1) affect other criteria in market orientation. This suggests that green products satisfied the consumers and reduction in expenses through department cooperations drive the corporate benefits (c4 or c5) and competition criteria (c2). Green innovation (c10) is most influential to other criteria in the green technology dimension. This implies that creating reused materials and technology pushes energy saving and environmental protection. Regulations (c13) and punishment (c14) are most influential to other criteria in externalities.

4.2. Analysis Results of Fuzzy DANP Approach

The average criteria weight values from the lower, middle, and upper limit matrix under the fuzzy framework derived from the fuzzy DANP method are presented in Table 6. This table reveals the prioritization of criteria in the multi-criteria decision-making process within semiconductor firms. Notably, corporate social responsibility (D4) holds the highest weight, indicating its significance in decision-making. The findings are consistent with Yoo and Cho [43], which reveal the key traits of leading sustainable firms in the global semiconductor industry. Further examination reveals that corporate image (c15), environmental safety (c16), social care (c17), and workplace environment (c18) are the most prioritized criteria, with weights of 0.0711, 0.0682, 0.0608, and 0.0601, respectively. These criteria within the corporate social responsibility dimension take precedence over others. Given that the semiconductor industry is capital-intensive and necessitates substantial financial resources at project initiation, corporate reputation becomes crucial. It not only attracts shareholder support but also influences governmental subsidies. Therefore, prioritizing corporate social responsibility in the green production decision-making process is imperative for semiconductor companies. The second-priority dimension is externalities (D3), as indicated by the DANP results. Government subsidy (c11), carbon trading (c12), regulation (c13), and punishment (c14) are the criteria within this dimension, with weights of 0.0576, 0.0581, 0.0567, and 0.0552, respectively. Both DEMATEL and DANP findings underscore the significant role of externalities in green production decision-making within the semiconductor industry. Obtaining government subsidies is the initial focus, followed by addressing carbon trading, regulations, and punishments to mitigate environmental impact and associated expenses.
A comparison between the dimension causality diagram and criteria causality diagram is shown in Figure 2, and criteria weight values from fuzzy DANP in Table 6 reveals the consistency in the results. Both DANP and fuzzy DEMATEL highlight the importance of externalities in green production decisions for semiconductor firms. The distinction lies in DANP’s focus on long-term decision-making rankings, while DEMATEL emphasizes short-term criteria influences. DANP summarizes intra-dimension weight values of 0.0485, 0.0539, 0.0569, and 0.0651 for market orientation, green technology, externalities, and corporate social responsibility after the long-term decision adjustment, which is different from the equal weight assumption for each dimension under the DEMATEL approach. Our findings emphasize that semiconductor companies prioritize corporate social responsibility in long-term project decision-making processes. Subsequently, attention is directed towards short-term considerations such as regulations, punishments, and components related to green technology to achieve the overarching goals of green production.
The article contributes to understanding the factors in green production in the semiconductor industry. Identifying externalities as the most influential factor and prioritizing corporate social responsibility provides a company roadmap. A realistic case is that Chinese, American, and European Union regulations subsidized photovoltaics to promote silicon wafer production in Taiwan’s semiconductor industry around 2015, so externalities are most influential in short-term semiconductor green production. However, China, the United States, and the European Union have reduced photovoltaics subsidies since 2018. The externality effect decreased, and semiconductor companies rely on a good corporate image to obtain orders for sustainable operations. Consequently, semiconductor firms emphasize corporate social responsibility in the long run. The findings of this study are consistent with practical applications in the semiconductor industry.

5. Conclusions

The decision-making process for green production in the semiconductor industry encompasses both energy-saving processes and innovative product development. The semiconductor manufacturing process, known for its high electricity and water consumption, poses environmental challenges. Therefore, the imperative lies in devising energy-efficient manufacturing processes. Furthermore, given the critical role of semiconductors in electric cars and solar panels, the semiconductor industry has emerged as a pivotal player in fostering green product innovation. This study employs the DEMATEL analysis method to assess the impact of four key dimensions: externalities, market orientation, green technology, and corporate social responsibility on the green production decisions of semiconductor companies. These dimensions often intersect with conflicting interests and resource allocation. To elucidate the influential effects and interdependencies of these dimensions, a dimension causality diagram is established using DEMATEL.
The findings underscore the significance of externalities as a crucial dimension influencing decision-making in green semiconductor production. The DEMATEL results suggest that governments play a vital role in environmental protection by formulating policies, imposing pollution penalties, or offering environmental tax incentives to guide semiconductor companies toward adopting green production practices. Governmental regulations not only promote green production goals but also stimulate technological advancements aimed at reducing ecological hazards and benefiting the broader citizenry.
Additionally, this study identifies the criteria influencing green production decisions within the four dimensions and utilizes the fuzzy DANP to rank these criteria by importance. The fuzzy DANP results reveal that corporate social responsibility and externalities are the priority dimensions in green production decision-making. This implies that green semiconductors seek to enhance corporate image and social acceptance through facilitating sustainable operations. Moreover, the impact of externalities, such as obtaining subsidies and avoiding pollution penalties, emerges as a key strategy for achieving corporate social responsibility, which is consistent with the DEMATEL findings. These findings contribute valuable insights to the ongoing disclosure of environmental manufacturing practices within the semiconductor industry. This study focuses on the semiconductor industry. Green production may differ in various industries, so our findings may not be suitable for other industries, which is our limitation. Future work can extend this research to elucidate green production in other industries.

Funding

The author would like to thank the National Science and Technology Council of Taiwan for the financial support of this research under grant number NSTC 112-2410-H-A49-073 and NSTC 113-2410-H-A49-075.

Data Availability Statement

The data presented in this study are available on request from the corresponding author.

Conflicts of Interest

The author declares no conflict of interest.

References

  1. Tsai, B.H.; Huang, Y.M. Comparing the substitution of nuclear energy or renewable energy for fossil fuels between the United States and Africa. Sustainability 2023, 15, 10076. [Google Scholar] [CrossRef]
  2. Pao, H.T.; Chen, C.C. The dynamic interaction between circular economy and the environment: Evidence on EU countries. Waste Manag. Res. 2022, 40, 969–979. [Google Scholar] [CrossRef] [PubMed]
  3. Tsai, B.H.; Chen, C.C. Forecasting interactive relationships and long-term equilibrium of CO2 emissions in industrial interdependent regions. Carbon Manag. 2020, 11, 57–67. [Google Scholar] [CrossRef]
  4. Tsai, B.H.; Chang, C.J.; Chang, C.H. Elucidating the consumption and CO2 emissions of fossil fuels and low-carbon energy in the United States using Lotka-Volterra models. Energy 2016, 100, 416–424. [Google Scholar] [CrossRef]
  5. Tsai, B.H. Modeling energy consumption and carbon dioxide emissions of fossil fuels and nuclear energy using Lotka-Volterra equations. Appl. Ecol. Environ. Res. 2022, 20, 1435–1455. [Google Scholar] [CrossRef]
  6. Lyu, Y.F. An empirical analysis on the relationship between green economy and inflation in China. Appl. Ecol. Environ. Res. 2019, 17, 8969–8983. [Google Scholar] [CrossRef]
  7. Baines, T.; Brown, S.; Benedettini, O.; Ball, P. Examining green production and its role within the competitive strategy of manufacturers. J. Ind. Eng. Manag. 2012, 5, 53–87. [Google Scholar] [CrossRef]
  8. Zameer, H.; Wang, Y.; Yasmeen, H. Reinforcing green competitive advantage through green production, creativity and green brand image: Implications for cleaner production in China. J. Clean. Prod. 2020, 247, 119119. [Google Scholar] [CrossRef]
  9. Wen, R.M.; Liang, J.W. Abatement of waste gases and water during the processes of semiconductor fabrication. J. Environ. Sci. 2002, 14, 482–488. [Google Scholar]
  10. Liao, W.W. A study on the correlations among environmental education, environment-friendly product development, and green Innovation Capability in an Enterprise. Eurasia J. Math. Sci. Technol. Educ. 2017, 13, 5435–5444. [Google Scholar] [CrossRef]
  11. Liu, Z.; Zhao, Y.; Yin, Z. Low-power soft transistors triggering revolutionary electronics. Innovation 2024, 5, 100616. [Google Scholar] [CrossRef] [PubMed]
  12. Go beyond the limit: Rationally designed mixed-dimensional perovskite/semiconductor heterostructures and their applications. Innovation 2022, 4, 100363.
  13. Narver, J.C.; Slater, S.F. The effect of a market orientation on business profitability. J. Mark. 1990, 54, 20–35. [Google Scholar] [CrossRef]
  14. Lee, K.H.; Kim, J.W. Integrating suppliers into green product innovation development: An empirical case study in the semiconductor industry. Bus. Strat. Environ. 2011, 20, 527–538. [Google Scholar] [CrossRef]
  15. Chen, Y.S. The driver of green innovation and green image-green core competence. J. Bus. Ethics 2008, 81, 531–543. [Google Scholar] [CrossRef]
  16. Miao, C.; Fang, D.; Sun, L.; Luo, Q. Natural resources utilization efficiency under the influence of green technological innovation. Resour. Conserv. Recycl. 2017, 126, 153–161. [Google Scholar] [CrossRef]
  17. Hopkins, M. Corporate Social Responsibility and International Development; Earthscan: London, UK, 2007. [Google Scholar]
  18. Alniacik, U.; Alniacik, E.; Genc, N. How corporate social responsibility information influences stakeholders’ intentions. Corp. Soc. Responsib. Environ. Manag. 2011, 18, 234–245. [Google Scholar] [CrossRef]
  19. Maden, C.; Arıkan, E.; Telci, E.E.; Kantur, D. Linking corporate social responsibility to corporate reputation: A study on understanding behavioral consequences. Procedia-Soc. Behav. Sci. 2012, 58, 655–664. [Google Scholar] [CrossRef]
  20. Cho, S.Y.; Lee, C.; Pfeiffer, R.J., Jr. Corporate social responsibility performance and information asymmetry. J. Account. Public Policy 2013, 32, 71–83. [Google Scholar] [CrossRef]
  21. Flammer, C. Corporate social responsibility and shareholder reaction: The environmental awareness of investors. Acad. Manag. J. 2013, 56, 758–781. [Google Scholar] [CrossRef]
  22. Lins, K.V.; Servaes, H.; Tamayo, A. Social capital, trust, and firm performance: The value of corporate social responsibility during the financial crisis. J. Financ. 2017, 72, 1785–1824. [Google Scholar] [CrossRef]
  23. Huang, C.Y.; Liu, Y.W.; Tzeng, G.H. Derivations of factors influencing the technology acceptance of smart TV by using the DEMATEL based network process. Smart Innov. Syst. Technol. 2012, 15, 457–469. [Google Scholar]
  24. Lin, K.P.; Tseng, M.L.; Pai, P.F. Sustainable supply chain management using approximate fuzzy DEMATEL method. Resour. Conserv. Recycl. 2018, 128, 134–142. [Google Scholar] [CrossRef]
  25. Islami, I.; Sadoddin, A.; Barani, H.; Asgharpourmasouleh, A.; Akhbari, M. Modeling socio-ecological structure of local communities participation for managing livestock drinking water using the agent-based approach. Appl. Ecol. Environ. Res. 2017, 15, 1173–1192. [Google Scholar] [CrossRef]
  26. Ho, C.Y.; Tsai, B.H.; Chen, C.S. Exploring green marketing orientations toward sustainability the hospitality industry in the COVID-19 pandemic. Sustainability 2021, 13, 4348. [Google Scholar] [CrossRef]
  27. Hossain, M.I.; Amin, M.A.; Baldacci, R.; Rahman, M.H. Identification and prioritization of green lean supply chain management factors using fuzzy DEMATEL. Sustainability 2023, 15, 10523. [Google Scholar] [CrossRef]
  28. Gabus, A.; Fontela, E. Perceptions of the world problem antique: Communication procedure, communicating with those bearing collective responsibility. In DEMATEL Report 1; Battelle Memorial Institute Geneva Research Centre: Geneva, Switzerland, 1973. [Google Scholar]
  29. Fontela, E.; Gabus, A. The DEMATEL Observer; Battelle Geneva Research Center: Geneva, Switzerland, 1976. [Google Scholar]
  30. Masoud, Z.N.; Reza, M.; Mohammad, A. The application of fuzzy analytic hierarchy process (FAHP) approach to selection of optimum underground mining method for Jajarm Bauxite Mine, Iran. Expert Syst. Appl. 2009, 36, 8218–8226. [Google Scholar]
  31. Dong, J.; Wan, S.; Chen, S.M. A fuzzy best-worst method based on triangular fuzzy numbers for multi-criteria decision-making. Inf. Sci. 2021, 547, 1080–1104. [Google Scholar] [CrossRef]
  32. Gölcük, I.; Baykasoglu, A. An analysis of DEMATEL approaches for criteria interaction handling within ANP. Expert Syst. Appl. 2015, 46, 346–366. [Google Scholar] [CrossRef]
  33. Yang, J.L.; Tzeng, G. An integrated MCDM technique combined with DEMATEL for a novel cluster-weighted with ANP method. Expert Syst. Appl. 2011, 38, 160–168. [Google Scholar]
  34. Jaworski, B.J.; Kohli, A.K. Market orientation: Antecedents and consequences. J. Mark. 1993, 57, 53–70. [Google Scholar] [CrossRef]
  35. Fic, K.; Platek, A.; Piwek, J.; Frackowiak, E. Sustainable materials for electrochemical capacitors. Mater. Today 2018, 21, 437–454. [Google Scholar] [CrossRef]
  36. Zhou, F.; Wang, X.; Lim, M.K.; He, Y.D.; Li, L.X. Sustainable recycling partner selection using fuzzy DEMATEL-AEW-FVIKOR: A case study in small-and-medium enterprises (SMEs). J. Clean. Prod. 2018, 196, 489–504. [Google Scholar] [CrossRef]
  37. Barney, J. Firm Resources and sustained competitive advantage. J. Manag. 1991, 17, 99–120. [Google Scholar] [CrossRef]
  38. Schiederig, T.; Tietze, F.; Herstatt, C. Green innovation in technology and innovation management. R&D Manag. 2012, 42, 180–192. [Google Scholar]
  39. Li, S. Natural extreme events, government subsidies and corporate environment responsibility: Evidence from China’s energy sector. Energy Econ. 2022, 114, 106278. [Google Scholar] [CrossRef]
  40. Mortha, A.; Hesary, F.T.; Vo, X.V. The impact of a carbon tax implementation on non-CO2 gas emissions: The case of Japan. Australas. J. Environ. Manag. 2021, 28, 355–372. [Google Scholar] [CrossRef]
  41. Hu, J.W.; Hu, Y.; Bein, H. Constructing a corporate social responsibility fund using fuzzy multiple criteria decision making. Int. J. Fuzzy Syst. 2011, 13, 195–205. [Google Scholar]
  42. Saaty, T.L. Decision Making with Dependence and Feedback: The Analytic Network Process; RWS Publications: Pittsburgh, PA, USA, 1996. [Google Scholar]
  43. Yoo, Y.; Cho, K. Key Taits of leading sustainable firms in the semiconductor industry. Sustainability 2024, 16, 4563. [Google Scholar] [CrossRef]
Figure 1. The flowchart of the proposed fuzzy DEMATEL and DANP approach.
Sustainability 16 07163 g001
Figure 2. Dimension and criteria causality diagram ( X r on X-axis and Y r on Y-axis).
Sustainability 16 07163 g002
Table 1. The definition of the eighteen criteria under the four dimensions.
Dimensions/ElementsDescription
Market Orientation (D1)
Inter-functional coordination (c1)The semiconductor firms coordinate industry resources to create beneficial value for target consumers [13,34].
Competitor orientation (c2)The semiconductor firms realize potential competitors’ long-term strategies, short-term weaknesses, and strengths of potential competitors [13,34].
Consumer orientation(c3)The semiconductor firms provide two-way mutually beneficial services and products from the perspective of target consumers [13,34].
Long-term profits (c4)The semiconductor firms take profit as the primary goal and pursues positive returns from long-term profits [13].
Benefit orientation (c5)The semiconductor firms obtain sufficient benefits from the market [13].
Green Technology (D2)
Sustainable materials (c6)The semiconductor firms are engaged in the production of resource-saving products, which reduce environmental pollution during production and are easy to recycle and return to nature after being discarded [35].
Energy saving (c7)The semiconductor firms can achieve a relatively low ratio of energy consumption compared to performance [36].
Synergy(c8)The semiconductor firms emphasize the synergistic benefits of green technology and the mutual influence between manufacturers and brand owners [37].
Technological innovation (c9)To achieve better production efficiency and product quality while carrying out production, the semiconductor firms carry out software and hardware updates of production equipment, as well as innovations and breakthroughs in related technologies [38].
Low toxicity (c10)The semiconductor firms guarantee that no harmful or toxic substances will be produced in the human body or the environment [38].
Externalities (D3)
Government subsidies (c11)The government provides relevant policies and subsidies to motivate and assist enterprises to implement green transformation [39].
Carbon trading (c12)The Paris Agreement and the Kyoto Protocol treat carbon dioxide emissions as tradable commodities and use market mechanisms to reduce greenhouse gas emissions [40].
Regulations (c13)As the requirements for environmental protection are becoming stricter, enterprises must abide by regulations [40].
Punishment (c14)Violation of the government’s environment-related laws and regulations will be punished and fined [40].
Corporate Social Responsibility (D4)
Corporate image (c15)The semiconductor firms establish a good corporate image in the minds of legislators and the public [17,41].
Environmental safety (c16)The semiconductor firms avoid production that pollutes the environment and develops products with low environmental loads [17,41].
Social care (c17)The semiconductor firms are engaged in social welfare and charity activities, assisting disadvantaged groups and cultivating new-generation talents [17,41].
Workplace environment (c18)The semiconductor firms provide a friendly and safe environment for employees to concentrate on their work and ensure their health [17,41].
Table 2. The information of experts.
CategoryNumber of Experts
Ages
≤3020
31~4013
41~5014
≥508
Education level
Bachelor10
Master42
Ph.D3
Years of working experiences
Less than 1 year15
Between 2 and 3 years3
Between 4 and 10 years8
Between 11 and 20 years15
More than 21 years14
Table 3. Criteria-based total direct-influence matrix of eighteen criteria.
Elementsc1c2c3c4c5c6c7c8c9c10c11c12c13c14c15c16c17c18
c10.3480.3780.4000.4670.4380.4480.4350.4420.4340.4440.3770.3800.3750.3660.4790.4490.4080.410
c20.3530.2930.3500.4100.3900.3960.3810.3860.3820.3940.3350.3410.3320.3230.4140.3910.3580.358
c30.4210.3970.3600.4830.4550.4730.4590.4710.4520.4680.3950.3960.3910.3770.4900.4630.4260.413
c40.4350.4140.4300.4430.4750.4940.4790.4830.4720.4900.4170.4220.4100.3980.5140.4910.4470.444
c50.4110.3960.4080.4770.3850.4570.4480.4490.4370.4530.3900.3940.3830.3780.4760.4530.4120.409
c60.4180.4020.4270.4990.4590.4460.4890.5030.4820.5060.4330.4360.4230.4110.5230.5060.4470.438
c70.4070.3900.4100.4840.4490.4850.4170.4740.4650.4890.4190.4240.4080.3950.5040.4820.4280.422
c80.4000.3810.4110.4740.4330.4810.4500.4200.4520.4790.4090.4070.4030.3940.4960.4850.4300.428
c90.4060.3850.4060.4750.4410.4810.4630.4700.4050.4820.4060.4120.4010.3890.4950.4780.4270.426
c100.4360.4170.4370.5150.4720.5210.5060.5200.4970.4550.4370.4490.4310.4170.5350.5180.4580.452
c110.4130.3930.4090.4860.4540.4970.4800.4860.4700.4950.3700.4280.4200.4050.4910.4850.4350.429
c120.4010.3870.3960.4780.4420.4830.4710.4730.4590.4830.4130.3640.4110.3980.4870.4770.4220.415
c130.4460.4250.4380.5210.4840.5270.5110.5260.4970.5240.4490.4520.3900.4450.5280.5240.4670.465
c140.4320.4080.4220.5030.4720.5110.4970.5090.4850.5060.4320.4400.4340.3680.5210.5100.4520.448
c150.4280.4090.4290.4970.4600.4950.4820.4920.4720.4880.4170.4170.4040.3950.4530.4870.4480.445
c160.4100.3900.4070.4800.4440.4870.4720.4860.4630.4800.4090.4140.4040.3930.5010.4260.4280.431
c170.3770.3600.3770.4440.4060.4390.4260.4370.4180.4290.3740.3690.3670.3550.4680.4360.3490.395
c180.3770.3510.3580.4290.3980.4170.4040.4200.4030.4140.3570.3540.3540.3480.4490.4210.3810.335
Table 4. Dimension-based total-influence matrix.
DimensionsD1D2D3D4
Market Orientation (D1)0.4088
(0.291, 0.350, 0.586)
0.4451
(0.328, 0.384, 0.623)
0.3791
(0.266, 0.317, 0.554)
0.4352
(0.317, 0.375, 0.614)
Green Technology (D2)0.4335
(0.308, 0.374, 0.618)
0.4735
(0.357, 0.414, 0.649)
0.4137
(0.301, 0.353, 0.587)
0.4689
(0.351, 0.409, 0.647)
Externalities (D3)0.4405
(0.318, 0.381, 0.623)
0.4945
(0.382, 0.434, 0.667)
0.4137
(0.305, 0.353, 0.583)
0.4722
(0.356, 0.411, 0.649)
Corporate Social
Responsibility (D4)
0.4115
(0.290, 0.350, 0.594)
0.4512
(0.335, 0.389, 0.630)
0.3833
(0.271,0.320, 0.559)
0.4283
(0.312, 0.366, 0.607)
Table 5. Row value and column value of the dimension-based total-influence matrix.
DimensionsQR X r = Q r + R r Y r = Q r R r
Market Orientation (D1)1.6682
(1.202, 1.426, 2.377)
1.6942
(1.206, 1.455, 2.422)
3.3624
(2.408, 2.880, 4.799)
−0.0260
(−0.005, −0.029, −0.045)
Green Technology (D2)1.7896
(1.317, 1.550, 2.502)
1.8644
(1.402, 1.622, 2.569)
3.6540
(2.720, 3.172, 5.071)
−0.0748
(−0.085, −0.072, −0.067)
Externalities (D3)1.8210
(1.362, 1.579, 2.522)
1.5898
(1.143, 1.343, 2.283)
3.4108
(2.505, 2.922, 4.805)
0.2312
(0.219, 0.236, 0.239)
Corporate Social
Responsibility (D4)
1.6743
(1.207, 1.426, 2.390)
1.8047
(1.336, 1.531, 2.516)
3.4790
(2.543, 2.988, 4.906)
−0.1304
(−0.129, −0.135, −0.127)
Table 6. Criteria weight value of fuzzy DANP.
DimensionCriteria NameAverage Weight ValueRankIntra-Dimension Weight ValueRank within Dimension
Market Orientation (D1)Internal cross-functional coordination (c1)0.0466160.19193
Competitor orientation (c2)0.0441180.18185
Consumer orientation (c3)0.0462170.19054
Long-term profit (c4)0.055090.22681
Benefit orientation (c5)0.0507150.20902
Green Technology (D2)Sustainable material (c6)0.0550100.20411
Energy saving (c7)0.0531130.19714
Low toxicity (c8)0.0545120.20213
Synergy (c9)0.0523140.19385
Green innovation (c10)0.0547110.20292
Externalities (D3)Government subsidy (c11)0.057660.25312
Carbon trading (c12)0.058150.25531
Regulations (c13)0.056770.24923
Punishment (c14)0.055280.24244
Corporate Social
Responsibility (D4)
Corporate image (c15)0.071110.27341
Environmental safety (c16)0.068220.26202
Social care (c17)0.060830.23353
Workplace environment (c18)0.060140.23114
Disclaimer/Publisher’s Note: The statements, opinions and data contained in all publications are solely those of the individual author(s) and contributor(s) and not of MDPI and/or the editor(s). MDPI and/or the editor(s) disclaim responsibility for any injury to people or property resulting from any ideas, methods, instructions or products referred to in the content.

