Article

Revealing How Much Drivers Understand about Vehicle Pollutants: Towards Development of Information Campaigns

by
Zahara Batool
1,*,
Samantha Jamson
1 and
Sonja Forward
2
1
Institute for Transport Studies, University of Leeds, Leeds LS2 9JT, UK
2
Swedish National Road and Transport Research Institute, 58195 Linköping, Sweden
*
Author to whom correspondence should be addressed.
Sustainability 2024, 16(16), 7136; https://doi.org/10.3390/su16167136
Submission received: 22 May 2024 / Revised: 22 July 2024 / Accepted: 30 July 2024 / Published: 20 August 2024
(This article belongs to the Special Issue Sustainable Urban Transport Planning)

Abstract

:
Thirty-four interviews were carried out with drivers in four countries to elicit their understanding about pollutants, specifically nitrogen dioxide (NOX) and particulate matter (PM). The results showed that most of the participants knew that cars emitted carbon dioxide (CO2), but they were less aware of the emission of NOx and PM. Also, being aware of the negative impacts of pollutants did not necessarily lead to eco-friendly vehicle choices. Most of the drivers were aware of pollutant friendly behaviours such as avoiding harsh acceleration/deceleration and maintaining smooth speed but were unaware of behaviours such as efficient gear use, avoiding engine idling, or anticipation of traffic ahead. Only a few mentioned pre-trip or strategic level behaviours (e.g., vehicle size/weight or the selection of appropriate routes and avoidance of traffic congestion). The results could be used to design educational material to raise awareness and provide drivers with tips to reduce their pollutant emissions.

1. Introduction

With four million people dying annually due to outdoor pollution [1], improvement of air quality has become one of society’s main challenges. A number of studies have shown that those exposed to high levels of air pollution have a reduction in life expectancy of 1–2 years (e.g., [2]). Road transport is responsible for a significant proportion of all the main air pollutants in the form of exhaust emissions, tyre and brake wear, and road abrasion. The resulting pollutants include carbon monoxide (CO), oxides of nitrogen (NO), and particulate matter (PM). The latter are generally categorised by diameter as coarse (PM10), fine (PM2.5), or ultrafine (PM0.1). Fine particles (PM2.5) from combustion emissions have been shown to result in roughly 200,000 premature deaths, and 53,000 deaths are linked to road transportation. And due to their small size, they can disperse to areas away from the source (i.e., away from the traffic) [3]. Exhaust emissions have generally decreased since 1996 due to stricter emissions standards; however, the proportion of non-exhaust emissions (brake, tyre, and road wear) has increased. In 2017, non-exhaust emissions of PM2.5 represented 46% of emissions from the road transport sector, compared with 18% in 2000. It is estimated that in 2019, approximately 307,000 premature deaths were attributed to PM2.5 in the 27 EU Member States [3].
Air pollution can have negative health effects, even at low concentrations (e.g., [4]). PM2.5 has been most associated with increased hospitalisation and mortality due to cardiovascular disease (e.g., [5]). In addition, other major health challenges have also been linked to air pollution, such as asthma, cancer, diabetes, obesity and dementia [6].
Although the use of electric and other zero-emission vehicle technologies may drastically reduce pollutant exhaust emissions, their slow uptake, as well as the trend of increasing vehicle lifetime, means that vehicles with internal combustion engines are expected to dominate the fleet for years to come. In any case, electric vehicles still generate non-exhaust particulate matter, and due to battery weight increasing a vehicle’s mass, they could increase PM2.5 emissions [7].

1.1. Relationship between Pollutants and Health

There are long-established negative relationships between air pollution and health, including those observed at the neonatal stage, resulting in pre-term birth and low birth weights. For example, it is estimated that the likelihood of pre-term birth is a function of exposure to pollutant concentrations during the first and second trimesters of pregnancy [8]. They report that all the measured traffic-related pollutants (CO, NO2, and PM2.5) were significantly associated with an increased prevalence of pre-term birth and were higher for certain demographics (e.g., African Americans and those with low educational attainment). Higher levels of air pollution are also associated with low birth weight, and this relationship has been studied extensively in, for example, China [9], Europe [10], the US [11], and Brazil [12]. In general, these studies report that the risk of low birth weight increases as the mothers are exposed to higher levels of pollutants in one or all the trimesters, although the effects can be different for the different pollutants. Both pre-term birth and low birth weight are well-documented predictors of increased neonatal and adult morbidity and mortality [13].
Furthermore, traffic-related air pollution has been linked to pregnancy loss. The researchers investigated the relationship between week-to-week traffic-related air pollution and conceptions resulting in live births in Boston and Israel [14]. In both locations, the results suggest that higher traffic-related air pollution levels were associated with pregnancy loss, particularly between 10 and 20 weeks gestation.
Lower birth weight not only influences morbidity but also health. It was found that adult males with lower birth weight were more likely to develop adverse respiratory health in childhood [15]. Moreover, as well as studies suggesting that traffic pollution can contribute to new-onset asthma, there is evidence that it can also exacerbate symptoms in existing sufferers [16].
As well as asthma, PM10 and PM2.5 have been commonly associated with increased mortality from cardiovascular disease [5,17], whilst a systematic review and meta-analysis [18] found that the main air pollutants (except ozone) were associated with a short-term increase in the risk of acute respiratory events such as myocardial infarction (heart attack). In the latter study, depending on the air pollutant, the population attributable fraction (defined as the fraction of all cases of a particular disease or other adverse condition in a population that is attributable to a specific exposure) ranged between 0.6% and 4.5%.
The World Health Organization [19] estimated worldwide deaths and disability-adjusted life years (DALYs) for 26 major risk factors, including air pollution, by age, sex, and disease, as part of its ongoing Global Burden of Disease project. The analysis indicates that outdoor PM air pollution is responsible for approximately 3% of adult cardiopulmonary disease mortality and 5% of trachea, bronchus, and lung cancer mortality. Furthermore, it is associated with around 1% of mortality from acute respiratory infection in children in urban areas.
Air pollution is also associated with Central Nervous System diseases such as Alzheimer’s and Parkinson’s Disease [20,21]. In addition, emerging epidemiological evidence suggests an association between the risk of incident inflammatory bowel disease (colitis and Crohn’s disease) and long-term exposure to air pollutants PM2.5, PM10, and NOx [22,23]. There is also tentative evidence that air pollution is a risk factor for diabetes. Whilst the number of dose-response studies is low, a systematic review of 13 studies in Europe and North America concluded that the risk of Type 2 Diabetes increased with increased exposure to both PM2.5 and NO2, with a higher risk for females [24].
The COVID-19 pandemic was responsible for large-scale reductions in road traffic (e.g., [25,26], providing a ‘natural’ case study for monitoring the effect of improvement in air quality on health. A retrospective cohort study is used to establish if the travel restrictions imposed during the pandemic led to improvements in air quality using Environmental Protection Agency data and subsequent asthma-related hospital admissions in Dublin. Compared to 2018–2019, there was a significant decrease in both PM2.5 and NO2, as well as the mean number of daily asthma admissions [27].
The negative effects of pollutants on individual health outcomes are clear, and the perception of air quality can adversely affect mode choice decisions. Active travel modes such as walking and cycling are known to be beneficial to health due to increases in physical activity (e.g., [28]), and these health benefits outweigh the health risks caused by increases in exposure to air pollution in all but the most severely polluted conditions [29]. However, cyclists may be deterred if they perceive air quality as poor and change to another mode of travel, creating a vicious circle [30].

1.2. Public Understanding of Pollutants

An individual driver can influence their vehicle’s fuel consumption and, hence, pollutants in a variety of ways. As stated, “Eco-driving includes those strategic decisions (vehicle selection and maintenance), tactical decisions (route selection and vehicle load), and operational decisions (driver behaviours) that improve vehicle fuel economy” [31]. For example, stronger acceleration and later braking can increase CO2 and NOx emissions by up to 40% and 255%, respectively [32] and generate more tyre wear and hence PMs [33].
Research that uncovers public understanding of pollutants associated with road transport is scarce, and what little there is focusses only on tailpipe emissions. To date, expertise on pollutant emissions has mainly been used to advise European policy makers on the limited effectiveness of emission legislation (through real-world emission factors such as the Handbook Emission Factors for Road Transport, HBEFA, and Computer model to calculate emissions from road traffic, COPERT) and how to reduce traffic and transport pollutant emissions. The numerous mitigation methods are rarely extended to include the perspectives of users. Such understanding is important, as one of the problems with activating and applying eco-driving is that this style of driving is less familiar to many drivers compared to their usual driving style and, therefore, less automated and habitual [34]. Hence, the aim of this study was to explore the perceptions and knowledge of car drivers with the aim of identifying factors that would encourage or discourage behavioural change.

2. Materials and Methods

2.1. Research Design

A qualitative research approach was adopted to investigate the viewpoint of car users, discover their understanding of how their own driving behaviour relates to vehicle emissions (specifically NOX and PM), and identify factors that would encourage or discourage behavioural change. Semi-structured qualitative interviews were carried out with drivers in four European countries, chosen to represent a range of European countries with respect to their reported deaths attributable to air pollution per 100,000 inhabitants (Sweden {0}, the United Kingdom {26}, Belgium {30} and Greece {45}). An interview guide was developed, and the research questions listed in Table 1 guided the interview script.
Four types of questions were included in the template, including introductory questions, transition questions, key ‘content’ questions, and closing questions. These questions broadly covered information related to driving and the personal profile of the interviewee, their knowledge and skills, and their perception of eco-behaviours.

2.2. Recruitment and Interview Procedure

Thirty-four participants (eight from the UK—four males/four females; seven from Sweden—4 males/three females; eight from Greece—three males/five females and eleven from Belgium—six males/five females) were recruited in the summer of 2020. The participants were aged from 18 to 60. A convenience sampling technique was adopted for the recruitment of participants. This technique was considered the most suitable option due to recruitment challenges posed by COVID-19. All the participants were regular drivers (defined as driving a car 3–4 times a week) and were personally responsible for the maintenance of their vehicle or had a responsibility to ensure it had a regular check-up. This selection criterion was applied due to the fact that there has been sufficient previous research on drivers’ understanding and knowledge about, e.g., CO2, but we wanted to establish if these relatively informed drivers were also cognisant of other pollutants such as brake and tyre wear. The sample size of 34 is deemed sufficient in interview-based studies to reach saturation point, which is “the point at which gathering more data about a theoretical construct reveals no new properties, nor yields any further theoretical insights about the emerging grounded theory” [35]. A recent systematic review assessed saturation in qualitative data by conducting a meta-analysis of studies that had specifically evaluated saturation in their own data. It was found that in 16 tests of saturation with data from in-depth interviews, saturation was reached in under 25 interviews and, on average, in 12 interviews. The authors of this meta-analysis summarise as follows: “Sample sizes in qualitative research are guided by data adequacy, so an effective sample size is less about numbers (n’s) and more about the ability of data to provide a rich and nuanced account of the phenomenon studied” [36].
To arrange interviews, email invitations were sent to participants along with a Consent Form and Participant Information Sheet, which informed them about the project. After receiving the consent form and time slot information, an online meeting invitation was sent to participants. The interviews were held online. At the beginning of the interviews, participants were informed about the structure of the interview, and permission was taken explicitly to record it. They were also informed that the recording could be stopped at any time and that the project report would not include any references to a specific person.
During the interviews, we attempted to keep the discussion as close to a conversation as possible. This meant that all the questions were not always asked in the same order, and additional questions could be included. However, it is important to note that the ordering of the data collected does not affect the analysis as this was captured using Nvivo12, which does not rely on the ordering effects of the responses. The interview guide also helped the interviewer to ensure they covered all the issues set out a priori, but due to the naturalistic nature of the data collection, respondents may have pre-empted some questions and answered them already, so there was no need to repeat the question or prompt. To do so would have led to a breakdown in the dialogue.
Interviews were closed by asking participants about queries or concerns they wanted to raise. At the end of the interviews, the interviewer was required to complete the checklist. This included noting down the duration of interviews, thanking participants, and checking their contact details. This also included reflecting and making a note of any points found worth remembering. On average, the interviews were approximately 40 min long.

2.3. Data Analysis

The recorded interviews were transcribed and analysed using NVivo. The transcribing protocol was followed thoroughly to ensure the confidentiality of participants and the smooth integration of data from all partner countries for analysis purposes. Interviewee responses were labelled with Interviewee ID, i.e., initials of country and participant number, e.g., UK1. Following Boyatzis’s advice on never overlooking the opportunity to ‘pre-code’ those ‘codable’ moments worthy of attention [37], the first cycle of coding was initiated for the UK sample after reading and reviewing a couple of transcripts and completed after reaching saturation point. Those transcripts with contrasting data were selected for this purpose to maximise the variety of concepts to be captured and coded. An initial cycle of descriptive coding helped to broadly categorise key concepts captured during the interviews. In the second stage, further reviewing and subsequent cycles of coding were performed to identify patterns in the data. The methodology identified a range of key themes, including participants’ knowledge and awareness about eco-driving, their understanding of eco-driving behaviours, factors influencing their vehicle choices and motivations, and barriers to switching to electric cars. The analyses also used the personal attributes of participants to map differences/similarities across participants and to develop conceptual (qualitative) models to visually present these relationships whenever possible.
In addition, the analyses classified participants into two groups—high-awareness and basic-awareness—based on multiple assessment criteria, including participants’ understanding about the types of vehicle pollutants, sources of emissions, estimations of pollutants, as well as their understanding about health and environmental impacts (collectively referred to as knowledge and awareness). The tables in Section 3.2 provide a summary of these assessments along with sociodemographic descriptions of the groups for each of the sample populations. The data from Sweden were not as clear cut as that of the other countries, and it was therefore not possible to classify the participants into two awareness groups. It is also important to note that seven of the ten drivers in the high-awareness category worked in the IT and analytics industry. This contrasts with those in the basic-awareness groups, which are largely composed of relatively young professionals working in traditional industries such as education, hospitality, and food services (or students). This has implications for the development of interventions which appeal to drivers of different sociodemographic profiles and attributes.

3. Results and Discussion

This section summarises and discusses the results of the interviews from all four countries and provides an insight into the drivers’ understandings and factors that can encourage or discourage change. First, it highlights the knowledge and understanding of the drivers about eco-driving and air pollution. It then reflects on the current driving practices of participants and factors influencing those practices, including their personal profiles. It then briefly focusses on factors that can encourage or discourage the adoption of electric vehicles.

3.1. Knowledge and Awareness about Pollution and Emissions from Cars

In general, the results showed that most of the participants knew that cars emitted CO2, but they were less aware of the emission of NOx and PM. The reason for this might be that CO2 is the principal emission from cars, but its contribution to climate change has also been discussed frequently in recent years. NOx and PM have not been discussed as frequently. Roughly half of the drivers in the UK and Belgium were classified as high-awareness, but only one was in Greece. The Swedish drivers could not be differentiated, and overall, their understanding of eco-driving, pollutant emission and the impact of vehicle emissions, including health and the environment, was good.
The analyses revealed drivers from the high-awareness group understand the impacts of using different types of fuel (petrol, diesel) on emissions and have a higher level of understanding about types of vehicle emissions (CO2, NOx, PMs) and the impacts of these pollutants on health and the environment:
“I know that they can make asthma a lot worse. And any sort of COPD breathing worse. And they’re probably not very good for the skin because they probably got lots of free radicals that attack the skin, etc. But other than that, no. Those are the only things that I know of because those are the only things that I hear about in my daily life, like breathing problems, it makes it harder. And, you know, if you’ve got asthma and it’s not good for the skin”.
(UK1/F)
In the basic-awareness group, none of them had heard of NOx (except one each in the Greek and Swedish samples) or knew about brake dust as a source of vehicle emissions. They mentioned exhaust as the only source of vehicle emissions, and in general, do not understand the health impacts associated with emissions:
Just CO2 for sure. And how the petrol is produced, that it is also polluting…I don’t really know exactly. I do know that in the city, that that’s not the healthiest thing to do to walk around with all those cars all your life.
(BE8/M)
Something with combustion... [Not necessarily, something that has nothing to do with combustion.]…Then I just think about the electricity that’s used in the car?
(BE5/M)
Yes, it is carbon monoxide… or carbon dioxide that it releases. I have not really thought about what else it might emit. There are certainly some other particles as well, but I have not… I cannot on a straight arm mention some, but there are certainly some more. I am absolutely convinced of that.
(SW6/M)
I have generally heard it as a concept. They are pollutants that are dangerous to health and if I am not mistaken, they are responsible for the formation of clouds in big cities.
(GR3/M)
Beyond knowledge and awareness levels, the study has further investigated the fuel choices (petrol/diesel) made by the participants. The findings suggest that the fuel economy is the most influencing element (petrol users—likely to have low driving mileage; diesel users—likely to have high driving mileage). It is also noted that males have a better understanding about fuel impacts compared to females irrespective of being in the high- or basic-awareness group. However, despite being in the high-awareness group and having an adequate understanding about fuel impacts, male drivers can consciously opt for diesel fuel to save their running costs, as reflected below:
So there is more sporty versions of my car, which is like, you know, it’s very practical and spacious and, you know, like comfortable. There are small, sporty versions, but I chose the diesel version because it does more miles per gallon…And also because of the nature of a diesel engine. If get a sporty car, then I drive too quickly to realize that. So having the diesel engine is kind of more just relaxed. It helps me moderate my speed. I sounds rubbish but I am generally in control of the car…because it’s a diesel car. It’s more economic than the sporty petrol versions. And it’s like, you know, it’s twice or three times the economic performance, you know, it uses a lot less fuel than the petrol ones. So that’s one of the big reasons I got this as well.
(UK/3M)

3.2. Understanding of Eco-Driving Behaviours

In response to questions related to eco-driving and opinions about driving in a way that can minimise emissions of NOx and particulates, 22 behaviours were identified. However, the low-awareness group mentioned relatively few behaviours promoting eco-driving compared to the high-awareness group. Overall, participants who identified more than five driving behaviours to promote eco-driving were labelled as holding high awareness about eco-driving compared to those who identified less than five behaviours and were labelled as holding a basic level of awareness (as can be noted in Table 2, Table 3, Table 4 and Table 5).
Using Michon’s (1985) hierarchical behavioural framework [38] (Michon’s (1985) hierarchical behavioural framework divides the driving task into strategic, tactical (or manoeuvring), and control (or operational) levels. The strategic level governs overall travel goals and planning, the tactical level governs deliberate manoeuvres (like passing), and the control level involves automatic actions like lane tracking and speed control). The identified behaviours were grouped at three levels: strategic (four behaviours), pre-trip (seven behaviours), and in-trip (eleven behaviours). The behaviours categorised at the strategic level are those that involve long-term planning while opting for some conscious, environmentally friendly options, e.g., using hybrid/electric cars or technology-assisted vehicles. The behaviours listed at the pre-trip level are related to day-to-day planning for trips before leaving the house, such as avoiding congested routes or merging multiple trips in a single journey. In-trip behaviours are behaviours that drivers perform once they are inside the car, for example, the use of gears, avoiding harsh brakes, and anticipation of traffic ahead. For the present study, behaviours performed at the in-trip level are considered the most relevant, as these are directly relevant to what the driver chooses to do once inside the car and can directly impact their driving style. On the other hand, strategies adopted at the pre-trip level can provide support in the execution of behaviours at the in-trip level on a day-to-day basis. Nonetheless, actions taken at the strategic level may have indirect but lasting impacts in the long run in promoting sustainable driving practices. For illustrative purposes, Table 6 provides a summary of reported behaviours for the UK drivers, grouped at the abovementioned three levels and mapped across high- and basic-awareness groups.
Overall, the analyses revealed in-trip eco-behaviours are the most salient, such as speed management-related behaviours, including avoiding harsh braking, acceleration/deceleration, and smooth speed:
You do not brake as much but let the car work slowly slow down or that you can accelerate out of situations instead of having to use the brake a lot or brake hard.
(SW5/M)
However, not many are aware of, or they recognise fewer, behaviours such as appropriate gear use, avoiding stops/starts, engine idling, or anticipating ahead. As expected, the basic-awareness group holds a limited understanding of these behaviours compared to the high-awareness group. Similarly, females’ identification of in-trip behaviours overall is found to be low compared to males.
Only a few of the participants mentioned anything related to the pre-trip level. For instance, there is a very limited to negligible understanding (or mention) about the impact of vehicle size/weight or selection of an appropriate route and avoiding traffic congestion on vehicle emissions. Greek drivers are the only drivers who identified the use of driving techniques appropriate to terrain type as important to reduce vehicular emissions. They described speed management-related behaviours such as driving at ‘low speed’ and ‘low rpm’. The potential of using alternative modes (e.g., walking, occasional cycling to work in summer, and public transport) is reported by only three of the drivers from the UK (two males and one Female). Behaviours at the strategic level are the least mentioned and only reported by the UK drivers, among which the use of electric and hybrid cars and cycling (on permanent basis) have been identified as behaviours promoting eco-driving other than economically performing engines and the use of vehicle with technology (e.g., eco-mode features, fuel and driving style monitors (For example, Volkswagen Connect mobile phone application collects the car’s data on acceleration, braking, and speed and gives a driving efficiency score)). It is important to note that the number of participants using alternative modes of transport on a daily basis is highest in the Belgian sample (out of six, five males are regularly using alternative modes).
The analyses also recorded interesting observations in response to the question about behaviours participants would find difficult to do in everyday driving and why. For instance, it can be noted that most males in the study, irrespective of their group, have reported none of the identified eco-behaviours as difficult to perform. Some of them reported the execution of these behaviours comes naturally to them, as they are aligned with their daily driving routines:
It doesn’t really change that much because I drive a van. It’s not very powerful. It’s not very fast. It’s not a sports car. I do tend to, you know, and I also know that it’s not the most economical of vehicles. I do tend to drive like that naturally.
(UK8/M)
Unlike males, most females have reported some level of difficulty in performing these behaviours, irrespective of their awareness levels. In general, avoiding harsh acceleration, braking, and switching off the engine at traffic lights are identified as the most difficult behaviours to execute. External factors can also prevent them from driving in a more economical way:
I do not think that for a proper driver it is difficult from what you have mentioned. Based on my own experience, because I drive ‘as I have only told you for 2 years, I cannot turn off my car at the traffic light, so even if there is a tail at the traffic light I have it on so I am always on the alert.
(GR6/F)
Yes, sometimes somebody overtakes and then you might have to brake harder than you would like to.
(SW7/F)

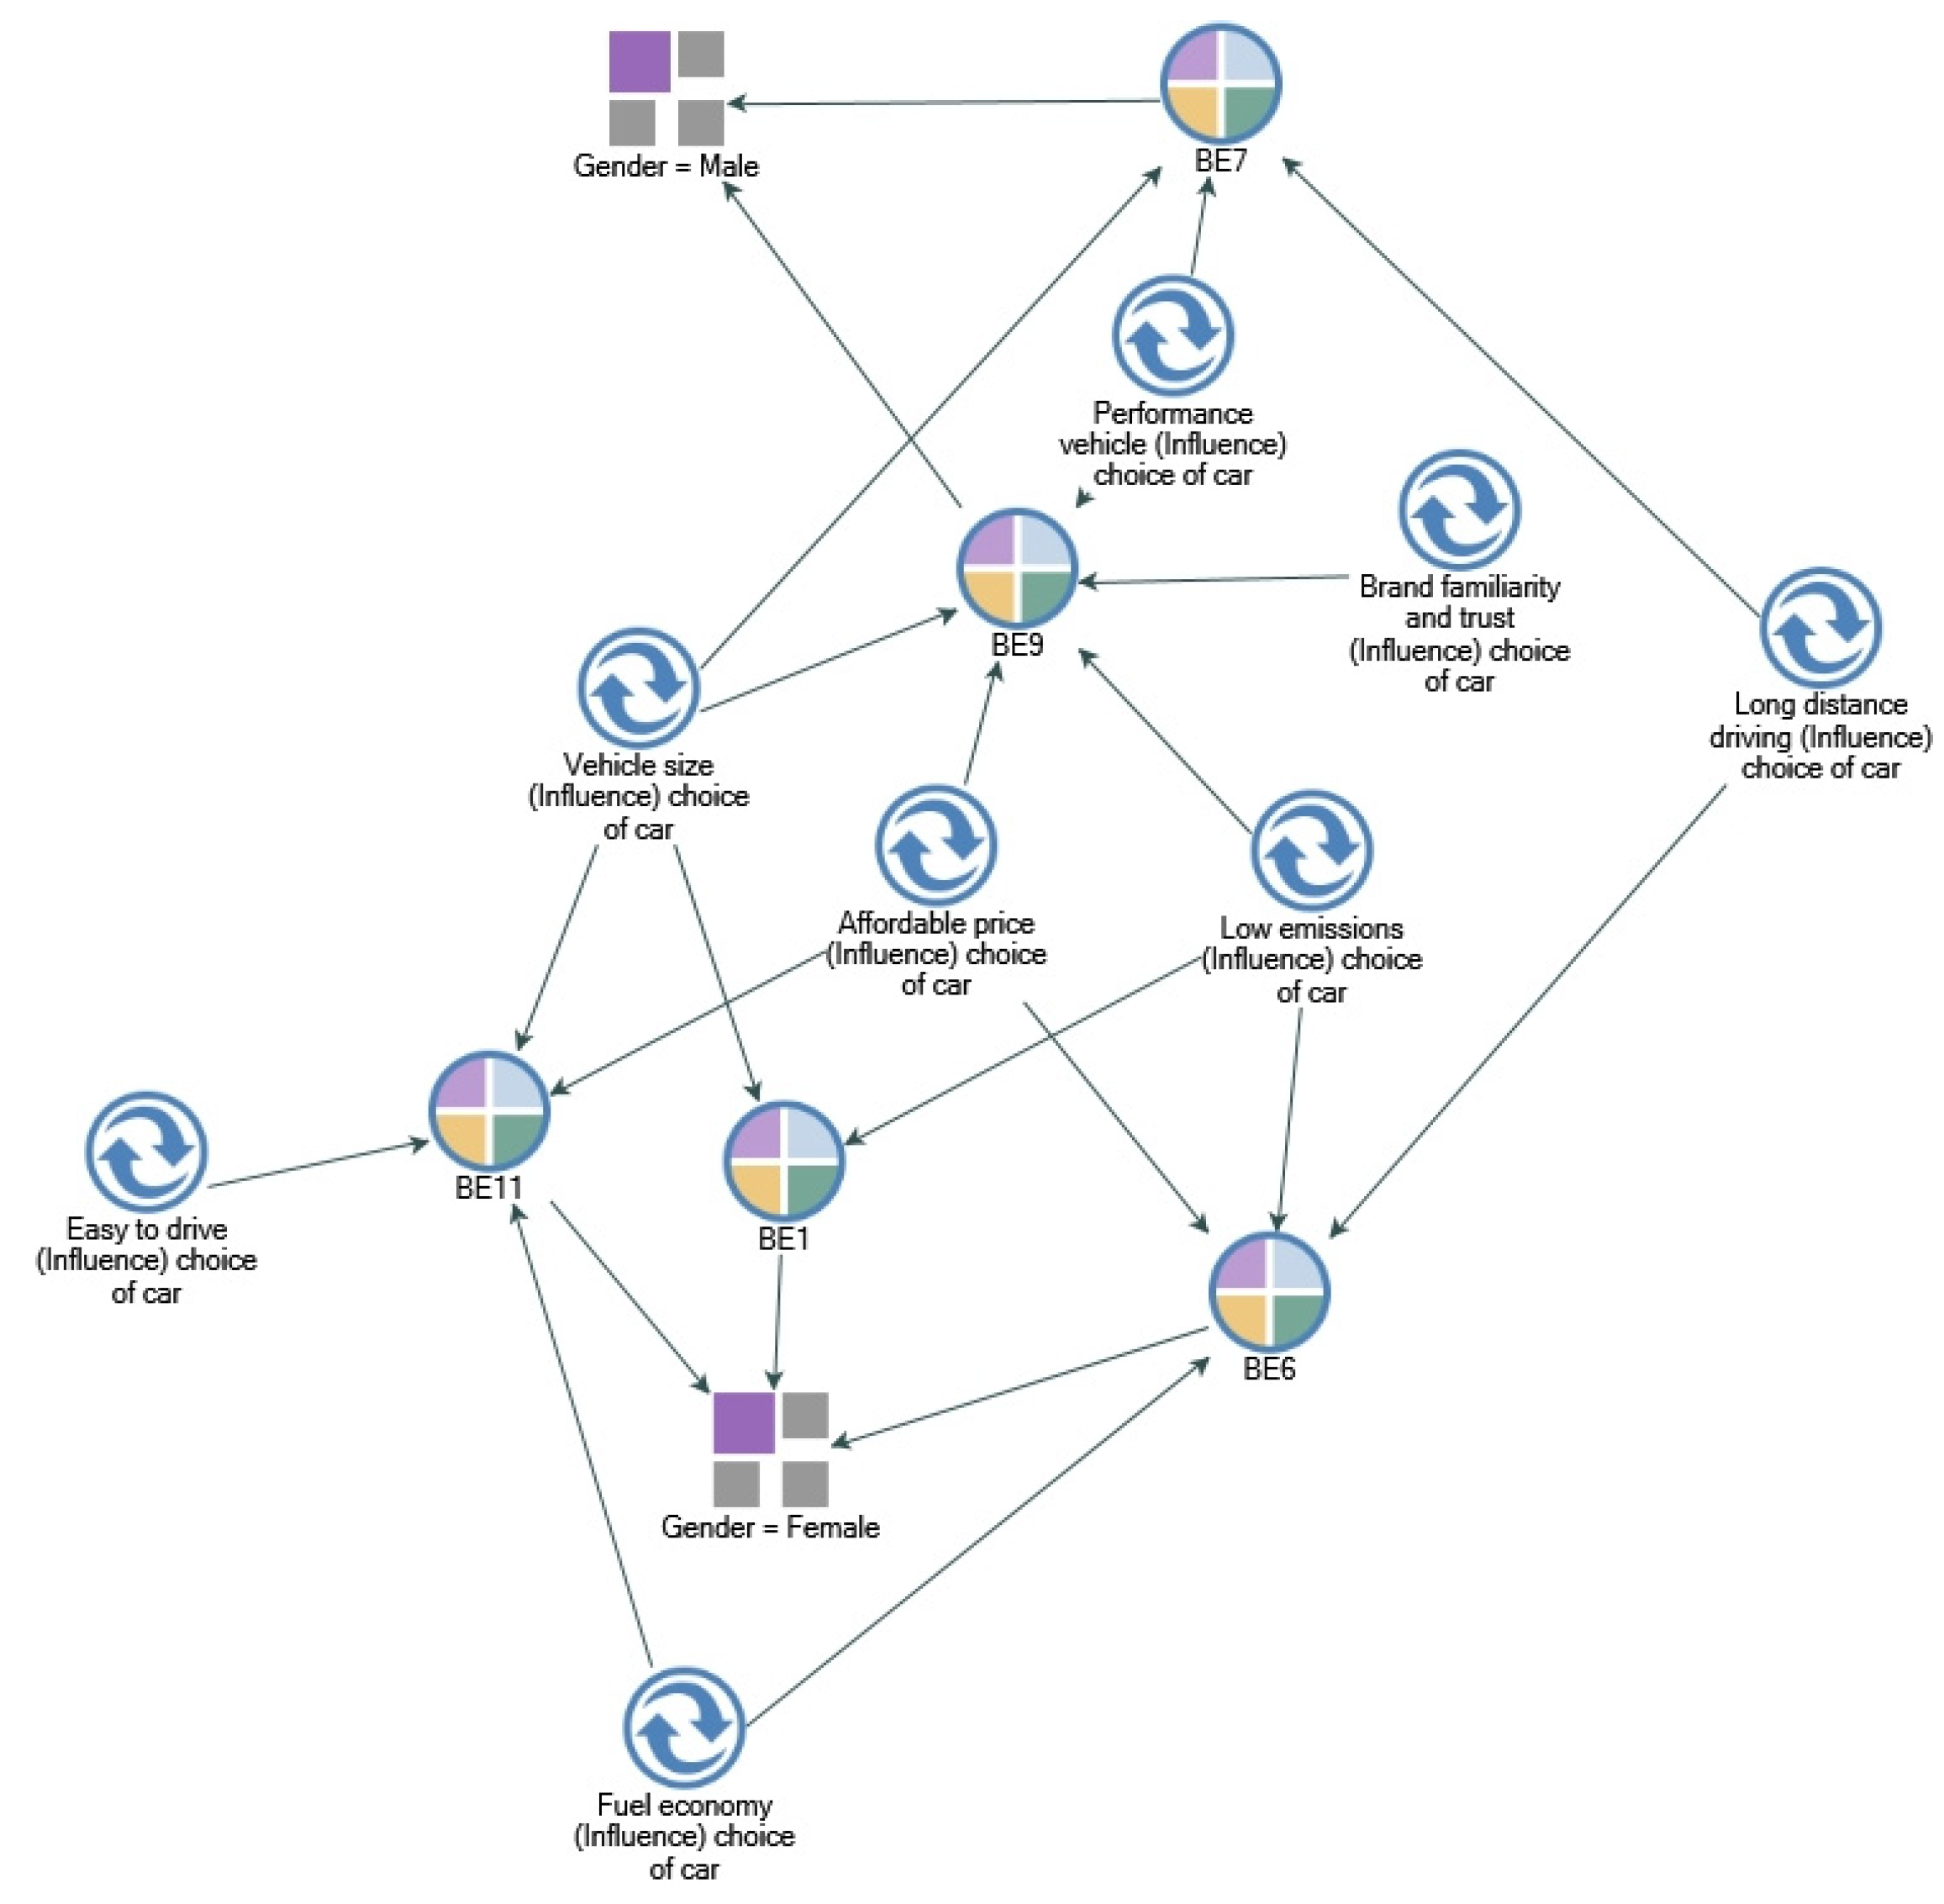
3.3. Factors Influencing Vehicle Choices

The analyses identified several factors (including personal, vehicle, and road and environment-related) that influenced existing vehicle choices for both the high-awareness and basic-awareness groups. Taking Belgian driver as an example, the qualitative models in Figure 1 and Figure 2 highlight how the identified factors govern vehicle choices for the sample and within models and also highlight gender dimensions. For the high–awareness group, which likes driving and speeding orientation, car choice is usually governed by performance-related factors, including speeding, fuel efficiency, safety, and affordability. On the other hand, for the basic-awareness group, a car is mainly a source of meeting basic travel needs and trust and brand familiarity, along with vehicle size and reliability, are the dominant factors in making such a decision. In the following excerpts, it can be noted that they are keeping the same style of car for quite some time, and the reason for doing so is that either they themselves and/or their spouses/other family members have the same style of car:
There is actually two Ford Fiestas. I have one of them I purchased at the time that I started learning to drive. So eight years ago and the other one I’ve been driving on for about a year… It’s a case of I think it’s just kind of come from the family, really from both sides of myself. And my wife or family of all we had Fords. And I prefer a smaller car because it’s kind of more convenient to come in back and forth in city drive and stuff like that than a larger car as well.
(UK/7)
For the Greek sample, ease of parking and driving in the city centre and the age of the vehicle are also identified as the important factors influencing the choice of car. What can be concluded is that for this group, unlike the high-awareness group, car choice is more about making safe, reliable and regular options rather than seeking high performance vehicles with efficient fuel economy.
Overall, there were some differences noted with respect to gender and vehicle choices. However, as the sample size was small, conclusions should be treated with caution to avoid stereotypes. It is noted that female car choices, the nature of trips and driving mileage are highly influenced by their personal factors (e.g., absence of spouse, dependent children) and may also influence their driving styles, as reflected in the excerpt below from a participant in the basic-awareness group:
‘So, in a normal life I am a mom in a family with two children. I have a job that runs on 4/5th. So, in principle I have to move my car to work 4 days a week, and in addition to that I’m in charge of the housekeeping and everything that goes with it.
(BE4/F)
This contrasts with males who seemed to be more independent in making their choices and opting for vehicles and fuel choices based on their likings. Other than gender, the presence of dependent children is identified as the single most important factor influencing vehicular choices. Compared to single drivers who indicated a preference for small-size and easy-to-drive city cars, it can be concluded that drivers with dependent children are most likely to opt for larger vehicle sizes simply because they need a comfortable, spacious people carrier.

3.4. Motivations and Barriers to Switch to Electric Cars

When picking up the discussion around buying their next car and otherwise during the interview, a theme capturing motivations and barriers to switching to electric/hybrid cars has emerged. Participants identified factors such as saving in fuel costs, the opportunity to promote environmentally friendly business, the cars of the future, development in infrastructure and vehicle technology, as well as environmental benefits associated with electric vehicles are some of the key advantages having the potential to lead to the purchase of an electric vehicle. However, the high price of electric vehicles, lack of infrastructure (e.g., availability of charging stations), and lack of performance and reliability are identified as the key barriers prohibiting the purchase of electric vehicles. Hence, many of the participants indicated a preference for hybrid vehicles, as reflected in the excerpt below from a participant in the basic-awareness group:
The hybrid is self-powered with energy. If there were stations so that I could charge my vehicle, the corresponding electric one, I would think about it. However, if I am not mistaken, in Greece this electricity supply network has not expanded so much, so making such a choice for me who is in the province I find it very difficult. That’s why I think that the next model both in low consumption and in general as a philosophy would be the hybrid because I do not have to stop and constantly look for where to find electricity, it is easier to find gasoline than electricity.
(GR2/M)
Participants with high awareness mentioned the environmental costs of EVs and did not believe the vehicles to be much more environmentally friendly than conventional engines. There was also a perception that these vehicles were boring. An excerpt from a participant in the basic-awareness group gives another perspective where eco-friendly preferences come secondary to affordability:
…it’s more to do with affordability. I’d love it if it didn’t pollute because then I feel really virtuous and like a good girl when I pulled up somewhere [e-pro secondary]. But, it’s about keeping the costs down so I can use it as much as I want to really use it without having to worry about it.
(UK1/F)
This was also supported by a participant from Sweden:
Yes, the reason is economical. I think most people are interested in saving money. But at the same time, I want to be a little better environmentally as well... So that it is, a bit economy, and a bit environment.
(SW6/M)

4. Conclusions

This study provides the results from 34 interviews carried out with drivers in Belgium, Greece, Sweden, and the UK to support the development of different incentives by eliciting user understanding about emissions. It is important to acknowledge that the aim of this qualitative research was not to generalise the findings to a wider population but rather to represent the viewpoints of a sample of participants from the four European countries. Hence, careful consideration should be made before generalising the study’s conclusions and developing a large-scale interpretation of the outcomes for other populations or regions. Based on the collective findings of the study, this section discusses some of the considerations and factors that can encourage change and prove useful in raising knowledge and awareness of car users and bringing sustainable change over the years. Firstly, it is important to acknowledge that people are happy to do their little bit for the environment wherever they can. They are also aware of the need to phase out fossil fuels and of the future of electric cars. So, a good starting point for educating drivers about emissions and raising awareness can be as local as their local garage and as universal as introducing role models. It is important to keep in mind that the study has found that although all the participants have basic to high-level awareness about vehicle pollution and its impacts, they may not always be able to adhere to good practices. This discord can be due to both internal and external factors, for instance, their mobility needs (school runs, driving to multiple locations for work) and meeting driving-related motives (e.g., seeking high performance and speeding orientations). External factors could be the behaviour of other drivers, forcing them to brake hard. Hence, it is important that interventions are designed to deal with such dimensions and educate people about strategies that can be adopted to adjust and regulate their driving behaviours without compromising on their mobility needs.
Saving in fuel costs can be a great eco-behaviour enabler. The interviews reveal that the eco-benefits are secondary compared to fuel economy. Eco-friendly practices are not the governing element while making these choices and only come as a secondary consideration. This study recommends that efforts to bring change should do the following: (i) Focus on raising awareness as a part of ‘civic responsibilities’; (ii) Inform about ‘personal advantages’ associated with eco-practices, including economic (e.g., saving fuel costs, maintenance costs) and health benefits (e.g., harmful exposure to pollutants both inside and outside of the car, especially for young children). It is also noted that there is limited understanding about sources of emissions among drivers, with exhaust emission as the most obvious source quoted by all. Hence, tests educating on different types and sources of emissions (e.g., abrasion emissions, evaporative emissions) and exposure to these emissions inside vehicles can be helpful in raising people’s awareness level as well as persuading them to change. Brand familiarity and trust is another important factor that may discourage change, and its effect is more pronounced in the basic-awareness group. The group is likely to keep the same style of car (may change the type of fuel) as this is what they are familiar with. Hence, it is important to look at factors that can encourage change and push people to make choices they are less familiar and comfortable with.
Apart from what has been concluded in the above section, this paper provides some key considerations to develop effective educational and awareness-raising campaigns as follows:
  • Essential elements of eco-driving campaigns: To appeal to drivers and increase their awareness of emissions from cars, the campaigns should give them the opportunity to compare driving efficiency over time and compare it to a baseline score. For instance, using a driving style app or industry standards (e.g., by performing an Exhaust PM Test). In addition, they should have a clear set of instructions that are easy to follow.
  • Intervention strategies amid technology revolution and targeting priority: Another important consideration is to develop time-relevant tests and interventions. For instance, if a driving style app is chosen as the best way to promote awareness, it is important to think about the practicality and lifespan of this intervention, as many new cars already possess these integrated features. Hence, in such cases, prioritisation and identification of target populations may prove helpful, i.e., old car users. In addition, drivers can be supported by technologies such as intelligent speed assistance, which are mandatory in all new vehicles in July 2024.
  • Integrating informational prompts, health appeal, cost saving and baselines: Associating ‘informational prompts’ (what can be done to reduce vehicle emissions, e.g., driving without excessive braking can help reduce carbon footprints by this amount) could be beneficial. Providing baseline standards (to compare emissions with other vehicles and driving styles, SWOT charts, driving scores with previous scores) or having health appeal (e.g., risks associated with excessive exposure to pollutants while sitting inside the car) could also help encourage behavioural change. Cost savings (e.g., how much fuel and maintenance costs are saved by driving at consistent speed) with eco-driving can help increase the effectiveness of awareness-raising campaigns.
  • User-centric language: It is recommended that content be developed based on user-centric language. For example, all drivers mostly reported similar speed management-related behaviours. However, the use of words is different. For instance, the UK drivers used the term smooth speed more than the Greek and Belgian drivers, who used low speed or low rpms. Hence, the integration of local expression can prove useful in raising the driver’s practical knowledge.
  • It is also noted that all the drivers described their driving style as always being in the context of road safety, e.g., careful, safe, calm driver. It would be useful to develop content that can help them evaluate and describe their driving from an eco-driving perspective.
This leads to the conclusion that a car driver’s choices and behaviours are governed by their personal needs. Hence, efforts to reduce emissions and to encourage eco-driving needs to come up with holistic approaches to support these ever-changing needs while at the same time not compromising on basic principles of driving in an eco-friendly manner.
I think I educate myself and hopefully that will, you know, help me with my drive and help me do that a little bit more than, you know, that I was doing yesterday. And hopefully tomorrow I’ll do that little bit more. (UK8/M)
When trying to change behaviour, the program for change needs to consider the target groups’ knowledge, beliefs, attitudes, norms, etc. In this context, the motives behind the action are vital since it influences behaviour more than anything else. Therefore, different user groups will require different approaches in terms of the content and delivery of information relating to emission-reducing behaviour. For example, some drivers may be motivated by pro-environmental information (e.g., climate change), whilst others will be more influenced by messages pertaining to the health impacts of pollutants. We, therefore, need to ensure that the message is relevant, that it will capture the attention of our audience, and that it will generate change.

Author Contributions

Conceptualization, Z.B., S.J. and S.F.; methodology, Z.B., S.J. and S.F.; software, Z.B.; validation, S.J. and S.F.; formal analysis, Z.B. and S.F.; investigation, Z.B. and S.F.; resources, S.J.; data curation, Z.B., S.J. and S.F.; writing—original draft preparation, Z.B., S.J. and S.F.; writing—review and editing, S.J. and S.F.; visualization, Z.B.; supervision, S.J.; project administration, S.J.; funding acquisition, S.J. All authors have read and agreed to the published version of the manuscript.

Funding

The uCARe project has received funding from the European Commission’s Horizon 2020 Programme Research and Innovation action under grant agreement No. 815002.

Institutional Review Board Statement

This research received ethics approval from the University of Leeds (AREA) Research Ethics Committee LTTRAN-119.

Informed Consent Statement

Informed consent was obtained from all subjects involved in the study.

Data Availability Statement

The authors do not have permission to share data.

Conflicts of Interest

The authors report there are no competing interests to declare.

References

  1. World Health Organization. Ambient (Outdoor) Air Pollution. 2018. Available online: https://www.who.int/news-room/fact-sheets/detail/ambient-(outdoor)-air-quality-and-health (accessed on 29 July 2024).
  2. Brunekreef, B.; Holgate, S.T. Air pollution and health. Lancet 2002, 360, 1233–1242. [Google Scholar] [CrossRef]
  3. European Environment Agency. Air Pollution: How It Affects Our Health. 2022. Available online: https://www.eea.europa.eu/en/topics/in-depth/air-pollution/eow-it-affects-our-health (accessed on 29 July 2024).
  4. Farokhi, A.; Heederik, D.; Smi, L. Respiratory health effects of exposure to low levels of airborne endotoxin—A systematic review. Environ. Health 2018, 17, 14. [Google Scholar] [CrossRef] [PubMed]
  5. Samet, J.M.; Dominici, F.; Curriero, F.C.; Coursac, I.; Zeger, S.L. Fine particulate air pollution and mortality in 20 U.S. cities, 1987–1994. N. Engl. J. Med. 2000, 343, 1742–1749. [Google Scholar] [CrossRef]
  6. Holgate, S.T. Every breath we take: The lifelong impact of air pollution’—A call for action. Clinical Medicine. J. R. Coll. Physicians Lond. 2017, 17, 8–12. [Google Scholar]
  7. Alam, M.d.S.; Hyde, B.; Duffy, P.; McNabola, A. Analysing the Co-Benefits of transport fleet and fuel policies in reducing PM2.5 and CO2 emissions. J. Clean. Prod. 2018, 172, 623–634. [Google Scholar] [CrossRef]
  8. Hao, H.; Chang, H.H.; Holmes, H.A.; Mulholland, J.A.; Klein, M.; Darrow, L.A.; Strickland, M.J. Air Pollution and Preterm Birth in the U.S. State of Georgia (2002–2006): Associations with Concentrations of 11 Ambient Air Pollutants Estimated by Combining Community Multiscale Air Quality Model (CMAQ) Simulations with Stationary Monitor Measurements. Environ. Health Perspect. 2016, 124, 875–880. [Google Scholar] [CrossRef] [PubMed]
  9. Liu, Y.; Xu, J.; Chen, D.; Sun, P.; Ma, X. The association between air pollution and preterm birth and low birth weight in Guangdong, China. BMC Public Health 2019, 19, 3. [Google Scholar] [CrossRef] [PubMed]
  10. Pedersen, M.; Giorgis-Allemand, L.; Bernard, C.; Aguilera, I.; Andersen, A.-M.N.; Ballester, F.; Beelen, R.M.J.; Chatzi, L.; Cirach, M.; Danileviciute, A.; et al. Ambient air pollution and low birthweight: A European cohort study (ESCAPE). Lancet Respir. Med. 2013, 1, 695–704. [Google Scholar] [CrossRef] [PubMed]
  11. Bell, M.L.; Ebisu, K.; Belanger, K. Ambient air pollution and low birth weight in Connecticut and Massachusetts. Environ. Health Perspect. 2007, 115, 1118–1124. [Google Scholar] [CrossRef] [PubMed]
  12. Gouveia, N.; Bremner, S.A.; Novaes, H.M.D. Association between ambient air pollution and birth weight in São Paulo, Brazil. J. Epidemiol. Community Health 2004, 58, 11–17. [Google Scholar] [CrossRef]
  13. Behrman, R.E.; Butler, A.S. (Eds.) Preterm Birth: Causes, Consequences, and Prevention; National Academies Press: Washington, DC, USA, 2007. [Google Scholar]
  14. Kioumourtzoglou, M.A.; Raz, R.; Wilson, A.; Fluss, R.; Nirel, R.; Broday, D.M.; Hacker, M.R.; McElrath, T.F.; Grotto, I.; Koutrakis, P.; et al. Traffic-related Air Pollution and Pregnancy Loss. Epidemiology 2019, 30, 4–10. [Google Scholar] [CrossRef] [PubMed]
  15. Steffensen, F.H.; Sorensen, H.T.; Gillman, M.W.; Rothman, K.J.; Sabroe, S.; Fischer, P.; Olsen, J. Low birth weight and preterm delivery as risk factors for asthma and atopic dermatitis in young adult males. Epidemiology 2000, 11, 185–188. [Google Scholar] [CrossRef] [PubMed]
  16. O’Connor, G.T.; Neas, L.; Vaughn, B.; Kattan, M.; Mitchell, H.; Crain, E.F.; Evans, R.; Gruchalla, R.; Morgan, W.; Stout, J.; et al. Acute respiratory health effects of air pollution on children with asthma in US inner cities. J. Allergy Clin. Immunol. 2008, 121, 1133–1139. [Google Scholar] [CrossRef] [PubMed]
  17. Poloniecki, J.D.; Atkinson, R.W.; de Leon, A.P.; Anderson, H.R. Daily time series for cardiovascular hospital admissions and previous day’s air pollution in London, UK. Occup. Environ. Med. 1997, 54, 535–540. [Google Scholar] [CrossRef] [PubMed]
  18. Mustafić, H.; Jabre, P.; Caussin, C.; Murad, M.H.; Escolano, S.; Tafflet, M.; Périer, M.C.; Marijon, E.; Vernerey, D.; Empana, J.P.; et al. Main air pollutants and myocardial infarction: A systematic review and meta-analysis. J. Am. Med. Assoc. 2012, 307, 713–721. [Google Scholar] [CrossRef] [PubMed]
  19. World Health Organization. GBD 2000 Version 1 Estimates by Region: Mortality (Last Updated 10/3/01); WHO: Geneva, Switzerland, 2001. [Google Scholar]
  20. Finkelstein, M.; Jerrett, M. A study of the relationships between Parkinson’s disease and markers of traffic-derived environmental manganese air pollution in two Canadian cities. Environ. Res. 2007, 104, 420–432. [Google Scholar] [CrossRef] [PubMed]
  21. Calderón-Garcidueñas, L.; Reed, W.; Maronpot, R.R.; Henríquez-Roldán, C.; Delgado-Chavez, R.; Calderón-Garcidueñas, A.; Dragustinovis, I.; Franco-Lira, M.; Aragón-Flores, M.; Solt, A.C.; et al. Brain inflammation and Alzheimer’s-like pathology in individuals exposed to severe air pollution. Toxicol. Pathol. 2004, 32, 650–658. [Google Scholar] [CrossRef] [PubMed]
  22. Li, F.; Wu, K.; Fan, W.; Chen, G.; Tian, H.; Wu, X. Long-term exposure to air pollution and risk of incident inflammatory bowel disease among middle and old aged adults. Ecotoxicol. Environ. Saf. 2022, 242, 113835. [Google Scholar] [CrossRef] [PubMed]
  23. Kaplan, G.G.; Hubbard, J.; Korzenik, J.; Sands, B.E.; Panaccione, R.; Ghosh, S.; Wheeler, A.J.; Villeneuve, P.J. The inflammatory bowel diseases and ambient air pollution: A novel association. Am. J. Gastroenterol. 2010, 105, 2412–2419. [Google Scholar] [CrossRef] [PubMed]
  24. Eze, I.C.; Hemkens, L.G.; Bucher, H.C.; Hoffmann, B.; Schindler, C.; Künzli, N.; Schikowski, T.; Probst-Hensch, N.M. Association between ambient air pollution and diabetes mellitus in Europe and North America: Systematic review and meta-analysis. Environ. Health Perspect. 2015, 123, 381–389. [Google Scholar] [CrossRef] [PubMed]
  25. Neuburger, L.; Egger, R. Travel risk perception and travel behaviour during the COVID-19 pandemic 2020: A case study of the DACH region. Curr. Issues Tour. 2021, 24, 1003–1016. [Google Scholar] [CrossRef]
  26. Shakibaei, S.; De Jong, G.C.; Alpkökin, P.; Rashidi, T.H. Impact of the COVID-19 pandemic on travel behavior in Istanbul: A panel data analysis. Sustain. Cities Soc. 2021, 65, 102619. [Google Scholar] [CrossRef] [PubMed]
  27. Kelly, C.; Kenny, P.; O’Dwyer, M.; Quintyne, K. Impact of COVID-19 transport restrictions on ambient air pollutant concentrations and asthma-related hospital admissions. Public Health 2022, 211, 66–71. [Google Scholar] [CrossRef] [PubMed]
  28. Mueller, N.; Rojas-Rueda, D.; Cole-Hunter, T.; De Nazelle, A.; Dons, E.; Gerike, R.; Götschi, T.; Panis, L.I.; Kahlmeier, S.; Nieuwenhuijsen, M. Health impact assessment of active transportation: A systematic review. Prev. Med. 2015, 76, 103–114. [Google Scholar] [CrossRef] [PubMed]
  29. Tainio, M.; de Nazelle, A.J.; Götschi, T.; Kahlmeier, S.; Rojas-Rueda, D.; Nieuwenhuijsen, M.J.; de Sá, T.H.; Kelly, P.; Woodcock, J. Can air pollution negate the health benefits of cycling and walking? Prev. Med. 2016, 87, 233–236. [Google Scholar] [CrossRef] [PubMed]
  30. Zhao, P.; Li, S.; Li, P.; Liu, J.; Long, K. How does air pollution influence cycling behaviour? Evidence from Beijing. Transp. Res. Part D Transp. Environ. 2018, 63, 826–838. [Google Scholar] [CrossRef]
  31. Sivak, M.; Schoettle, B. Eco-driving: Strategic, tactical, and operational decisions of the driver that influence vehicle fuel economy. Transp. Policy 2012, 22, 96–99. [Google Scholar] [CrossRef]
  32. Gallus, J.; Kirchner, U.; Vog, R.; Benter, T. Impact of driving style and road grade on gaseous exhaust emissions of passenger vehicles measured by a Portable Emission Measurement System (PEMS). Transp. Res. Part D Transp. Environ. 2017, 52, 215–226. [Google Scholar] [CrossRef]
  33. Liu, Y.; Chen, H.; Wu, S.; Gao, J.; Li, Y.; An, Z.; Mao, B.; Tu, R.; Li, T. Impact of vehicle type, tyre feature and driving behaviour on tyre wear under real-world driving conditions. Sci. Total Environ. 2022, 842, 156950. [Google Scholar] [PubMed]
  34. Pampel, S.M.; Jamson, S.L.; Hibberd, D.L.; Barnard, Y. Old habits die hard? The fragility of eco-driving mental models and why green driving behaviour is difficult to sustain. Transp. Res. F 2018, 57, 139–150. [Google Scholar] [CrossRef]
  35. Bryant, A.; Charmaz, K. (Eds.) The SAGE Handbook of Grounded Theory; Sage: London, UK, 2007. [Google Scholar]
  36. Hennink, M.; Kaiser, B. Sample sizes for saturation in qualitative research: A systematic review of empirical tests. Soc. Sci. Med. 2022, 292, 114523. [Google Scholar] [CrossRef]
  37. Saldana, J. Coding Manual for Qualitative Researchers; Sage Publications: Los Angeles, CA, USA, 2008. [Google Scholar]
  38. Michon, J.A. A Critical View of Driver Behavior Models: What Do We Know, What Should We Do? In Human Behavior and Traffic Safety; Evans, L., Schwing, R.C., Eds.; Springer: Boston, MA, USA, 1985. [Google Scholar]
Figure 1. Factors governing car choices of the high-awareness group (Belgium).
Sustainability 16 07136 g001
Figure 2. Factors governing car choices of the basic-awareness group (Belgium).
Sustainability 16 07136 g002
Table 1. Research questions and areas covered in the interviews.
AreasResearch Questions
KnowledgeWhat levels of understanding do drivers have about driving in an environmentally friendly fashion?
What pollutants do drivers think are emitted by their vehicles?
Do they have knowledge about NOx/CO2?
Do they know anything about particulates (PM2.5 and PM10)?
Do they know about the effects of pollutants on health and the environment?
What effects of NOx and particulates do they mention spontaneously?
SkillsWhich behaviours do drivers think they could easily adopt to reduce NOx and particulates? And alternatively, which would they find difficult and why?
Table 2. Classification of participants based on knowledge and awareness and personal and driving attributes of the groups (Belgium).
Knowledge and AwarenessHigh-Awareness GroupBasic-Awareness Group
BE1BE6BE11BE7BE9BE3BE5BE8BE10BE2BE4
Understanding about pollutant emissions
CO2xxx
NOxxxxxxxxxx
Particlesxxxxx
Understanding about sources of emissions
Exhaustxx
Brake dust/materials emissionxxx-xx
Understanding about pollutants estimations
Understand pollutant levels (e.g., thresholds, EU standards)-xxx-
Understanding about impacts of vehicle emissions
Health impactsx--
Environmental impactsxxxxx--
Understand Diesel/petrol fuel impacts----
Understanding about eco-behaviours and tampering
Understanding about eco-behaviours *BBBBHBHBBBB
Understand tamperingxxx-xx
Personal and driving attributes of drivers
GenderFFFMMMMMMFF
Age26–4026–4040–6026–4026–4018–2518–2518–2518–2526–4026–40
Employment **2212131312-
Dependent childrenxxxxxxxx
Car age (years)111261811147--1711
Fuel typeDPDDDDPPPPD
Note: - indicates ‘no discussion’; P indicates ‘Petrol’, D indicates ‘Diesel’. * B indicates Basic (<5) behaviours and H indicates High (>5) behaviours mentioned by participants (for reference, see Table 6). ** Employment 1 = Traditional, 2 = IT/analytics, 3 = Student.
Table 3. Classification of participants based on knowledge and awareness and personal and driving attributes of the groups (Greece).
Knowledge and AwarenessHigh-Basic-Awareness Group
GR1GR2GR7GR8GR4GR6GR3GR5
Understanding about pollutant emissions
CO2---x----
NOxxxxxxx
Particlesxxxxxxx
Understanding about sources of emissions
Exhaust-------
Brake dust/materials emission---X-x--
Understanding about pollutants estimations
MOT--------
Road tax-------
Pollutant emission (gm/km)xxxx-
Understanding about impacts of vehicle emissions
Health impacts-x-x
Environmental impacts----
Understand Diesel/petrol fuel impacts--x-x-
Understanding about eco-behaviours and tampering
Understanding about eco-behaviours *HHBHBBBB
Understand tamperingxx
Personal and driving attributes of drivers
GenderMMMFFFFF
Age26–4018–2518–2526–4026–4018–2526–4026–40
Employment **21211111
Dependent childrenX-X-X-
Car age (years)-1217710162520
Fuel type-P------
Note: - indicates ‘no discussion’; P indicates ‘Petrol’, D indicates ‘Diesel’. * B indicates Basic (<5) behaviours and H indicates High (>5) behaviours mentioned by participants (for reference, see Table 6). ** Employment 1 = Traditional, 2 = IT/analytics, 3 = Student.
Table 4. Personal and driving attributes of the groups (Sweeden).
SW1SW2SW3SW4SW5SW6SW7
GenderMFFMMMF
Age40–6026–4040–6018–2540–6040–6040–60
Employment **2213112
Dependent children--NoNoYesNoNo
Car age (years)2011200620152016200120082006
Fuel typeDPDDPFlexi-fuelP
Note: - indicates ‘no discussion’; P indicates ‘Petrol’, D indicates ‘Diesel’. ** Employment 1 = Traditional, 2 = IT/analytics, 3 = Student.
Table 5. Classification of participants based on knowledge and awareness and personal and driving attributes of the groups (UK).
Knowledge and AwarenessHigh-Awareness GroupBasic-Awareness Group
UK1UK5UK3UK8UK6UK7UK2UK4
Understanding about pollutant emissions
CO2xx
NOxxxxxx
Particlesxxxxx
Understanding about sources of emissions
Exhaust
Brake dust/materials emissionxxxxx
Understanding about pollutant estimations
MOT-xxx
Road taxx-
Understanding about impacts of vehicle emissions
Health impacts----
Environmental impacts---
Understand Diesel/petrol fuel impactsx---x
Understanding about eco-behaviours and tampering
Understanding about eco-behaviours *HHHHBBBB
Understand tamperingxx
Personal and driving attributes of drivers
GenderFFMMMMFF
Age40–6040–6040–6040–6026–4026–4040–6040–60
Employment **12221/3211
Dependent childrenxxx
Car age (years)1212221120.5
Fuel typePetrolPetrolDieselDieselPetrolPetrolDieselDiesel
Note: - indicates ‘no discussion’; P indicates ‘Petrol’, D indicates ‘Diesel’. * B indicates Basic (<5) behaviours and H indicates High (>5) behaviours mentioned by participants (for reference, see Table 6). ** Employment 1 = Traditional, 2 = IT/analytics, 3 = Student.
Table 6. Participants’ identification of driving styles promoting eco-driving (UK).
LevelBehavioursHigh-Awareness GroupBasic-Awareness Group
UK1UK5UK3UK8UK6UK7UK2UK4
In-trip behaviours ***Avoid harsh braking -
Smooth speed--
Avoid idling------
Gear use-----
Heavy acceleration/deceleration--
Anticipating traffic and traffic lights-----
Pre-trip behaviours **Trip chaining/Journey planning-----
Servicing and maintenance-------
Avoid traffic congestion-------
Car sharing/carpooling------
Alternative options (cycling)-----
Route selection-------
Vehicle weight/size------
Strategic *Using hybrid/electric car------
Economic performance engine car-------
Technology-assisted vehicle-------
Cycling------
Note: ✓ indicates ‘yes’, - indicates ‘no discussion’. Sustainability 16 07136 i001 indicates females, Sustainability 16 07136 i002 indicates male driver drivers. * Strategic level—covers overall travel goals and planning; ** Pre-trip behaviours—governs deliberate manoeuvres such as passing; *** In-trip behaviours—involves automatic actions such as lane tracking and speed control.
Disclaimer/Publisher’s Note: The statements, opinions and data contained in all publications are solely those of the individual author(s) and contributor(s) and not of MDPI and/or the editor(s). MDPI and/or the editor(s) disclaim responsibility for any injury to people or property resulting from any ideas, methods, instructions or products referred to in the content.

