Article

Remote Sensing Inversion of Soil Organic Matter Content in Straw-Returned Fields in China’s Black Soil Region

1
College of Geographic Science and Tourism, Jilin Normal University, Siping 136000, China
2
General Station of Soil and Water Conservation Monitoring, Ningxia Hui Autonomous Region, Yinchuan 750001, China
*
Author to whom correspondence should be addressed.
Sustainability 2024, 16(16), 7058; https://doi.org/10.3390/su16167058
Submission received: 16 June 2024 / Revised: 3 August 2024 / Accepted: 15 August 2024 / Published: 17 August 2024

Abstract

:
China’s black earth region is the country’s corn golden belt, and returning corn straw to the field not only helps improve the Soil Organic Matter (SOM) content and soil fertility, but also resolves environmental pollution caused by straw burning. To study the effects of different years and amounts of straw returned to the field on SOM content, this study used soil sampling data from a conservation tillage experimental base in Gaojia Village, Lishu County, combined with indoor measurements of imaging spectral data, to establish a prediction model of SOM content by applying partial least squares regression, and inverting the SOM content in the study area. The results showed that the PLSR model accuracy using indoor measured soil imaging spectral data as the independent variable was high. The accuracy coefficients of samples with different field return and different field return amounts, R2, were 0.9176 and 0.8901, respectively, which better predicted SOM content. In the 0–50 cm tillage layer, the highest average SOM content of 39.73 g/kg was found under the NT-1 treatment with different no-tillage straw return year treatments. The depth of the tillage layer in the typical black soil region of Northeast China is around 0–20 cm, and the most significant increase in SOM content was observed in the experimental samples under the NT-1 treatment. SOM content in NT-1 treatment increased by 31.83% compared with CK-1, 68.24% compared with CK-2, 72.18% compared with NT-0, 699.48% compared with NT-2, and 311.44% compared with NT-3, respectively. The highest SOM content of 31.9 g/kg was found in NT-100 under the different treatments of different years of field return. At the 0–20 cm soil layer, the SOM content increases most significantly under NT-100 treatment, which is the most suitable treatment method for straw return to the field. And NT-100 is 22.09% higher than CK-1, 55.36% higher than CK-2, 58.99% higher than NC-0, 115.95% higher than NT-33, and 48.72% higher than NT-67, respectively. This study provides data that can support the conservation of soil ecosystem diversity and sustainable soil use, and it also enriches the application of the PLSR model application.

1. Introduction

Returning straw to the field is an important channel for the utilization of straw resources [1], which can not only effectively solve the air pollution problems caused by straw burning, but also improve soil fertility and promote higher crop yields. This is an important measure for the protection and utilization of farmland resources in black soil [2]. Straw is a valuable organic fertilizer resource [3], and returning corn straw to the field can increase the Soil Organic Matter (SOM) content [4], improve soil structure, and increase the nutrient content of soil [5]. SOM is a soil component that maintains ecological balance and sustainable development of agriculture [6] and is also an important factor affecting global warming. SOM content is crucial for soil quality [7]. Some studies have shown that returning straw to the field benefits soil carbon sequestration, increasing soil active organic carbon content and improving microbial activity [8,9]. However, how different years and amounts of straw return drive the relationship between straw return and SOM is not clear, and few studies have been conducted to quantitatively analyze the relationship between SOM content and straw return methods in black soils. Quantitatively analyzing the effects of different straw return methods on SOM content under no-tillage conditions can improve the SOM content and resource utilization [10,11]. This is an important way to achieve sustainable development and agricultural development while providing scientific references for quantitative research and land resource management [12].
In recent years, global scholars have studied the determination of SOM content, and the most commonly used laboratory chemical analysis methods, including the wet burning method, dry burning method, potassium dichromate volume method, instrument analysis, direct burning method, etc. [13,14]. This chemical analysis method is time-consuming and costly, which makes it unsuitable for monitoring and analyzing SOM content over large areas and periodically [15]. Moreover, the expression form of the results is scattered dot data, which cannot be measured quickly and fully, and it is difficult to meet the requirements of dynamic monitoring of soil change, accurate prevention and control of soil damage, and soil environmental ecological restoration.
In contrast, soil hyperspectral technology has been widely used to estimate SOM content due to its convenience and low cost [16]. Viscarra Rossel and Behrens et al. collected 1104 soil spectral data taken from different regions of Australia and utilized algorithms such as partial least squares regression, multivariate adaptive regression spline, and random forests in combination with discrete wavelet transform and feature selection to model and compare the SOM content, clay content, and pH. They found that the SOM content prediction performed better when modeled using full-spectrum data. Sewpersad explored the relationship between SOM content and soil spectral reflectance in KwaZulu-Natal, South Africa, and found a moderate negative correlation between SOM concentration and spectral reflectance, emphasizing that spectroscopy is extremely important for assessing SOM content. The least square regression analysis shows that the spectral data R2 = 0.46 [17]. Sun et al. proposed a method based on a genetic algorithm to select the spectral features of soil constituents and combine them with PLSR to estimate SOM content. The results of their study showed that the model had higher prediction accuracy and was better able to estimate the SOM content [18]. A current topic in the research on SOM content inversion based on imaging spectral data is how to improve accuracy by improving the prediction method and optimizing the inversion model [19,20]. With the development of precision agriculture, the demand for rich information that can be provided by geographic information technology has gradually increased [21]. Some scholars have used the drying and weighing method to study the effects of no-tillage with different amounts of straw mulch on the microbial community and its residue in black soil, finding that the treatment of different amounts of straw mulch can promote the accumulation of SOM to different degrees [22]. The use of imaging technology to establish a prediction model for SOM content to achieve rapid prediction of SOM content is mature [23], but the application of inversion to obtain organic matter data for analyzing SOM content change has rarely been reported.
The black soil zone in Northeast China is one of the four major black soil belts in the world, known for its high SOM content and fertile soil. It is an important food production base in China and plays an important role in guaranteeing national food security [24]. However, long-term high-intensity utilization, coupled with soil erosion, has resulted in a significant decrease in SOM content, seriously affecting the sustainable development of agriculture in the northeast [25]. Therefore, there is an urgent need to research how to protect black soil and improve its quality. In this study, we took the experimental base of conservation tillage in Gaojia Village, Lishu County, Jilin Province, a typical area of black soil, as the research object. We established a PLSR model to estimate the SOM content and explored the effects of different years of corn straw return and the amount of corn straw on the characteristics of the changes in the SOM content. Our goal was to provide scientific references for the sustainable development of agriculture in the northeast region and the rapid inversion of the SOM.

2. Materials and Methods
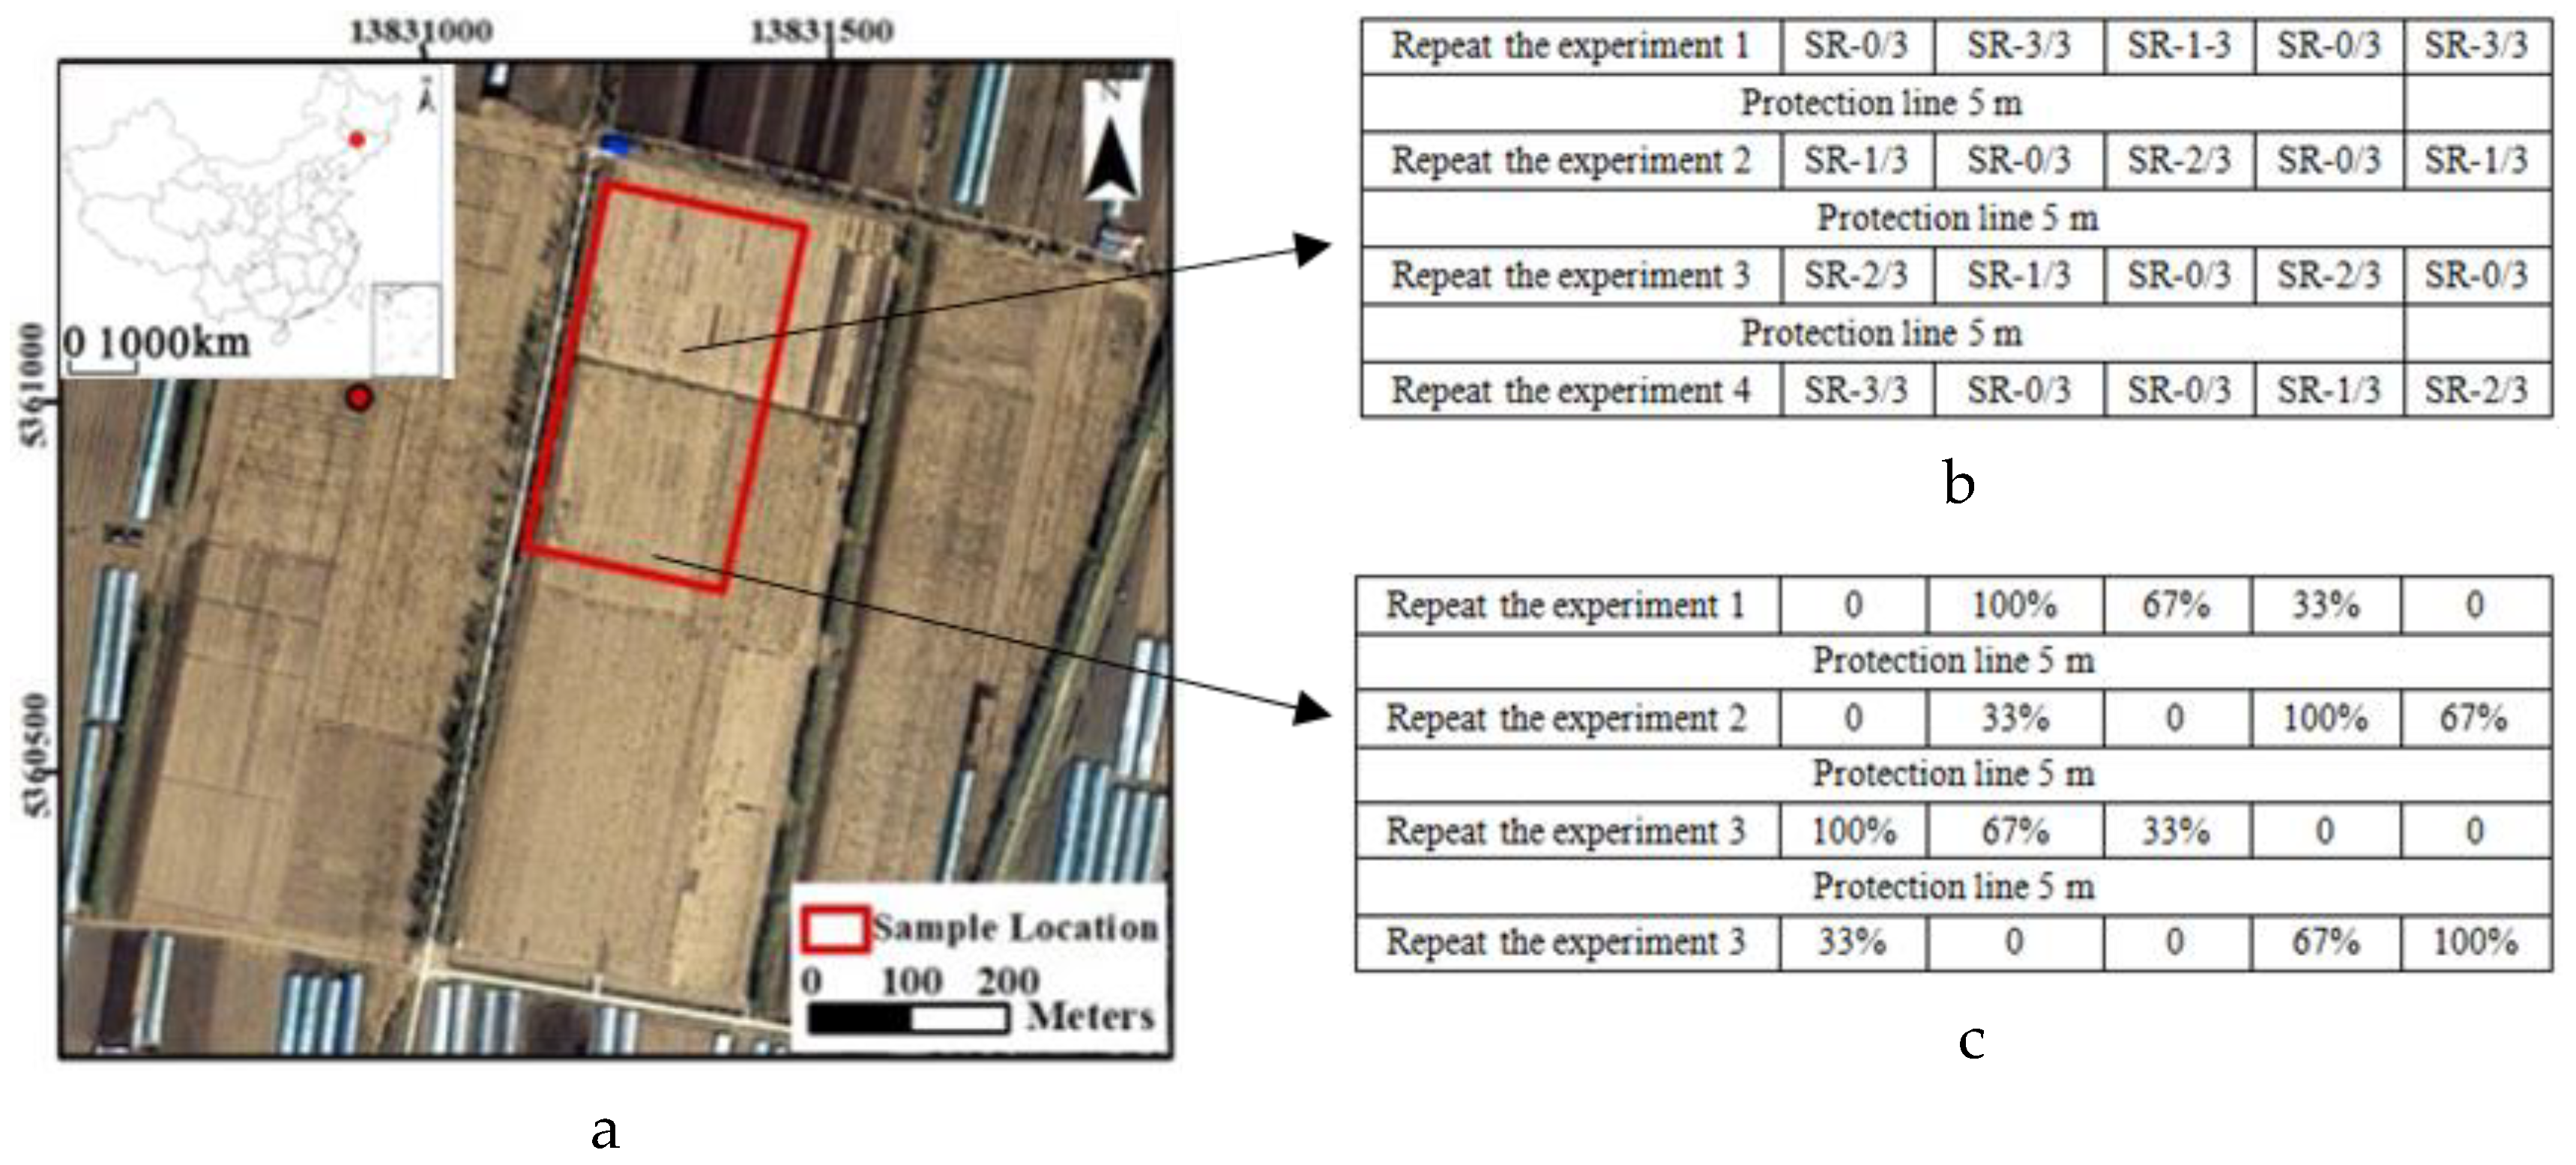
2.1. Study Area

The study area is located in the conservation tillage research and development base in Gaojia Village, Lishu County, Jilin Province, China (43°18′51″–43°19′12″ N, 124°14′26″–124°14′31″ E, Figure 1). The study area has a temperate semi-moist monsoon climate, with average annual sunshine hours of 2698.5 h and a frost-free period of 152 d. Precipitation is mainly concentrated in June–August, with average annual precipitation of 671.1 mm, and an average annual temperature of 6.7 °C. The soil parent material in the experimental area is loamy clay loam, and the soil type is mesic black soil.

2.2. Experimental Design

The experimental field was constructed in April 2007 and four treatments were set up in the sample area according to the different years of straw return: no-tillage with no corn straw amount mulching (NT-0), three years of cultivation with one year of straw all returned to the field (NT-1), three years of cultivation with two years of straw all returned to the field (NT-2), and three years of cultivation with all the straw returned to the field in consecutive years (NT-3) (Figure 1b). Four treatments were set up with different amounts of no-till straw mulching: no-till + 0% corn straw volume mulching (NT-0), no-till + 33% corn straw volume mulching (NT-33), no-till + 67% corn straw volume mulching (NT-67) and no-till + 100% corn straw volume mulching (NT-100) (Figure 1c). There were seven treatments in the experimental plots with four replications for each treatment, and each plot was 8.7 m × 30 m. The sample area was generally laid out against the northwest side, and protection rows were set up on both the north and west sides. The conventional traditional cultivated land around the sample plot was selected as a reference (CK-1, CK-2), and the measurement time and method were the same as those of the sample plot.
The no-tillage straw treatments with different years of mulching were as follows: mulch the straw evenly on the surface according to different years, remove the remaining straw, and sow the seeds directly in spring without further land preparation. All treatments were compared with the conventional tillage sample plots (CK-1 and CK-2), which were left with about 30 cm of stubble after the autumn harvest. The remaining straw was removed from the experimental plots after normal tillage. The soil was not further disturbed after seeding and fertilizer, and the sample plots were set up with a height of about 15 cm for the cultivated ridges and a distance of about 60 cm between the ridges. The seed sown in the experiment was of the same type and quantity as the fertilizer applied. The maize variety was Xianyu335 and the fertilizer application was 252 kg N·hm−2, 135 kg P·hm−2 and 90 kg K·hm−2.
Soil samples were collected on 29 April 2023, when the experimental sample plots were in the maize seedling stage. The soil was collected from 0 to 50 cm of the plowplow layer of each sample site, and the samples were labelled in cloth bags and brought back to the laboratory.

2.3. Sample Handling

Organisms and stones were excluded from the soil samples. Organisms included invasives (plant stubble, insects, stones, etc.) and neonates (ferromanganese nodules and lime nodules, etc.), and soil samples were placed in indoor shade after treatment to remove the effect of moisture on the imaging spectra [26]. Soil samples were hand rolled, ground and sieved through a 100-mesh sieve, and SOM content was determined by potassium dichromate-sulphuric acid digestion [27]. The experimental data were processed and graphed using Excel 2020.
The reflectance spectral data of soil samples were measured using a SOC710VP (Beijing Anzhou Technology Co., Ltd., Beijing, China) portable hyperspectral imager (spectral range of 400~1000 nm, resolution of 4.68 nm, and 128 bands) to determine the soil spectral characteristics [28]. During the measurement, the sieved soil samples were packed in a kraft paper box scraped flat with a straight edge and placed on top of a mobile platform. Spectral data from the samples were collected in a dark room and reflectance data were obtained after black-and-white correction [29]. Determined under controlled light source conditions, the SOC710VP imaging spectrometer was fixed on a push-sweep flat platform erected on the ground. To ensure the images were real and effective, a reference plate was used for correction before image acquisition and the acquisition and transmission of hyperspectral image feature information were completed by the system’s own indoor spectral data acquisition software, Hyperspec (SOC710). The image acquisition process was performed in a simulated laboratory environment, with the lens perpendicular to the grey plate. The Digital Number (DN) of the grey plate was the standard reference value of the image spectrum and the height of the objective lens from the samples was 130 cm. The samples were arranged according to serial number and placed on the standard grey plate, and the spectral image data were acquired. To prevent data loss due to image overexposure, changes in the radiance value were always observed during the experimental process. The collected imaging spectral reflectance data were extracted from the average reflectance spectral curves of each soil sample through the Region of Interest (ROI) in ENVI5.3 software, and the reflectance and SOM content within the range of the waveband of 400~2450 nm were retained for correlation analyses on a waveband-by-waveband basis.

2.4. Research Methodology

Partial Least Squares Regression (PLSR) concentrates the advantages of many analysis methods such as ordinary multiple linear regression, principal component analysis, typical correlation analysis, etc. It resolves the problems of covariance between independent variables, the number of samples is less than the number of variables and the computational complexity, and it can achieve many-to-many modelling [30,31,32]. The PLSR model was established using Matlab software and SOM content was used as the dependent variable to construct a PLSR-based SOM content prediction model [33], as well for analyzing the prediction results of different models.
The evaluation indexes of the remote sensing inversion model mainly include the coefficient of determination (R2), root mean square error calibration (RMSEC), root mean square error prediction (RMSEP) and relative prediction deviation (RPD). When the coefficient of determination R2 is close to 1, the model prediction is better. Smaller root means square error RMSEC and RMSEP values mean higher test data accuracy [34]. The relative analytical error RPD is the ratio of the standard deviation of prediction to the root mean square error of prediction RMSEP. When RPD ≥ 2.0, it indicates that the model has high reliability and prediction performance; 1.4 < RPD < 2.0 indicates that the model is more reliable and can be improved by other methods; and RPD ≤ 1.4 indicates that the model is unreliable. The R2, RMSE, and RPD formulas are as follows:
R 2 = x x ¯ y y ¯ x x ¯ 2 y y ¯ 2 2
R P D = i = 1 n y i y i 2 n 1 y R M S E
R M S E = 1 n i = 1 n y i y i ¯
where: x and x ¯ are the mean values of measured values and measured values, respectively. y and y ¯ are the mean values of predicted values and predicted values, respectively, y i , y i ¯ and y i are the averages of the model-predicted, measured and model-predicted values, respectively. n and y R M S E are the number of tests and root-mean-square error of the model sample, respectively.

3. Results

3.1. Soil Spectral Characteristics of Straw-Returned Land in Black Soil Areas

The spectral data from the soil samples were integrated, and to avoid the influence of edge noise from the original spectral reflectance between 350 and 399 nm, the test retained the range of the 400 to 2500 nm interval to obtain the average curve of soil spectral reflectance (Figure 2). In this study, soil samples were collected from the experimental field at the same time, the spectral data were collected indoors at the same time, and the composition of the chemical elements in the soil was basically the same, so the soil spectral reflectance data obtained from the experiment can be compared vertically to reflect differences in SOM content. The trends of the spectral curves of different SOM contents were consistent within a certain range, and the curves increased overall. There was a significant negative correlation between SOM content and reflectance: higher SOM content was related to weaker reflectance in the corresponding spectra.
Under no-tillage (CK-1, NT-0, NT-1, NT-2, NT-3) treatments with different years of field return (Figure 2a), the overall reflectance curves under NT-1 were lower than that of other treatments, and the overall reflectance under NT-3 was the highest, followed by reflectance under NT-2 reflectance curves under NT-0 and CK-1 treatments which were similar. Of the treatments with different straw return years, the highest SOM content was found under the NT-1 treatment.
Under no-tillage (CK-1, NT-0, NT-33, NT-67, NT-100) treatments with different amounts of field return (Figure 2b), the spectral curves were lower under NT-100 treatment than the other treatments, and the highest curve was found in NT-0 treatment, followed by NT-33, NT-67, and CK-1. Of them, the trend of CK-1, NT-33, and NT-67 treatment, the reflectance curves at 400–1400 nm were similar. Of the different straw return treatments, the highest SOM content was found under the NT-100 treatment.

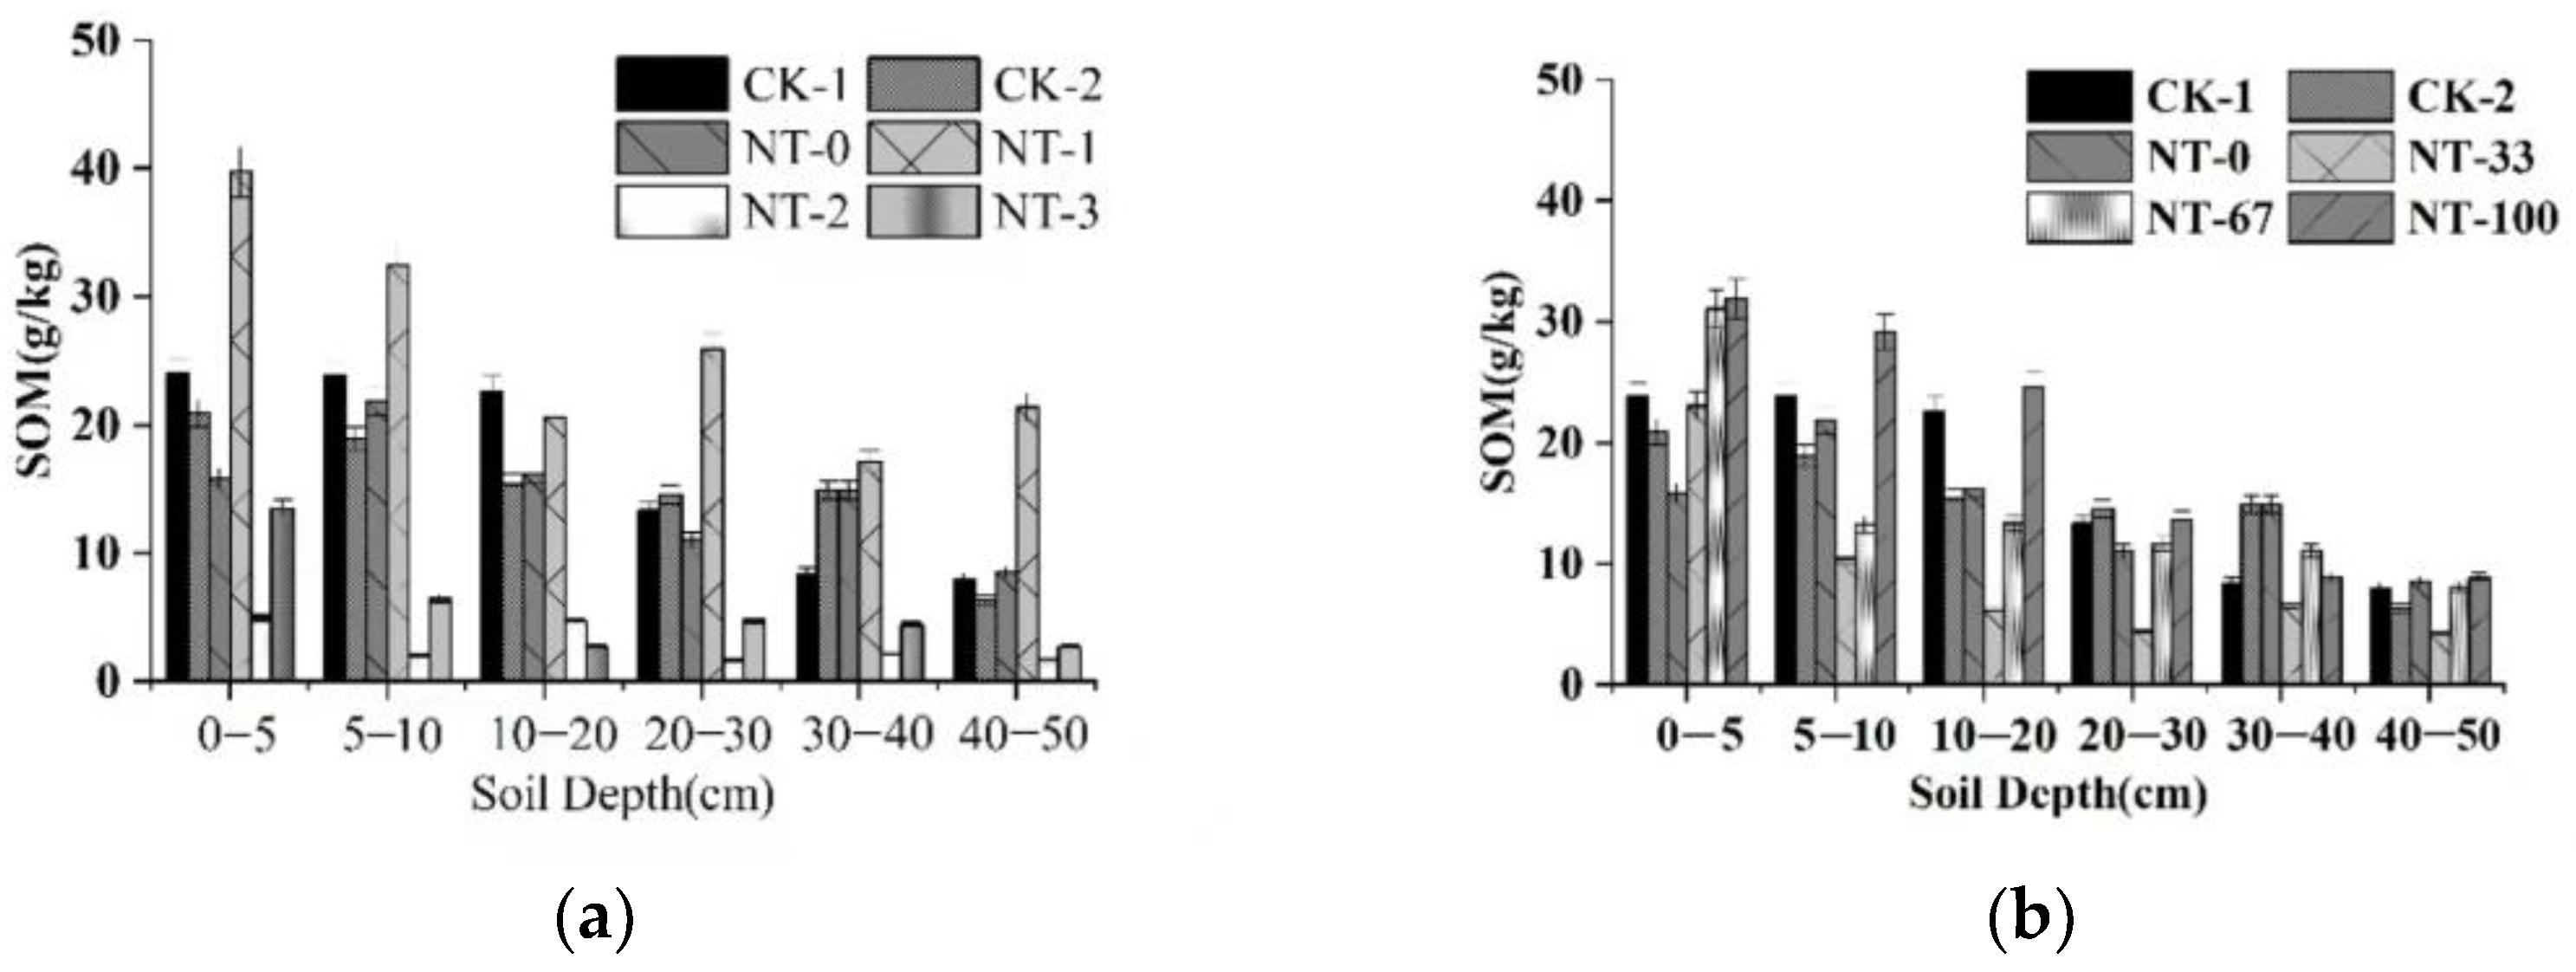
3.2. The Effect of Straw Return on SOM Content in Black Soil Areas

The average SOM content of NT-1 under different straw return year treatments was significantly higher than that of CK-1 and CK-2 in each tillage layer from 0 to 10 cm and 20 to 50 cm. In 0–5 cm topsoil, the average SOM content of NT-1 treatment was the highest (39.73 g/kg). At 0–20 cm topsoil, SOM content in NT-1 treatment increased by 31.83% compared with CK-1, 68.24% compared with CK-2, 72.18% compared with NT-0, 699.48% compared with NT-2, and 311.44% compared with NT-3, respectively. The overall trend of average SOM content in the 0–20 cm tillage layer was NT-1> CK-1> CK-2> NT-0> NT-3> NT-2, 30.94 g/kg, 23.47 g/kg, 18.39 g/kg, 17.97 g/kg, 7.52 g/kg, and 3.87 g/kg (Figure 3). The SOM content under NT-1 was greater than 20 g/kg in all tillage layers and increased slightly in the 20–30 cm tillage layer. The SOM content values for NT-2 and NT-3 treatments were lower than those for NT-0, NT-1, CK-1 and CK-2 in all tillage layers, and the SOM contents under CK1, CK-2 and NT-0 treatments tended to be the same. Under the treatment of NT-2, the SOM content was less than 10 g/kg in the 0–50 cm soil layer, and the SOM content decreased significantly in the 5–10 cm soil layer. SOM content under the NT-3 treatment was greater than 10 g/kg in the 0–5 cm layer and decreased from year to year in the 5–50 cm tillage layer. There was a slight increase in the 10–20 cm tillage layer. In comparison, the SOM content values in the 0–20 cm tillage layer under treatments CK-1 and CK-2 were stable at the same level. The SOM contents under both treatments were close to 20 g/kg in the 0–20 cm tillage layer and decreased in the 20–50 cm tillage layer in successive years. The SOM content under the NT-1 treatment was most significant, and it was the relatively effective method of soil conservation tillage. The CK-1, CK-2 and NT-0 treatments had no significant effects on SOM increase in general, and SOM content increased in the 0–20 cm tillage layer under the CK-1 and CK-2 treatments compared to NT-0 conditions. The depth of the tillage layer in the typical black soil region of Northeast China is around 0–20 cm, and conventional tillage has increased the soil porosity of the tillage layer and soil air content, which is conducive to the formation of SOM.
The SOM content of NT-100, under different straw return treatments, was the highest in the 0–20 cm tillage layer, and NT-100 is 22.09% higher than CK-1, 55.36% higher than CK-2, 58.99% higher than NC-0, 115.95% higher than NT-33, and 48.72% higher than NT-67, respectively. The SOM content values at 0–5 cm, 5–10 cm and 10–20 cm was around 30 g/kg and higher than that of the other treatments. The average SOM content values in the 0–20 cm tillage layer were 28.57 g/kg, 23.4 g/kg, 19.21 g/kg, 18.39 g/kg, 17.97 g/kg, and 13.22 g/kg for NT-100 > CK-1 > NT-67 > CK-2 > NT-0 > NT-33, respectively (Figure 3b). Therefore, the most significant increase in SOM content was observed under the NT-100 treatment, which was the most suitable treatment for the amount of straw returned to the field. As the straw return amount increased, SOM content also increased, and NT-100 treatment SOM content increased significantly. In the 20–50 cm plow layer, except for treatments CK-1 and CK-2, SOM content under other treatments decreased. In the 20–50 cm layer under the CK-1, CK-2, NT-0, NT-33, NT-67, and NT-100 treatments, SOM content decreased by 40.5 g/kg, 19.46 g/kg, 19.5 g/kg, 24.24 g/kg, 26.87 g/kg, and 54.37 g/kg compared to the 0–20 cm layer. SOM contents for the CK-1 and CK-2 treatments did not change significantly in the 0–20 cm layer of cultivation.
The SOM content under the no-tillage treatment increased in the pretreatment period and decreased after the increase in the number of years of returning to the field. This may have been because a large amount of SOM was released into the soil in the short term after the decomposition of straw returned to the field, but rainfall and other factors later caused a decrease in the SOM content. The SOM content increased when straw was returned to the field and the amount of mulching increased. This was because the higher exogenous organic carbon input was more favorable to microbial assimilation and anabolism, which promoted the accumulation of microbial residues and contributed more to soil organic carbon sequestration.

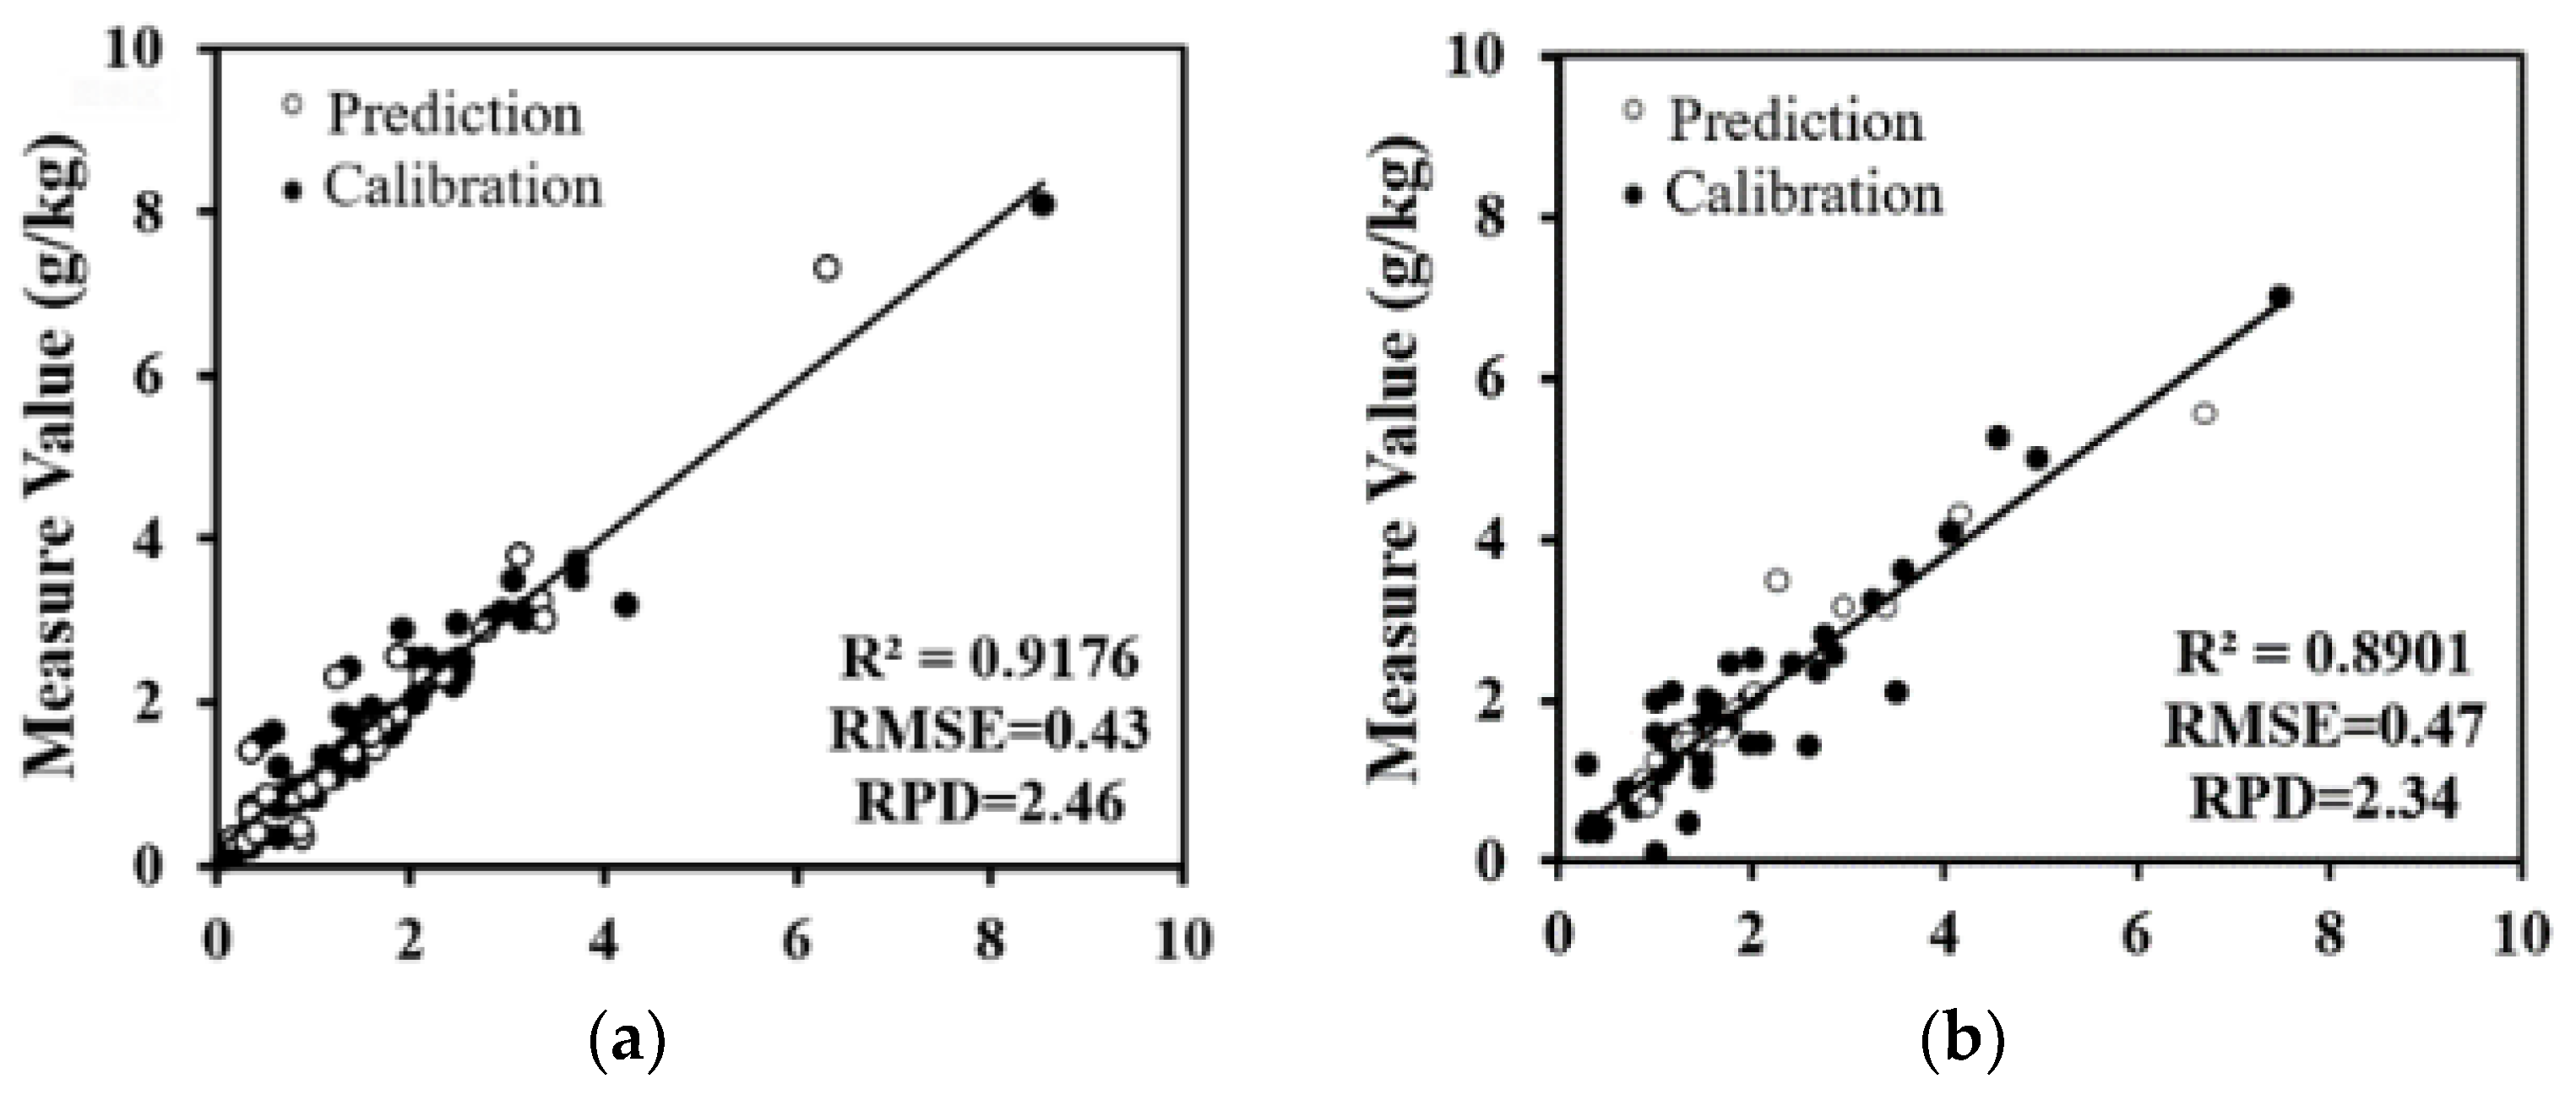
3.3. Assessment of Model Accuracy

The sample set of straw treatments with different years of return and the sample set of straw treatments with different amounts of return were divided into calibration and validation sets using the Kennard–Stone method. There were 72 samples in the calibration set and 42 samples in the validation set. To facilitate the comparison of the results, the soil numbers of the calibration and validation sets were kept the same. The prediction accuracies of the sample sets under different straw return year treatments were RMSE = 0.43%, and R2 = 0.9176. RPD = 2.46 (Figure 4a). Sample set prediction accuracies under different treatments for different amounts of straw returned to the field were RMSE = 0.47%, R2 = 0.8901, and RPD = 2.34 (Figure 4b). The PLSR organic matter model with imaging spectral data had a higher inversion accuracy, and the accuracy of the model was higher under different straw return year treatments than under different straw return amount treatments.

4. Discussion

4.1. Impact of Straw Return on SOM in Black Soil Areas

Under no-tillage conditions, treating the experimental field with different years of straw return significantly increased the SOM content in the soil matrix at a given plow layer depth, and the most significant effect of SOM content increase was found under the NT-1 treatment. At 0–20 cm topsoil, the average SOM contents under the NT-1 treatment increased by 31.83% and 68.24% compared with those of CK-1 and CK-2, respectively. The highest average SOM content was 39.73 g/kg under the NT-1 treatment, which was less than 10.00 g/kg in the 0–50 cm plow layer under the NT-2 and NT-3 treatments. In this regard, some scholars have analyzed the spatial and temporal patterns of SOM content before and after the widespread implementation of straw retention measures on a large scale in the high-production areas of Huantai County in northern China. Their study showed that the average SOM content of the county generally increased after the implementation of straw return to the field on a large scale [35]. Zhu et al. found that whereas the time of straw return to the field was the main limiting factor influencing the sequestration rate of organic carbon in Chinese soils, the total straw input was the key driving factor influencing the rate of SOM content increase [36]. This was consistent with the results of this study. The NT-2 and NT-3 treatments increased the SOM content, but the effect was not significant, which was consistent with the results of Guo et al. [37]. There was a threshold for the effect of straw return content on soil SOM. They analyzed the changes in SOM content and other trace elements content in crops and found that the SOM content and trace elements in soil under no-tillage conditions increased significantly [38], which was consistent with the results of this study. The SOM content was higher in the experimental group with no-tillage treatment, and Fan pointed out that the content of organic matter varied across different regions and land use types by studying the factors affecting Soil Organic Matter in eastern China [39]. Further research is needed on the effects of different regions on SOM content.

4.2. Evaluation of the PLSR Model

The use of hyperspectral data allowed for rapid and accurate monitoring of SOM content, and the selection of an appropriate quantitative estimation model was also particularly important. Compared with other models, the PLSR model was able to manipulate large and noisy datasets and was an effective model for predicting the dependent variable using a large number of independent variables [40]. Hermansen et al.’s PLSR model based on near-infrared spectra predicted the SOM content very well and had high model accuracy [41]. Wan et al. used the PLSR model to model different bands of imaging spectra with good SOM content prediction results at wavelengths of 414, 423, 431, 988 and 994 nm [42]. Spectroscopy to predict SOM is increasingly used successfully in several regions of the world, a practice that has greatly advanced our understanding of SOM [43]. In this regard, Hong et al. established a good correlation between SOM and the wavelength of visible light (VIS) and near-infrared (NIR) channels [44]. Wang et al. believed that under laboratory conditions, bands in the 440, 560, 625, 740 and 1336 nm regions were the best spectral bands estimated by SOM [45]. These studies demonstrate that spectroscopy can be used to successfully model and budget SOM content. The spectra in the wavelength band of 400–2500 mm selected in this study were used for the inversion of SOM content, and the model estimated SOM content with high accuracy. In this study, a PLSR prediction model was established for SOM content in different plow layers and different years of field return based on the soil hyperspectral data measured in a typical black soil test area in Northeast China. SOM content measured by the traditional method was used as a correction set to verify that the prediction accuracy of the PLSR model was better and was suitable for the inversion of SOM content.

5. Conclusions

The prediction accuracy of the PLSR model was higher, and it can provide a basis for the practical application of PLSR to predict SOM. The prediction accuracy of the sample set with different years of straw return was R2 = 0.9176, and the prediction accuracy of the soil with different amounts of straw return was R2 = 0.8901. There is a significant negative correlation between SOM content and reflectance. The higher the SOM content, the weaker the reflectance of the corresponding spectrum.
In the 0–50 cm tillage layer, the highest average SOM content of 39.73 g/kg was found under the NT-1 treatment with different no-tillage straw return year treatments. The depth of the tillage layer in the typical black soil region of Northeast China is around 0–20 cm, and the most significant increase in SOM content was observed in the experimental samples under the NT-1 treatment. SOM content in NT-1 treatment increased by 31.83% compared with CK-1, 68.24% compared with CK-2, 72.18% compared with NT-0, 699.48% compared with NT-2, and 311.44% compared with NT-3, respectively.
The highest SOM content of 31.9 g/kg was found in NT-100 under the different treatments of different years of field return. At the 0–20 cm soil layer, the SOM content increases most significantly under NT-100 treatment, which is the most suitable treatment method for straw return to the field. NT-100 is 22.09% higher than CK-1, 55.36% higher than CK-2, 58.99% higher than NC-0, 115.95% higher than NT-33, and 48.72% higher than NT-67, respectively.

Author Contributions

Conceptualization, H.D.; data curation, H.D.; formal analysis, W.Q.; investigation and methodology, H.D.; project administration, H.D.; resources, software, and supervision, H.D. and X.W.; validation and visualization, W.Q.; writing, W.Q. All authors have read and agreed to the published version of the manuscript.

Funding

This research was funded by Siping City Science and Technology Development Plan Project “Study on Spatial-Temporal Evolution and Coordination of Urban Spatial Form and Carbon Emission in Siping City”, grant number 2023073.

Institutional Review Board Statement

Not applicable.

Informed Consent Statement

Not applicable.

Data Availability Statement

Data are contained within the article.

Conflicts of Interest

The authors declare no conflicts of interest.

References

  1. Cui, H.; Luo, Y.; Li, C.; Chang, Y.; Jin, M.; Li, Y.; Wang, Z. Improving Soil Fertility and Wheat Yield by Tillage and Nitrogen Management in Winter Wheat–Summer Maize Cropping System. Agronomy 2023, 13, 740. [Google Scholar] [CrossRef]
  2. Zhao, Z.; Mao, Y.; Gao, S.; Lu, C.; Pan, C.; Li, X. Organic carbon accumulation and aggregate formation in soils under organic and inorganic fertilizer management practices in a rice–wheat cropping system. Sci. Rep. 2023, 13, 3665. [Google Scholar] [CrossRef] [PubMed]
  3. Wang, J.Z.; Wang, X.J.; Xu, M.G.; Gu, F.; Zhang, W.J.; Liu, C.A. Crop yield and soil organic matter after long-term straw return to soil in China. Nutr. Cycl. Agroecosys. 2015, 102, 371–381. [Google Scholar] [CrossRef]
  4. Zhao, Y.; Wang, M.; Hu, S.; Zhang, X.; Ouyang, Z.; Zhang, G.; Huang, B.; Zhao, S.; Wu, J.; Xie, D. Economics-and policy-driven organic carbon input enhancement dominates soil organic carbon accumulation in Chinese croplands. Proc. Natl. Acad. Sci. USA 2018, 115, 4045–4050. [Google Scholar] [CrossRef] [PubMed]
  5. Behrens, T.; Rossel, R.A.V.; Ramirez-Lopez, L.; Baumann, P. Soil spectroscopy with the Gaussian pyramid scale space. Geoderma 2022, 426, 116095. [Google Scholar] [CrossRef]
  6. Lavallee, J.M.; Soong, J.L.; Cotrufo, M.F. Conceptualizing soil organic matter into particulate and mineral-associated forms to address global change in the 21st century. Glob. Chang. Biol. 2020, 26, 261–273. [Google Scholar] [CrossRef] [PubMed]
  7. Ondrasek, G.; Begić, H.B.; Zovko, M.; Filipović, L.; Meriño-Gergichevich, C.; Savić, R.; Rengel, Z. Biogeochemistry of soil organic matter in agroecosystems & environmental implications. Sci. Total Environ. 2019, 658, 1559–1573. [Google Scholar]
  8. Luce, M.S.; Ziadi, N.; Rossel, R.A.V. GLOBAL-LOCAL: A new approach for local predictions of soil organic carbon content using large soil spectral libraries. Geoderma 2022, 425, 116048. [Google Scholar] [CrossRef]
  9. Tesfahunegn, G.B.; Tamene, L.; Vlek, P.L.G. Catchment-scale spatial variability of soil properties and implications on site-specific soil management in northern Ethiopia. Soil Till. Res. 2011, 117, 124–139. [Google Scholar] [CrossRef]
  10. Vaudour, E.; Gomez, C.; Lagacherie, P.; Loiseau, T.; Baghdadi, N.; Urbina-Salazar, D.; Loubet, B.; Arrouays, D. Temporal mosaicking approaches of Sentinel-2 images for extending topsoil organic carbon content mapping in croplands. Int. J. Appl. Earch Obs. Geoinf. 2021, 96, 102277. [Google Scholar] [CrossRef]
  11. Mirzaee, S.; Ghorbani-Dashtaki, S.; Mohammadi, J.; Asadi, H.; Asadzadeh, F. Spatial variability of soil organic matter using remote sensing data. Catena 2016, 145, 118–127. [Google Scholar] [CrossRef]
  12. Pittelkow, C.M.; Liang, X.; Linquist, B.A.; van Groenigen, K.J.; Lee, J.; Lundy, M.E.; van Gestel, N.; Six, J.; Venterea, R.T.; van Kessel, C. Productivity limits and potentials of the principles of conservation agriculture. Nature 2014, 517, 365–368. [Google Scholar] [CrossRef]
  13. Luo, M.; Liu, Y.; Li, J.; Gao, T.F.; Wu, S.; Wu, L.; Lai, X.J.; Xu, H.J.; Hu, H.X.; Ma, Y.H. Effects of Straw Returning and New Fertilizer Substitution on Rice Growth, Yield, and Soil Properties in the Chaohu Lake Region of China. Plants 2024, 13, 444. [Google Scholar] [CrossRef] [PubMed]
  14. Soriano-Disla, J.M.; Janik, L.J.; Viscarra Rossel, R.A.; Macdonald, L.M.; Mclaughlin, M.J. The performance of visible, near-, and mid-infrared reflectance spectroscopy for prediction of soil physical chemical, and biological properties. Appl. Spectrosc. Rev. 2014, 49, 139–186. [Google Scholar] [CrossRef]
  15. Guo, J.; Long, L.H.L.; He, J.; Mei, X.; Yang, G.J. Predicting soil organic matter contents in cultivated land using Google Earth Engine and machine learning. Trans. Chin. Soc. Agric. Eng. 2022, 38, 130–137. [Google Scholar] [CrossRef]
  16. Shi, T.Z.; Chen, Y.Y.; Liu, H.Z.; Wang, J.J.; Wu, G.F. Soil organic carbon content estimation with laboratory-based visible-near-infrared reflectance spectroscopy: Feature selection. Appl. Spectrosc. 2014, 68, 831–837. [Google Scholar] [CrossRef] [PubMed]
  17. Sewpersad, T.; Xulu, S.; Gebreslasie, M. The assessment of soil organic matter in the KwaZulu-natal province of South Africa and its relationship to spectroscopy data. Geocarto Int. 2024, 39, 2361702. [Google Scholar] [CrossRef]
  18. Sun, W.; Liu, S.; Zhang, X.; Li, Y. Estimation of soil organic matter content using selected spectral subset of hyperspectral data. Geoderma 2022, 409, 115653. [Google Scholar] [CrossRef]
  19. Shen, L.Z.; Gao, M.F.; Yan, J.W.; Li, Z.L.; Leng, P.; Yang, Q.; Duan, S.B. Hyperspectral Estimation of SOM Content using Different Spectral Preprocessing Techniques and PLSR Method. Remote Sens. 2020, 12, 1206. [Google Scholar] [CrossRef]
  20. Wang, X.M.; Yang, C.; Zhou, M.J. Partial Least Squares Improved Multivariate Adaptive Regression Splines for Visible and Near-Infrared-Based Soil Organic Matter Estimation Considering Spatial Heterogeneity. Appl. Sci. 2021, 11, 566. [Google Scholar] [CrossRef]
  21. Lees, K.J.; Quaife, T.; Artz, R.R.E.; Khomik, M.; Clark, J.M. Potential for using remote sensing to estimate carbon fluxes across northern peatlands—A review. Sci. Total Environ. 2018, 615, 857–874. [Google Scholar] [CrossRef]
  22. Lyu, F.Z.; Yang, Y.L.; Bao, X.L.; Zhang, C.R.; Zheng, T.T.; He, H.B.; Zhang, X.D.; Xie, H.T. Effects of no-tillage and different stover mulching amounts on soil microbial community and microbial residue in the Mollisols of China. Chin. J. Appl. Ecol. 2023, 34, 903–912. [Google Scholar] [CrossRef]
  23. Novacoski, E.J.; Caetano, I.K.; Melquiades, F.L.; Aline, M.G.; Torres, Y.R.; Gonzalez-Borrero, P.P. Spectroscopic based partial least-squares models to estimate soil features. Microchem. J. 2022, 180, 107617. [Google Scholar] [CrossRef]
  24. Yan, X.B.; Wang, Y.X.; Zhang, X.; Wang, Z.G.; Yang, S.; Li, Y.; Wang, C. Performance of preprocessing and multivariate methods in hyperspectral estimation of soil water content. Appl. Ecol. Environ. Res. 2022, 20, 2717–2732. [Google Scholar] [CrossRef]
  25. Yan, Y.; Ji, W.J.; Li, B.G.; Wang, G.M.; Hu, B.F.; Zhang, C.; Mouazen, A.M. Effects of Long-Term Straw Return and Environmental Factors on the Spatiotemporal Variability of Soil Organic Matter in the Black Soil Region: A Case Study. Agronomy 2022, 12, 2532. [Google Scholar] [CrossRef]
  26. Zhou, P.; Yang, W.; Li, M.; Wang, W. A New Coupled Elimination Method of Soil Moisture and Particle Size Interferences on Predicting Soil Total Nitrogen Concentration through Discrete NIR Spectral Band Data. Remote Sens. 2021, 13, 762. [Google Scholar] [CrossRef]
  27. Zhao, R.; Cui, X.M.; Liu, C. Inversion estimation of soil organic matter content based on GF-5 hyperspectral remote sensing image. China Environ. Sci. 2020, 40, 3539–3545. [Google Scholar] [CrossRef]
  28. Ben-Dor, E.; Chabrillat, S.; Demattê, J.A.M.; Taylor, G.R.; Hill, J.; Whiting, M.L.; Sommer, S. Using Imaging Spectroscopy to study soil properties. Remote Sens. Environ. 2008, 113, 38–55. [Google Scholar] [CrossRef]
  29. Tan, Y.; Jiang, Q.; Yu, L.; Liu, H.; Zhang, B. Reducing the Moisture Effect and Improving the Prediction of Soil Organic Matter with VIS-NIR Spectroscopy in Black Soil Area. IEEE Access 2021, 9, 5895–5905. [Google Scholar] [CrossRef]
  30. Ward, K.J.; Chabrillat, S.; Brell, M.; Castaldi, F.; Spengler, D.; Foerster, S. Mapping soil organic carbon for airborne and simulated EnMAP imagery using the LUCAS soil database and a local PLSR. Remote Sens. 2020, 12, 3451. [Google Scholar] [CrossRef]
  31. Reis, A.S.; Rodrigues, M.; Dos Santos, G.L.A.A.; de Oliveira, K.M.; Furlanetto, R.H.; Crusiol, L.G.T.; Nanni, M.R. Detection of soil organic matter using hyperspectral imaging sensor combined with multivariate regression modeling procedures. Remote Sens. 2021, 22, 100492. [Google Scholar] [CrossRef]
  32. de Santana, F.B.; de Giuseppe, L.O.; de Souza, A.M.; Poppi, R.J. Removing the moisture effect in soil organic matter determination using NIR spectroscopy and PLSR with external parameter orthogonalization. Microchem. J. 2019, 145, 1094–1101. [Google Scholar] [CrossRef]
  33. Gu, X.; Wang, Y.; Sun, Q.; Yang, G.; Zhang, C. Hyperspectral inversion of soil organic matter content in cultivated land based on wavelet transform. Comput. Electron. Agric. 2019, 167, 105053. [Google Scholar] [CrossRef]
  34. Liao, Q.; Gu, X.; Li, C.; Chen, L.; Huang, W.; Du, S.; Fu, Y.; Wang, J. Estimation of fluvo-aquic SOM content from hyperspectral based on continuous wavelet transformation. Trans. Chin. Soc. Agric. Eng. 2012, 28, 132–139. [Google Scholar]
  35. Zheng, L.; Wu, W.; Wei, Y.; Hu, K. Effects of straw return and regional factors on spatio-temporal variability of soil organic matter in a high-yielding area of northern China. Soil Till. Res. 2015, 145, 78–86. [Google Scholar] [CrossRef]
  36. Zhu, C.C.; Zhong, W.H.; Han, C.; Deng, H.; Jiang, Y.B. Driving factors of soil organic carbon sequestration under straw returning across China’s uplands. J. Environ. 2023, 335, 117590. [Google Scholar] [CrossRef]
  37. Guo, L.L.; Nie, Z.Y.; Zhou, j.; An, F.H.; Zhang, L.; Zhang, S.X.; Tóth, T.; Yang, F.; Wang, Z.C. Effects of organic amendments on soil bacterial community structure and yield in a saline-sodic soil cropped with rice. Land Degrad. Dev. 2023, 34, 5514–5527. [Google Scholar] [CrossRef]
  38. Phiwdaeng, N.; Polpinit, P.; Poltanee, A.; Kaewpradit, W. Land use change from paddy rice to sugarcane under long-term no-till conditions: Increase P balance, soil organic matter and sugarcane productivity. Arch. Agron. Soil Sci. 2024, 70, 1–17. [Google Scholar] [CrossRef]
  39. Fan, M.; Lal, R.; Zhang, H.; Margenot, A.J.; Wu, J.; Wu, P.; Zhang, L.; Yao, J.; Chen, F.; Gao, C. Variability and determinants of soil organic matter under different land uses and soil types in eastern China. Soil Till. Res. 2020, 198, 104544. [Google Scholar] [CrossRef]
  40. Wang, Q.; Li, P.; Chen, X. Modeling salinity effects on soil reflectance under various moisture conditions and its inverse application: A laboratory experiment. Geoderma 2012, 170, 103–111. [Google Scholar] [CrossRef]
  41. Hermansen, C.; Knadel, M.; Moldrun, P.; Grebe, M.H.; Karup, D.; de Jonge, L.W. Complete Soil Texture is Accurately Predicted by Visible Near-Infrared Spectroscopy. Soil Sci. Soc. Am. J. 2017, 81, 758–769. [Google Scholar] [CrossRef]
  42. Wan, S.M.; Hou, J.Q.; Zhao, J.S.; Claeke, N.; Kempenaar, C.; Chen, X.L. Predicting Soil Organic Matter, Available Nitrogen, Available Phosphorus and Available Potassium in a Black Soil Using a Nearby Hyperspectral Sensor System. Sensors 2024, 24, 2784. [Google Scholar] [CrossRef] [PubMed]
  43. Rossel, R.A.V.; Walvoort, D.J.J.; McBratney, A.B.; Janik, L.J.; Skjemstad, J.O. Visible, near infrared, mid infrared or combined diffuse reflectance spectroscopy for simultaneous assessment of various soil properties. Geoderma 2006, 131, 59–75. [Google Scholar] [CrossRef]
  44. Hong, Y.S.; Chen, S.C.; Liu, Y.L.; Zhang, Y.; Yu, L.; Chen, Y.Y.; Liu, Y.F.; Cheng, H.; Liu, Y. Combination of fractional order derivative and memory-based learning algorithm to improve the estimation accuracy of soil organic matter by visible and near-infrared spectroscopy. Catena 2019, 174, 104–116. [Google Scholar] [CrossRef]
  45. Wang, J.Z.; Tiyip, T.; Ding, J.L.; Zhang, D.; Liu, W.; Wang, F. Quantitative estimation of organic matter content in arid soil using Vis-NIR spectroscopy preprocessed by fractional derivative. J. Spectrosc. 2017, 2017, 1375158. [Google Scholar] [CrossRef]
Figure 1. Location of study area and field sampling points: (a) location of study area; (b) different years of straw return; and (c) different amounts of straw return.
Sustainability 16 07058 g001
Figure 2. Hyperspectral plots of SOM content for different straw mulch treatments: (a) different years of returning straw to the field; (b) different amounts of straw returned to the field.
Sustainability 16 07058 g002
Figure 3. Plot of SOM content under different straw mulch treatments: (a) different years of returning straw to the field; (b) different amounts of straw returned to the field.
Sustainability 16 07058 g003
Figure 4. Plot of predicted and true values for the sample set of years of straw return and amount of straw returned to the field: (a) different years of returning straw to the field; (b) different amounts of straw returned to the field.
Sustainability 16 07058 g004
Disclaimer/Publisher’s Note: The statements, opinions and data contained in all publications are solely those of the individual author(s) and contributor(s) and not of MDPI and/or the editor(s). MDPI and/or the editor(s) disclaim responsibility for any injury to people or property resulting from any ideas, methods, instructions or products referred to in the content.

