Article

Human Factor Performance Evaluation Model for Barrier-Free Access Facilities in Residential Communities Based on Demand Priority Levels of Four Typical Ramps

1
School of Architecture and Design, Harbin Institute of Technology, Harbin 150006, China
2
Key Laboratory of Cold Region Urban and Rural Human Settlement Environment Science and Technology, Ministry of Industry and Information Technology, Harbin 150006, China
*
Author to whom correspondence should be addressed.
Sustainability 2024, 16(16), 7035; https://doi.org/10.3390/su16167035
Submission received: 18 July 2024 / Revised: 10 August 2024 / Accepted: 12 August 2024 / Published: 16 August 2024

Abstract

:
The support capacity of built barrier-free facilities often does not align with the actual needs of urban residents, leading to travel obstacles for people with disabilities and posing a threat to the healthy and sustainable development of cities. It is necessary to evaluate the performance of barrier-free facilities from the perspective of demand. However, traditional performance evaluation methods conceal the differences in barrier-free facility performance among different groups of people. Therefore, this paper aims to clarify the barrier-free demand attributes of urban residents under different behavioral states, quantify the differences in residents’ needs based on demand priorities, and establish a human factor performance evaluation model for barrier-free facilities. Eighteen barrier-free needs of Chinese urban residents were identified through text mining. The demand priorities of individuals in various behavioral states for four typical ramps were then calculated using the Kano comprehensive satisfaction coefficient and importance coefficient. Expert evaluations of the facilities’ fulfillment of needs were gathered using the fuzzy Delphi method. Finally, the human factor performance of the facilities was determined based on the demand priority and fulfillment levels. The results show that even barrier-free facilities with high performance exhibit performance inequalities among the population, and this inequality is more obvious in relatively disadvantaged groups. Building a coordinated barrier-free environment with facilities, services, and assistive devices is an effective means to make up for the insufficient performance of barrier-free facilities. This approach not only enhances the support capacity of the environment but also contributes to the sustainable development of urban communities by ensuring equitable access for all residents.

1. Introduction

The renovation of accessible environments in residential communities has become a critical issue in China’s urban renewal practice [1]. It has enhanced residents’ quality of life, created inclusive living environments, and supported the equitable development of cities [2]. Since the comprehensive promotion of old urban residential community renovations began in 2019, China has cumulatively initiated improvements in approximately 167,000 old urban residential communities from 2019 to 2022. In 2023 alone, about 53,000 new renovation projects were launched, benefiting 8.82 million households [3]. The primary focus of these renovations is on barrier-free access facilities, which include the improvement of entrances, ramps, elevators, and other critical infrastructure in public areas, helping all residents travel equally and conveniently. However, during the process of renovations, there has often been an inadequate understanding of residents’ specific needs for barrier-free travel, which means residents’ demands for barrier-free environments cannot be fully met. For example, while tactile paving has been widely installed in cities, it is seldom used, and individuals with visual impairments continue to encounter significant travel challenges. This misalignment not only creates travel obstacles for residents with disabilities but also leads to wasted resources and financial expenditures, posing a threat to the healthy and sustainable development of cities. Therefore, effective response strategies need to be developed to address these issues.
Any existing facility needs to undergo performance evaluation to verify its effectiveness [4]. The current accessibility performance evaluation mainly takes the building environment as the research object, while specific barrier-free facilities are neglected. However, specific barrier-free facilities, especially barrier-free access facilities, are an important guarantee for the effectiveness of accessible environments. They are built in large numbers in residential environments to enable residents with limited mobility to overcome the elevation difference between buildings and roads [5]. Meeting the requirements for the type, quantity, and location of accessible facilities, such as ramps, does not mean that the accessibility of the environment is guaranteed. The poor performance of the facilities themselves will undermine the accessibility of the overall environment. In fact, when getting on or off buses in urban transport environments, wheelchair users are more likely to have accidents when using the ramp than during transit [6].
It is considered appropriate to evaluate the performance of barrier-free facilities from the perspective of demand [7,8]. Such evaluations can reflect the matching relationship between users’ needs and facility support capabilities based on the quantitative ranking of residents’ demand priorities. This approach can guide the renovation of old residential communities and enable the identification and targeted compensation of low-performance facilities. In this case, managers can implement more effective measures to enhance the barrier-free environment of residential communities based on these performance evaluations [9]. However, previous studies on barrier-free facility performance have typically used all users as the evaluation subject, which has obscured the differing demands of various groups. The needs of vulnerable groups have not received enough research attention, and inequality in the satisfaction of their needs still exists. Barrier-free facilities that are suitable for some groups may not meet the requirements of other groups, particularly disadvantaged groups [10]. For example, a long ramp that meets the barrier-free access requirements of most residents is not suitable for independent use by people with disabilities, which undermines the city’s inclusiveness and social equity. Therefore, this study introduces the concept of human factor performance, aims to clarify the performance differences among different groups in using barrier-free access facilities, and provides a theoretical basis for the targeted renovation of these facilities.
Human factors emphasize defining environments and facilities based on human needs [11]. Human factor performance focuses on evaluating facilities by analyzing user behavior and experience, assessing the effectiveness of facilities based on users’ needs and abilities. Owens pointed out the contribution of diverse human factor needs in creating an aging-friendly indoor barrier-free environment [12]. Figueiredo recommended incorporating the human factor needs of the elderly into the design of the outdoor built environment to guide the creation of elderly friendly cities [13]. Halabya emphasized the importance of considering the human factor impact of barrier-free facilities as the basis for facility upgrades to achieve the highest level of accessibility [14]. However, existing research has not yet fully explored the human factor performance evaluation methods for barrier-free facilities. To address this gap, this study adopts a comprehensive method consisting of text mining, cluster analysis, the Kano model, and the fuzzy Delphi method, aiming to clarify the accessibility demands of urban residents and develop an advanced human factor performance evaluation model for barrier-free access facilities. This method is expected to provide more targeted renovation strategies for improving the barrier-free environment of urban residential communities, thereby maximizing the utilization of existing barrier-free facility resources to meet residents’ needs in the large-scale urban renewal and transformation practice process, and contributing to the sustainable development of urban communities.

2. Methods

The research steps are mainly divided into three parts. First, the relevant needs are obtained through literature screening and identified using word frequency statistics and cluster analysis. Second, demand classification and the Better–Worse coefficient are obtained from the questionnaire survey, and demand priority is calculated based on the survey results. Finally, the fuzzy Delphi method is used to obtain the level of fulfillment with the facilities’ response to needs, and the human factor performance of barrier-free access facilities is obtained after calculation.
From 23 October to 2 November 2022, and from 26 May to 30 May 2023, a survey was conducted on outdoor barrier-free facilities in residential communities within the subdistrict of Huayuan Street, Nangang District, Harbin City. The Huayuan Street Subdistrict, located in the central urban area of Harbin, has a high aging population, with individuals aged 60 and above accounting for approximately 20% of the total population [15]. The significant proportion of elderly residents results in an urgent demand for barrier-free facilities. Additionally, the terrain in the Huayuan Subdistrict varies significantly, being higher in the northwest and lower in the southeast, which poses challenges for barrier-free access. This variation in elevation provides an opportunity to assess the effectiveness of barrier-free facilities. The combination of diverse terrain and a high aging population underscore the practical significance of studying barrier-free access in this region. Furthermore, most residential buildings in the area were constructed before 2000, and in recent years, old residential communities have undergone renovations, including the upgrading of accessibility facilities, but the effectiveness is still unclear. How to build accessible environments in urban residential communities based on residents’ needs is a practical problem faced in the renovation.
After excluding barrier-free facilities that have lost their functions due to damage, cracking, and substandard construction (Figure 1), barrier-free facilities in the area mainly include curb ramps, wheelchair ramps, barrier-free passages, and entrances. Among them, curb ramps mainly solve the elevation difference between the sidewalk and the road. In this case, the elevation difference is small and the degree of traffic obstacles is relatively minor; wheelchair ramps face a large elevation difference, the degree of traffic obstacles is serious, and residents have a more urgent need for wheelchair ramps. In addition, the form of barrier-free passages and entrances is mainly wheelchair ramps. Therefore, four typical wheelchair ramps in the area with a large flow of users were selected as the evaluation objects of barrier-free facilities (Figure 2).

2.1. Requirement Identification and Classification

2.1.1. Text Mining and Cluster Analysis

To obtain the accessibility demands of Chinese urban residents, the literature with the theme of “accessibility demands” was searched in Chinese in the CNKI database, and the publication time of the literature was not restricted. The literature was screened according to the title and abstract, and the accessibility demands involved in the relevant literature were recorded. In order to eliminate the subjectivity of the selection of demand items, word frequency statistics and cluster analysis were used as objective classification methods to determine common needs.
The tool used for the word frequency statistics and cluster analysis was the ROST CM 6.0 software, which can realize the word segmentation of Chinese text and supports a custom dictionary function, making it effectively applicable to the text mining in this study.

2.1.2. Questionnaire Survey on Accessibility Demands

A survey on accessibility needs was conducted from 28 December 2023 to 2 January 2024. The questionnaire consists of three parts. The first part is demographic questions, including gender, age, and physical health status. The second part is a survey on the satisfaction with accessibility demands using positive and negative questions based on the Kano model. The Kano model has been proven to be an effective tool for understanding and prioritizing user needs and is widely used in the field of quality management [16]. By collecting users’ answers to positive and negative questions about demand satisfaction, the Kano model enables the classification of user demands [17]. The third part is a survey on the importance of accessibility demands using a 5-level Likert scale, evaluating the importance from “completely unimportant” (1) to “very important” (5) [18]. All respondents are users of the four wheelchair ramps, categorized by the following behavior status: normal walking, weight-bearing walking, single hand occupied, both hands occupied, single leg occupied, and both legs occupied. The behavior status of each respondent is marked in the questionnaire.
The questionnaire survey adopted a combination of offline and online methods to obtain as many responses as possible. A total of 341 questionnaires were distributed, of which 268 were valid, with an effective rate of 78.6%. The Cronbach’s α coefficient for positive questions regarding demand satisfaction is 0.866, and for negative questions, it is 0.853. The Cronbach’s α coefficient for demand importance is 0.888. These values, all exceeding 0.7, indicate the good reliability of the questionnaire [19].
Among all of the respondents, the ages of the respondents were mostly between 20 and 45, accounting for 43.66%. And there were 75 respondents aged 46–60 and 58 respondents over 60. The fewest respondents were under 20, accounting for 6.72%. The vast majority of respondents were in good physical health, while 8 had physical disabilities, 4 had visual disabilities, and 4 had hearing disabilities.

2.1.3. Classification of Human Factor Accessibility Demands

Residents’ needs analysis is an important part of the human factor performance research of barrier-free access facilities. On the basis of the traditional Kano model classification, the Better–Worse coefficient analysis is introduced to assist in the classification of demand types to obtain more accurate and realistic demand classification results [20]. The Better coefficient (SI) indicates the impact of the demand realization on user satisfaction. The closer its value is to 1, the more significant the impact on satisfaction. The Worse coefficient (DI) indicates the impact of the demand realization on user dissatisfaction. The closer its value is to −1, the more significant the impact on dissatisfaction. The calculation equation is as follows [21]:
S I i = ( A i + O i ) / ( A i + O i + M i + I i )
D I i = ( O i + M i ) / ( A i + O i + M i + I i )
The absolute values of SI and DI are used as the ordinate and abscissa, respectively. After that, a scatter plot of the residents’ needs was drawn in four quadrants, the quadrant for each demand was determined, and a new Kano demand classification was obtained.

2.2. Demand Priority Quantification

2.2.1. Comprehensive Satisfaction Coefficient Calculation

Although the Kano model can help identify demand classification and determine the priority of the meeting demand by type, it cannot achieve the quantitative ranking of all of the demand items. Jang et al. proposed to use the average of the absolute values of SI and DI as the average satisfaction coefficient (ASC) to represent the quantitative index of attributes [22]. Cieśla called the difference between SI and DI the overall satisfaction index and ranked the attributes based on the calculated overall satisfaction index [23]. However, these ranking results contradict the demand priority order of M > O > A > I in the Kano model, and cannot reflect the difference ratio between SI and DI. This paper proposes to use the difference ratio between the absolute values of SI and DI as the comprehensive satisfaction coefficient (CSC) of the Kano model, which represents the change in the satisfaction level between low and high demand realization relative to the overall satisfaction level. The equation is as follows:
C S C = ( | D I i | S I i ) / ( | D I i | + S I i )
Convert CSC to positive normalized data so that all of its values are between 0 and 1. Considering the demand priority principle of M > O > A > I in the Kano model, it is necessary to introduce the correction coefficient k to make the calculation result of the CSC consistent with the demand category ranking of the Kano model. Therefore, the final calculation equation of the Kano comprehensive satisfaction coefficient (CSCi) is as follows:
C S C i = k C S C = C S C ,           d e m a n d   i   b e l o n g s   t o   O   o r   M C S C 3 / C S C 2 · C S C ,           d e m a n d   i   b e l o n g s   t o   A C S C 2 / C S C 3 · C S C ,   d e m a n d   i   b e l o n g s   t o   I
Among them, CSC2 represents the mean of the standardized comprehensive satisfaction coefficients of all points in the second quadrant, and CSC3 represents the mean of the standardized comprehensive satisfaction coefficients of all points in the third quadrant.

2.2.2. Importance Coefficient Calculation

The importance coefficient affects the demand priority by ranking the importance of barrier-free needs. Use the five-point semantic scale to assign a score to the importance of each need. After obtaining all of the importance scores, calculate the importance coefficient IMPi of the demand i and perform data normalization, as follows:
I M P i = ( 5 n i 1 + 4 n i 2 + 3 n i 3 + 2 n i 4 + n i 5 ) / n
I M P i = ( I M P i m i n ( I M P i ) ) / ( m a x ( I M P i ) m i n ( I M P i ) )
Among them, ni1 to ni5 represents the number of people rating the demand from “very important” to “completely unimportant”, with n representing the total survey respondents.

2.2.3. Entropy Weight Method for Calculating Weights

In the previous section, all data have been standardized to convert them into non-negative numbers. Calculate the proportion pst of the s sample in the t indicator, where xst represents the t indicator of the s sample, and the calculation equation of pst is as follows [24]:
P s t = x s t / s = 1 n x s t
The entropy value et of the t indicator is defined as follows [25]:
e t = ( s = 1 m P s t ln P s t ) / ln m
The entropy value est ranges from 0 to 1. A lower information entropy value indicates greater indicator variability and provides more information. Therefore, the calculation equation of the weight wt is as follows [26]:
w t = ( 1 e s t ) / ( t = 1 n ( 1 e s t ) )

2.2.4. Demand Priority Calculation

The comprehensive satisfaction coefficient (CSC) based on Kano model reflects the degree of demand for accessibility among residents, while the importance coefficient (IMP) reflects the significance of accessibility among residents. The demand priority (DPi) can be obtained by the weighted calculation of the Kano comprehensive satisfaction coefficient and the importance coefficient, as follows:
D P i = w 1 C S C i + w 2 I M P i

2.3. Human Factor Performance Calculation

2.3.1. Questionnaire Survey on Facility Response Fulfillment

We selected dates with good weather conditions, divided 8:00–18:00 into 5 time periods with 2 h units, and picked a 5 min time section in each period for behavioral mapping to record the residents’ wheelchair ramp usage behavior. Each facility was equipped with one drone and one observer during each survey period. The drone model used was the DJI MAVIC 3 cine, with a flight altitude of 30 m and a camera with 2× zoom for hovering shooting, ensuring that the shooting angle covered the area and the flight noise was not perceived by the surveyed residents.
Environmental information about the four ramps and videos of usage behavior with facial information blurred were sent to experts from 6 to 9 April 2024. Experts with 5 years of experience in accessible research evaluated the level of fulfillment with facilities’ responses to the needs for the four facilities through questionnaires. A total of 39 expert questionnaires were collected.

2.3.2. Fuzzy Delphi Method

The Delphi method gathers expert opinions through continuous iterations of a given questionnaire to show the consistency of expert opinions and to identify different opinions [27]. Due to the limited judgment information and the inaccuracy of human judgment, it is relatively difficult to use the Delphi method to evaluate and obtain accurate judgment data [28]. The advantage of introducing fuzzy mathematics theory into the traditional Delphi method is that it allows experts to make fuzzy judgments on complex issues, and eliminates the influence of the uncertainty of experts’ subjective thinking on the result value as much as possible, so as to obtain more objective and accurate results.
This paper conducts research with the fuzzy Delphi method based on the method introduced by Habibi [29]. Appropriate fuzzy sets are selected to convert the language terms of the expert evaluation in Table 1 into triangular fuzzy numbers [28]. Secondly, the evaluation results are fuzzily aggregated using the average method to eliminate the influence of optimistic and pessimistic values on the results [30]. When the experts’ answers are expressed as (l, m, u), the calculation equation for the mean F of the expert evaluation results after fuzzy aggregation is as follows:
F = l n , m n , u n = l i , m i , u i
where n is the number of experts and i is the number of demand items. Finally, the centroid method is used to defuzzify the results of the fuzzy aggregation and convert them into definite values, which is one of the most commonly used defuzzification methods based on average fuzzy values [31]. And the values are then standardized to obtain the level of fulfillment with facilities’ responses to needs (Ri), as follows:
R i = ( l i + m i + u i ) / 3
R i = ( R i m i n ( R i ) ) / ( m a x ( R i ) m i n ( R i ) )

2.3.3. Human Factor Performance Calculation

For a certain accessibility need, the existing facilities have a certain degree of realization, but different groups prioritize their needs differently, and the actual degree of realization varies among different groups. This difference is reflected in the actual use of the facilities. This paper uses the difference between the level of fulfillment with the facility’s response to demands and the demand priority as a representation of human factor performance. For people who walk normally, their demand priority is relatively low, so the low satisfaction degree of the facilities to the demands will not cause insufficient performance. While, for people using wheelchairs, their barrier-free needs have a high priority, and when the satisfaction degree of the facilities is low, the actual use effect will deteriorate. Therefore, the calculation equation for the human factor performance (HFPf) of barrier-free access facilities is defined as follows:
H F P f = i = 1 k ( R i f D P i f )
when the human factor performance of barrier-free access facilities is greater than 0, the performance of the facilities is considered good; when HFPf is less than 0, the performance is considered poor. The larger its absolute value, the more obvious the corresponding performance. The calculation equation for the HFP for all users is as follows:
H F P = f = 1 j w f H F P f
where w represents the proportion of the f group among all users within the observation time range.

3. Results

3.1. Requirement Identification and Classification Results

3.1.1. Accessibility Needs of Chinese Urban Residents

By searching the CNKI database for literature with the theme of “accessibility demands”, a total of 162 accessibility demands of urban residents mentioned in the literature were recorded. The texts were segmented, and meaningless auxiliary words and function words were removed to obtain high-frequency words. Those words were then clustered to obtain 18 accessibility demands for urban residential communities (Table 2), including accessibility facilities usage (FU), accessibility environment safety (ES), accessibility information acquisition (IA), and accessibility service (SE).

3.1.2. Classification Results of Accessibility Needs

The initial classification results of 18 requirements for 268 wheelchair ramp users were statistically analyzed. With SI as the vertical axis and the absolute value of DI as the horizontal axis, a scatter plot was created for the 18 requirements (Figure 3). The classification results show six must-be (M), six attractive (A), two one-dimensional (O), and four indifferent (I) requirements.
The data were analyzed according to the user’s behavioral status classification to obtain the barrier-free demand classification based on human factors. The absolute value and difference in the Better–Worse coefficient determine the category to which the demand belongs. When the absolute value of SI is greater than the absolute value of DI, the need is attractive; otherwise, the need is must-be. Figure 4 shows the Better–Worse coefficient for 18 requirements in six behavioral states. It can be seen from the figure that the requirement classifications of residents in different behavioral states are not exactly the same. When the demand items are classified into the same type, it is difficult to determine the priority of these same types of demand items, so it is necessary to calculate the priority of each demand.

3.2. Demand Priority Quantification Results

Calculate the CSC and IMP separately, and use the entropy weight method Equations (7)–(9) mentioned above to calculate the weights of these two parameters. The weight of the CSC is 0.3353 and the weight of the IMP is 0.6647. Substituting them into Equation (10), we can obtain the calculation results of the demand priority (Table 3).
The results show that, for all users, facilities usage without causing accidental injuries (ES1) and ensuring unobstructed passage (FU1) have the highest priority, while multisensory information access (IA2), providing opportunities for participation in activities (SE2), and providing opportunities for neighborhood interaction (SE3) have the lowest priority. Different from the demand classification results based on the Kano model, the introduction of the concept of demand priority highlights the importance of the sense of security (FU6), with its demand priority ranking second only to ES1 and FU1.

3.3. Facility Human Factor Performance Results

3.3.1. Results of Facilities’ Fulfillment of Needs

The evaluation results are shown in Table 4. The overall ranking of the facilities’ fulfillment of requirements is as follows: Facility B > Facility D > Facility C > Facility A. Facility B has the highest fulfillment level of the 18 barrier-free needs of urban residents, while Facility A has the lowest. High accessibility (ES3) is the demand that Facility B meets at the highest degree, followed by the avoidance of long or complex detours (ES2), which means that the vast majority of experts participating in the study believe that the form of Facility B can best meet these two needs. The highest fulfillment level ranking in Facility D is FU1. Facility C also performs well in the two needs of FU1 and ES4, but the fulfillment level of ES2 and low physical effort required (FU5) is the lowest. All needs are not well met in Facility A, and ES1 and FU6, related to the safety of facility use, are evaluated as the needs with the lowest satisfaction, indicating that Facility A has hidden dangers in terms of safety in use.

3.3.2. Results of Human Factor Performance

The quantitative results of the human factor performance of the four barrier-free facilities are shown in Table 5. The human factor performance ranking of the four facilities is as follows: Facility B > Facility D > Facility C > Facility A. For Facility B, IA2 is the highest performance requirement, while ES1 is the lowest. The performance of Facility D is similar to that of Facility B. Facility C performs poorly on the three requirements of ES1, ES2, and FU5. Facility A performs less than ideally in basic functions and facility safety. The four facilities all have high-performance levels in barrier-free service.

4. Discussion

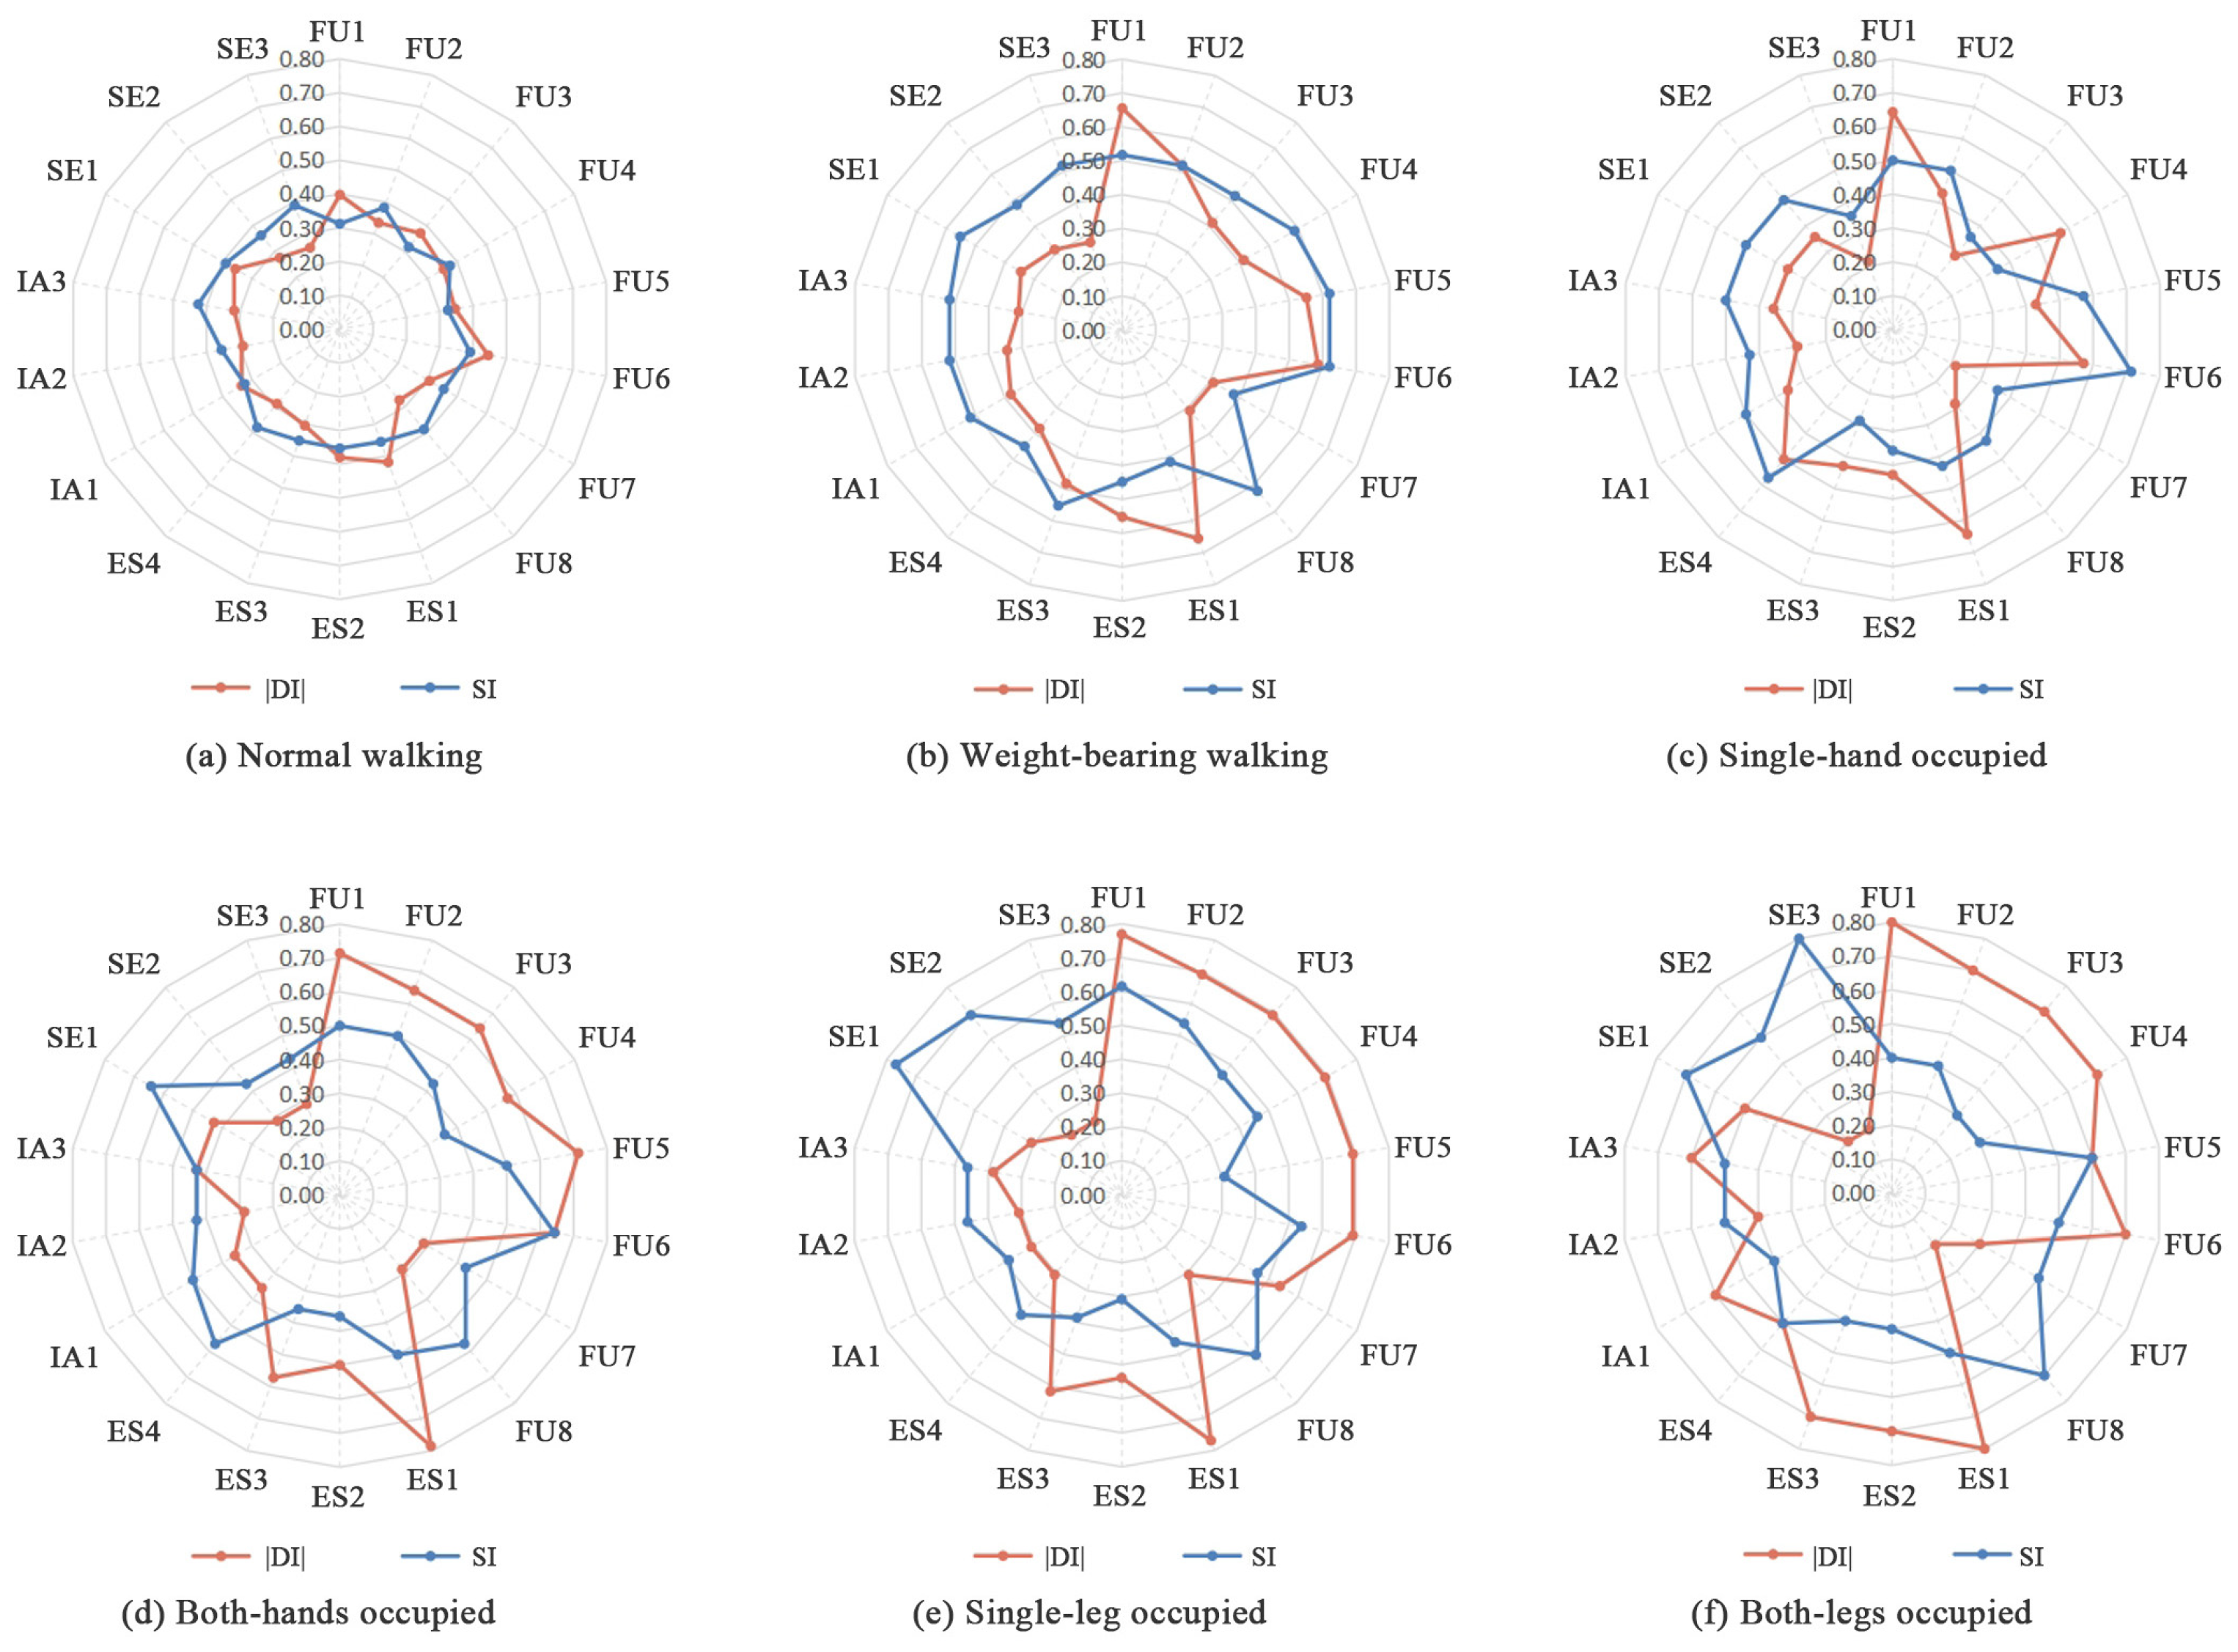
4.1. Human Factor Differences in Accessibility

There are differences in the types and levels of needs among barrier-free facility users. As the capabilities of facility users weaken, their barrier-free needs gradually increase, resulting in higher requirements for environmental support capabilities. Among them, high accessibility (ES3) is the most prominent need. Residents who can walk normally are indifferent to accessibility needs, whereas residents with limited mobility regard it as a necessary need. For wheelchair users, impaired accessibility means that they cannot approach these barrier-free facilities, losing the opportunity to utilize them. This indicates that low-performance barrier-free facilities can compromise the overall environment’s accessibility. Conversely, systemic deficiencies in the environment can also reduce the performance of barrier-free facilities. Therefore, it is not sufficient to rely solely on barrier-free facilities to address the travel issues of vulnerable groups. Other factors must cooperate to form a well-functioning barrier-free system, ensuring equitable travel for all urban residents.
Furthermore, facility users in different behavioral states have different emphases on barrier-free needs. Residents with limb disabilities are present in the single-leg-occupied and both-legs-occupied groups, leading to higher demands for inclusivity (FU7). Except for those in the normal-walking and weight-bearing-walking groups, users in the other four groups identified ease of use and operation (FU4) as an essential need. This urgency arises from their temporary or permanent disabilities, making the convenience of using facilities a critical requirement. However, the intensity of these demands varies among users in different behavioral states. Residents with both-legs-occupied walking have a significantly higher demand for FU4 compared to those with single-hand-occupied walking, reflecting the varying levels of mobility impairment among these residents.
Differences in human factors due to varying degrees of impairment are also reflected in demand priorities. Users with lower mobility have higher average accessible demand priorities. Specifically, the average demand priority of users with both legs occupied is 0.6239, compared to 0.4498 and 0.4668 for users with normal walking and weight-bearing walking, respectively. For higher-priority demands, users with low mobility have even greater priorities. Additionally, the extreme difference in the priority of barrier-free demand also reflects the difference in human factors. As the degree of physical impairment increases, the difference in the priority of barrier-free needs also increases. This trend shows that the needs of vulnerable groups for barrier-free facilities do not escalate uniformly. While the priority of must-be needs, such as ensuring unobstructed passage (FU1), increases significantly, the priority of attractive needs, such as providing opportunities for participation in activities (SE2), diminishes. This insight is crucial for the targeted renovation of barrier-free facilities. By ensuring that high-priority barrier-free needs are met, the overall performance level of these facilities can be substantially enhanced.

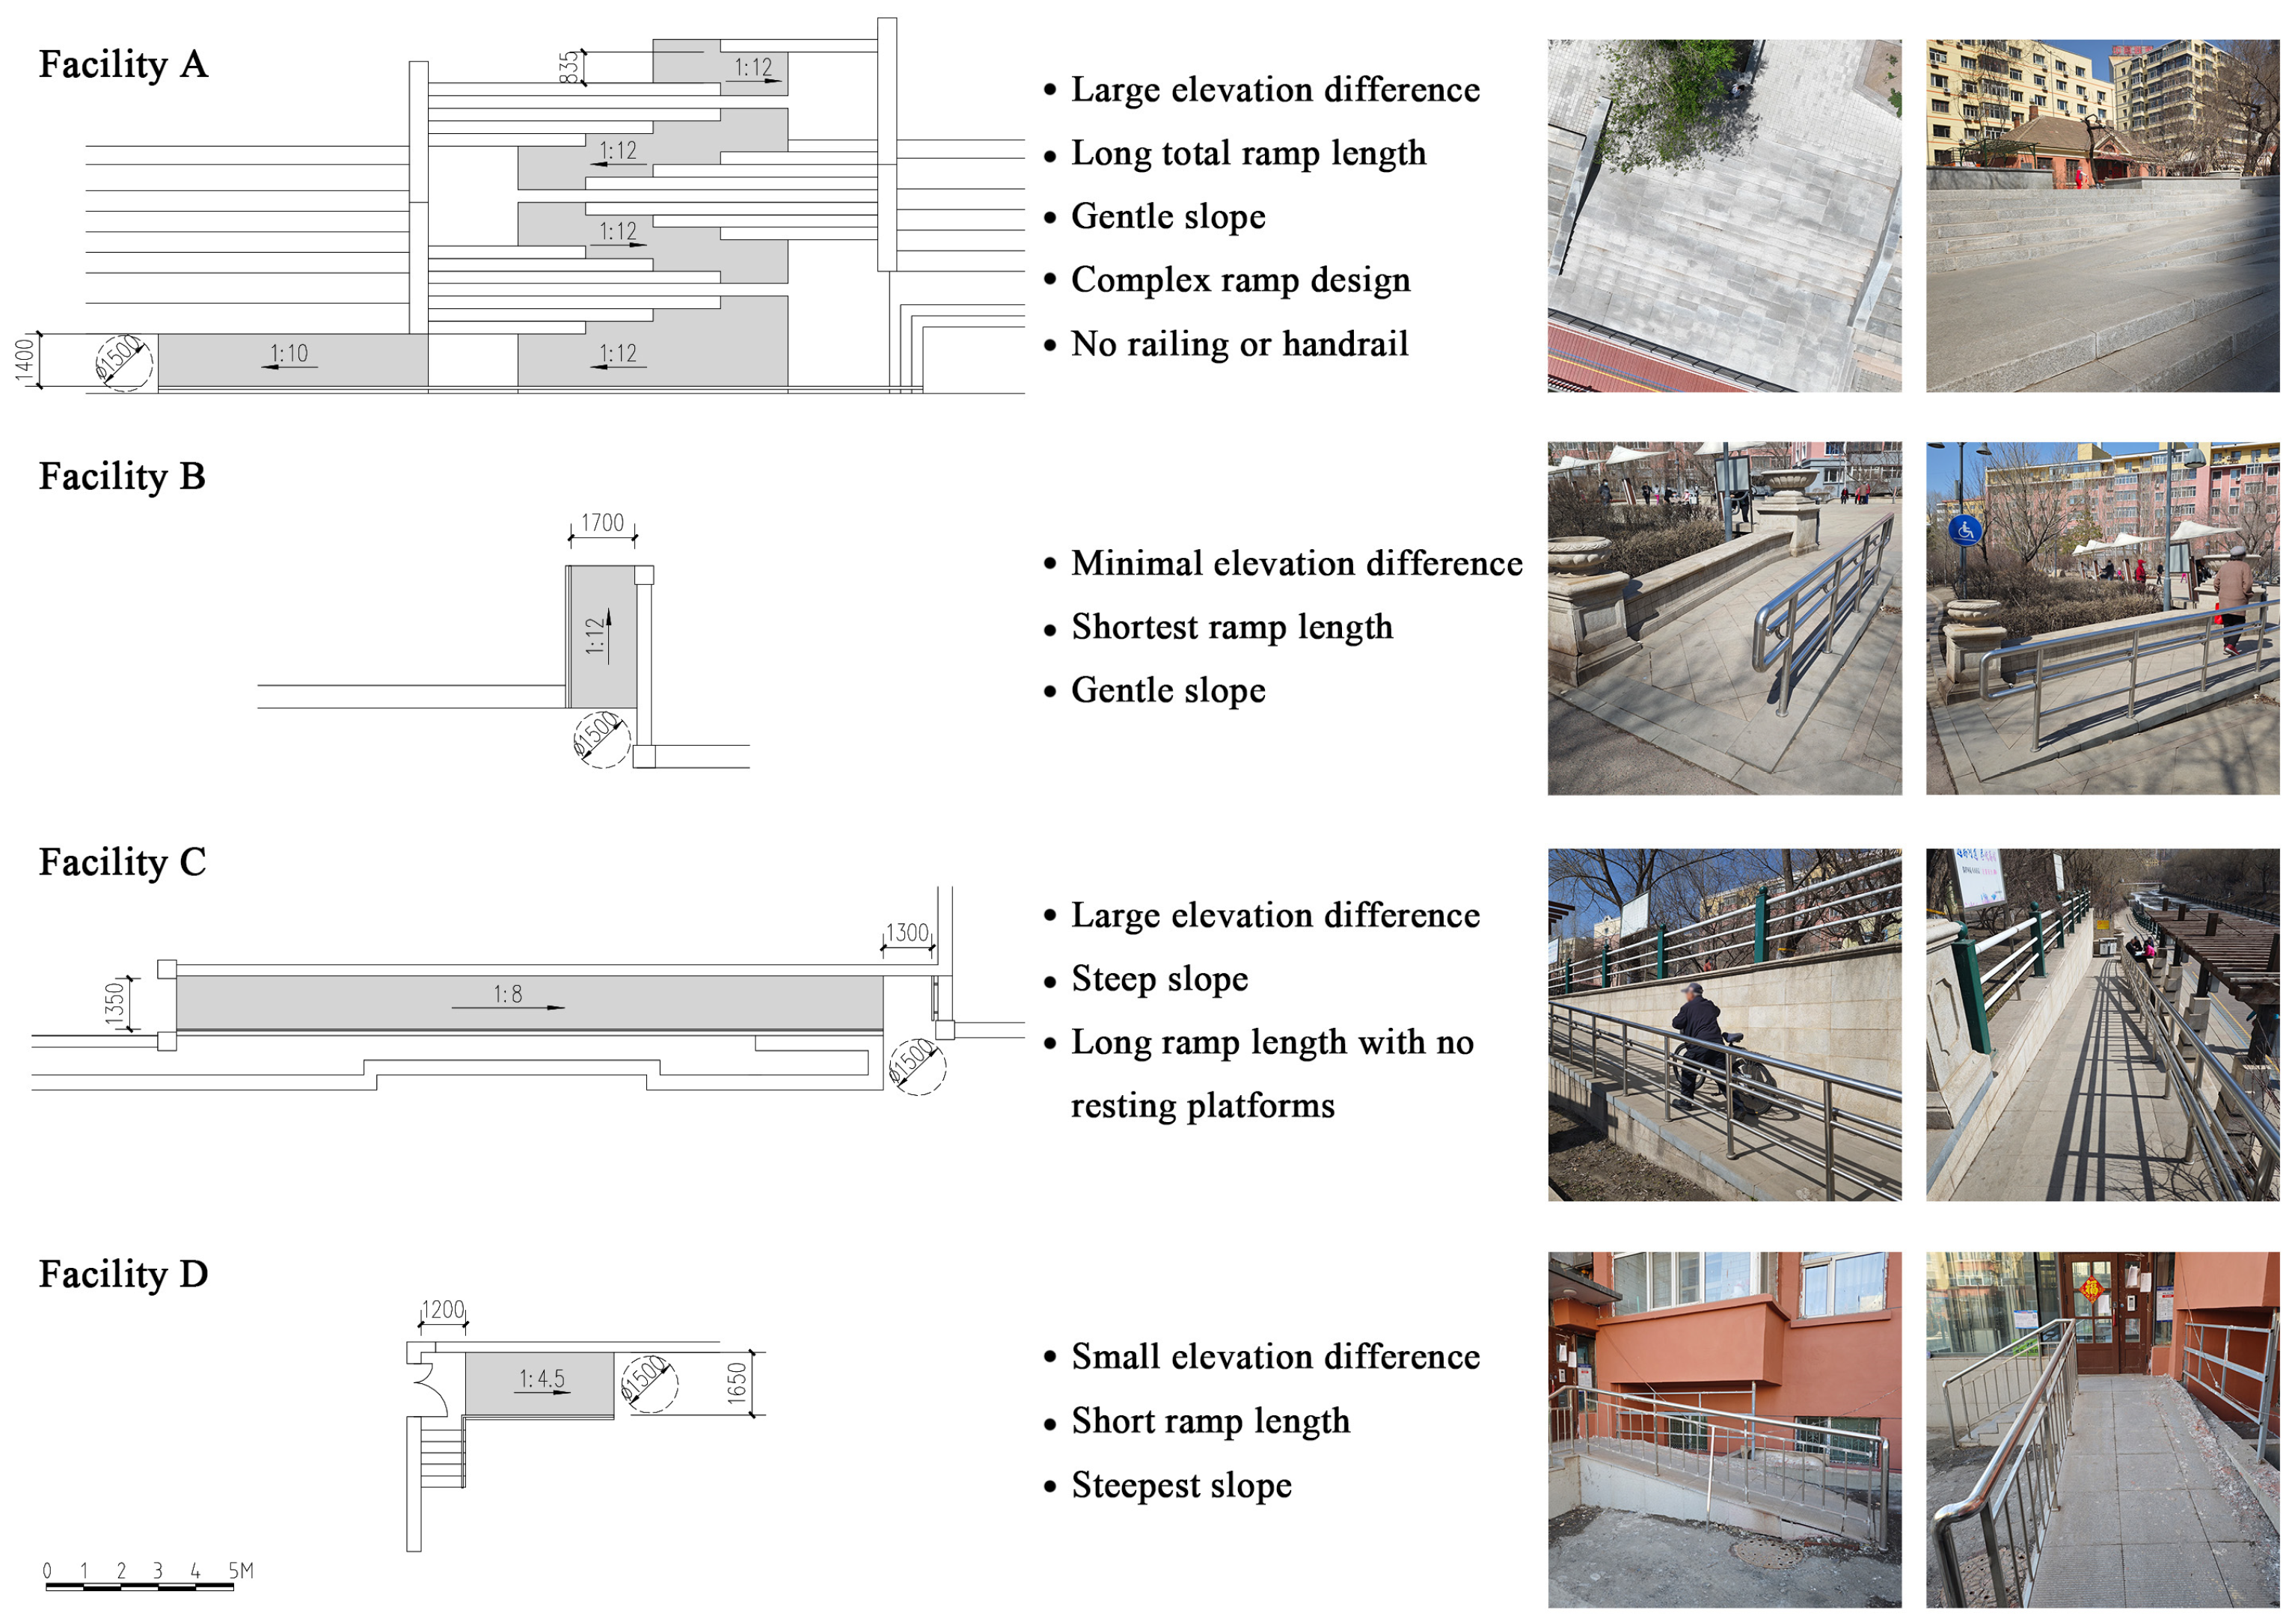
4.2. Facility Differences in Accessibility

There are variations in the performance of different barrier-free facilities for the same demand. The performance levels of the four barrier-free facilities in terms of information acquisition show the greatest differences. Facility B has the highest average performance in information acquisition, followed closely by Facility D, while Facility A has the lowest. The superior performance of Facility B is attributed to its location at the entrance of a busy activity square, the presence of a barrier-free ramp sign, and its ramp pavement being visually distinct from the surrounding environment. Although Facility D lacks a sign, its placement directly at the entrance of a residential building effectively conveys its barrier-free function to residents. In contrast, despite Facility C having a barrier-free sign, its hidden location makes it difficult for residents to identify the ramp’s position immediately, leading to lower human factor performance in barrier-free information acquisition. Facility A lacks a ramp sign, and the paving of the ramp is consistent with the surrounding environment, making it difficult for residents to identify its barrier-free features.
Additionally, the long ramp of Facility A has a large lifting height and a complex form, resulting in the lowest and even negative human factor performance in providing a sense of security (FU6) and facilities usage without causing accidental injuries (ES1). This indicates that such ramp forms cannot meet residents’ needs for the safe use of the facility. It highlights that the ramp form may affect the facility’s ability to meet demand.
From the perspective of providing a sense of security, the smaller the ramp’s lifting height and slope, the better its human factor performance. The performance level of facilities usage without causing accidental injuries (ES1) shows a similar trend. However, the human factor performance of the four barrier-free facilities remains negative, which aligns with observed incidents. This indicates a gap between the current barrier-free ramps’ performance in meeting the ES1 needs and residents’ expectations.
Additionally, it is worth mentioning that low physical effort required (FU5) did not exhibit the same trend as FU6 and ES1. The primary reason is that most users of Facility A are residents in a normal walking state. The physical exertion required for Facility A meets the needs of these users, resulting in a higher performance level than Facilities C and D. Facility C is situated near the entrance of the riverside park, serving as the primary connection between the park road and the riverside trail. As a result, a significant portion of Facility C’s users are cyclists, individuals with strollers, and wheelchair users who tend to switch routes at this location to access or exit the park. These users prioritize minimizing physical exertion. Despite Facility C’s ramp having a gentler slope than Facility D, its longer length and the higher physical demands of its users result in poorer performance compared to Facility D in terms of low physical exertion. In addition, while Facility B has the highest overall human factor performance among the four facilities, its performance levels are not balanced across different groups. The performance of users in a normal walking state is significantly higher than those with both legs occupied. This indicates that even high-performance barrier-free facilities exhibit unequal performance among different user groups, with this inequality being more pronounced among relatively disadvantaged groups.
However, it is inappropriate to use the greatest needs of the most vulnerable residents as the design standard for barrier-free facilities, especially given the large number of existing barrier-free facilities in most Chinese cities. The substantial cost of this approach would undoubtedly lead to excessive resource consumption. Therefore, it is essential to develop a facility renovation method that aligns with China’s national conditions and meets the barrier-free needs of residents based on the findings of this study.

5. Conclusions

Accessibility renovation of urban residential communities has been vigorously promoted, but there remains a mismatch between the capabilities of facilities and the accessibility needs of urban residents. It is necessary to conduct a human factor performance evaluation of existing barrier-free facilities from the perspective of demand. Therefore, this paper aims to clarify the attributes of the barrier-free demand of urban residents under different behavioral states, quantify the differences in residents’ barrier-free demand by using demand priority, and establish a human factor performance evaluation model for barrier-free access facilities. Through text mining and cluster analysis, this study identified 18 barrier-free needs of urban residents in China. The Kano model was then employed to classify these needs, and the demand priority was calculated based on the Kano comprehensive satisfaction coefficient and importance coefficient. Finally, the fuzzy Delphi method was used to obtain the satisfaction degree of four typical barrier-free facilities for the needs, and the human factor performance was determined after the calculation.
The results show that, as the mobility of facility users decreases, their demand for barrier-free facilities increases and their requirements for environmental support become higher. However, not all barrier-free needs have the same priority. The demand priority related to functional use and environmental safety increases, while the demand priority related to activities and communication decreases. Facility users with different behavioral states have varying priorities for accessibility needs, which leads to differences in facility performance. High-performance barrier-free facilities exhibit inequalities in performance among users with different behavioral states, and this inequality is more obvious among relatively disadvantaged groups.
To address the issue of the unequal performance of barrier-free facilities and the insufficient performance of specific needs, it is essential to further explore the theory and practice of barrier-free environments. Xiang et al. pointed out that an individual’s ability to act in the environment is equal to the sum of their own ability, the auxiliary ability of the equipment, and the auxiliary ability of the services [32]. Therefore, when existing barrier-free facilities cannot fully meet the needs of users, expanding the traditional concept of barrier-free environments to include assistive devices and services is an effective way to compensate for the deficiencies and enhance the support capacity of the barrier-free environment. Previous research has primarily focused on material components such as barrier-free facilities and assistive devices [33,34]. However, with the advancement of technology and lifestyle changes, the scope has expanded to include barrier-free assistive technology. This encompasses both assistive devices and information technology, such as using mobile software to collect real-time environmental feedback and provide navigation directions for the visually impaired. Additionally, assistance and service are proposed as non-material elements, underscoring their importance in constructing a comprehensive barrier-free environment [35,36].
Figure 5 presents the conceptual framework of the urban barrier-free environment system proposed in this paper, which identifies the relevant elements of the barrier-free system and describes the relationship among barrier-free facilities, assistive technology, assistance, and the urban barrier-free environment. When barrier-free facilities are inadequate in the area, assistive technology and assistance can be employed to propose alternative measures that address the challenges posed by these inadequacies. Conversely, the absence of one component can diminish the effectiveness of the other two within the system. For example, consider addressing the travel challenges faced by wheelchair users. Low-performance long ramps not only greatly exhaust the physical strength of wheelchair users but also pose potential safety hazards. Based on the multi-dimensional collaborative concept of barrier-free facilities, assistive devices, and services, wheelchair users can obtain planned barrier-free routes in advance through electronic navigation software, avoiding sections with significant road elevation differences or complex traffic conditions. They can choose barrier-free lifting platforms instead of low-performance long ramps and use online manual services to address issues encountered during travel. This synergy among barrier-free facilities, assistive devices, and services provides systematic and precise support, ensuring that urban residents can travel independently, safely, and conveniently. It effectively addresses the mismatch between the environmental support capabilities of existing barrier-free facilities in old urban areas and user needs. By maximizing the utility of existing barrier-free facilities, this system can operate efficiently, enhancing the overall barrier-free environment.
This study provides both theoretical and practical value for constructing accessible environments in old urban residential communities. It proposes a method for calculating the human factor performance of barrier-free facilities based on demand priority, which can be adapted for other performance assessments rooted in demand analysis. To replicate this calculation method in different research contexts, future studies should follow a systematic process: first, start with text mining to obtain user needs, use cluster analysis to determine key needs, and then design and distribute questionnaires. Based on the questionnaire results, calculate the demand priority of each demand using the Kano comprehensive satisfaction coefficient and importance coefficient. Next, apply the fuzzy Delphi method to evaluate the degree to which facilities or products meet the needs, and use this as a basis to calculate the performance of facilities or products. In addition, the research reveals the relationship between the mobility of facility users and demand priority, guiding targeted renovations of barrier-free facilities. By constructing a barrier-free environment with three coordinated dimensions of barrier-free facilities, assistive devices and services, and enhancing the performance of existing facilities through assistive devices and services, it is possible to address the inequalities in the use of barrier-free facilities by vulnerable groups.
Nevertheless, this study has certain limitations. First, it was conducted only in the Huayuan Street area of Harbin, and the findings may not reflect differences across various levels of urban development. Secondly, since Harbin is located in a severe cold region, residents considered the use of outdoor barrier-free facilities under low-temperature conditions when completing the questionnaire. As a result, the findings may differ from those in warmer climates. In addition, most residents who participated in the questionnaire survey were in good physical health. Some disabled individuals who rely on barrier-free facilities for travel might have been unable to reach the surveyed areas due to lack of assistance and inadequate environmental support, resulting in their under-representation in the performance calculations. Furthermore, the performance evaluation in this study focused only on four barrier-free ramps, which may lead to incomplete conclusions. It is recommended that future studies broaden the scope by including a greater variety and number of facilities for performance evaluation. Given the large and concentrated population in Chinese cities, this study used a behavioral mapping method to obtain a sufficient sample size within a shorter period. However, to achieve a more accurate coefficient for the population using barrier-free facilities, future studies could consider extending the observation period to weeks or months and broadening the observation timeframes. Increasing the diversity of facilities and the length of the observation time may bring new insights, thereby enriching both the theoretical and practical aspects of barrier-free environment renovation in urban residential communities.

Author Contributions

Conceptualization, D.W. and B.H.; methodology, B.H.; software, B.H.; validation, D.W. and B.H.; formal analysis, B.H.; investigation, B.H.; resources, D.W.; data curation, B.H.; writing—original draft preparation, B.H.; writing—review and editing, D.W.; visualization, B.H.; supervision, D.W.; project administration, D.W.; funding acquisition, D.W. All authors have read and agreed to the published version of the manuscript.

Funding

This research was funded by the National Natural Science Foundation of China [grant number 52178011], and the Research Institute of Standards and Norms Ministry of Housing and Urban-Rural Development [grant number 2.2].

Institutional Review Board Statement

Not applicable.

Informed Consent Statement

Informed consent was obtained from all subjects involved in the study.

Data Availability Statement

The data used to support the findings of this study can be made available by the corresponding authors upon request.

Conflicts of Interest

The authors declare no conflicts of interest.

References

  1. Dai, X.; Li, Z.; Ma, L.; Jin, J. The Spatio-Temporal Pattern and Spatial Effect of Installation of Lifts in Old Residential Buildings: Evidence from Hangzhou in China. Land 2022, 11, 1600. [Google Scholar] [CrossRef]
  2. Van Nguyen, M.; Nguyen, T.T.; Phan, C.T.; Ha, K.D. Sustainable Redevelopment of Urban Areas: Assessment of Key Barriers for the Reconstruction of Old Residential Buildings. Sustain. Dev. 2024, 32, 2282–2297. [Google Scholar] [CrossRef]
  3. From January to November 2023, 53200 New Urban and Old Residential Areas Were Renovated Nationwide. Available online: https://www.gov.cn/lianbo/bumen/202312/content_6923480.htm (accessed on 18 July 2024).
  4. Seshadhri, G.; Topkar, V. Validation of a Questionnaire for Objective Evaluation of Performance of Built Facilities. J. Perform. Constr. Facil. 2016, 30, 04014191. [Google Scholar] [CrossRef]
  5. Tatano, V.; Revellini, R. An Alternative System to Improve Accessibility for Wheelchair Users: The Stepped Ramp. Appl. Ergon. 2023, 108, 103938. [Google Scholar] [CrossRef] [PubMed]
  6. Frost, K.L.; Bertocci, G.; Smalley, C. Ramps Remain a Barrier to Safe Wheelchair User Transit Bus Ingress/Egress. Disabil. Rehabil. Assist. Technol. 2020, 15, 629–636. [Google Scholar] [CrossRef]
  7. Zallio, M.; Clarkson, P.J. The Inclusion, Diversity, Equity and Accessibility Audit. A Post-Occupancy Evaluation Method to Help Design the Buildings of Tomorrow. Build. Environ. 2022, 217, 109058. [Google Scholar] [CrossRef]
  8. Zallio, M.; Clarkson, P.J. Inclusion, Diversity, Equity and Accessibility in the Built Environment: A Study of Architectural Design Practice. Build. Environ. 2021, 206, 108352. [Google Scholar] [CrossRef]
  9. Wen, Y.; Li, Y.; Yang, Y.; Wang, J. Towards an Evaluation System of Disabled Individuals’ Friendly Communities from the Perspective of Inclusive Development—A Case Study in Jinan. Buildings 2023, 13, 2715. [Google Scholar] [CrossRef]
  10. Seyedrezaei, M.; Becerik-Gerber, B.; Awada, M.; Contreras, S.; Boeing, G. Equity in the Built Environment: A Systematic Review. Build. Environ. 2023, 245, 110827. [Google Scholar] [CrossRef]
  11. Zhang, L.; Deng, H.; Mei, X.; Pang, L.; Xie, Q.; Ye, Y. Urban Ergonomics: A Design Science on Spatial Experience Quality. Chin. Sci. Bull. 2022, 67, 1744–1756. [Google Scholar] [CrossRef]
  12. Owens, O.L.; Beer, J.M. Human Factors and Ergonomics Considerations for Aging-in-Place Part 2: The Intersection of Environment and Technology. Ergon. Des. Q. Hum. Factors Appl. 2024, 32, 18–21. [Google Scholar] [CrossRef]
  13. Figueiredo, M.; Eloy, S.; Marques, S.; Dias, L. Older People Perceptions on the Built Environment: A Scoping Review. Appl. Ergon. 2023, 108, 103951. [Google Scholar] [CrossRef]
  14. Halabya, A.; El-Rayes, K. Optimizing the Planning of Pedestrian Facilities Upgrade Projects to Maximize Accessibility for People with Disabilities. J. Constr. Eng. Manag. 2020, 146, 04019088. [Google Scholar] [CrossRef]
  15. Wei, D.; Chen, X. Study on the Pre-design Analysis Method for the Age-responsive Environmental Reconstruction in External Space of the Old Community: Taking Harbin City’s Huayuan Sub-district Office Area as an Example. Archit. Cult. 2020, 12, 114–118. [Google Scholar] [CrossRef]
  16. Materla, T.; Cudney, E.A.; Antony, J. The Application of Kano Model in the Healthcare Industry: A Systematic Literature Review. Total Qual. Manag. Bus. Excell. 2019, 30, 660–681. [Google Scholar] [CrossRef]
  17. Tseng, C.C. An IPA-Kano Model for Classifying and Diagnosing Airport Service Attributes. Res. Transp. Bus. Manag. 2020, 37, 100499. [Google Scholar] [CrossRef]
  18. Zhang, M.; Gao, Y.; Xue, J.; Li, K.; Zhang, L.; Yu, J.; Yan, T.; Hou, X. Development of the Assessment Standards of the International Classification of Functioning, Disability, and Health (ICF) Geriatric Core Set through a Modified Delphi Method. BMC Geriatr. 2024, 24, 239. [Google Scholar] [CrossRef]
  19. Bujang, M.A.; Omar, E.D.; Baharum, N.A. A Review on Sample Size Determination for Cronbach’s Alpha Test: A Simple Guide for Researchers. Malays. J. Med. Sci. MJMS 2018, 25, 85–99. [Google Scholar] [CrossRef]
  20. Liu, X.; Zhang, J.; Qin, B.; Wang, H.; Zhu, T.; Ye, Q. Research on the Knowledge Demands of Multiple Subjects for Energy Efficiency Improvement in Chinese Public Buildings. Energy Build. 2023, 300, 113611. [Google Scholar] [CrossRef]
  21. Matzler, K.; Hinterhuber, H.H.; Bailom, F.; Sauerwein, E. How to Delight Your Customers. J. Prod. Brand Manag. 1996, 5, 6–18. [Google Scholar] [CrossRef]
  22. Jang, H.-Y.; Song, H.; Park, Y.-T. Determining the Importance Values of Quality Attributes Using ASC. J. Korean Soc. Qual. Manag. 2012, 40, 589–598. [Google Scholar] [CrossRef]
  23. Cieśla, M. Perceived Importance and Quality Attributes of Automated Parcel Locker Services in Urban Areas. Smart Cities 2023, 6, 2661–2679. [Google Scholar] [CrossRef]
  24. Gorgij, A.D.; Kisi, O.; Moghaddam, A.A.; Taghipour, A. Groundwater Quality Ranking for Drinking Purposes, Using the Entropy Method and the Spatial Autocorrelation Index. Environ. Earth Sci. 2017, 76, 269. [Google Scholar] [CrossRef]
  25. Zhu, Y.; Tian, D.; Yan, F. Effectiveness of Entropy Weight Method in Decision-Making. Math. Probl. Eng. 2020, 2020, 3564835. [Google Scholar] [CrossRef]
  26. Zameer, H.; Yasmeen, H.; Wang, R.; Tao, J.; Malik, M.N. An Empirical Investigation of the Coordinated Development of Natural Resources, Financial Development and Ecological Efficiency in China. Resour. Policy 2020, 65, 101580. [Google Scholar] [CrossRef]
  27. Van Zolingen, S.J.; Klaassen, C.A. Selection Processes in a Delphi Study about Key Qualifications in Senior Secondary Vocational Education. Technol. Forecast. Soc. Chang. 2003, 70, 317–340. [Google Scholar] [CrossRef]
  28. Nasrollahi, S.; Kazemi, A.; Jahangir, M.-H.; Aryaee, S. Selecting Suitable Wave Energy Technology for Sustainable Development, an MCDM Approach. Renew. Energy 2023, 202, 756–772. [Google Scholar] [CrossRef]
  29. Habibi, A.; Jahantigh, F.F.; Sarafrazi, A. Fuzzy Delphi Technique for Forecasting and Screening Items. Asian J. Res. Bus. Econ. Manag. 2015, 5, 130. [Google Scholar] [CrossRef]
  30. Lee, Y.-C.; Leite, F.; Lieberknecht, K. Prioritizing Selection Criteria of Distributed Circular Water Systems: A Fuzzy Based Multi-Criteria Decision-Making Approach. J. Clean. Prod. 2023, 417, 138073. [Google Scholar] [CrossRef]
  31. Hsu, D.W.L.; Shen, Y.-C.; Yuan, B.J.C.; Chou, C.J. Toward Successful Commercialization of University Technology: Performance Drivers of University Technology Transfer in Taiwan. Technol. Forecast. Soc. Chang. 2015, 92, 25–39. [Google Scholar] [CrossRef]
  32. Xiang, Z.-R.; Zhi, J.-Y.; Dong, S.-Y.; Li, R.; He, S.-J. The Impacts of Ergonomics/Human Factors of Wheelchair/User Combinations on Effective Barrier-Free Environments Design: A Case Study of the Chinese Universal Rail Coach Layout. Int. J. Ind. Ergon. 2018, 67, 229–241. [Google Scholar] [CrossRef]
  33. Chandler, E.; Worsfold, J. Understanding the Requirements of Geographical Data for Blind and Partially Sighted People to Make Journeys More Independently. Appl. Ergon. 2013, 44, 919–928. [Google Scholar] [CrossRef] [PubMed]
  34. Herrera-Saray, P.; Peláez-Ballestas, I.; Ramos-Lira, L.; Sánchez-Monroy, D.; Burgos-Vargas, R. Problemas con el uso de sillas de ruedas y otras ayudas técnicas y barreras sociales a las que se enfrentan las personas que las utilizan. Estudio cualitativo desde la perspectiva de la ergonomía en personas discapacitadas por enfermedades reumáticas y otras condiciones. Reumatol. Clín. 2013, 9, 24–30. [Google Scholar] [CrossRef]
  35. Almada, J.F.; Renner, J.S. Public Transport Accessibility for Wheelchair Users: A Perspective from Macro-Ergonomic Design. Work 2015, 50, 531–541. [Google Scholar] [CrossRef] [PubMed]
  36. Henje, C.; Stenberg, G.; Lundälv, J.; Carlsson, A. Obstacles and Risks in the Traffic Environment for Users of Powered Wheelchairs in Sweden. Accid. Anal. Prev. 2021, 159, 106259. [Google Scholar] [CrossRef] [PubMed]
Figure 1. Distribution of barrier-free facility types in Huayuan Subdistrict.
Sustainability 16 07035 g001
Figure 2. Four typical wheelchair ramps in Huayuan Subdistrict.
Sustainability 16 07035 g002
Figure 3. Demand classification results based on the Kano model.
Sustainability 16 07035 g003
Figure 4. Better–Worse coefficients for different groups.
Sustainability 16 07035 g004
Figure 5. Urban barrier-free environment system.
Sustainability 16 07035 g005
Table 1. Triangular fuzzy numbers equivalent to linguistic terms.
No.Linguistics TermsFuzzy Linguistic ScaleTriangular Fuzzy Number
1very satisfied 9 ¯ (7,9,9)
2satisfied 7 ¯ (5,7,9)
3neutral 5 ¯ (3,5,7)
4unsatisfied 3 ¯ (1,3,5)
5very unsatisfied 1 ¯ (1,1,3)
Table 2. Accessibility demands in urban residential communities.
CategoryIDAccessibility Demands
accessibility facilities usageFU1ensuring unobstructed passage
FU2facilities conforming to human scale
FU3adequate space for using assistive devices or receiving assistance
FU4easy to use and operate
FU5low physical effort required
FU6sense of security
FU7inclusivity
FU8comfort
accessibility environment safetyES1facilities usage without causing accidental injuries
ES2avoidance of long or complex detours
ES3high accessibility
ES4ensuring clear visibility
accessibility information acquisitionIA1recognizable and understandable signs
IA2multisensory information access
IA3easy recognition of accessible environments
accessibility serviceSE1provision of assistance or companion services
SE2providing opportunities for participation in activities
SE3providing opportunities for neighborhood interaction
Table 3. Demand priority calculation results.
CategoryIDCSCIMPDP
0FU10.24660.45380.7004
0FU20.19670.33190.5285
0FU30.22750.25510.4826
0FU40.20740.35140.5588
0FU50.21370.32330.5371
0FU60.21580.36360.5793
0FU70.13520.22950.3647
0FU80.15620.25260.4089
0ES10.24790.46110.7090
0ES20.22820.34410.5723
0ES30.15840.30870.4671
0ES40.20150.24780.4492
0IA10.15160.30260.4542
0IA20.12400.20630.3303
0IA30.19820.25140.4496
0SE10.20650.23190.4384
0SE20.17410.12710.3012
0SE30.14790.09660.2445
1FU10.24190.37270.6146
1FU20.20710.27370.4807
1FU30.22740.25800.4854
1FU40.19130.30150.4928
1FU50.21200.25110.4631
1FU60.22300.33450.5575
1FU70.15260.22850.3811
1FU80.16670.26500.4317
1ES10.22920.39360.6227
1ES20.21340.28580.4993
1ES30.15260.25450.4071
1ES40.18020.25630.4364
1IA10.17840.30840.4869
1IA20.14480.19550.3403
1IA30.17670.25980.4365
1SE10.18660.20240.3890
1SE20.13450.15900.2935
1SE30.15270.12600.2787
2FU10.24070.64210.8828
2FU20.20120.46190.6631
2FU30.13760.03380.1714
2FU40.17090.48440.6553
2FU50.18150.43930.6208
2FU60.19160.40550.5972
2FU70.14070.29290.4336
2FU80.10660.20280.3094
2ES10.27690.58580.8627
2ES20.23590.48440.7203
2ES30.17890.48440.6633
2ES40.14540.15770.3031
2IA10.12550.30420.4297
2IA20.11250.07890.1914
2IA30.09850.23660.3351
2SE10.14760.19150.3391
2SE20.10770.00000.1077
2SE30.08320.03380.1170
3FU10.24310.64130.8844
3FU20.17540.38460.5600
3FU30.16340.19790.3614
3FU40.27860.50130.7799
3FU50.15330.45460.6079
3FU60.16390.29130.4552
3FU70.11700.08130.1983
3FU80.13370.15130.2850
3ES10.26830.61800.8863
3ES20.23170.47800.7097
3ES30.26830.40800.6762
3ES40.17890.03460.2135
3IA10.14580.22130.3670
3IA20.13370.26800.4017
3IA30.14580.12790.2737
3SE10.14580.15130.2970
3SE20.14580.08130.2270
3SE30.11700.01130.1283
4FU10.26040.66470.9250
4FU20.24310.50130.7444
4FU30.26830.50130.7696
4FU40.27860.47800.7566
4FU50.26040.52460.7850
4FU60.20120.40800.6092
4FU70.11200.24460.3566
4FU80.10710.36130.4684
4ES10.27570.61800.8937
4ES20.25710.47800.7351
4ES30.27860.31460.5932
4ES40.14830.38460.5330
4IA10.17410.33800.5120
4IA20.11200.33800.4499
4IA30.16800.22130.3892
4SE10.16070.45460.6153
4SE20.11200.08130.1932
4SE30.11200.03460.1466
5FU10.23850.61440.8529
5FU20.24310.48870.7319
5FU30.26830.23740.5057
5FU40.26830.43850.7068
5FU50.33020.58930.9195
5FU60.24310.51390.7570
5FU70.22700.21230.4393
5FU80.21780.16200.3799
5ES10.28500.66470.9497
5ES20.29270.43850.7311
5ES30.27860.43850.7171
5ES40.05510.31280.3679
5IA10.06730.28770.3550
5IA20.05510.41330.4684
5IA30.07010.26260.3327
5SE10.14000.38820.5283
5SE20.08170.08670.1683
5SE30.16340.01130.1746
6FU10.31300.66470.9776
6FU20.29270.53400.8266
6FU30.33530.59930.9347
6FU40.33530.40330.7386
6FU50.20120.53400.7352
6FU60.25710.63200.8891
6FU70.11740.27260.3900
6FU80.01490.27260.2875
6ES10.27860.66470.9432
6ES20.29270.53400.8266
6ES30.29270.50130.7940
6ES40.20120.37060.5718
6IA10.26830.27260.5409
6IA20.16390.24000.4039
6IA30.23170.33800.5697
6SE10.14530.50130.6466
6SE20.03350.07660.1101
6SE30.00000.04390.0439
Note: 0 = all behavioral states, 1 = normal walking, 2 = weight-bearing walking, 3 = single hand occupied, 4 = both hands occupied, 5 = single leg occupied, 6 = both legs occupied.
Table 4. Evaluation results of the facilities’ fulfillment of requirements.
IDFacility AFacility BFacility CFacility D
FU10.78970.87180.80770.7769
FU20.70260.81030.71280.6615
FU30.54620.78460.63590.6000
FU40.58720.79230.62820.6256
FU50.63080.83080.53850.6462
FU60.37180.77690.63080.6359
FU70.61280.78210.67950.6487
FU80.56410.73080.60260.5769
ES10.35130.74360.61280.5718
ES20.51030.87950.53850.7410
ES30.67180.87950.69740.7718
ES40.78460.84360.71540.7769
IA10.43850.81790.66920.7077
IA20.45640.85640.70000.7667
IA30.47180.68720.58460.6205
SE10.62560.64620.58210.5410
SE20.68720.58210.56150.5718
SE30.52820.67690.58460.6077
Table 5. Quantitative results of human factor performance.
FacilityIDNormal WalkingWeight-Bearing WalkingSingle
Hand Occupied
Both
Hands Occupied
Single Leg OccupiedBoth Legs OccupiedAll Users
AFU10.17−0.09−0.09−0.13−0.06−0.190.13
FU20.220.040.14−0.04−0.03−0.120.20
FU30.060.370.18−0.220.04−0.390.06
FU40.09−0.07−0.19−0.17−0.12−0.160.05
FU50.170.010.03−0.15−0.29−0.100.13
FU6−0.19−0.22−0.08−0.24−0.38−0.52−0.18
FU70.230.180.410.260.170.220.25
FU80.130.250.280.100.180.280.15
ES1−0.27−0.51−0.53−0.54−0.60−0.59−0.32
ES20.01−0.21−0.20−0.23−0.22−0.32−0.03
ES30.260.01−0.010.07−0.05−0.120.22
ES40.350.480.570.250.420.210.37
IA1−0.050.010.07−0.070.09−0.11−0.04
IA20.110.260.050.01−0.010.050.10
IA30.030.140.200.080.14−0.100.05
SE10.230.290.330.010.10−0.020.23
SE20.390.580.460.490.520.580.40
SE30.250.410.400.380.350.480.27
BFU10.26−0.01−0.01−0.050.02−0.110.11
FU20.330.150.250.070.08−0.020.23
FU30.300.610.420.010.27−0.150.26
FU40.300.140.010.030.080.050.18
FU50.370.210.230.05−0.090.100.26
FU60.220.180.320.170.02−0.110.18
FU70.400.350.580.430.340.390.43
FU80.300.420.440.260.350.450.36
ES10.12−0.12−0.14−0.15−0.20−0.20−0.02
ES20.380.160.170.140.150.050.26
ES30.470.220.200.280.160.080.33
ES40.410.540.630.310.480.270.44
IA10.330.390.450.310.470.270.35
IA20.510.660.450.410.390.450.49
IA30.250.350.410.300.360.120.28
SE10.250.310.350.030.120.000.23
SE20.290.470.350.390.410.470.34
SE30.400.560.550.530.500.630.48
CFU10.19−0.07−0.07−0.12−0.04−0.170.07
FU20.230.050.15−0.03−0.02−0.110.13
FU30.150.460.27−0.130.13−0.300.07
FU40.13−0.02−0.15−0.13−0.08−0.110.04
FU50.07−0.08−0.07−0.25−0.38−0.19−0.04
FU60.070.030.180.02−0.13−0.260.02
FU70.300.250.480.320.240.290.31
FU80.170.290.320.140.220.320.20
ES1−0.01−0.25−0.27−0.28−0.34−0.33−0.12
ES20.04−0.18−0.17−0.20−0.19−0.29−0.06
ES30.290.040.020.10−0.02−0.100.18
ES40.280.410.500.180.350.140.27
IA10.180.240.300.160.320.120.19
IA20.360.510.300.250.240.290.33
IA30.150.250.310.190.250.010.16
SE10.190.240.28−0.030.06−0.060.13
SE20.270.450.330.370.390.450.32
SE30.300.470.450.440.410.540.37
DFU10.16−0.10−0.11−0.15−0.07−0.20−0.04
FU20.180.000.10−0.08−0.07−0.170.06
FU30.110.430.24−0.170.09−0.340.31
FU40.13−0.03−0.16−0.13−0.08−0.12−0.02
FU50.180.030.04−0.14−0.27−0.090.07
FU60.080.040.180.03−0.12−0.250.08
FU70.270.220.450.290.210.260.28
FU80.140.270.290.110.190.290.24
ES1−0.05−0.29−0.31−0.32−0.38−0.37−0.24
ES20.240.020.030.010.01−0.090.07
ES30.360.110.090.170.05−0.020.17
ES40.340.470.560.250.410.200.46
IA10.220.280.340.200.360.160.28
IA20.430.570.370.320.300.360.49
IA30.180.290.340.230.290.050.28
SE10.150.200.24−0.070.01−0.100.20
SE20.280.460.340.380.400.460.39
SE30.330.490.480.460.430.560.45
Disclaimer/Publisher’s Note: The statements, opinions and data contained in all publications are solely those of the individual author(s) and contributor(s) and not of MDPI and/or the editor(s). MDPI and/or the editor(s) disclaim responsibility for any injury to people or property resulting from any ideas, methods, instructions or products referred to in the content.

